a size never before amassed, using - Leesman · PDF fileThis is an analysis of a dataset of a...
24
Organisations are not getting what they should from their corporate workplaces. This is the finding from research across 250,000+ employees in 2,000+ workplaces. This report unearths five key factors influencing workplace performance and arms leadership teams with key insights to reclaim this lost value. Productivity The key factors influencing employee sense of productivity 1 Novelty Uncovering that new is no guarantee of high performance 3 Millennials Moving the diversionary debates from millennials to mid-termers 2 Open-plan The data proving demonising open-plan is risky and wrong 4 Behaviours How matching work behaviours to infrastructure is critical 5
Transcript of a size never before amassed, using - Leesman · PDF fileThis is an analysis of a dataset of a...

Organisations are not getting what they should from their corporate workplaces. This is the finding from research across 250,000+ employees in 2,000+ workplaces. This report unearths five key factors influencing workplace performance and arms leadership teams with key insights to reclaim this lost value.
Productivity The key factors influencing employee sense of productivity
1Novelty Uncovering that new is no guarantee of high performance
3MillennialsMoving the diversionary debates from millennials to mid-termers
2Open-plan The data proving demonising open-plan is risky and wrong
4BehavioursHow matching work behaviours to infrastructure is critical
5
This is an analysis of a dataset of a size never before amassed, using a single product, based on a simple proposition: is your workplace working? The results are arming organisations with a detailed understanding of how workplaces impact employee experience, whilst fuelling a central benchmark database, the statistical robustness, research richness and diversity of which is unparalleled globally.
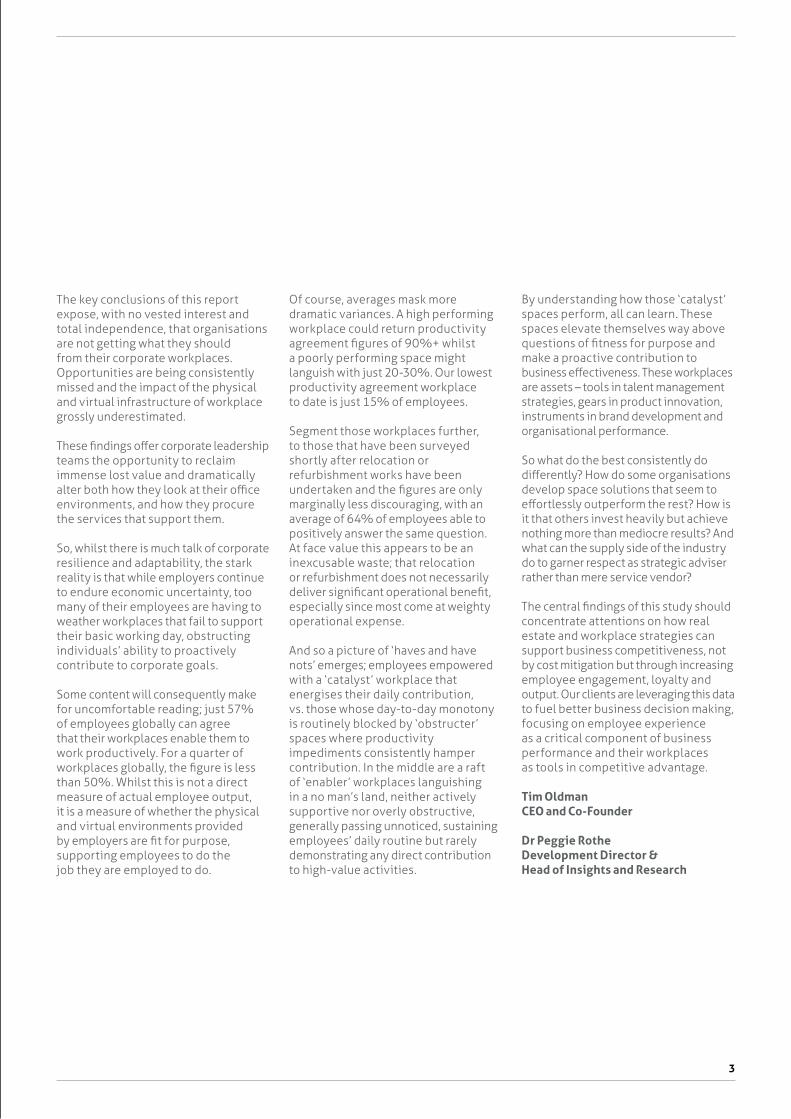
The key conclusions of this report expose, with no vested interest and total independence, that organisations are not getting what they should from their corporate workplaces. Opportunities are being consistently missed and the impact of the physical and virtual infrastructure of workplace grossly underestimated.
These findings offer corporate leadership teams the opportunity to reclaim immense lost value and dramatically alter both how they look at their office environments, and how they procure the services that support them.
So, whilst there is much talk of corporate resilience and adaptability, the stark reality is that while employers continue to endure economic uncertainty, too many of their employees are having to weather workplaces that fail to support their basic working day, obstructing individuals’ ability to proactively contribute to corporate goals.
Some content will consequently make for uncomfortable reading; just 57% of employees globally can agree that their workplaces enable them to work productively. For a quarter of workplaces globally, the figure is less than 50%. Whilst this is not a direct measure of actual employee output, it is a measure of whether the physical and virtual environments provided by employers are fit for purpose, supporting employees to do the job they are employed to do.
Of course, averages mask more dramatic variances. A high performing workplace could return productivity agreement figures of 90%+ whilst a poorly performing space might languish with just 20-30%. Our lowest productivity agreement workplace to date is just 15% of employees.
Segment those workplaces further, to those that have been surveyed shortly after relocation or refurbishment works have been undertaken and the figures are only marginally less discouraging, with an average of 64% of employees able to positively answer the same question. At face value this appears to be an inexcusable waste; that relocation or refurbishment does not necessarily deliver significant operational benefit, especially since most come at weighty operational expense.
And so a picture of ‘haves and have nots’ emerges; employees empowered with a ‘catalyst’ workplace that energises their daily contribution, vs. those whose day-to-day monotony is routinely blocked by ‘obstructer’ spaces where productivity impediments consistently hamper contribution. In the middle are a raft of ‘enabler’ workplaces languishing in a no man’s land, neither actively supportive nor overly obstructive, generally passing unnoticed, sustaining employees’ daily routine but rarely demonstrating any direct contribution to high-value activities.
By understanding how those ‘catalyst’ spaces perform, all can learn. These spaces elevate themselves way above questions of fitness for purpose and make a proactive contribution to business effectiveness. These workplaces are assets – tools in talent management strategies, gears in product innovation, instruments in brand development and organisational performance.
So what do the best consistently do differently? How do some organisations develop space solutions that seem to effortlessly outperform the rest? How is it that others invest heavily but achieve nothing more than mediocre results? And what can the supply side of the industry do to garner respect as strategic adviser rather than mere service vendor?
The central findings of this study should concentrate attentions on how real estate and workplace strategies can support business competitiveness, not by cost mitigation but through increasing employee engagement, loyalty and output. Our clients are leveraging this data to fuel better business decision making, focusing on employee experience as a critical component of business performance and their workplaces as tools in competitive advantage.
Tim OldmanCEO and Co-Founder
Dr Peggie RotheDevelopment Director & Head of Insights and Research
3
276,422
UK & Ireland
Nordics
Rest of Europe
North America & Canada
APAC
Rest of World
Under 25 4.4%
25-34 27.7%
35-44 30.8%
45-54 25.4%
55+ 11.8%
June 2013 | 36,607 June 2015 | 102,815
27.9%
23.5%
23.3%
11.7%
9.6%
3.9%
employee responses
Geographies
Age
Gender
IndustryRespondent Lmi
Num
ber o
f res
pond
ents
Database growth – number of employee responses
June 2014 | 64,062
+27,455 +38,753
June 2016 | 169,838
+67,023
Total number of responses at 30th June 2017 | 276,422
+106,584
Avia
tion
, aer
ospa
ce &
def
ence
Con
stru
ctio
n &
civ
il en
gine
erin
g
Food
& b
ever
age
Uti
litie
s, o
il &
ene
rgy
Gov
ernm
ent a
dmin
istr
atio
n
Tele
com
mun
icat
ions
Tran
spor
tati
on, r
ailr
oad
& tr
ucki
ng
Reta
il
Info
rmat
ion
tech
, sof
twar
e &
inte
rnet
Man
ufac
turi
ng &
indu
stri
al e
ngin
eeri
ng
Insu
ranc
e se
rvic
es
Hea
lth,
wel
lnes
s, h
ospi
tals
& h
ealt
hcar
e
Ban
king
, inv
estm
ent &
fina
ncia
l ser
vice
s
Com
bine
d ot
her
43%
56%
90-100
80-89.9
70-79.9
60-69.9
50-59.9
40-49.9
30-39.9
20-29.9
10-19.9
0-9.9
60k
50k
40k
30k
20k
10k
00 60k30k
Number of respondents
3.2% 3.6% 3.6% 3.9% 4.6% 4.7% 5.3% 5.5% 5.5% 6.1% 10.3% 11.3% 14.1% 18.3%
Leesman LmiEffectiveness Score
0-100
Service features
Physical features
Mobility
== +
Workplace impact
Work activities
67 countries33 languages
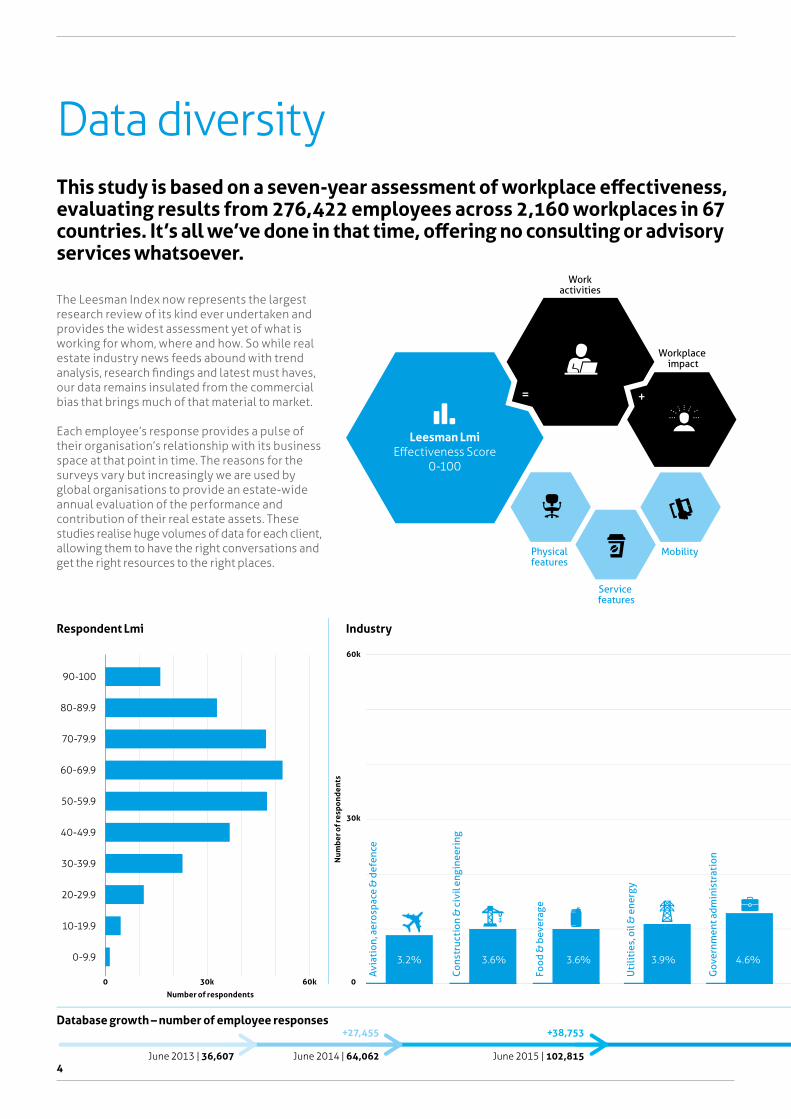
Data diversity
The Leesman Index now represents the largest research review of its kind ever undertaken and provides the widest assessment yet of what is working for whom, where and how. So while real estate industry news feeds abound with trend analysis, research findings and latest must haves, our data remains insulated from the commercial bias that brings much of that material to market.
Each employee’s response provides a pulse of their organisation’s relationship with its business space at that point in time. The reasons for the surveys vary but increasingly we are used by global organisations to provide an estate-wide annual evaluation of the performance and contribution of their real estate assets. These studies realise huge volumes of data for each client, allowing them to have the right conversations and get the right resources to the right places.
4
This study is based on a seven-year assessment of workplace effectiveness, evaluating results from 276,422 employees across 2,160 workplaces in 67 countries. It’s all we’ve done in that time, offering no consulting or advisory services whatsoever.
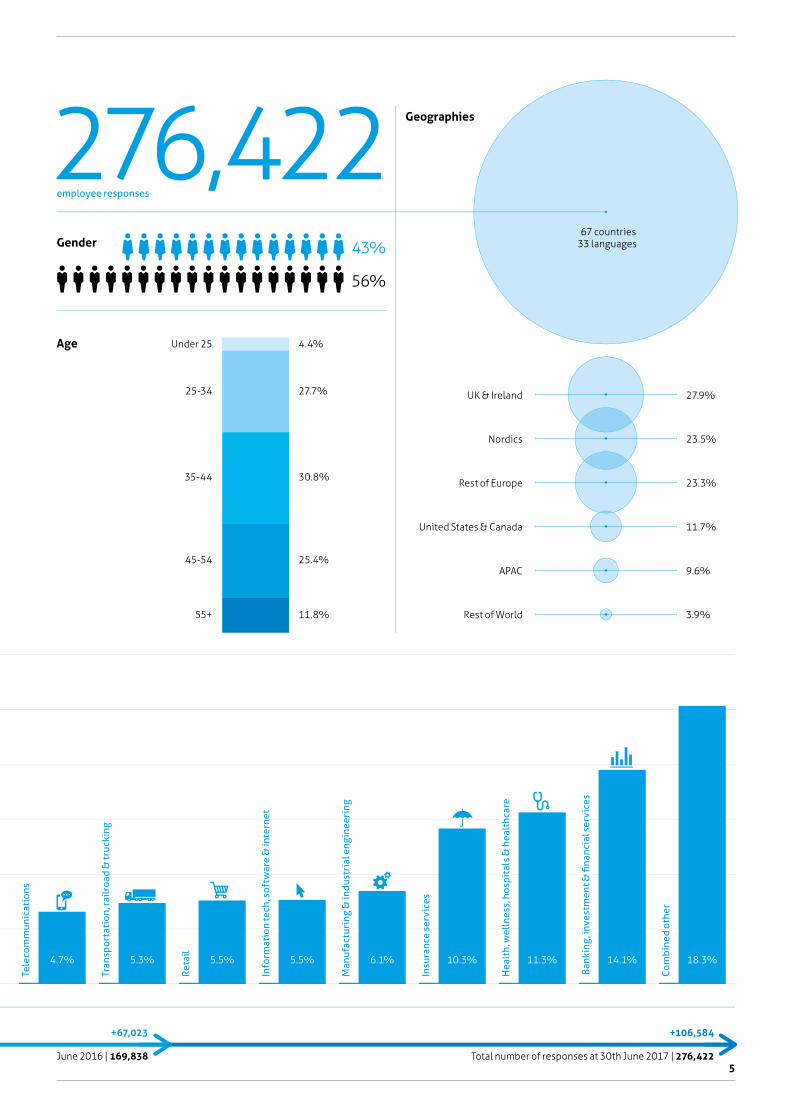
276,422
UK & Ireland
Nordics
Rest of Europe
United States & Canada
APAC
Rest of World
Under 25 4.4%
25-34 27.7%
35-44 30.8%
45-54 25.4%
55+ 11.8%
June 2013 | 36,607 June 2015 | 102,815
27.9%
23.5%
23.3%
11.7%
9.6%
3.9%
employee responses
Geographies
Age
Gender
IndustryRespondent Lmi
Num
ber o
f res
pond
ents
Database growth – number of employee responses
June 2014 | 64,062
+27,455 +38,753
June 2016 | 169,838
+67,023
Total number of responses at 30th June 2017 | 276,422
+106,584
Avia
tion
, aer
ospa
ce &
def
ence
Con
stru
ctio
n &
civ
il en
gine
erin
g
Food
& b
ever
age
Uti
litie
s, o
il &
ene
rgy
Gov
ernm
ent a
dmin
istr
atio
n
Tele
com
mun
icat
ions
Tran
spor
tati
on, r
ailr
oad
& tr
ucki
ng
Reta
il
Info
rmat
ion
tech
, sof
twar
e &
inte
rnet
Man
ufac
turi
ng &
indu
stri
al e
ngin
eeri
ng
Insu
ranc
e se
rvic
es
Hea
lth,
wel
lnes
s, h
ospi
tals
& h
ealt
hcar
e
Ban
king
, inv
estm
ent &
fina
ncia
l ser
vice
s
Com
bine
d ot
her
43%
56%
90-100
80-89.9
70-79.9
60-69.9
50-59.9
40-49.9
30-39.9
20-29.9
10-19.9
0-9.9
60k
50k
40k
30k
20k
10k
00 60k30k
Number of respondents
3.2% 3.6% 3.6% 3.9% 4.6% 4.7% 5.3% 5.5% 5.5% 6.1% 10.3% 11.3% 14.1% 18.3%
Leesman LmiEffectiveness Score
0-100
Service features
Physical features
Mobility
== +
Workplace impact
Work activities
67 countries33 languages
5

Five factors of performance
1 Profiling productivityOne in four workplaces globally are failing to support employees’ sense of personal productivity. This, where less than half of the respondent employees can say their workplace supports them, is typical of a raft of neglected spaces that undermine corporate values. They are routinely presenting obstacles and barriers to daily work that impact onwards to sense of pride and community. These ‘obstructer’ workplaces are failing employees and employer alike.
So, what are leading organisations doing differently? How do their ‘catalyst’ workplaces consistently deliver outstanding pride and productivity agreement figures and what can be learnt from them?
Our evidence increasingly points to perception of personal productivity being most closely linked to an employee’s individual and concentrative activities. So, spaces new or old that disregard this part of an employees’ workflow risk the knock-on impact of undermining the perception of all work.
P8
There are multiple factors that determine how well a workplace supports the employees who use it. But when the opinions of 276,422 employees are reviewed as a whole, a series of narratives surface that we believe all organisations involved in the commissioning, design, delivery or management of workplace environments need to understand. Conclusions are drawn based on various methods of statistical analysis, including comparative studies between specific data sub-groups, for example against our Leesman+ group of the world’s most effective workplaces. Five of these themes are presented here and should provide employers and their service providers a series of important warning flags and signposts. We also hope they will create an appetite for further debate and investigation.
2 Demographic diversions Focusing and responding singularly to the apparent ‘challenges’ presented by the tidal wave of digital natives flooding into the workplace is misguided. Those aged under 25 represent just 4.4% of the workplace population across those spaces we have assessed and repeatedly show themselves to have the simplest work profiles and thus the narrowest set of requirements.
Attention should instead be directed at those in the 35-44-year age band, who consistently record the lowest effectiveness scores, or those in the 45-54 band who have the most complex work activity patterns, so place the highest demands on the infrastructures provided for them. These employees, who collectively represent some 56.2% of the workplace population we have surveyed, therefore present the greatest opportunity and the highest risk.
Our evidence shows that employers should focus on understanding the complexities of an employee’s role within the organisation, almost certainly based on the life and career stage and move away from misguided preoccupations with the year in which an employee was born.
P10
6

3 New is no guaranteeWith the vast capital sums invested in refurbishment and relocation fit-out projects, leadership teams should rightfully expect them to deliver significant operational benefit. But our evidence shows this not to be the case with just 34% of projects delivering high performance results.
The exact reasons for each scheme’s deficit results vary, but the lack of guaranteed operational benefit should act as a stark warning to corporate organisations embarking on a major workplace project.
The highest performing projects place the individual’s needs at the heart of the solution, in an employee-centric design that wraps an infrastructure around the employee, responsive to their daily needs. Where this brings significant change, then the role of change management must not be underestimated.
Client groups can do more to be better clients to their design teams and design teams should do more to draw their clients into partnering in the design process. Both should see workplace for what it is – a component of organisational performance – and attach the same process design rigour to it as they would other organisation wide projects, such as a major new technology implementation.
P12
4 De-demonising open-plan The majority - 58% - of employees in our database work at an allocated open-plan desk or cubicle. In many instances, these are part of workplace landscape that is collectively failing to provide those employees with an environment that adequately supports their daily efforts.
But the open-plan desk is just one ofthe many component parts in thoseworkplaces and although sensationalistjournalists, obsessed with the benefitsof private offices will doubtless ignorethe fact, nine out of ten of the highestperforming workplaces in our researchare either fully, or extensively open plan.
Our research shows that both open-plan and cellular solutions can be good and bad. So organisations need to fully comprehend the benefits and challenges both solutions offer. But across 2,160 workplaces, when measured against a number of our key indicators, employees in the highest performing locations will almost certainly be working in an open-plan setting. So, demonising open-plan is just factually incorrect.
P14
5 Managing mobilityThe work anywhere, anytime proposition has enticed organisations to review whether employees should be encouraged to more widely adopt a more nomadic approach to work.
For some, that has meant supporting or encouraging more remote working, but for others that has resulted in exploring a less territorial use of the corporate workplace, in some cases deploying an ‘activity based’ approach. This encourages employees to recognise and segment their work into distinct activities and seek spaces away from a designated desk to best support that part of their working day.
But based on our research across 11,366 employees in 40 ‘activity based’ workplaces, these strategies are often falling short of expectation, predominantly through a lack of adoption of the behaviours that maximise the benefits offered by the new surroundings. The question organisations need to ask themselves, is: are they the type of organisation that can reap direct benefit from this workstyle, and if so, how can they actively support employees in adopting the new behaviours necessary to realise value for employer and employee?
P16
7

1 ProfilingproductivityWorking environments impact what employees do, how they do it and how they feel. The direct impact the workplace has on personal productivity is immensely difficult to measure with any transferable consistency, but it is possible to get close. Our assessments do not directly measure actual productivity, but they do measure the extent to which employees perceive their workplaces support them to work productively. Across the 276,422 employees in our research database, 57% agree that their workplace enables them to work productively. 28% disagreeing and 15% sit neutrally between. A comparison of the two opposing groups – those who can and those who cannot say that their workplace enables them to work productively – provides clues to understanding whether there are factors that regularly exert greater influence over that answer.
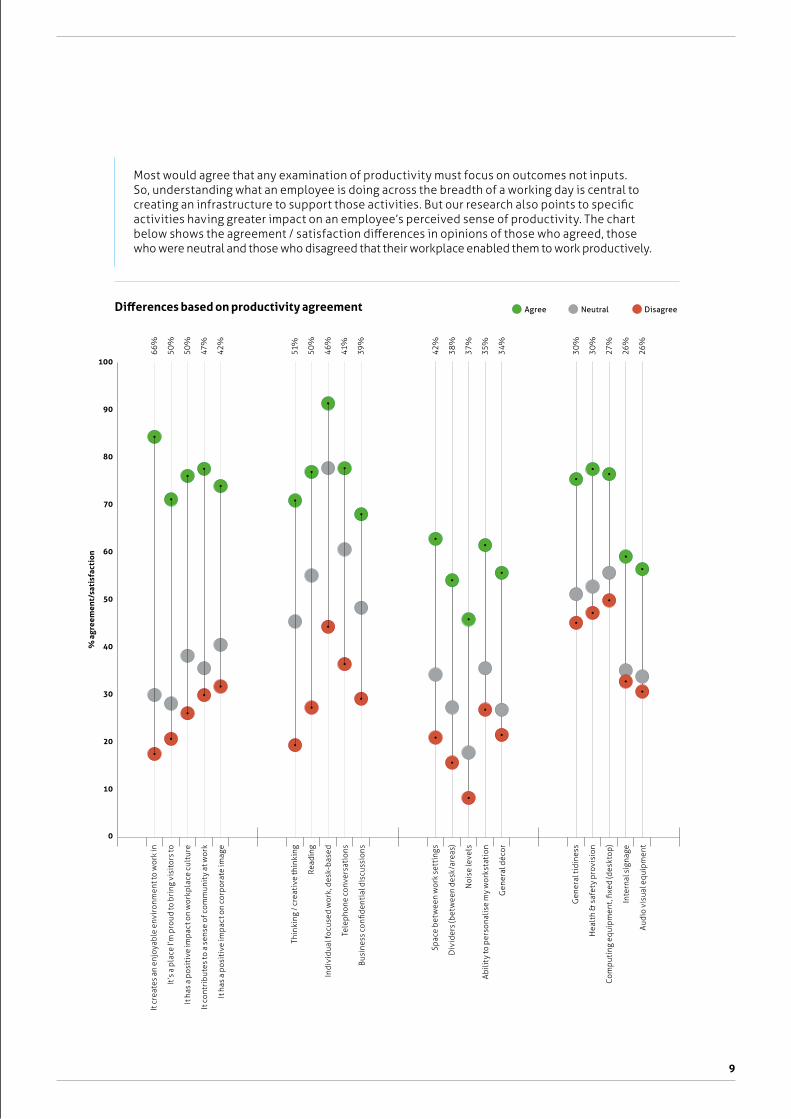
The greatest difference in support comes in work activities such as ‘Thinking/creative thinking’, ‘Reading’ and ‘Individual focused work, desk based’ all of which are focused activities. When looking at the physical and service features with the largest satisfaction differences, we find ‘Space between work settings’, ‘Dividers’ and ‘Noise levels’.
This suggests that employees’ perception of a workplace that supports personal productivity is impacted more by its ability to support individual work than collaborative work.
It would appear that some organisations may be investing a disproportionate amount of focus on supporting creativity and collaboration, at the expense of the spaces needed to commit these collaborative thoughts in an individual, concentrative way to paper. It could also be that for many employees in more concentrative analytic roles, the impact of key infrastructure elements and planning have been overlooked – like occupant density and noise control.
Clearly, that is not to say that the importance attached to collaboration should be downgraded. Far from it. But it does reaffirm that to create a high performing workplace, all phases and activities that underpin knowledge work need to be deeply understood and well provided for – both individual / concentrative and interactive / collaborative. But concentrative work activities would appear to be the ‘hygiene factor’ for all employees. Get these wrong and perception of personal productivity falls. Get the balance right and the picture is more positive.
8
My workplace enables me to work productively
27.6%Disagree
15.2%Neutral
57.3%Agree
1 Profilingproductivity
9
Most would agree that any examination of productivity must focus on outcomes not inputs. So, understanding what an employee is doing across the breadth of a working day is central to creating an infrastructure to support those activities. But our research also points to specific activities having greater impact on an employee’s perceived sense of productivity. The chart below shows the agreement / satisfaction differences in opinions of those who agreed, those who were neutral and those who disagreed that their workplace enabled them to work productively.
66%
50%
50%
47%
42%
51%
46%
50%
41%
39%
42%
37%
38%
35%
34%
30%
27%
30%
26%
26%
DisagreeAgree NeutralDifferences based on productivity agreement
50
10
60
20
70
30
80
40
90
100
0
It c
reat
es a
n en
joya
ble
env
iron
men
t to
wor
k in
It h
as a
pos
itiv
e im
pac
t on
wor
kpla
ce c
ultu
re
It’s
a p
lace
I’m
pro
ud to
bri
ng v
isit
ors
to
It c
ontr
ibut
es to
a s
ense
of c
omm
unit
y at
wor
k
It h
as a
pos
itiv
e im
pac
t on
corp
orat
e im
age
Thin
king
/ cr
eati
ve th
inki
ng
Indi
vidu
al fo
cuse
d w
ork,
des
k-b
ased
Read
ing
Tele
pho
ne c
onve
rsat
ions
Bus
ines
s co
nfide
ntia
l dis
cuss
ions
Spac
e b
etw
een
wor
k se
ttin
gs
Noi
se le
vels
Div
ider
s (b
etw
een
desk
/are
as)
Abi
lity
to p
erso
nalis
e m
y w
orks
tati
on
Gen
eral
déc
or
Gen
eral
tidi
ness
Com
put
ing
equi
pm
ent,
fixe
d (d
eskt
op)
Hea
lth
& s
afet
y p
rovi
sion
Inte
rnal
sig
nage
Aud
io v
isua
l equ
ipm
ent
% a
gree
men
t/sa
tisf
acti
on

Individual focused work, desk based
Planned meetings
Telephone conversations
Informal, un-planned meetings
Collaborating on focused work
Reading
Audio conferences
Relaxing / taking a break
Thinking / creative thinking
Informal social interaction
Business confidential discussions
Individual routine tasks
Learning from others
Private conversations
Collaborating on creative work
Hosting visitors, clients or customers
Larger group meetings or audiences
Video conferences
Spreading out paper or materials
Individual focused work away from your desk
Using technical/specialist equipment or materials
92.9%
78.8%
75.7%
65.5%
59.4%
52.5%
52.1%
50.2%
48.6%
47.7%
47.1%
47.1%
43.3%
43.3%
42.6%
41.0%
38.2%
37.3%
36.4%
34.7%
23.8%
74.6%
77.2%
62.3%
60.7%
70.1%
56.0%
67.3%
58.3%
47.9%
72.4%
51.5%
86.5%
74.3%
45.9%
60.8%
61.3%
59.6%
57.2%
59.1%
63.1%
63.9%
Lmi 60.1Lmi 60.4
Lmi 61.9Lmi 61.6
Lmi 67.9
50% 60%
Support
Importance Support
70% 80%
Gender distribution and Lmi Lmi 60.9
Lmi 61.8Prefer not to say | Lmi 53.5
2 Demographic diversionsNo one area of trade media discussion generates more column inches than the apparent impossible challenges faced by organisations preparing for the millennial workplace invasion. Organisations have been panicked with claims that not understanding the needs of this segment of the workforce will curse organisational performance. The fact is, work has changed for everyone – regardless of age or generation. So, are the millennials really that different and difficult to please? Across our database, the youngest employees report the highest Leesman Lmi scores, so clearly not. Further examination does yield important differences between younger employees and their peers, but not where ‘millennial myth marketing’ would have you look. Our data shows that the youngest age group are in fact the workplace population with lowest work complexity. On average, those under 25 select 8.9 activities to be important to them (out of 21 possible), compared to 11.1 among those aged 45-54.
Designing for the youngest in our organisations also means designing for the smallest group of your workforce. Those under the age of 25 represent just 4.4% of the workplace population across those spaces we have assessed, so focusing
efforts entirely on this group dramatically risks implementing misguided solutions for the remaining 95.6%.
This also risks overlooking the needs of those aged 35-44 who consistently record the lowest workplace effectiveness (Leesman Lmi) scores, those aged 45-54 who show the highest work complexity, or those in the upper age ranges, where age related needs (natural and artificial lighting etc.) progressively increase in importance.
Data shows those employees with the highest activity complexity have the most multifaceted workplace infrastructure needs. This is also the group that benefits the most from environments that provide a variety of work settings that support that work complexity. This is the group where attention should be focused and their needs better understood.
10
Age distribution and Lmi
4.4%
27.7%
30.8%25.4%
11.8%
55 o
r ove
r
45
-54
35-4
4
25-3
4
unde
r 25
Individual focused work, desk based
Planned meetings
Telephone conversations
Informal, un-planned meetings
Collaborating on focused work
Reading
Audio conferences
Relaxing / taking a break
Thinking / creative thinking
Informal social interaction
Business confidential discussions
Individual routine tasks
Learning from others
Private conversations
Collaborating on creative work
Hosting visitors, clients or customers
Larger group meetings or audiences
Video conferences
Spreading out paper or materials
Individual focused work away from your desk
Using technical/specialist equipment or materials
92.9%
78.8%
75.7%
65.5%
59.4%
52.5%
52.1%
50.2%
48.6%
47.7%
47.1%
47.1%
43.3%
43.3%
42.6%
41.0%
38.2%
37.3%
36.4%
34.7%
23.8%
74.6%
77.2%
62.3%
60.7%
70.1%
56.0%
67.3%
58.3%
47.9%
72.4%
51.5%
86.5%
74.3%
45.9%
60.8%
61.3%
59.6%
57.2%
59.1%
63.1%
63.9%
Lmi 60.1Lmi 60.4
Lmi 61.9Lmi 61.6
Lmi 67.9
50% 60%
Support
Importance Support
70% 80%
Gender distribution and Lmi Lmi 60.9
Lmi 61.8Prefer not to say | Lmi 53.5
11
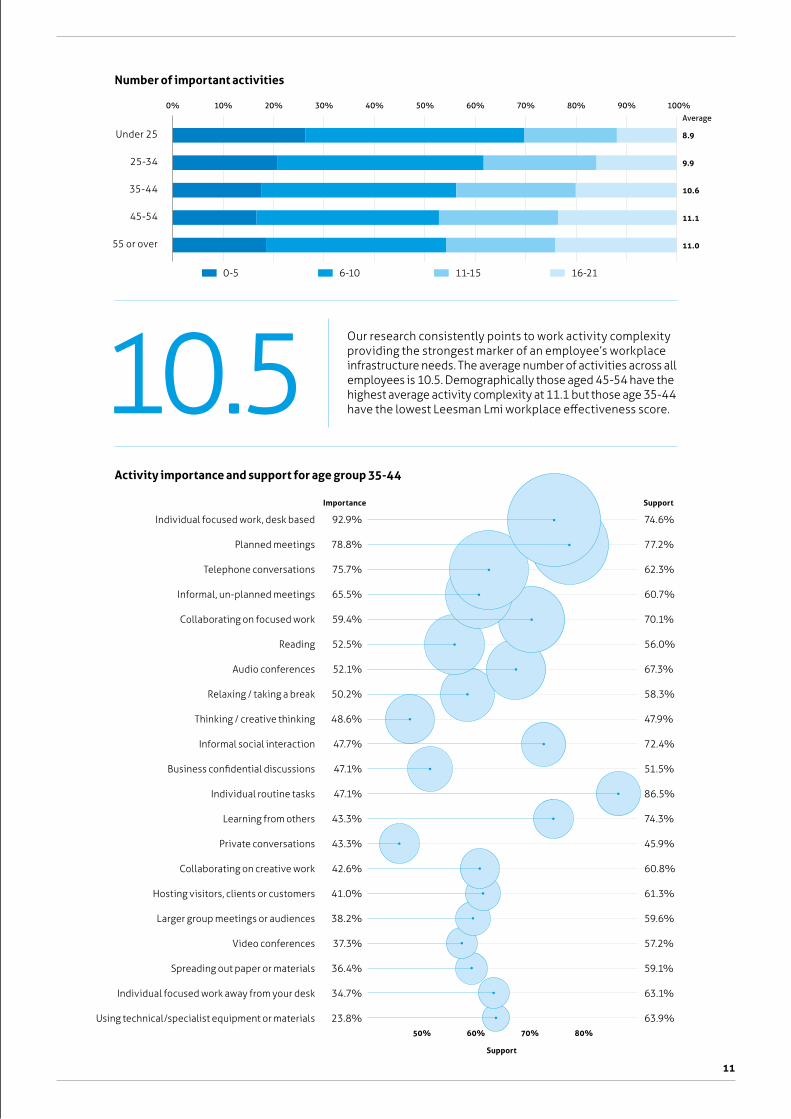
Number of important activities
Activity importance and support for age group 35-44
Our research consistently points to work activity complexity providing the strongest marker of an employee’s workplace infrastructure needs. The average number of activities across all employees is 10.5. Demographically those aged 45-54 have the highest average activity complexity at 11.1 but those age 35-44 have the lowest Leesman Lmi workplace effectiveness score.10.5
90%80%70%60%50%40%30%20%10% 100%
0-5 11-156-10 16-21
0%
Average
Under 25 8.9
25-34 9.9
35-44 10.6
45-54 11.1
55 or over 11.0

Distribution of respondents Number of respondents Distribution of workplaces
90
851,197
3%118%
6,56518%
3927%
19,78355%
Lmi 61.2
7552%
2014%
8,89124%
80
75
65
60
55
50
0 500 1,000 1,500 2,000
0
Lmi
70
50
10
60
20
70
30
80
40
90
100
0
It c
ontr
ibut
es to
a s
ense
of c
omm
unit
y at
wor
k
It c
reat
es a
n en
joya
ble
envi
ronm
ent t
o w
ork
in
It e
nab
les
me
tow
ork
pro
duc
tive
ly
It’s
a p
lace
I’m
pro
udto
bri
ng v
isit
ors
to
The
desi
gn o
f my
wor
kpla
ceis
impo
rtan
t to
me
% a
gree
men
t
3 New is no guaranteeIf we divide the database into three simplistic segments: those about to embark on workplace refurbishment or relocation, those having just completed refurbishment or relocation and the rest who sit somewhere between those two workplace lifecycle points, disturbing patterns emerge.
Across all ‘pre-occupancy’ spaces awaiting imminent works, on average 55.6% of employees agree that their workplace enables them to work productively. In the ‘post-occupancy’ new spaces, that figure increases to 64.5%. A worrying 47 out of 145 post-occupancy surveys of those spaces of more than 50 respondents deliver below average productivity agreement and just 50 achieve a Leesman Lmi of 70 or above.
Of course, the average masks the exceptional results of those organisations who have created outstanding workplace solutions, but it should act as a stark warning to those planning to embark on workplace change projects, that design and refurbishment do not automatically deliver operational benefit and return on investment.
Clients on these projects cannot afford to sub-contract their own responsibilities to professional teams and instead need to fully immerse themselves in developing a detailed understanding of what employees are doing, how they are working today and how that will be different in the new space.
Our research shows that ‘Noise levels’ is still one of the most common challenges even in those new workplaces, with an average satisfaction of 34% and nearly half of the workplaces not even reaching 30% satisfaction. And while new workplaces tend to deliver on ‘Accessibility of colleagues’, with an average satisfaction of 74% across the post-surveyed buildings and most workplaces above 60% satisfaction, we see bigger extremes on ‘Variety of different types of workspace’ with satisfaction scores ranging from less that 10% to above 95%.
Organisations operating at their fullest potential are those allowing their people to be their best at work. So, workplace needs to be seen clearly
12
Post-occupancy workplaces; Respondent distribution and Lmi
Post-occupancy workplaces

Distribution of respondents Number of respondents Distribution of workplaces
90
851,197
3%118%
6,56518%
3927%
19,78355%
Lmi 61.2
7552%
2014%
8,89124%
80
75
65
60
55
50
0 500 1,000 1,500 2,000
0
Lmi
70
50
10
60
20
70
30
80
40
90
100
0
It c
ontr
ibut
es to
a s
ense
of c
omm
unit
y at
wor
k
It c
reat
es a
n en
joya
ble
envi
ronm
ent t
o w
ork
in
It e
nab
les
me
tow
ork
pro
duc
tive
ly
It’s
a p
lace
I’m
pro
udto
bri
ng v
isit
ors
to
The
desi
gn o
f my
wor
kpla
ceis
impo
rtan
t to
me
% a
gree
men
t
13
as part of the operational infrastructure of work. Workplace design needs then to be recognised for its role in work processes, not merely as an exercise to develop a three-dimensional representation of the brand or as a conundrum to match headcount with lettable area. But designers need to better present the case for attention to be paid to these consistent deficits (noise, variety etc.).
In fairness to the workplace design industry, this may also point to cases of misguided underinvestment in change management. So, where a new space has been designed in response to leadership desire to facilitate a change in employees’ workstyle, how often have the necessary behavioural transformation programmes been implemented to allow employees and employer to manage the change?
1/3
Post-occupancy workplaces; Workplace impact agreement
One third of workplace projects achieve high performance
Post-occupancy workplaces Leesman+ average
100
90
80
70
60
50Lmi
40
30
20
10
00 10% 20% 30% 40% 50% 60% 70% 80% 90% 100%
Lmi 72.2
Lmi 62.9
Lmi 61.9
Lmi 61.8
Lmi 59.5
Lmi 59.2
A private office assigned solely to you
Other
A cubicle assigned solely to you
A workstation, assigned solely to you, in a shared office
A flexible/non-allocated setting
A workstation, assigned solely to you, in an open plan office area
48.5%
13.9%
9.1%
17.7%
1.5%
9.3%
4 De-demonising open plan It seems that journalists trapped in poorly designed open-plan offices, revel in feeding the public with alarmist headlines, one claiming that “Open-plan offices were devised by Satan in the deepest caverns of hell.” This, along with many others, are used to demonise the strategy and bemoan the demise of enclosed celluler boxes. But that does not mean the entire concept is flawed and that all open environments are evil strategies contrived to torture.
When research is conducted on poorly designed open-plan offices, you should expect to see statistical verification of this. But if all those respondents are from one or two organisations with poorly designed workplaces, it’s against all laws of statistics to generalise and conclude that open office is flawed as a concept. It’s not until you have looked at enough different open-plan offices, that you can actually make those kinds of claims.
14
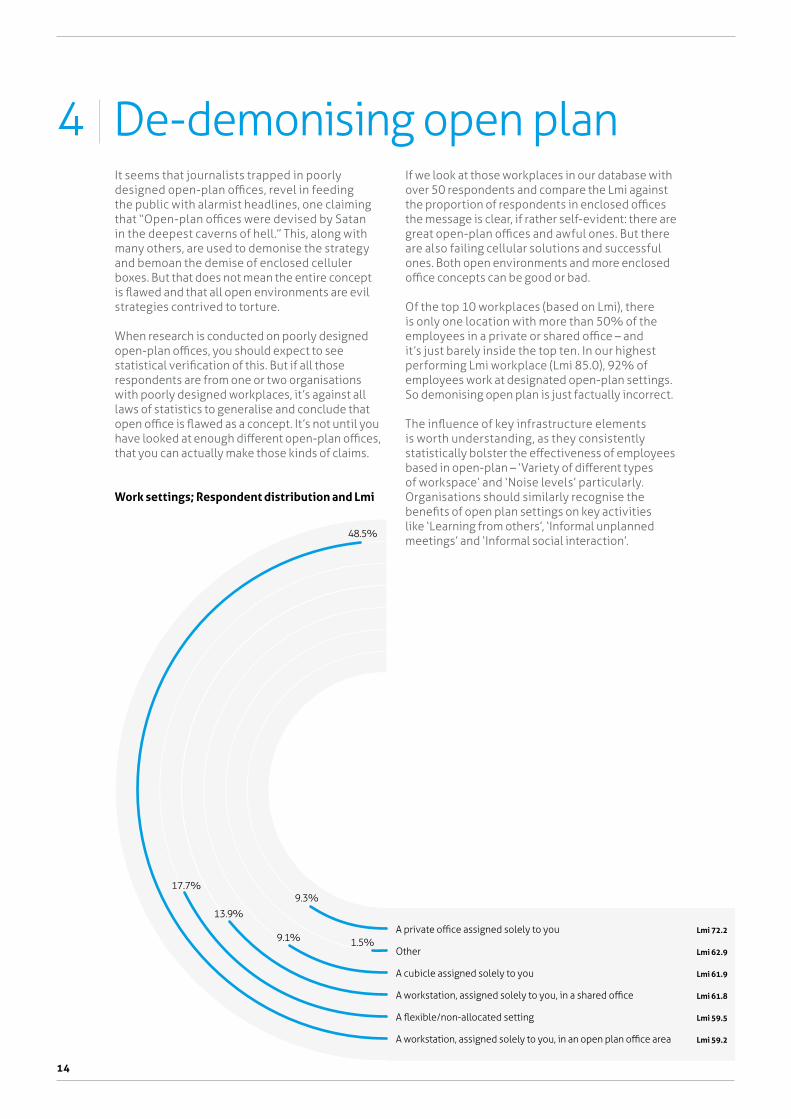
If we look at those workplaces in our database with over 50 respondents and compare the Lmi against the proportion of respondents in enclosed offices the message is clear, if rather self-evident: there are great open-plan offices and awful ones. But there are also failing cellular solutions and successful ones. Both open environments and more enclosed office concepts can be good or bad.
Of the top 10 workplaces (based on Lmi), there is only one location with more than 50% of the employees in a private or shared office – and it’s just barely inside the top ten. In our highest performing Lmi workplace (Lmi 85.0), 92% of employees work at designated open-plan settings. So demonising open plan is just factually incorrect.
The influence of key infrastructure elements is worth understanding, as they consistently statistically bolster the effectiveness of employees based in open-plan – ‘Variety of different types of workspace’ and ‘Noise levels’ particularly. Organisations should similarly recognise the benefits of open plan settings on key activities like ‘Learning from others’, ‘Informal unplanned meetings’ and ‘Informal social interaction’.
Work settings; Respondent distribution and Lmi

100
90
80
70
60
50Lmi
40
30
20
10
00 10% 20% 30% 40% 50% 60% 70% 80% 90% 100%
Lmi 72.2
Lmi 62.9
Lmi 61.9
Lmi 61.8
Lmi 59.5
Lmi 59.2
A private office assigned solely to you
Other
A cubicle assigned solely to you
A workstation, assigned solely to you, in a shared office
A flexible/non-allocated setting
A workstation, assigned solely to you, in an open plan office area
48.5%
13.9%
9.1%
17.7%
1.5%
9.3%
15
Workplaces with >50 respondents Top 10 Bottom 10
Proportion of employees in private or shared enclosed offices
Workplace effectiveness (Leesman Lmi) against proportion of employees in shared/private offices
It’s a place I’m proud to bring visitors to
It creates an enjoyable environment to work in
It enables me to work productively
Informal social interaction
Informal un-planned meetings
Learning from others
Collaborating of creative work
Variety of different types of workspace
Quiet rooms for working alone or in pairs
Informal work areas / break-out zones
Noise levels
Differences between top 10 and bottom 10 workplaces
Average across top 10 workplaces Average across bottom 10 workplaces
% satisfaction
14%93%
44%97%
6%79%
21%93%
31%96%
9%74%
25%89%
56%94%
13%87%
34%93%
12%53%
5 Managing mobilityAcross the world, businesses of all sizes are seeking to understand the potential benefits of creating agile, more flexible teams and workplaces. In March 2015, we added two new questions to the Leesman core survey designed to poll employee mobility. 187,738 employees have since then selected a mobility profile to describe the way in which they use their principal workplace.
Many of these employees are working in environments described by their employer as “activity based”. These are spaces designed to vigorously promote employees selecting a series of different spaces during a working day, each chosen to best support the particular activity being undertaken at that point.
The results identify the crucial building blocks to support activity based working (ABW) and demonstrate the impact this work style has on employee effectiveness. The data consistently supported industry claims that ABW provides far greater flexibility in where and how an employee chooses to work – and in so doing, increases staff collaboration, productivity, pride and effectiveness. But it also uncovered a series of substantial failings and challenges that should act as important warning signals to any organisation considering embarking on an ABW project.
We consistently saw that the adoption of activity based working styles, in spaces specifically designed to promote and support it, were
16
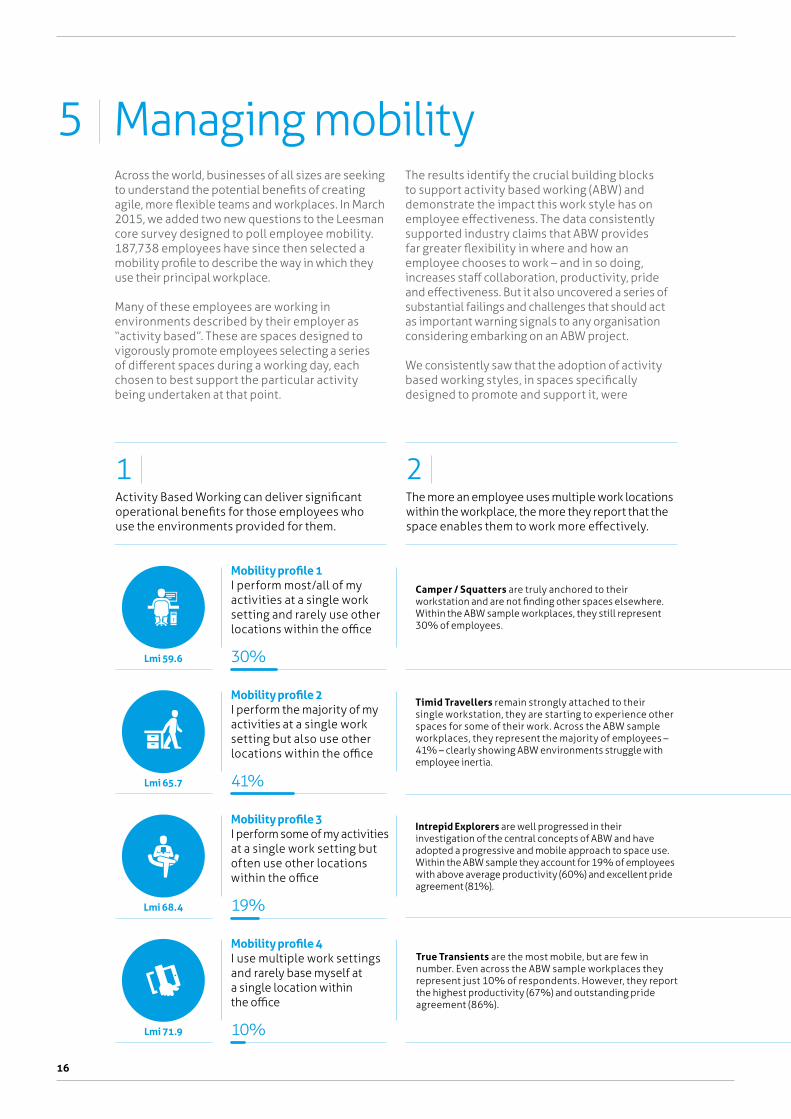
Activity Based Working can deliver significant operational benefits for those employees who use the environments provided for them.
The more an employee uses multiple work locations within the workplace, the more they report that the space enables them to work more effectively.
1 2
True Transients are the most mobile, but are few in number. Even across the ABW sample workplaces they represent just 10% of respondents. However, they report the highest productivity (67%) and outstanding pride agreement (86%).
Intrepid Explorers are well progressed in their investigation of the central concepts of ABW and have adopted a progressive and mobile approach to space use. Within the ABW sample they account for 19% of employees with above average productivity (60%) and excellent pride agreement (81%).
Timid Travellers remain strongly attached to their single workstation, they are starting to experience other spaces for some of their work. Across the ABW sample workplaces, they represent the majority of employees – 41% – clearly showing ABW environments struggle with employee inertia.
Camper / Squatters are truly anchored to their workstation and are not finding other spaces elsewhere. Within the ABW sample workplaces, they still represent 30% of employees.
Lmi 59.6
Lmi 65.7
Lmi 68.4
Lmi 71.9
Mobility profile 1I perform most/all of my activities at a single work setting and rarely use other locations within the office
Mobility profile 2I perform the majority of my activities at a single work setting but also use other locations within the office
Mobility profile 3I perform some of my activities at a single work setting but often use other locations within the office
30%
41%
19%
10%
Mobility profile 4 I use multiple work settings and rarely base myself at a single location within the office

dramatically lower than might have been expected. Across a sample of 11,366 employees from 40 activity based workplaces, just 29% selected a mobility profile that could be described as exhibiting activity based behaviours.
These adoption rates closely mapped to an employee’s increase in activity complexity (the number of activities out of 21 possible, chosen as important in an employee’s work). This illustrated that those with more complex activity profiles benefit the most from utilising their workplaces in the manner intended and that those who do not risked the most, recording the lowest effectiveness scores across the sample.
It also questioned whether some organisations have imposed an ABW environment and promoted the matching practices on teams where the majority of employees have a lower activity complexity profile where the benefits of adoption are minimal, if not counter-productive. In these environments, employees are retaining traditional work habits and are then, in effect, working in conflict with the environment around them. Equally it could once again point to underestimating the importance of change management.
17
The more complex an employee’s daily work profile, the more beneficial it is for them to work in a mobile way that utilises multiple settings.
Poor adoption of appropriate behaviour in activity based workplaces is a significant problem that limits widespread organisational benefits.
3 4
67.1% 85.9%
60.0% 81.4%
54.5%
Productivity agreement
Productivity agreement
Productivity agreement
Productivity agreement
Pride agreement
Pride agreement
Pride agreement
Pride agreement
73.1%
41.8% 54.6%
How internal mobility drives ABW benefits
Profile 1 – low mobility Profile 4 – high mobility
% support
58%Individual focused work away from your desk
78%
45%Thinking / creative thinking
65%
42%Spreading out paper or materials
49%
52%Business confidential discussions
68%
67%Informal, un-planned meetings
81%
77%Informal social interaction
91%
65%Collaborating on creative work
79%

4.7%
33.9%
34.8%
37.0%
38.7%
39.7%
41.2%42.9%44.4%45.8%48.0%48.3%48.8%49.2%52.4%
52.8%58.2%62.8%75.1%76.6%92.8%
% importance
Using technical/specialist equipment or materials
Individual focused work away from your desk
Video conferences
Larger group meetings or audiences
Spreading out paper or materials
Hosting visitors, clients or customers
Collaborating on creative work
Private conversations
Business confidential discussions
Learning from others
Informal social interactionThinking / creative thinkingAudio conferencesIndividual routine tasksReading
Relaxing / taking a breakCollaborating on focused work
Informal, un-planned meetings
Telephone conversations
Planned meetings
Individual focused work, desk based
82.7%79.6%
77.8%
77.3%
75.6%
75.0%
71.6%
70.9%
69.6%
64.2%
60.7%
59.3%
59.3%
58.6%58.0
%54
.5%
51.4
%49
.8%
48.9
%46
.0%
41.2
%37
.6%
35.8
%34
.9%
33.7
%%
impo
rtan
ce
Tea, coffee & other refreshment facilities
General cleanliness
IT help desk
Toilets/W.C.
Printing/copying/scanning equipment
Restaurant/canteen
WiFi network connectivity in the office
Telephone equipment
General tidiness
Computing equipment, m
obile
Parking
Remote access
to work files o
r netw
ork
Computing equipment, fi
xed
Securit
y
Wire
d in-o
ffice
network
connec
tivity
Acce
ss
Mai
l & p
ost r
oom
serv
ices
Heal
th &
safe
ty p
rovi
sion
Leis
ure
faci
litie
s ons
ite o
r nea
rby
Rece
ptio
n ar
eas
Hos
pita
lity
serv
ices
Audi
o Vi
sual
equ
ipm
ent
Inte
rnal
sig
nage
Show
er fa
cilit
ies
Gue
st/v
isito
r net
wor
k ac
cess
The design of my workplace is important to me
It contributes to a sense of community at work
It creates an enjoyable environment to work in
It enables me to work productively
It’s a place I’m proud to bring visitors to
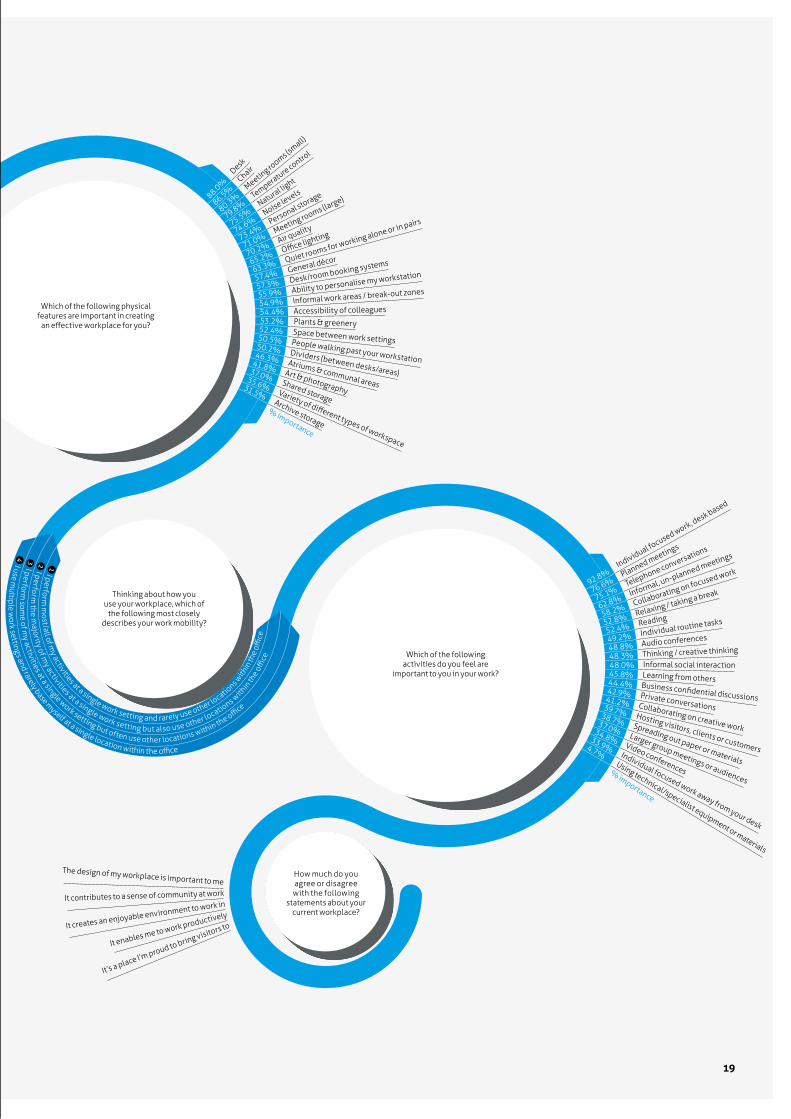
How much do you agree or disagree with the following
statements about your current workplace?
Thinking about the general mobility of your job/role, which of the following
most closely describes how much you work in your main workplace?
Which of the following service features are important in creating an effective workplace for you?
Which of the following activities do you feel are
important to you in your work?
Thinking about how you use your workplace, which of
the following most closely describes your work mobility?
31.5%
35.6%
37.0%
41.8%
46.3%
50.2%50.5%52.4%53.2%54.4%54.9%55.9%57.3%57.4%
63.3%65.2%70.2%71.0%73.4%74.6%75.5%79.8%80.3%86.5%88.0%
% importance
Archive storage
Variety of different types of workspace
Shared storage
Art & photography
Atriums & communal areas
Dividers (between desks/areas)
People walking past your workstation
Space between work settings
Plants & greenery
Accessibility of colleaguesInformal work areas / break-out zonesAbility to personalise my workstation
Desk/room booking systemsGeneral décorQuiet rooms for working alone or in pairs
Office lightingAir qualityMeeting rooms (large)
Personal storage
Noise levelsNatural lig
ht
Temperature contro
l
Meeting ro
oms (small)
ChairDesk
I rarely work there and prim
arily work elsewhere
I regularly work there but primarily work off-site or work elsewhere
I primarily w
ork there but attend meetings off-site or work elsewhere
I primarily w
ork there and rarely need to work elsewhere
I use multiple w
ork settings and rarely base m
yself at a single location within the office
I perform som
e of my activities at a single work setting but often use other locations within the office
I perform the m
ajority of my activities at a single work setting but also use other lo
cations w
ithin
the
office
I perform m
ost/all of my activities at a single work setting and rarely use other lo
catio
ns with
in th
e offi
ce
1234
1234
Which of the following physical features are important in creating an effective workplace for you?
18
Data driven decisionsWorkplace is awash with data. New technology solutions appear every week to measure, inform, aid response or automate processes and it’s easy to get lost in the noise and hype. The question organisations should ask themselves, is how many of these tools benefit the customer – the employee.
Employee centric workplace solutions – those that understand the work profile of the employee and build a responsive and respectful infrastructure around them – are the workplaces that reap the highest productivity, pride and enjoyment results.
Some would argue that physical workplaces are not the drivers of performance and that culture trumps infrastructure every time.
We would suggest that the two are essentially complementary.
What does a poorly performing workplace – one that does not support the efforts of employees – say of the organisational culture? At the very least it suggests apathy or ambivalence. At the worst, a scant regard or disrespect for employee wellbeing.
True, amazing workplace culture can help employees overcome or discount minor workflow obstacles, and a great workplace can imbue behaviours that reinforce great culture, but separating the two as disconnected, or suggesting one is the primary or dominant force in organisational performance, is diversionary.
Great organisations build businesses that enable their employees to do their best. And physical and virtual infrastructures are integral in this equation, so establishing a clearly communicated workplace strategy helps you snub the propaganda and get to what is really going to make a difference for your business. So, start by working out what your business is looking to achieve.
4.7%
33.9%
34.8%
37.0%
38.7%
39.7%
41.2%42.9%44.4%45.8%48.0%48.3%48.8%49.2%52.4%
52.8%58.2%62.8%75.1%76.6%92.8%
% importance
Using technical/specialist equipment or materials
Individual focused work away from your desk
Video conferences
Larger group meetings or audiences
Spreading out paper or materials
Hosting visitors, clients or customers
Collaborating on creative work
Private conversations
Business confidential discussions
Learning from others
Informal social interactionThinking / creative thinkingAudio conferencesIndividual routine tasksReading
Relaxing / taking a breakCollaborating on focused work
Informal, un-planned meetings
Telephone conversations
Planned meetings
Individual focused work, desk based
82.7%79.6%
77.8%
77.3%
75.6%
75.0%
71.6%
70.9%
69.6%
64.2%
60.7%
59.3%
59.3%
58.6%58.0
%54
.5%
51.4
%49
.8%
48.9
%46
.0%
41.2
%37
.6%
35.8
%34
.9%
33.7
%%
impo
rtan
ce
Tea, coffee & other refreshment facilities
General cleanliness
IT help desk
Toilets/W.C.
Printing/copying/scanning equipment
Restaurant/canteen
WiFi network connectivity in the office
Telephone equipment
General tidiness
Computing equipment, m
obile
Parking
Remote access
to work files o
r netw
ork
Computing equipment, fi
xed
Securit
y
Wire
d in-o
ffice
network
connec
tivity
Acce
ss
Mai
l & p
ost r
oom
serv
ices
Heal
th &
safe
ty p
rovi
sion
Leis
ure
faci
litie
s ons
ite o
r nea
rby
Rece
ptio
n ar
eas
Hos
pita
lity
serv
ices
Audi
o Vi
sual
equ
ipm
ent
Inte
rnal
sig
nage
Show
er fa
cilit
ies
Gue
st/v
isito
r net
wor
k ac
cess
The design of my workplace is important to me
It contributes to a sense of community at work
It creates an enjoyable environment to work in
It enables me to work productively
It’s a place I’m proud to bring visitors to
How much do you agree or disagree with the following
statements about your current workplace?
Thinking about the general mobility of your job/role, which of the following
most closely describes how much you work in your main workplace?
Which of the following service features are important in creating an effective workplace for you?
Which of the following activities do you feel are
important to you in your work?
Thinking about how you use your workplace, which of
the following most closely describes your work mobility?
31.5%
35.6%
37.0%
41.8%
46.3%
50.2%50.5%52.4%53.2%54.4%54.9%55.9%57.3%57.4%
63.3%65.2%70.2%71.0%73.4%74.6%75.5%79.8%80.3%86.5%88.0%
% importance
Archive storage
Variety of different types of workspace
Shared storage
Art & photography
Atriums & communal areas
Dividers (between desks/areas)
People walking past your workstation
Space between work settings
Plants & greenery
Accessibility of colleaguesInformal work areas / break-out zonesAbility to personalise my workstation
Desk/room booking systemsGeneral décorQuiet rooms for working alone or in pairs
Office lightingAir qualityMeeting rooms (large)
Personal storage
Noise levelsNatural lig
ht
Temperature contro
l
Meeting ro
oms (small)
ChairDesk
I rarely work there and prim
arily work elsewhere
I regularly work there but primarily work off-site or work elsewhere
I primarily w
ork there but attend meetings off-site or work elsewhere
I primarily w
ork there and rarely need to work elsewhere
I use multiple w
ork settings and rarely base m
yself at a single location within the officeI perform
some of m
y activities at a single work setting but often use other locations within the office
I perform the m
ajority of my activities at a single work setting but also use other lo
cations w
ithin
the
office
I perform m
ost/all of my activities at a single work setting and rarely use other lo
catio
ns with
in th
e offi
ce
1234
1234
Which of the following physical features are important in creating an effective workplace for you?
19
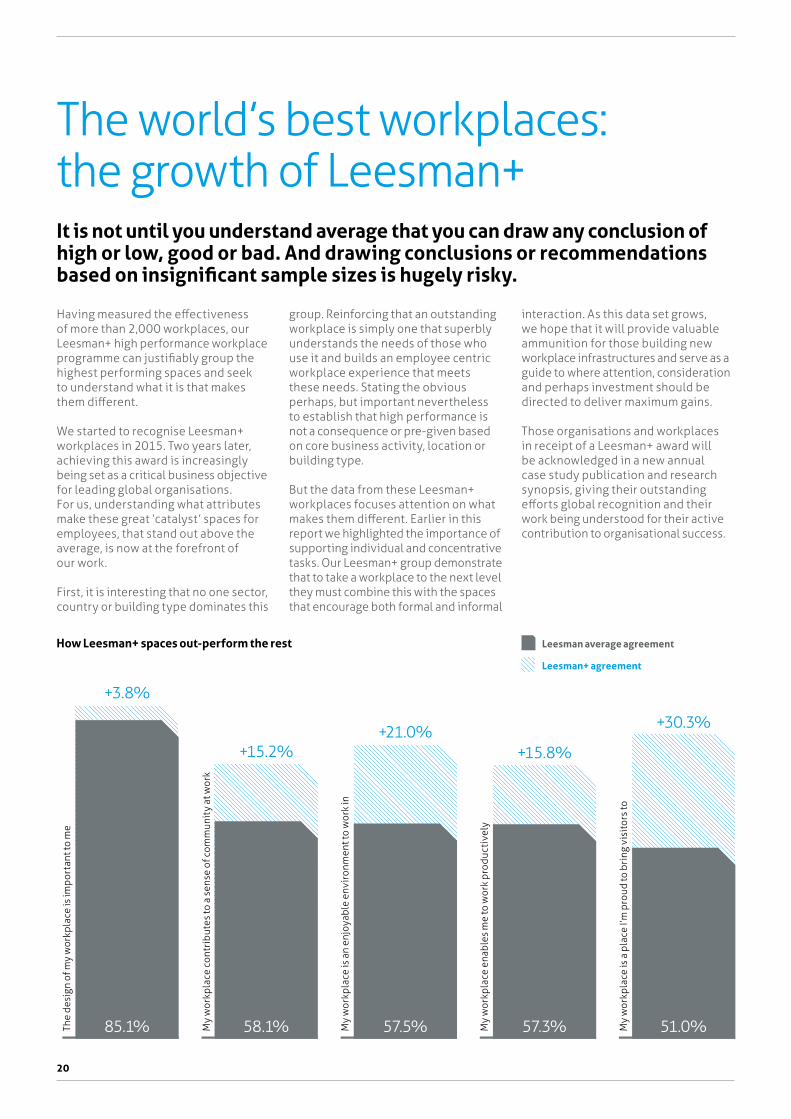
The world’s best workplaces: the growth of Leesman+It is not until you understand average that you can draw any conclusion of high or low, good or bad. And drawing conclusions or recommendations based on insignificant sample sizes is hugely risky.
20
Having measured the effectiveness of more than 2,000 workplaces, our Leesman+ high performance workplace programme can justifiably group the highest performing spaces and seek to understand what it is that makes them different.
We started to recognise Leesman+ workplaces in 2015. Two years later, achieving this award is increasingly being set as a critical business objective for leading global organisations. For us, understanding what attributes make these great ‘catalyst’ spaces for employees, that stand out above the average, is now at the forefront of our work.
First, it is interesting that no one sector, country or building type dominates this
group. Reinforcing that an outstanding workplace is simply one that superbly understands the needs of those who use it and builds an employee centric workplace experience that meets these needs. Stating the obvious perhaps, but important nevertheless to establish that high performance is not a consequence or pre-given based on core business activity, location or building type.
But the data from these Leesman+ workplaces focuses attention on what makes them different. Earlier in this report we highlighted the importance of supporting individual and concentrative tasks. Our Leesman+ group demonstrate that to take a workplace to the next level they must combine this with the spaces that encourage both formal and informal
interaction. As this data set grows, we hope that it will provide valuable ammunition for those building new workplace infrastructures and serve as a guide to where attention, consideration and perhaps investment should be directed to deliver maximum gains.
Those organisations and workplaces in receipt of a Leesman+ award will be acknowledged in a new annual case study publication and research synopsis, giving their outstanding efforts global recognition and their work being understood for their active contribution to organisational success.
Leesman average agreement
Leesman+ agreement
How Leesman+ spaces out-perform the rest
The
desi
gn o
f my
wor
kpla
ce is
impo
rtan
t to
me
My
wor
kpla
ce is
an
enjo
yabl
e en
viro
nmen
t to
wor
k in
My
wor
kpla
ce c
ontr
ibut
es to
a s
ense
of c
omm
unit
y at
wor
k
My
wor
kpla
ce e
nabl
es m
e to
wor
k pr
oduc
tive
ly
My
wor
kpla
ce is
a p
lace
I’m
pro
ud to
bri
ng v
isit
ors
to
+3.8%
85.1%
+15.2%
58.1%
+21.0%
57.5%
+15.8%
57.3%
+30.3%
51.0%
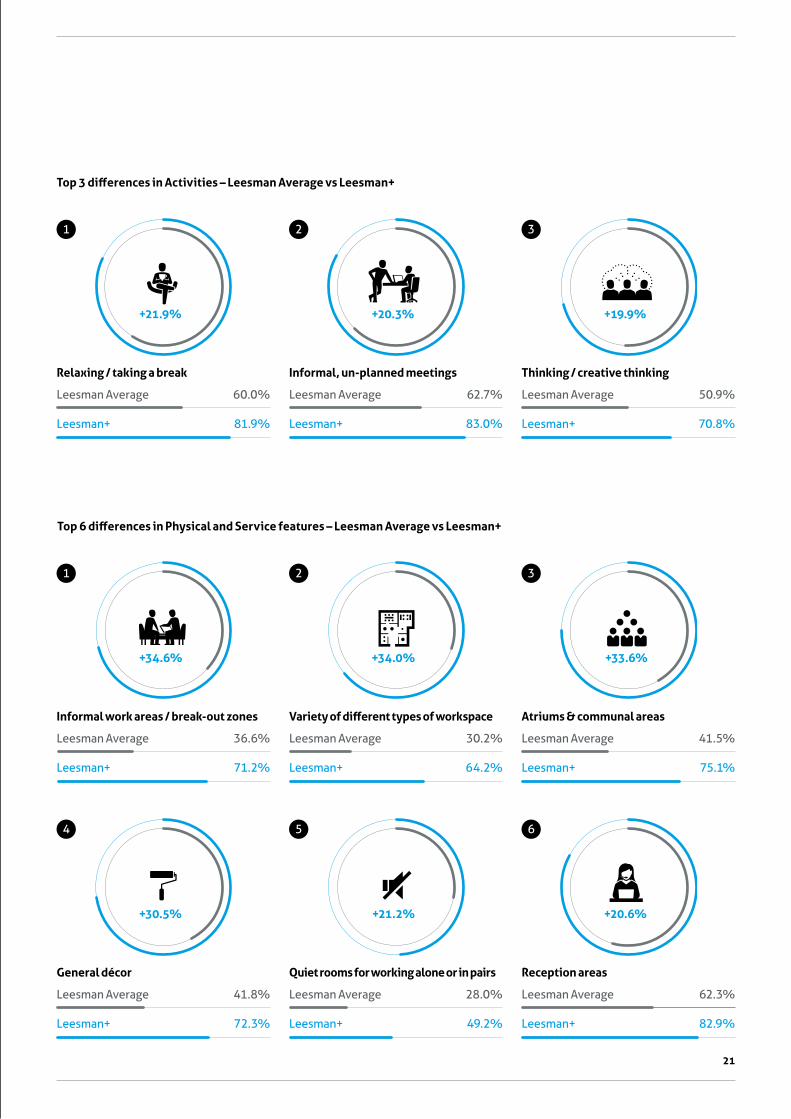
Relaxing / taking a break
Leesman Average 60.0%
Leesman+ 81.9%
Informal, un-planned meetings
Leesman Average 62.7%
Leesman+ 83.0%
Reception areas
Leesman Average 62.3%
Leesman+ 82.9%
21
Top 3 differences in Activities – Leesman Average vs Leesman+
1
+21.9%
2
+20.3%
Thinking / creative thinking
Leesman Average 50.9%
Leesman+ 70.8%
3
+19.9%
General décor
Leesman Average 41.8%
Leesman+ 72.3%
4
+30.5%
5
Quiet rooms for working alone or in pairs
Leesman Average 28.0%
Leesman+ 49.2%
+21.2%
6
+20.6%
Informal work areas / break-out zones
Leesman Average 36.6%
Leesman+ 71.2%
1
+34.6%
Variety of different types of workspace
Leesman Average 30.2%
Leesman+ 64.2%
2
+34.0%
Atriums & communal areas
Leesman Average 41.5%
Leesman+ 75.1%
3
+33.6%
Top 6 differences in Physical and Service features – Leesman Average vs Leesman+
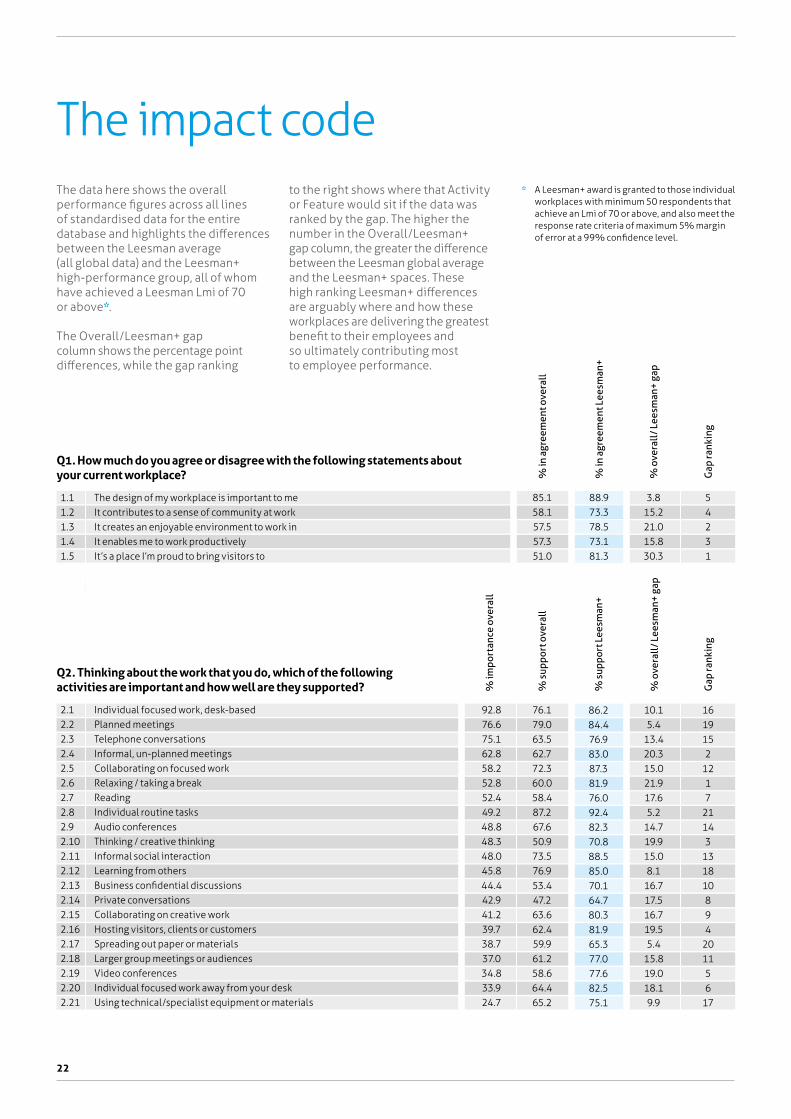
The impact code
22
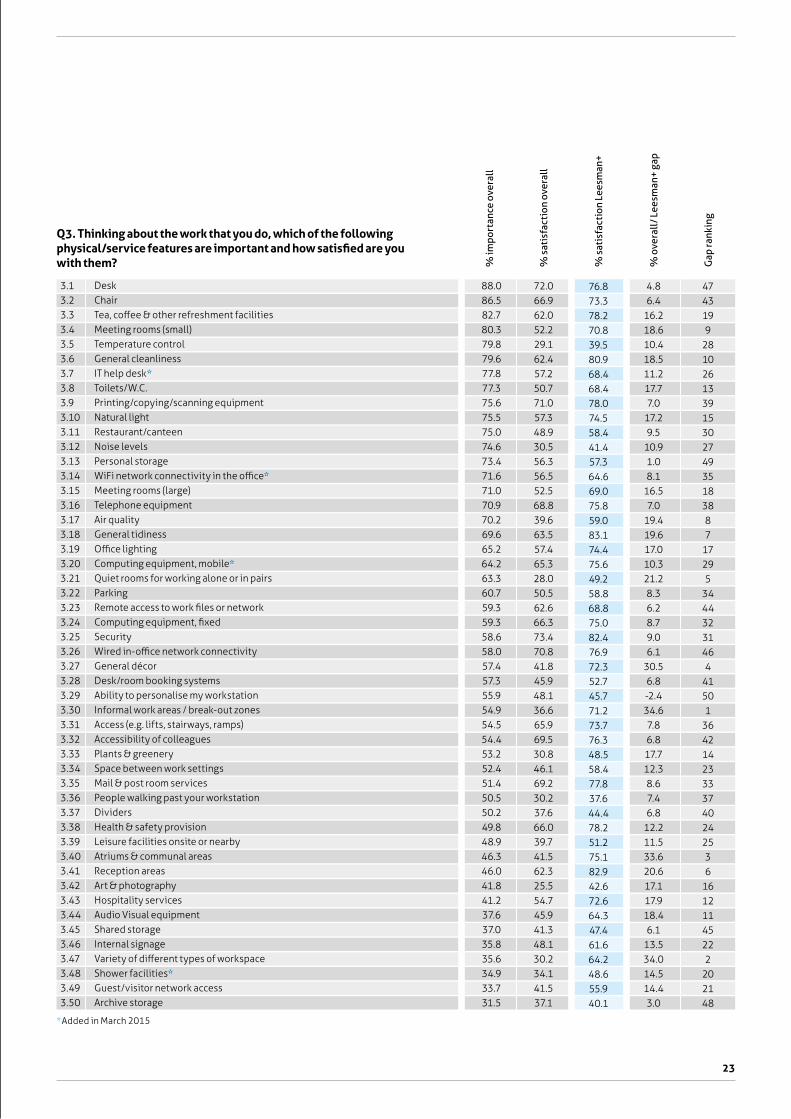
The data here shows the overall performance figures across all lines of standardised data for the entire database and highlights the differences between the Leesman average (all global data) and the Leesman+ high-performance group, all of whom have achieved a Leesman Lmi of 70 or above*.
The Overall/Leesman+ gap column shows the percentage point differences, while the gap ranking
to the right shows where that Activity or Feature would sit if the data was ranked by the gap. The higher the number in the Overall/Leesman+ gap column, the greater the difference between the Leesman global average and the Leesman+ spaces. These high ranking Leesman+ differences are arguably where and how these workplaces are delivering the greatest benefit to their employees and so ultimately contributing most to employee performance.
Q1. How much do you agree or disagree with the following statements about your current workplace?
The design of my workplace is important to meIt contributes to a sense of community at workIt creates an enjoyable environment to work inIt enables me to work productivelyIt’s a place I’m proud to bring visitors to
1.11.21.31.41.5
% in
agr
eem
ent o
vera
ll
85.158.157.557.351.0
% in
agr
eem
ent L
eesm
an+
88.973.378.573.181.3
% o
vera
ll/ L
eesm
an+
gap
3.815.221.015.830.3
Gap
rank
ing
54231
% im
port
ance
ove
rall
% s
uppo
rt o
vera
ll
% s
uppo
rt L
eesm
an+
Gap
rank
ing
% o
vera
ll/ L
eesm
an+
gap
Q2. Thinking about the work that you do, which of the following activities are important and how well are they supported?
Individual focused work, desk-basedPlanned meetingsTelephone conversationsInformal, un-planned meetingsCollaborating on focused workRelaxing / taking a breakReadingIndividual routine tasksAudio conferencesThinking / creative thinkingInformal social interactionLearning from othersBusiness confidential discussionsPrivate conversationsCollaborating on creative workHosting visitors, clients or customersSpreading out paper or materialsLarger group meetings or audiencesVideo conferencesIndividual focused work away from your deskUsing technical/specialist equipment or materials
2.12.22.32.42.52.62.72.82.92.102.112.122.132.142.152.162.172.182.192.202.21
92.876.675.162.858.252.852.449.248.848.348.045.844.442.941.239.738.737.034.833.924.7
76.179.063.562.772.360.058.487.267.650.973.576.953.447.263.662.459.961.258.664.465.2
10.15.4
13.420.315.021.917.65.2
14.719.915.08.1
16.717.516.719.55.4
15.819.018.19.9
1619152
1217
21143
131810894
201156
17
86.284.476.983.087.381.976.092.482.370.888.585.070.164.780.381.965.377.077.682.575.1
* A Leesman+ award is granted to those individual workplaces with minimum 50 respondents that achieve an Lmi of 70 or above, and also meet the response rate criteria of maximum 5% margin of error at a 99% confidence level.
23
* Added in March 2015
% im
port
ance
ove
rall
% s
atis
fact
ion
over
all
% s
atis
fact
ion
Lees
man
+
Gap
rank
ing
% o
vera
ll/ L
eesm
an+
gap
Q3. Thinking about the work that you do, which of the following physical/service features are important and how satisfied are you with them?
DeskChairTea, coffee & other refreshment facilitiesMeeting rooms (small)Temperature controlGeneral cleanlinessIT help desk*Toilets/W.C.Printing/copying/scanning equipmentNatural lightRestaurant/canteenNoise levelsPersonal storageWiFi network connectivity in the office*Meeting rooms (large)Telephone equipmentAir qualityGeneral tidinessOffice lightingComputing equipment, mobile*Quiet rooms for working alone or in pairsParkingRemote access to work files or networkComputing equipment, fixedSecurityWired in-office network connectivityGeneral décorDesk/room booking systemsAbility to personalise my workstationInformal work areas / break-out zonesAccess (e.g. lifts, stairways, ramps)Accessibility of colleaguesPlants & greenerySpace between work settingsMail & post room servicesPeople walking past your workstationDividersHealth & safety provisionLeisure facilities onsite or nearbyAtriums & communal areasReception areasArt & photographyHospitality servicesAudio Visual equipmentShared storageInternal signageVariety of different types of workspaceShower facilities*Guest/visitor network accessArchive storage
3.13.23.33.43.53.63.73.83.93.103.113.123.133.143.153.163.173.183.193.203.213.223.233.243.253.263.273.283.293.303.313.323.333.343.353.363.373.383.393.403.413.423.433.443.453.463.473.483.493.50
88.086.582.780.379.879.677.877.375.675.575.074.673.471.671.070.970.269.665.264.263.360.759.359.358.658.057.457.355.954.954.554.453.252.451.450.550.249.848.946.346.041.841.237.637.035.835.634.933.731.5
72.066.962.052.229.162.457.250.771.057.348.930.556.356.552.568.839.663.557.465.328.050.562.666.373.470.841.845.948.136.665.969.530.846.169.230.237.666.039.741.562.325.554.745.941.348.130.234.141.537.1
4.86.4
16.218.610.418.511.217.77.0
17.29.5
10.91.08.1
16.57.0
19.419.617.010.321.28.36.28.79.06.1
30.56.8-2.434.67.86.817.712.38.67.46.8
12.211.533.620.617.117.918.46.1
13.534.014.514.43.0
4743199
28102613391530274935183887
17295
34443231464
41501
36421423333740242536
16121145222
202148
76.873.378.270.839.580.968.468.478.074.558.441.457.364.669.075.859.083.174.475.649.258.868.875.082.476.972.352.745.771.273.776.348.558.477.837.644.478.251.275.182.942.672.664.347.461.664.248.655.940.1

Londont. +44 20 3239 5980
Stockholmt. +46 (0)8 559 213 22
New Yorkt. +1 212 858 9665 leesmanindex.com
Amsterdamt. +31 (0)20 893 2598
Delivering insights that drive better workplace strategies: Leesman is the leading assessor of workplace effectiveness and works globally with organisations evaluating how workplaces impact employees. For more information on our work for occupiers, consultants and service vendors, or to understand how we could support your work, feel free to contact us as below;