A Simulation-Based Optimization Model for Scheduling … · Scheduling Project" have investigated a...
22
` A Simulation-Based Optimization Model for Scheduling New Product Development Projects in Research and Development Centers Sadegh Shahbazi 1 , Seyed Mojtaba Sajadi 2* , Fariborz Jolai 3 1. School of Industrial Engineering, College of Engineering, Alborz Campus, University of Tehran, Tehran, Iran 2. Faculty of Entrepreneurship, University of Tehran, Tehran, Iran 3. School of Industrial Engineering, College of Engineering, University of Tehran, Tehran, Iran (Received: August 25, 2017; Revised: December 1, 2017; Accepted: December 16, 2017) Abstract A simulation-based optimization approach for the purpose of finding a near-optimal answer can be efficient and effective. In the present paper, first, the mathematical model for the project activity scheduling problem has been presented with a job shop approach. Then, using the Arena 14 software, the simulation model has been designed. Consequently, a numerical example has been solved via running the model and using variance analysis in order to find a near-optimal answer in terms of earliness profits subtracted by tardiness costs, with the purpose of choosing the best prioritization rule for activities in research teams. In the numerical example, the results reveal that the FCFS method has the highest value of the objective function, and possesses a significant difference from the other methods. After determining the best method, different scenarios regarding the number of resources in the workstations which possess long waiting times have been analyzed, whereby the results show that doubling the number of resources in these workstations can improve the objective function towards a positive output. In addition, the results from the present paper reveal that, contrary to other optimization methods, there is no need for an exact mathematical model in simulation and one can achieve optimal results via a conceptual mathematical model. Therefore, this issue can facilitate the solution of optimization problems, provided that they can be changed to a simulation model. Keywords Simulation-based optimization, new product development, efficiency, scheduling. * Corresponding Author, Email: [email protected] Iranian Journal of Management Studies (IJMS) http://ijms.ut.ac.ir/ Vol. 10, No. 4, Autumn 2017 Print ISSN: 2008-7055 pp. 883-904 Online ISSN: 2345-3745 DOI: 10.22059/ijms.2017.240381.672790
Transcript of A Simulation-Based Optimization Model for Scheduling … · Scheduling Project" have investigated a...
`
A Simulation-Based Optimization Model for Scheduling New Product Development Projects in Research and
Development Centers
Sadegh Shahbazi1, Seyed Mojtaba Sajadi2*, Fariborz Jolai3
1. School of Industrial Engineering, College of Engineering, Alborz Campus, University of Tehran, Tehran, Iran
2. Faculty of Entrepreneurship, University of Tehran, Tehran, Iran 3. School of Industrial Engineering, College of Engineering, University of Tehran, Tehran, Iran
(Received: August 25, 2017; Revised: December 1, 2017; Accepted: December 16, 2017)
Abstract
A simulation-based optimization approach for the purpose of finding a near-optimal answer can be efficient and effective. In the present paper, first, the mathematical model for the project activity scheduling problem has been presented with a job shop approach. Then, using the Arena 14 software, the simulation model has been designed. Consequently, a numerical example has been solved via running the model and using variance analysis in order to find a near-optimal answer in terms of earliness profits subtracted by tardiness costs, with the purpose of choosing the best prioritization rule for activities in research teams. In the numerical example, the results reveal that the FCFS method has the highest value of the objective function, and possesses a significant difference from the other methods. After determining the best method, different scenarios regarding the number of resources in the workstations which possess long waiting times have been analyzed, whereby the results show that doubling the number of resources in these workstations can improve the objective function towards a positive output. In addition, the results from the present paper reveal that, contrary to other optimization methods, there is no need for an exact mathematical model in simulation and one can achieve optimal results via a conceptual mathematical model. Therefore, this issue can facilitate the solution of optimization problems, provided that they can be changed to a simulation model.
Keywords
Simulation-based optimization, new product development, efficiency, scheduling.
* Corresponding Author, Email: [email protected]
Iranian Journal of Management Studies (IJMS) http://ijms.ut.ac.ir/ Vol. 10, No. 4, Autumn 2017 Print ISSN: 2008-7055 pp. 883-904 Online ISSN: 2345-3745
DOI: 10.22059/ijms.2017.240381.672790
884 (IJMS) Vol. 10, No. 4, Autumn 2017
Introduction
Numerous definitions of simulation exist but the most thorough and comprehensive definition has been presented by Shannon. According to Shannon, simulation is "the process of designing a model of a real system and conducting experiments with this model for the purpose of either understanding the behavior of the system or evaluating various strategies (within the limits imposed by a criterion or set of criteria) for the operation of the system" (Shannon and Johannes 1976). Thus, one can come to realize that the process of simulation includes both the making of a model and using it analytically in order to study a problem. In the above-mentioned definition, real system is considered to be a system which exists or is capable of being created.
Of the issues related to the subject matter under analysis in the present paper, one can mention job shop production. When it comes to production problems, the job shop production problem is of the operation sequence problems where jobs pass through specified, but different, machines. In other words, in this problem, each job entering the system must meet specified and pre-determined machines which are, therefore, different for different jobs (Pinedo, 2012, p. 184). With a deeper look at the job shop production system, one can realize that dynamism and uncertainty are of the clear-cut features of such systems. Thus, in investigating the subject of the present study, the job shop approach can be used.
In the present study, considering the simulation approach and also job shop production for the problem of choosing the best prioritization method for carrying out activities of new product development projects in research teams from research and development centers, first a conceptual mathematical model is put forward for the purpose of determining the optimal sequence for carrying out new product development projects and then, via simulating it using a numerical example, different methods are investigated and, via a statistical analysis, the best one is presented.
The purpose of determining the optimal sequence of carrying out projects is prioritizing jobs in groups with respect to the probability of
A Simulation-Based Optimization Model for Scheduling New Product ... 885
different durations for activities, the probability of damaged equipment, and the probability of conducting new activities due to test results from laboratories with the purpose of maximizing the objective function of earliness profits subtracted by tardiness costs, and analyzing scenarios for increasing the number of resources in stations with high waiting times.
Research Background
In the field of simulation-based optimization, Salimifard and Ansari (2016) conducted a study with the purpose of modeling and simulating an urban traffic network using colored petri nets and aimed to present a method based on operational research in order to be used as a good tool in modeling urban traffic networks. The scientific contribution of this paper is investigating the policies regarding the timing of traffic lights and the respective effects on the facilitation of urban traffic flow using colored petri nets. In the above-mentioned research, colored petri nets have been introduced as the tool for modeling and improving the system. A part of the traffic system of Bushehr was modeled via the proposed method and was investigated using discrete event simulation for improvement scenarios. The findings revealed that the proposed method was a worthy and efficient method for improving city traffic systems. Sajadi et al. (2015) conducted a study, using the Arena software, focusing on designing processes for small and medium businesses in the area of decidable goods for the purpose of designing optimal production processes with a simulation approach aiming to determine optimal production costs so that the expected value of the total costs of production, storage, shortage, and decay become minimal. Maleki et al. (2014), in an article titled "Explanation and Improvement of Performance Indicators of the Emergency System Using Discrete Event Simulation (Case Study: Arak Imam Khomeini Hospital)", put forward an improved model in comparison with the previous emergency service model which led to a better classification of work flow and improvement of the performance indicators of the emergency system which in turn caused the reduction of dissatisfaction by the patients. Sajadi et al. (2011), in a paper titled

886 (IJMS) Vol. 10, No. 4, Autumn 2017
"Production Control in a Failure-Prone Manufacturing Network Using Discrete Event Simulation and Automated Response Surface Methodology1" aimed at determining the optimal production cost with respect to machine control policies and also minimizing the inventory cost. Hashim (2017) published a paper titled "Simulation for Reducing Energy Consumption of Multi Core Low Voltage Power Cable Manufacturing System", in which he investigated multiple scenarios for using different devices and suggested the best of resources. In a paper titled "Positioning of Inventory in Supply Chain Using Simulation Modeling", Sharma et al. (2017) focused on reducing inventory in a three-stage model via identifying reordering points and reordering amounts for the purpose of optimizing the inventory. Another study conducted by Teles et al. (2017) which is titled "A Simulation-Based Analysis of a Cork Transformation System", embarked upon creating a simulation model in order to evaluate the production flow via analyzing performance indicators such as time, level of resource usage, and also queue. Subsequent to detailed analysis of system results, the authors presented an application program for improving production plans. In yet another study titled "Improving Performance of Lock Assembly Line Using Lean and Simulation Approach", Rane et al. (2017) embarked on improving an assembly line via maximizing performance indicators such as cycle time, resource usage, and cost reduction. In this paper, pure techniques such as Kaizen, total productive maintenance, and line balancing have been implemented for different cases.
As for the problems of project selection and management with different aims, including project scheduling, the researcher found the most important previous works of research to be as follows:
Bhattacharyya et al. (2011), with the conditions of uncertainty and the relations among projects, put forward a fuzzy multi-objective programming model with the triple objectives of maximizing incomes and minimizing risks and costs, considering resource limitations and the dependence among projects. Carazo et al. (2010) conducted a
1. RSM
A Simulation-Based Optimization Model for Scheduling New Product ... 887
binary programming model in order to choose a portfolio with the multiple objectives of maximizing liquidity flow and sales and minimizing risks. Zhang et al. (2015) addressed a multi-project problem with limited resources in two levels, considering the complex organizational hierarchical structure and random fuzzy environment. In the higher level of the program, the objective was to minimize the total tardiness costs of all subsidiary projects and minimizing resource consumption. In the lower level of the program, on the other hand, the objective was to minimize the finalizing time of the subsidiary project. Tofighian and Naderi (2015) put forward a mixed linear programming model for the selection and planning of portfolio aiming to 1. maximize project profits with respect to the fact that profit is related to time and 2. minimize changes in the resources being used. Zareei and Hassan-Pour (2015) in a paper titled "A Multi-Objective Resource-Constrained Optimization of Time-Cost Trade-off Problems in Scheduling Project" have investigated a multi-objective resource-constrained project scheduling problem with positive and negative cash flows. The Net Present Value (NPV) maximization and span minimization are this study objectives. And since this problem is considered as complex optimization in NP-Hard context, we present a mathematical model for the given problem and solve three evolutionary algorithms; NSGA-II, MOSA, and MOPSO are applied to find the set of Pareto solutions for this multi-objective scheduling problem. In order to show performance of the algorithms, different metrics are applied and comparisons between the two algorithms are also considered. The computational results for a set of test problems taken from the project scheduling problem, Bandar Abbas Gas Condensate Refinery project and library, are presented and discussed. Finally, the computational results illustrate the superior performance of the NSGA-II, MOSA, and MOPSO algorithms with regard to the proposed metrics. In order to solve the proposed method from NSGA-II algorithm, the results are compared with GAMS software in some problems. The proposed method is a converge to the optimum and efficient solution algorithm. According to the investigation conducted by the researcher on the studies which have already been carried out in
888 (IJMS) Vol. 10, No. 4, Autumn 2017
the scope of the research question, it can be concluded that, in order to manage and schedule new product development projects which encounter uncertainty in terms of activities, timing, and resources, most of the researches in the literature have either focused on methods which require precise scheduling and modeling or implemented meta-heuristic methods in their approaches. This fact, therefore, highlights the importance of simulation as a huge gap in this area. An important characteristic of this method is that there is no need for precise mathematical modeling and simply implementing a conceptual model will suffice.
Methodology
Statement of the Problem
Research centers throughout the country possess several research teams and pieces of equipment which are usually simultaneously focused on multiple projects of new product development. Management of proper project conduction in such centers for the purpose of determining work policies in research teams by managers and in order to make better use of researchers and existing laboratory equipment is a difficult and complex process, since activities have an uncertain nature and timing and sometimes rework is to be done due to laboratory test results. Therefore, the main problem in the present study is presenting a conceptual mathematical model in order to determine the optimal sequence of project execution in research teams of defense research and development centers for the purpose of increasing efficiency (human resources and equipment) and decreasing tardiness costs and improving earliness in finishing projects with the policies implemented by team managers via a simulation approach. By policy, the author means the approach taken by team managers in order to prioritize those projects which are in line to receive service from teams wherein using the simulation model and considering different policies by team managers, managers are aided to make the best decisions regarding the objectives of the center.
A Simula
Figure 1
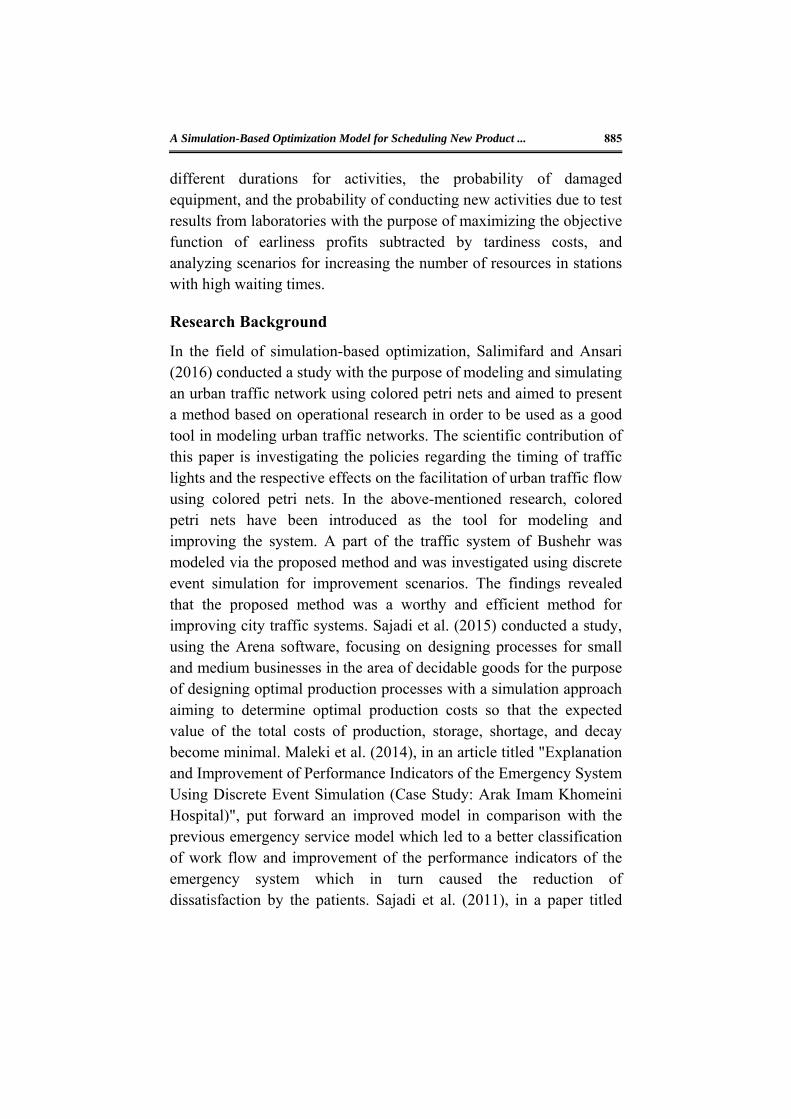
The presentto be imthe redevelopof resepossesssequenfrom pproject shows activitias Aj,h Doing specificof µj,h activityYi,j,h, p
port
ation-Based Op
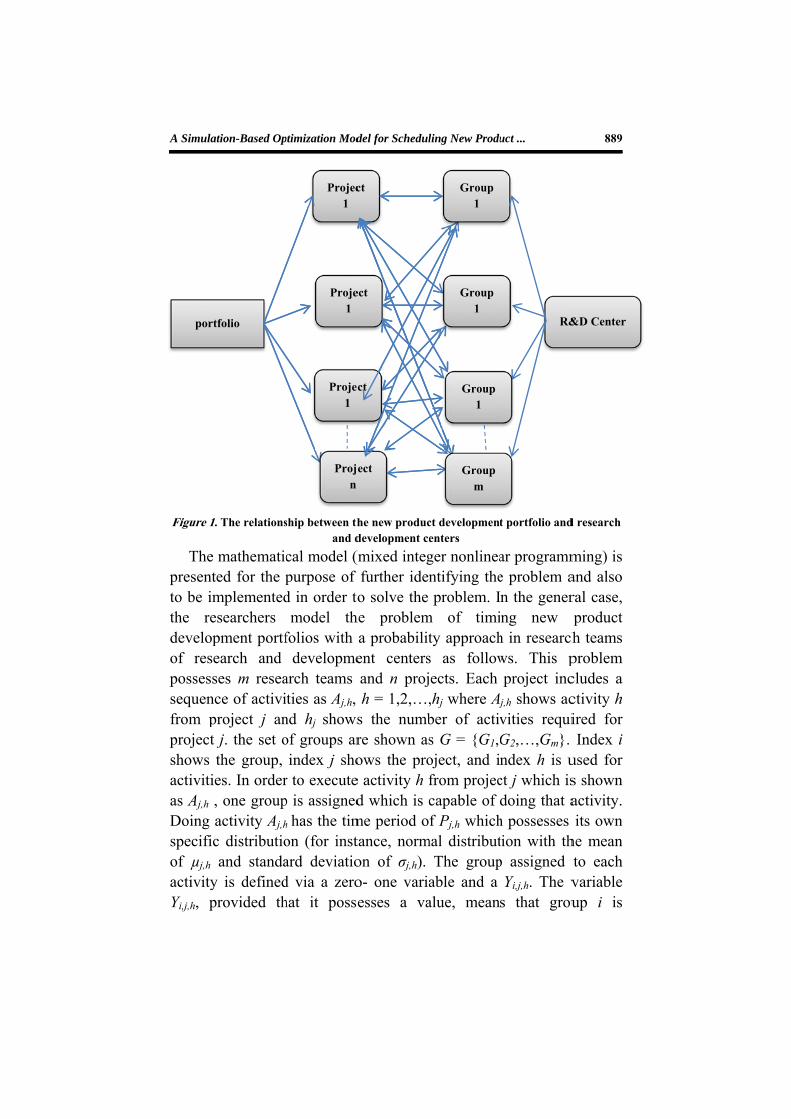
1. The relations
mathematicted for the pmplementedesearchers pment portfearch and ses m reseace of activi
project j anj. the set othe group, es. In order, one groupactivity Aj,h
c distributioand standa
y is definedprovided th
tfolio
ptimization Mod
ship between thand d
cal model (mpurpose of d in order tomodel th
folios with developme
arch teams ties as Aj,h,
nd hj showsof groups arindex j sho
r to executep is assigned
h has the timon (for instard deviatiod via a zerohat it posse
Projec1
Projen
Projec1
Proje1
del for Schedul
he new producdevelopment ce
(mixed integfurther ideno solve the
he problema probabilitent centersand n projh = 1,2,…,
s the numbre shown asows the proe activity h fd which is c
me period otance, normon of σj,h). o- one variaesses a va
ct
ect
ct
ect
ling New Produ
ct developmententers
ger nonlineantifying theproblem. I
m of timity approachs as followects. Each ,hj where Aj
ber of activs G = {G1,Goject, and infrom projeccapable of f Pj,h which
mal distributThe group
able and a alue, mean
Group 1
Group m
Group 1
Group 1
uct ...
t portfolio and
ar programme problem an the generng new
h in researchws. This pproject inc
j,h shows acvities requiG2,…,Gm}. ndex h is uct j which isdoing that a
h possesses tion with thp assigned
Yi,j,h. The vs that grou
R&
889
d research
ming) is and also ral case, product h teams problem cludes a ctivity h ired for Index i
used for s shown activity. its own
he mean to each variable up i is
&D Center
890 (IJMS) Vol. 10, No. 4, Autumn 2017
responsible to perform activity Aj,h. In order to consider the sequence problem, for each group a series of turns is considered. For each activity assigned to a group, a turn is assigned. These turns determine the sequence of performing the activities by that group. For this purpose, the zero-one variable and a Xi,j,h,k are used. If this variable possesses the value of 1, it implies that activity Aj,h is done in group i and in turn k. the objectives in this problem are as follows for conducting new product development projects:
a) Minimizing tardiness costs b) Maximizing earliness profits c) Maximizing the efficiency of the center
Problem parameters m: the number of research teams n: the number of projects Wj: the profit of each time unit of earliness, in proportion with the score of project j in the portfolio determination stage Vj: the cost of each time unit of tardiness, in proportion with the score of project j in the portfolio determination stage dj: the delivery date of project j Aj,h: shows activity h of project i Yi,j,h: if it possesses the value of 1, it means that group i is responsible for doing activity Aj,h. ki: the number of the activities assigned to group i ri,l: the number of the sources of the l kind in group i Pj,h,r: the probable time period of doing activity Aj,h using resource r (with a certain distribution) Problem variables Cj: the completion date for project j Xi,j,h,k: activity Aj,h in group i in turn k (0 and 1 variable) Xi,j,h,k,r: activity Aj,h in group i in turn k using resource rl (0 and 1 variable) ti,j: the starting time of activity Aj,h in group i Tmi,k: the job start time of group i in turn k Having the above-mentioned parameters and variables, the problem
which is under analysis is modeled as follows:
A Simulation-Based Optimization Model for Scheduling New Product ... 891
Equation 1)
n
j
n
j 1)
jd
jC0,.(max
jV
1)
jC
jd0,.(max
jWMaxZ
s.t.:
Rrhhnjfor
f
j
rhj
,...,2,1,,...,2,1,,...,2,1
,,rh,j,P
Equation 2)
Rrhhnjfor j
r
,...,2,1,,...,2,1,,...,2,1
,jhj,pjhj,tjC
Equation 3)
1jh1,2,...,hn;1,2,...,jfor
1hj,trh,j,phj,t
Equation 4)
1;ik1,...,k;jh1,...,hn;1,...,jm;1,..,ifor
1i,kTmj,h,k,ri,.xj,k,rpi,kTm
Equation 5)
;ik1,...,k;jh1,...,hn;1,...,jm;1,..,fori
).Mkh,j,i,x(1,ki,Tm
ki
t
Equation 6)
;ik1,...,k;jh1,...,hn;1,...,jm;1,..,fori
hj,t).Mkh,j,i,x(1ki,Tm
Equation 7)
j k
;ik1,...,k1,...m;fori1j,h,k,ri,x Equation 8)
k
;jh1,...,hn;1,...,j1,...m;forij,hi,yj,h,k,ri,x Equation 9)
;jh1,...,hn;1,...,jfor0hj,t Equation 10)
1,k;jh1,...,hn;1,...,jm;1,...,ifor0,1j,h,k,ri,x Equation 11)
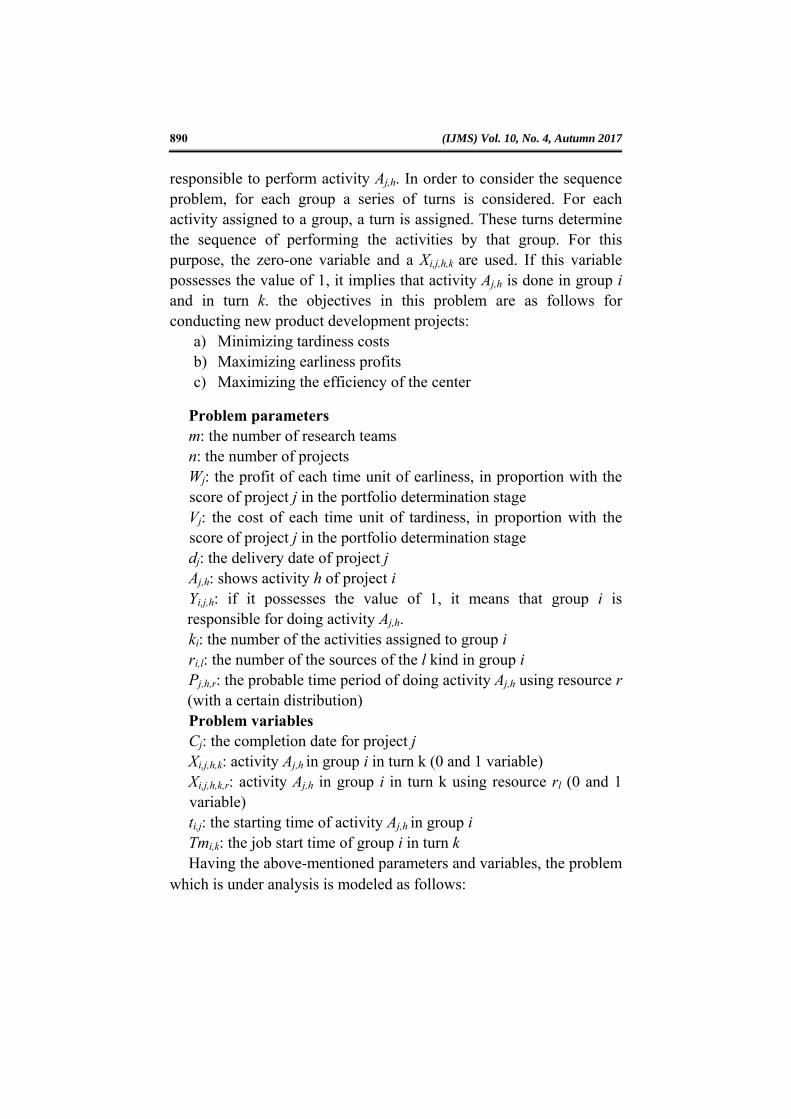
Equation 1 defines the objective function of maximizing earliness profits subtracted by tardiness costs. Equation 2 introduces the time
892 (IJMS) Vol. 10, No. 4, Autumn 2017
period of doing each activity. Equation 3 defines the completion time of each project. Equation 4 introduces the preconditions. These preconditions limit the starting time of each activity to the finishing time of the previous activity. Equation 5 forces this requirement that only when the work of a group in turn k is finished can that group start working in turn k+1. Equations 6 and 7 force this requirement that an activity can only start when both the precondition (the previous activity being completed) and the group requirement condition (the group which is required being free) are met. Equation 8 causes only one turn from all the possible turns to be chosen for a given activity. Equation 9 causes the group which is assigned to a specific activity to determine a turn to perform that activity. Equations 10 and 11 introduce the variable types.
Converting the mathematical model to simulation model
When the mathematical model of a system is studied using simulation, it is called a simulation model. System behavior at specific values of input variables is evaluated by running the simulation model for a fixed period of time. A simulation experiment can be defined as a test or a series of tests in which meaningful changes are made to the input variables of a simulation model, so that we may observe and identify the reasons for changes in the output variable(s). When the number of input variables is large and the simulation model is complex, the simulation experiment may become computationally prohibitive. Besides the high computational cost, an even higher cost is incurred when sub-optimal input variable values are selected. The process of finding the best input variable values from among all possibilities without explicitly evaluating each possibility is simulation optimization. The objective of simulation optimization is minimizing the resources spent while maximizing the information obtained in a simulation experiment.
A general simulation model comprises n input variables ; ; … ; and m output variables ; ; … ; or ; ; … ; (Figure 2)(Carson & Maria, 1997).

A Simulation-Based Optimization Model for Scheduling New Product ... 893
Input Output
Figure 2. A simulation model
In the proposed method, the system for determining optimal sequence policies in research centers is modeled via simulation in the Arena 14 software and then, using the prioritization rules for jobs, the research team embarks upon finding the best prioritization method for jobs which provides the best answer for the objective function of the problem.
Policies for prioritizing project activities in teams Deciding on choosing a specific activity among all the activities existing in the queue at the time when a group becomes free of the last activity is of the most important decisions to be made in research environment. In recent years, many great methods have been proposed and evaluated for this purpose. Such methods make use of different criteria for prioritizing activities and those activities which possess higher priorities enter groups earlier. In the present paper, seven common prioritization rules have been implemented which are depicted in Table 1 below.
Table 1. The Prioritization Methods Implemented
The prioritization methods implemented
Method description
FCFS First Come First Service LCFS Last Come First Service SJF Shortest Job First LPT Longest Processing Time Pr Priority
LWT Lowest Wait Time HWT Highest Wait Time
In order to generate the expected completion time to be used in the earliest expected project completion time rule, the total project content method is used which is calculated via the equation below:
Equation 12)
jh
1i hj,piAjd
Where j is the project number, dj is the expected estimated time for
Simulation Model
x n … x 2
ym
x 1
…y2
y1
894
deliverprocess
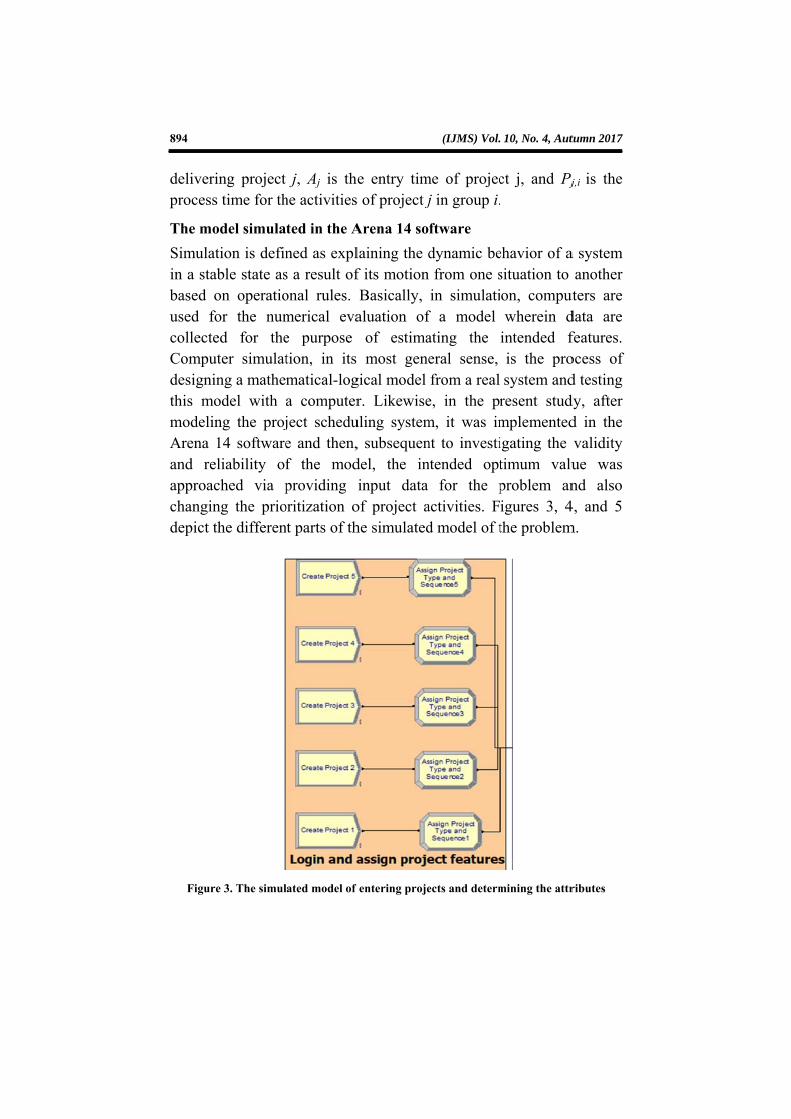
The mo
Simulain a stabased oused fcollecteCompudesignithis momodelinArena and reapproacchangindepict t
Figur
ing project s time for th
odel simula
ation is definable state ason operatio
for the numed for theuter simulating a matheodel with ng the proj14 software
eliability ofched via png the priothe differen
re 3. The simul
j, Aj is thehe activities
ted in the A
ned as expls a result ofonal rules. merical evae purpose tion, in its matical-loga computerject schedue and then,f the modproviding
oritization ont parts of th
lated model of
e entry tim of project j
Arena 14 so
laining the df its motionBasically,
aluation ofof estimamost gene
gical model r. Likewise
uling system, subsequendel, the ininput data
of project ahe simulated
entering proje
(IJMS) Vol.
me of projecj in group i.
ftware
dynamic befrom one sin simulati
f a model ating the eral sense, from a real
e, in the prm, it was imnt to investintended opt
for the pactivities. Fd model of t
ects and determ
10, No. 4, Aut
ct j, and Pj
ehavior of asituation to on, computwherein d
intended fis the prosystem and
resent studmplementedigating the timum valuproblem anigures 3, 4the problem
mining the attr
tumn 2017
j,i is the
a system another
uters are data are features. ocess of d testing dy, after d in the validity ue was nd also
4, and 5 m.
ributes

A Simulation-Based Optimization Model for Scheduling New Product ... 895
In Figure 3, in the first phase of the model, project entrance together with the specifications of each project including its numbers, the delivery date, the sequence of conducting the project, and other issues are specified.
Figure 4. The simulated model of conducting projects in research teams and laboratory
tests
In Figure 4, in the second phase of the model, different research teams and mechanical tests, together with their resources (human resources and machinery), are specified in such a way that the projects which were introduced into the first phase of the model, enter these groups for operation. In addition, prioritization methods for activities are determined in the research teams in this part of the model.
In Figure 5, in the third phase of the model, the performance indicators of the model are defined. The performance indicator which is under analysis in the present study is the objective function of the model, which is the same as minimizing tardiness costs and
R&D CenterWelcomeResearch Group1
Research
Gro
up3
Research Group2
Res
earc
h G
rou
p4
Manager
1 1
1 2
1 3
2 1
2 2
2 3
3 1
3 2
3 3
4 1
4 2
4 3

896
maximiefficien
Figur
Numer
In ordecenter w5 is conon the based oresearcconduceach reTables
Mecha
izing earlinncy.
re 5. The simul
rical Examp
er to show twhich is supnsidered. Econcluded
on specific ch teams acting the presearch team2 and 3.
Tab
nical laboratorCode
G5T1
G5T2
ness profits
lated model of
ple
the functionpposed to w
Each projectcontract. Thscheduling
and one merojects and m and mec
ble 2 . The Info
ry Perc
which ultim
analyzing the
ning mechanwork on the t possesses he projects rules. In thechanical lthe time o
chanical tes
ormation on th
centage of failu
5
8
(IJMS) Vol.
mately resu
objective func
nism of thefive projeca specific dare placed
his research laboratory. of conductint unit are p
he Mechanical
ure
Pr
Pr
10, No. 4, Aut
lt in increas
ctions of the pr
e model, a rcts of 1, 2, 3delivery dat
on researchcenter, therThe seque
ng each propresented b
Test
Rework Time
rocess Time G5
rocess Time G5
tumn 2017
sing the
roblem
research 3, 4, and te based h teams
ere are 4 ence of roject in below in
e
5T1
5T2
A Simulation-Based Optimization Model for Scheduling New Product ... 897
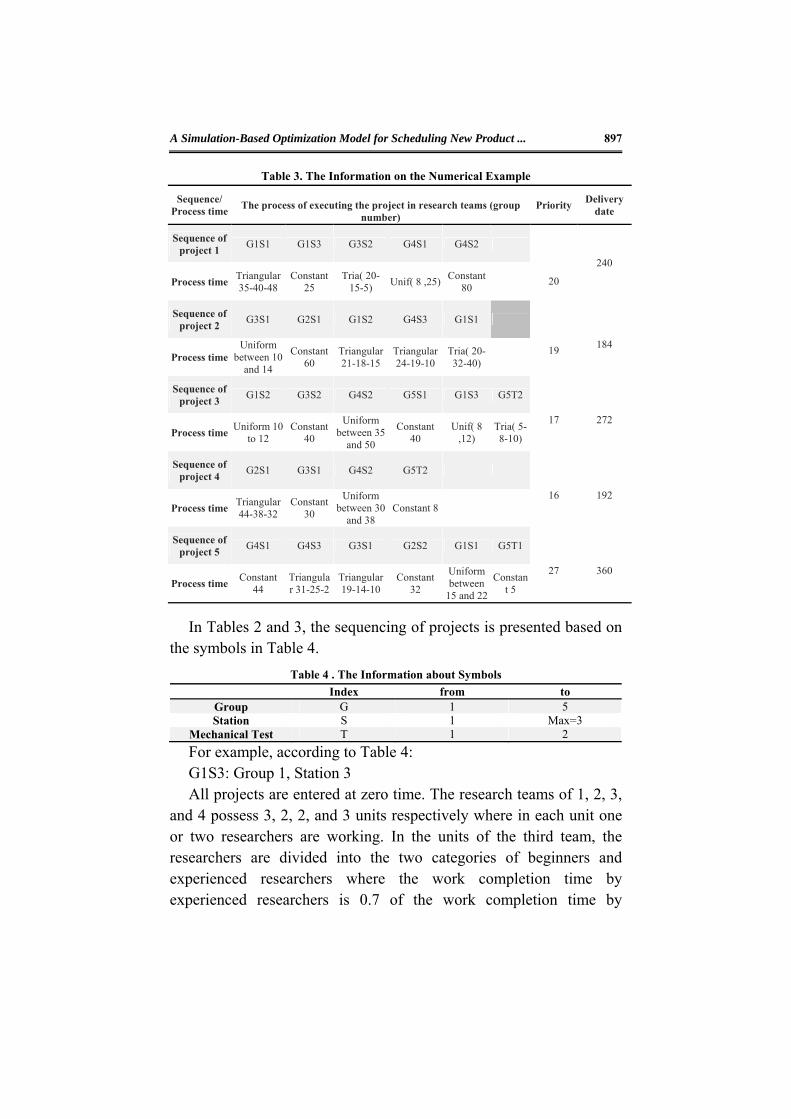
Table 3. The Information on the Numerical Example
Sequence/ Process time
The process of executing the project in research teams (group
number) Priority
Delivery date
Sequence of project 1
G1S1 G1S3 G3S2 G4S1 G4S2
20
240
Process time Triangular 35-40-48
Constant 25
Tria( 20-15-5)
Unif( 8 ,25)Constant
80
Sequence of project 2
G3S1 G2S1 G1S2 G4S3 G1S1
19
184
Process time Uniform
between 10 and 14
Constant 60
Triangular 21-18-15
Triangular 24-19-10
Tria( 20-32-40)
Sequence of project 3
G1S2 G3S2 G4S2 G5S1 G1S3 G5T2
17
272 Process time
Uniform 10 to 12
Constant 40
Uniform between 35
and 50
Constant 40
Unif( 8 ,12)
Tria( 5-8-10)
Sequence of project 4
G2S1 G3S1 G4S2 G5T2
16
192 Process time
Triangular 44-38-32
Constant 30
Uniform between 30
and 38 Constant 8
Sequence of project 5
G4S1 G4S3 G3S1 G2S2 G1S1 G5T1
27
360 Process time
Constant 44
Triangular 31-25-2
Triangular 19-14-10
Constant 32
Uniform between
15 and 22
Constant 5
In Tables 2 and 3, the sequencing of projects is presented based on the symbols in Table 4.
Table 4 . The Information about Symbols
Index from to Group G 1 5 Station S 1 Max=3
Mechanical Test T 1 2
For example, according to Table 4: G1S3: Group 1, Station 3 All projects are entered at zero time. The research teams of 1, 2, 3,
and 4 possess 3, 2, 2, and 3 units respectively where in each unit one or two researchers are working. In the units of the third team, the researchers are divided into the two categories of beginners and experienced researchers where the work completion time by experienced researchers is 0.7 of the work completion time by

898 (IJMS) Vol. 10, No. 4, Autumn 2017
beginner researchers. Additionally, this research center possesses a mechanical laboratory in which there are two test devices named 1 and 2 and the tests conducted by these devices need probable repetitions of 5 and 8 percent respectively.
Analysis of Research Findings via Test Designs The results from conducting the simulation
Table 5. The Results Obtained from Simulation Prioritization
method Factor code Project number Mean amount of the objective function
FCFS 1
1 -1064/974
2 -1944/48
3 -4928/434
4 -5334/49
5 3104/256
LCFS 2
1 -5923/825
2 -4986/255
3 614/017
4 -4163/266
5 3225/476
SJF 3
1 -7555/616
2 -4997/843
3 -1703/686
4 -536/006
5 3196/533
LPT 4
1 -2674/17
2 -1893/539
3 -2724/793
4 -6815/785
5 2675/587
Pr 5
1 -2552/555
2 -2014/066
3 -2261/084
4 -6915/945
5 3186/39
HWT 6
1 -4028/519
2 -4099/044
3 -5138/306
4 -4316/544
5 2813/547
LWT 7
1 -5886/382
2 -4961/65
3 -65/045
4 -4058/079
5 3259/025
A Simulation-Based Optimization Model for Scheduling New Product ... 899
As mentioned above in the statement of the problem, the mathematical model which is investigated in the present study possesses an objective function based on the tardiness costs and earliness profits wherein whole ultimate optimum will result in increased efficiency of the groups. In order to solve the problem, after simulating in the Arena 14 software, the task prioritization rules are considered for the cells and, in case a queue occurs, one of the rules is applied for the queue (commonly for all the cells). The results obtained for the considered numerical problem, for each prioritization rule, are listed below in Table 5.
Experimental design with the aid of analysis of variance (ANOVA)
In order to determine the best sequence, firstly, ANOVA was conducted on the above data for the purpose of investigating the mean vectors:
H0: µ1 = µ2 = µ3 = µ4 = µ5 = µ6 = µ7 H1: at least, one of the means is different from the others. According to Table 6, due to the P-value being smaller than 0.05,
the null hypothesis is rejected and a significant difference exists between the means.
Table 6. Analysis of Variance
Sum of Squares df Mean Square F Sig.
Between Groups 2880971.543 6 480161.924 1165.442 .000
Within Groups 11536.000 28 412.000
Total 2892507.543 34
In order to classify the different groups, the Duncan method was
used and the results are presented in Table 7. As seen in Table 7, five groups have been formed and since the
objective function is based on earliness profit subtracted by tardiness cost, the fifth group which only has one member, namely the FCFS method, possesses the highest amount and is accepted. The other methods have a statistically significant difference with the fifth group.
900 (IJMS) Vol. 10, No. 4, Autumn 2017
Table 7 . Categorization of Groups with the Aid of Duncan Method
Method N
1 2 3 4 5
HWT 5 -2978.60
LWT 5 -2343.80
SJF 5 -2325.20
LPT 5 -2261.40
LCFS 5 -2240.20
Pr 5 -2112.00
FCFS 5 -2021.60
Sig. 1.000 .158 .110 1.000 1.000
Analysis of resource capacity in the FCFS method
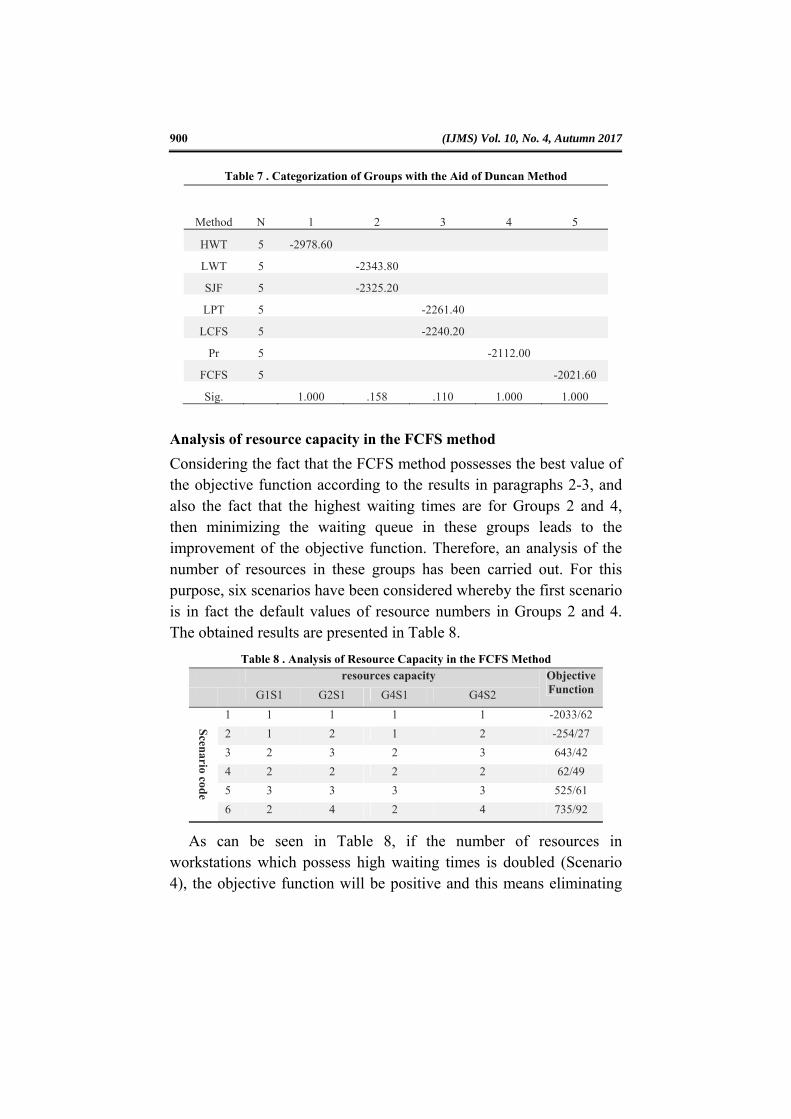
Considering the fact that the FCFS method possesses the best value of the objective function according to the results in paragraphs 2-3, and also the fact that the highest waiting times are for Groups 2 and 4, then minimizing the waiting queue in these groups leads to the improvement of the objective function. Therefore, an analysis of the number of resources in these groups has been carried out. For this purpose, six scenarios have been considered whereby the first scenario is in fact the default values of resource numbers in Groups 2 and 4. The obtained results are presented in Table 8.
Table 8 . Analysis of Resource Capacity in the FCFS Method resources capacity Objective
Function G1S1 G2S1 G4S1 G4S2
Scenario code
1 1 1 1 1 -2033/62
2 1 2 1 2 -254/27
3 2 3 2 3 643/42
4 2 2 2 2 62/49
5 3 3 3 3 525/61
6 2 4 2 4 735/92
As can be seen in Table 8, if the number of resources in workstations which possess high waiting times is doubled (Scenario 4), the objective function will be positive and this means eliminating
A Simulation-Based Optimization Model for Scheduling New Product ... 901
tardiness costs and creating earliness profits in projects. For the purpose of a more precise analysis, the costs of adding resources are also to be investigated. In this table, the highest value of the objective function belongs to Scenario 6.
Conclusions and Suggestions for Further Research
In the present study, the mathematical model for determining the sequence of conducting projects in research teams, aiming to maximize the objective functions of earliness profits subtracted by tardiness costs was first explained. Later on, the simulation model of the problem was designed via the Arena 14 software and was analyzed using a numerical example and the near-optimal sequence for the purpose of maximizing the objective function was determined using the SPSS software, and variance analysis wherein the project prioritization method in research teams using the FSFS method possesses the highest value of the objective function but had a significant statistical difference with the other methods. Using this method, the value of the objective function is -2021/60. Additionally, for the purpose of developing the FCFS method results, resource analysis in workstations which encountered queues was carried out. The results reveal that doubling the resource numbers in workstations G1S1, G2S1, G4S1, and G4S2 leads to objective function improvement. However, a more precise analysis also requires investigating the costs of adding resources. In addition, the results from the present paper reveal that, contrary to other optimization methods, there is no need for an exact mathematical model in simulation and one can achieve optimal results via a conceptual mathematical model. Therefore, this issue can facilitate the solution of optimization problems, provided that they can be changed to a simulation model. Using simulation can, in addition to scheduling job shop production, be used in other production processes such as flow shops. Also, this technique can be exploited in order to solve problems of ground and air transportation. The researcher suggests that production and service organizations, in order to optimize the performance indicators, implement simulation as a backup system for

902 (IJMS) Vol. 10, No. 4, Autumn 2017
decision making since this can help them with decision making regarding the optimal number of equipment pieces and optimal number of human resources and prove effective when it comes to the intended performance indicators and the limitations the organization faces. Using simulation can be exploited in order to solve problems of ground and air transportation.

A Simulation-Based Optimization Model for Scheduling New Product ... 903
References
Bhattacharyya, R., Kumar, P., & Kar, S. (2011). Fuzzy R&D portfolio selection of interdependent projects. Computers & Mathematics with Applications, 62(10), 3857-3870.
Carazo, A. F., Gómez, T., Molina, J., Hernández-Díaz, A. G., Guerrero, F. M., & Caballero, R. (2010). Solving a comprehensive model for multiobjective project portfolio selection. Computers & Operations Research, 37(4), 630-639.
Carson, Y., & Maria, A. (1997). Simulation optimization: Methods and applications. Proceedings from the 29th Conference on Winter Simulation, 118-126.
Hashim, S. A. M. (2017). Simulation for reducing energy consumption of multi core low voltage power cable manufacturing system. Journal on Technical and Vocational Education, 1(2).
Maleki, A., Sajadi, S. M., & Rezaee, B. (2014). Explanation and improvement performance indicators of the emergency system using discrete event simulation (Case study: Arak Imam Khomeini Hospital). Journal of Health Information Managment, 11(1), 4-16.
Pinedo, M. (2012). Scheduling theory, algorithms, and systems (3rd ed.). US: Springer.
Rane, A. B., Sunnapwar, V. K., Chari, N. R., Sharma, M. R., & Jorapur, V. (2017). Improving performance of lock assembly line using lean and simulation approach. International Journal of Business Performance Management, 18(1), 101-124.
Sajadi, S. M., Esfahani, M. M. S., & Sörensen, K. (2011). Production control in a failure-prone manufacturing network using discrete event simulation and automated response surface methodology. The International Journal of Advanced Manufacturing Technology, 53(1-4), 35-46.
Sajadi, S. M., Tavan, F., & Heidary Dahooie, J. (2015). Business processes design of small and medium enterprises of perishable
904 (IJMS) Vol. 10, No. 4, Autumn 2017
items in order to determination of optimum production policy with simulation approach. The Modares Journal of Management Research in Iran, 19(3), 7-35.
Salimifard, K., & Ansari, M. (2016). Modeling and simulation of urban traffic network using colored petri nets. Industrial Management, 8(3), 381-404. Doi:10.22059/imj.2016.61712
Sharma, S. K., Suraj, B., & Routroy, S. (2017). Positioning of inventory in supply chain using simulation modeling. The IUP Journal of Supply Chain Management, 13(2), 20-32.
Shannon, R., & Johannes, J. D. (1976). Systems simulation: the art and science. IEEE Transactions on Systems, Man, and Cybernetics, 6(10), 723-724.
Teles, J., Lopes, R. B., & Ramos, A. L. (2017). A simulation-based analysis of a cork transformation system. In M. Amorim, C. Ferreira, M. Vieira Junior, & C. Prado (Eds.), Engineering systems and networks: The way ahead for industrial engineering and operations management (pp. 3-11). Cham: Springer International Publishing.
Tofighian, A. A., & Naderi, B. (2015). Modeling and solving the project selection and scheduling. Computers & Industrial Engineering, 83, 30-38.
Zareei, M., & Hassan-Pour, H. A. (2015). A multi-objective resource-constrained optimization of time-cost trade-off problems in scheduling project. Iranian Journal of Management Studies, 8(4), 653-685.
Zhang, W.-G., Mei, Q., Lu, Q., & Xiao, W.-L. (2015). Evaluating methods of investment project and optimizing models of portfolio selection in fuzzy uncertainty. Computers & Industrial Engineering, 61(3), 721-728.


![Decentralized Scheduling for Cooperative Localization With ... · and rate control [23]–[26]. In addition, distributed routing was investigated in [27] using the REINFORCE method](https://static.fdocuments.net/doc/165x107/5ec6990b3f83e745073e87c5/decentralized-scheduling-for-cooperative-localization-with-and-rate-control.jpg)