A Simple Method for Estimating Plant Biomass Used in ...A Simple Method for Estimating Plant Biomass...
12
ENRI-006 December 2018 A Simple Method for Estimating Plant Biomass Used in Grazing Management
Transcript of A Simple Method for Estimating Plant Biomass Used in ...A Simple Method for Estimating Plant Biomass...
ENRI-006December 2018
A Simple Method for Estimating Plant Biomass Used in Grazing Management Authors
Beau VoelkelTexas A&M University Department of Wildlife and Fisheries SciencesMichael Marshall, Project Coordinator Texas A&M Natural Resources Institute
Alison Lund, Program CoordinatorTexas A&M Natural Resources Institute
Amanda Gobeli, Extension AssociateTexas A&M Natural Resources Institute
Roel Lopez, DirectorTexas A&M Natural Resources Institute
External ReviewersRob Cook, Planned Consultation Manager and Pasture and Range ConsultantNoble Research Institute Jeff Goodwin, Conservation Stewardship Leader and Pasture and Range ConsultantNoble Research Institute
Photo Credits Cover, Bill Stanley Page 1, Andrew JamesPage 2, Dr. James CatheyPage 4, Beau VoelkelPage 6, Amanda Gobeli

A Simple Method for Estimating Plant Biomass Used in Grazing Management
- 1 -
IntroductionLandowners manage farms and ranches for crops, timber, livestock, and increasingly, wildlife. A 2016 landowner survey conducted by Texas A&M Natural Resource Institute and Texas Parks and Wildlife revealed that the top three reasons for owning land were family recreation, hunting, and wildlife management. From 1997-2012, the number of acres being managed for wildlife in Texas rose from approximately 92,000 acres to over 3.3 million, illustrating the growing value Texans place on their wildlife resources. Managing for wildlife means managing for habitat, which requires an understanding of the plant resources on a property and how grazing by livestock impacts them. Prior to European settlement, American bison (Bison bison) ranged over most of the Great Plains, including Texas, and their grazing activity shaped the prairie landscape. Bison herds never stayed in one place for long, allowing grazed areas to recover. Their hooves churned the soil leaving bare areas for annual forbs and grasses to take hold, and animals like deer, dove, quail, and many others were attracted to these areas. Land managers today use domestic livestock as a tool to mimic the bison herds to manipulate and enhance plant diversity for wildlife.Pastures are more than just food for grazing livestock; they are also habitat for wildlife. Grazing management plays a large role in the quality and extent of wildlife
habitat. Unbalanced grazing practices are detrimental to rangeland health because they reduce primary productivity, impede plant growth and survival, and alter species composition of the grasses, shrubs, and forbs that provide wildlife with food and cover. Practices like grazing to too long, stocking too heavily, and applying too much grazing pressure especially in a single pasture system all negatively impact the natural variabilitly of grasslands upon which wildlife populations depend. To make matters even more challenging, many grasslands in central and eastern Texas no longer exist given the conversion of native prairies to exotic grass monocultures meant to benefit livestock.Unlike natural forces out of the landowner’s control, such as drought and wildfire, grazing management is a tool that can be developed and implemented at the discretion of the land manager, to improve and maintain rangeland health and condition. Whether the property is 100 or 100,000 acres, implementing a proper grazing management plan that directs where, when, how much, and how often livestock graze can optimize economic reward on the property while benefiting wildlife habitat. To strike a balance to benefit multiple wildlife species and livestock, land managers can use techniques to better understand how much forage is available and when changes need to be made to stocking rates or grazing frequency and duration.
Clipping Techniques for Estimating BiomassThe first requirement when developing a grazing management plan is setting a proper stocking rate that considers annual vegetation production (pounds/acre). A proper stocking rate matches animal demand with the annual forage production, and consists of three factors: the number of animals grazing, the area being grazed, and the amount of time a given area is grazed. There are many methods of determining plant biomass, but perhaps the most common method used for rangeland and pasturelands is clipping and weighing. Clipping techniques involve the removal of all above-ground herbaceous vegetation within a sample plot and measuring its dry mass (air or oven-dried vegetation). The typical procedure for a clipping technique is to trim a one square yard plot to the ground across the pasture at a minimum of 12 representative locations. The forage from each plot is placed in an open paper or cloth bag and dried for 48-72 hours. Once air-dry,
A Simple Method for Estimating Plant Biomass Used in Grazing Management
- 2 -
each sample is weighed with a gram scale and the recorded weights are averaged. Because 1 gram/square yard converts to 10.7 pounds/acre, annual production in pounds/acre is determined by multiplying the average weight taken from the sample plots by 10.7 (Marshall et al. 2014; Haby 2017). This method works on both rangeland and pastureland. Although clipping techniques give reliable estimates of biomass, distinct disadvantages include labor intensity and damage to areas being sampled. Therefore, land managers may desire a quicker and easier method that maintains reliability in its estimation while reducing damage to the property.
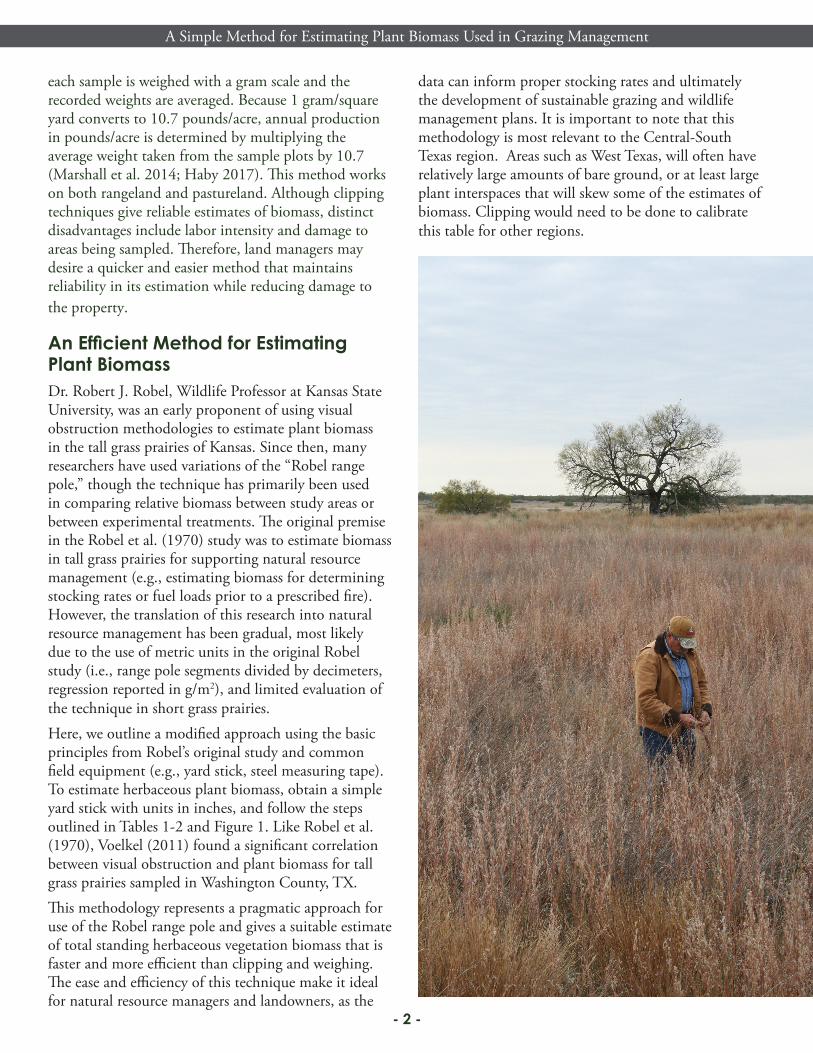
An Efficient Method for Estimating Plant BiomassDr. Robert J. Robel, Wildlife Professor at Kansas State University, was an early proponent of using visual obstruction methodologies to estimate plant biomass in the tall grass prairies of Kansas. Since then, many researchers have used variations of the “Robel range pole,” though the technique has primarily been used in comparing relative biomass between study areas or between experimental treatments. The original premise in the Robel et al. (1970) study was to estimate biomass in tall grass prairies for supporting natural resource management (e.g., estimating biomass for determining stocking rates or fuel loads prior to a prescribed fire). However, the translation of this research into natural resource management has been gradual, most likely due to the use of metric units in the original Robel study (i.e., range pole segments divided by decimeters, regression reported in g/m2), and limited evaluation of the technique in short grass prairies. Here, we outline a modified approach using the basic principles from Robel’s original study and common field equipment (e.g., yard stick, steel measuring tape). To estimate herbaceous plant biomass, obtain a simple yard stick with units in inches, and follow the steps outlined in Tables 1-2 and Figure 1. Like Robel et al. (1970), Voelkel (2011) found a significant correlation between visual obstruction and plant biomass for tall grass prairies sampled in Washington County, TX. This methodology represents a pragmatic approach for use of the Robel range pole and gives a suitable estimate of total standing herbaceous vegetation biomass that is faster and more efficient than clipping and weighing. The ease and efficiency of this technique make it ideal for natural resource managers and landowners, as the
data can inform proper stocking rates and ultimately the development of sustainable grazing and wildlife management plans. It is important to note that this methodology is most relevant to the Central-South Texas region. Areas such as West Texas, will often have relatively large amounts of bare ground, or at least large plant interspaces that will skew some of the estimates of biomass. Clipping would need to be done to calibrate this table for other regions.
A Simple Method for Estimating Plant Biomass Used in Grazing Management
- 3 -
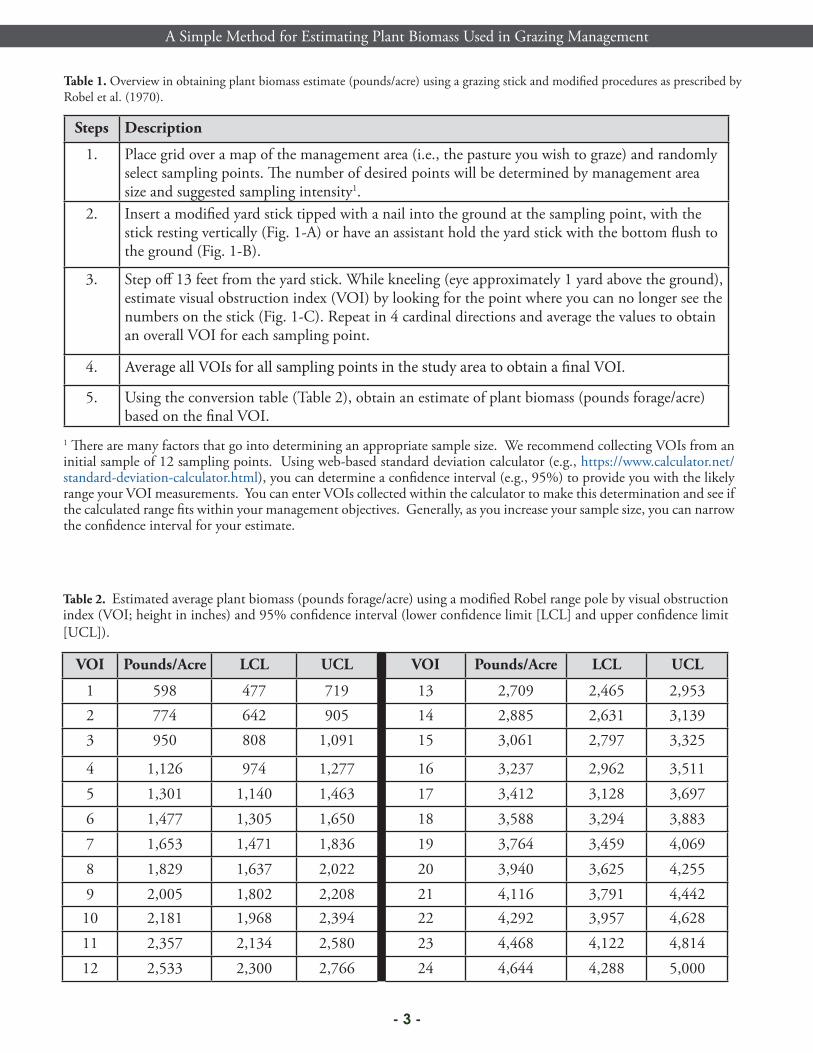
Table 2. Estimated average plant biomass (pounds forage/acre) using a modified Robel range pole by visual obstruction index (VOI; height in inches) and 95% confidence interval (lower confidence limit [LCL] and upper confidence limit [UCL]).
VOI Pounds/Acre LCL UCL VOI Pounds/Acre LCL UCL
1 598 477 719 13 2,709 2,465 2,9532 774 642 905 14 2,885 2,631 3,1393 950 808 1,091 15 3,061 2,797 3,325
4 1,126 974 1,277 16 3,237 2,962 3,5115 1,301 1,140 1,463 17 3,412 3,128 3,6976 1,477 1,305 1,650 18 3,588 3,294 3,8837 1,653 1,471 1,836 19 3,764 3,459 4,0698 1,829 1,637 2,022 20 3,940 3,625 4,2559 2,005 1,802 2,208 21 4,116 3,791 4,44210 2,181 1,968 2,394 22 4,292 3,957 4,62811 2,357 2,134 2,580 23 4,468 4,122 4,81412 2,533 2,300 2,766 24 4,644 4,288 5,000
Table 1. Overview in obtaining plant biomass estimate (pounds/acre) using a grazing stick and modified procedures as prescribed by Robel et al. (1970).
Steps Description
1. Place grid over a map of the management area (i.e., the pasture you wish to graze) and randomly select sampling points. The number of desired points will be determined by management area size and suggested sampling intensity1.
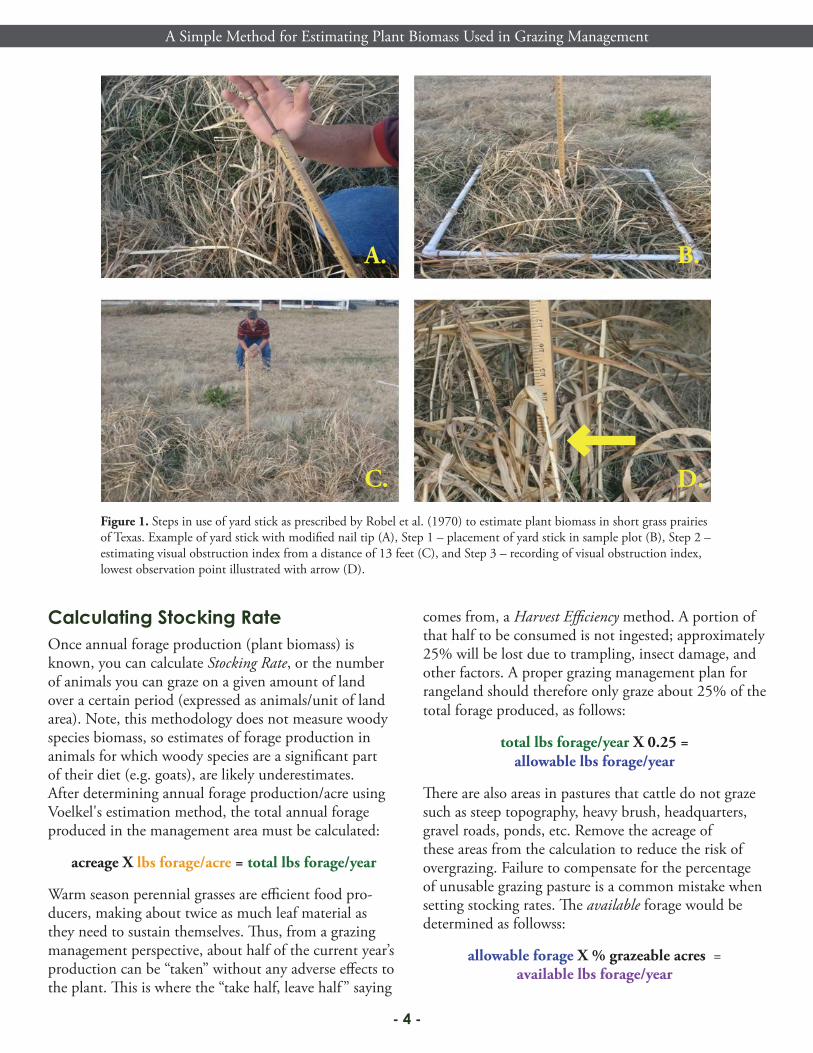
2. Insert a modified yard stick tipped with a nail into the ground at the sampling point, with the stick resting vertically (Fig. 1-A) or have an assistant hold the yard stick with the bottom flush to the ground (Fig. 1-B).
3. Step off 13 feet from the yard stick. While kneeling (eye approximately 1 yard above the ground), estimate visual obstruction index (VOI) by looking for the point where you can no longer see the numbers on the stick (Fig. 1-C). Repeat in 4 cardinal directions and average the values to obtain an overall VOI for each sampling point.
4. Average all VOIs for all sampling points in the study area to obtain a final VOI.
5. Using the conversion table (Table 2), obtain an estimate of plant biomass (pounds forage/acre) based on the final VOI.
1 There are many factors that go into determining an appropriate sample size. We recommend collecting VOIs from an initial sample of 12 sampling points. Using web-based standard deviation calculator (e.g., https://www.calculator.net/standard-deviation-calculator.html), you can determine a confidence interval (e.g., 95%) to provide you with the likely range your VOI measurements. You can enter VOIs collected within the calculator to make this determination and see if the calculated range fits within your management objectives. Generally, as you increase your sample size, you can narrow the confidence interval for your estimate.
A Simple Method for Estimating Plant Biomass Used in Grazing Management
- 4 -
Calculating Stocking RateOnce annual forage production (plant biomass) is known, you can calculate Stocking Rate, or the number of animals you can graze on a given amount of land over a certain period (expressed as animals/unit of land area). Note, this methodology does not measure woody species biomass, so estimates of forage production in animals for which woody species are a significant part of their diet (e.g. goats), are likely underestimates. After determining annual forage production/acre using Voelkel's estimation method, the total annual forage produced in the management area must be calculated:
acreage X lbs forage/acre = total lbs forage/year
Warm season perennial grasses are efficient food pro-ducers, making about twice as much leaf material as they need to sustain themselves. Thus, from a grazing management perspective, about half of the current year’s production can be “taken” without any adverse effects to the plant. This is where the “take half, leave half ” saying
Figure 1. Steps in use of yard stick as prescribed by Robel et al. (1970) to estimate plant biomass in short grass prairies of Texas. Example of yard stick with modified nail tip (A), Step 1 – placement of yard stick in sample plot (B), Step 2 – estimating visual obstruction index from a distance of 13 feet (C), and Step 3 – recording of visual obstruction index, lowest observation point illustrated with arrow (D).
A. B.
C. D.
comes from, a Harvest Efficiency method. A portion of that half to be consumed is not ingested; approximately 25% will be lost due to trampling, insect damage, and other factors. A proper grazing management plan for rangeland should therefore only graze about 25% of the total forage produced, as follows:
total lbs forage/year X 0.25 =allowable lbs forage/year
There are also areas in pastures that cattle do not graze such as steep topography, heavy brush, headquarters, gravel roads, ponds, etc. Remove the acreage of these areas from the calculation to reduce the risk of overgrazing. Failure to compensate for the percentage of unusable grazing pasture is a common mistake when setting stocking rates. The available forage would be determined as followss:
allowable forage X % grazeable acres = available lbs forage/year
A Simple Method for Estimating Plant Biomass Used in Grazing Management
- 5 -
Animal Unit Body Weights (pounds) Animal Unit Equivalents Equivalent Number of Head
Cow 1,000 1.00 1Horse 1,100 1.27 1Domestic sheep 130 0.18 6 ewesBoer X Spanish Goat 125 0.19 5 nanniesWhite-tailed deer 100 0.13 7 Mule deer 135 0.18 6Pronghorn 90 0.14 7
Table 3. Animal unit equivalents for four common domestic livestock and native wildlife species (taken from NRCS: https://www.nrcs.usda.gov/Internet/FSE_DOCUMENTS/nrcs144p2_002433.pdf ). Other animal snimal unit equivalents can be calculated by dividing the animal's body weight by 1,000.
Animal Demand (AD) is the pounds of forage needed by one standard Animal Unit (AU), or a 1,000-pound cow and calf (i.e. 1,200 total pounds), per year. The concept of an AU is useful when one knows that most grazing animals eat 2.5% of their body weight each day (Launchbaugh 2014). Thus, one AU requires 30 pounds of forage per day, and if cattle are grazed year-round, one AU will typically eat about 10,950 pounds of dry forage per year (30 pounds x 365 days). Not all kinds of livestock or wildlife have the same forage demand, thus Animal Unit Equivalents (AUEs; Table 3) can be applied to determine the amount of forage needed for a particular animal type:
animal body weight ÷ 1,000 = AUE AUE x 10,950 lbs forage/year = AD
Next the AD and available forage will need to be combined to determine the number of animal units you can sustainability graze on the managed area. If you are considering grazing multiple species, you will need to determine the AD for each species and combine accordingly to calculate the allowable AUs for the property.
AD (species A) + AD (species B) = total AD (for one species A and one species B)
lbs available forage ÷ total AD = Number of AU*
*This number would account for the total number of each species type (e.g., if 34 AU were calculated that would indicate 34 of species A and 34 of species B could be grazed on the property annually).
On average, about 70% of the warm season grass production is complete by the first week of July in Central Texas. This period is a good time to assess pastures to monitor how closely animal demand is balanced with forage production. Another important time to monitor production is at first frost. This provides insight into the amount of forage available to support animal demand until spring green-up. Rainfall greatly affects forage production; thus, during years of drought or above average precipitation, it is crucial to reassess stocking rates.
Summary A balanced grazing management plan allows efficient allocation of livestock resources while maintaining a healthy rangeland, which also benefits many wildlife species and their habitat. At the core of proper grazing management is the estimate of annual production. The use of the modified Robel method, as described here, represents a quick, easy, and accurate way of estimating standing biomass. Proper grazing can complement and benefit wildlife habitat, as it allows for efficient cattle production while promoting and protecting native vegetation for essential needs, such as food and cover. Grazing management is a tool that must be well thought-out to have positive effects for the rangeland, livestock, wildlife, and landowner.
See the Appendix for an example of how to apply this method and to print a land manger worksheet that is ready for use in
calculating your own stocking rates!

A Simple Method for Estimating Plant Biomass Used in Grazing Management
- 6 -
Literature Cited
Haby, K. 2017. It’s time to measure the forage you have: Edwards Region. Ag News and Views, Texas A&M Agrilife Extension, The Texas A&M University System. College Station, TX, USA. Available at https://agrilife.org/agnewsandviews/2017/11/29/its-time-to-measure-the-forage-you-have/
Launchbaugh, K. 2014. Forage production and carrying capacity. Rangeland Ecology and Management, University of Idaho. Moscow, ID, USA. Available at https://rangeteacherresource.files.wordpress.com/2014/08/stocking-rate-guidelines.pdf
Marshall, M., B. Hays, R. Reitz, J. Goodwin, M. Machacek, and J.C. Cathey. 2014. Grazing, hunting, and endangered species management are compatible practices: Diversifying income through a multi-species approach. SP-EF-007. Texas A&M University. College Station, TX, USA. Available at https://nri.tamu.edu/media/1068/grazinghuntingmanagment-final.pdf
Redmon, L. A. Grazing Management and the Environment. Texas A&M AgriLife Extension Service, The Texas A&M University System. College Station, TX, USA. Available at http://lshs.tamu.edu/media/1408/grazingmanagementwhitepaper.pdf
Robel, R. J., J. N. Briggs, A. D. Dayton, and L. C. Hulbert. 1970. Relationships between visual obstruction measurements and weight of grassland vegetation. Journal of Range Management 23:295–297.
Voelkel, B. 2011. Modification of Robel’s range pole for estimating plant biomass by private landowners and wildlife students. Professional Paper. Wildlife and Fisheries Department,Texas A&M University. College Station, TX, USA.15 pages.

Appendix
Working Eample
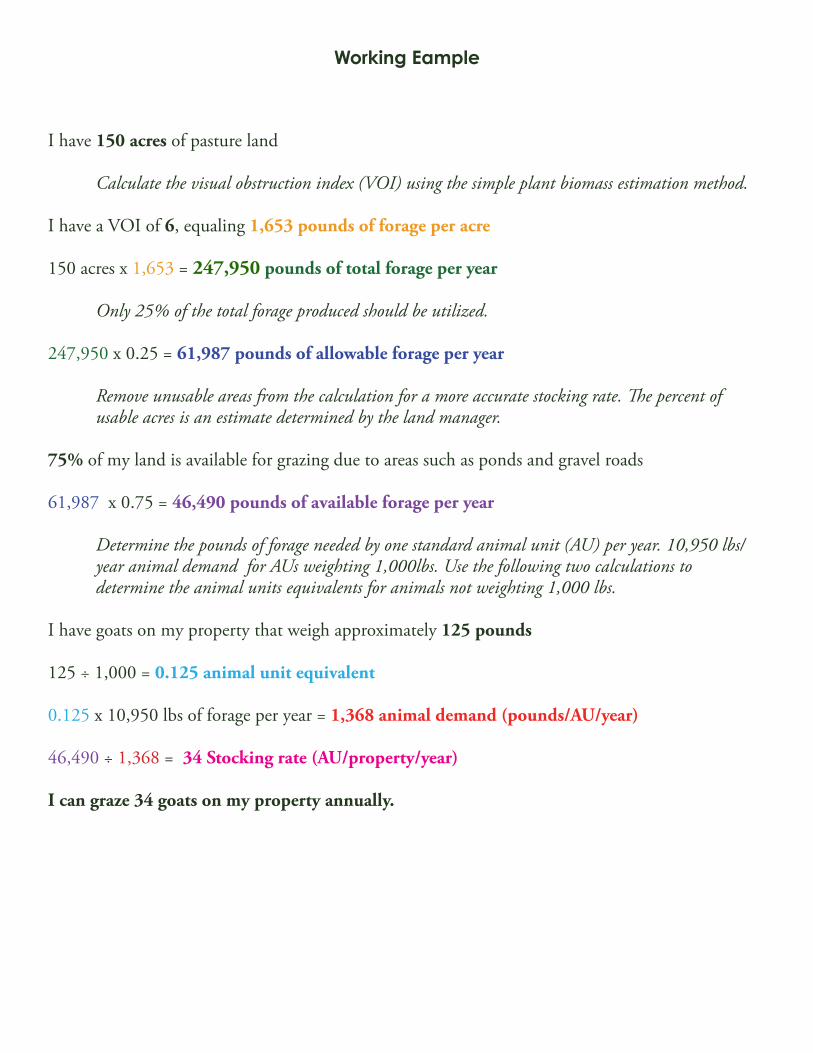
I have 150 acres of pasture land
Calculate the visual obstruction index (VOI) using the simple plant biomass estimation method.
I have a VOI of 6, equaling 1,653 pounds of forage per acre
150 acres x 1,653 = 247,950 pounds of total forage per year
Only 25% of the total forage produced should be utilized.
247,950 x 0.25 = 61,987 pounds of allowable forage per year
Remove unusable areas from the calculation for a more accurate stocking rate. The percent of usable acres is an estimate determined by the land manager.
75% of my land is available for grazing due to areas such as ponds and gravel roads
61,987 x 0.75 = 46,490 pounds of available forage per year
Determine the pounds of forage needed by one standard animal unit (AU) per year. 10,950 lbs/ year animal demand for AUs weighting 1,000lbs. Use the following two calculations to determine the animal units equivalents for animals not weighting 1,000 lbs.
I have goats on my property that weigh approximately 125 pounds
125 ÷ 1,000 = 0.125 animal unit equivalent
0.125 x 10,950 lbs of forage per year = 1,368 animal demand (pounds/AU/year)
46,490 ÷ 1,368 = 34 Stocking rate (AU/property/year)
I can graze 34 goats on my property annually.

Land Manger Worksheet
I have__________ acres of land
Calculate the visual obstruction index (VOI) using the simple plant biomass estimation method.Use the tables on next page to determine forage per acre.
I have a VOI of __________ , equaling __________ forage (lbs/acre/year)
__________ acres x _________ lbs per acre = __________ total forage (lbs/entire area/year)
Only 25% of the total forage produced should be utilized.
__________ lbs of total forage per year x 0.25 = __________ allowable forage (lbs/year)
Remove unusable areas (e.g., areas which exclude grazing such as ponds or gravel roads) from the calcu-lation for a more accurate stocking rate. The percent of usable acres is an estimate determined by the land manager.
__________ % of my land is available for grazing
__________allowable forage x _______% grazeable land = __________available forage (lbs/year)
Determine the lbs of forage needed by one standard animal unit (AU) per year.
I want to graze __________(animal type) which has an average weight of __________lbs
Use 10,950 lbs/year animal demand (AD) for animals units (AU) weighting 1,000lbs. Use the following two calculations to determine the animal units equivalents (AUE) for animals not weighting 1,000 lbs. There is also a convenient animal unit equivalents chart of common species on the next page.
__________ lbs (animal body weight) ÷ 1,000 = __________AUE
__________ AUE x 10,950 = __________ AD (lbs/AU/year)
__________ available forage ÷ __________ AD = _________ Stocking rate (AU/property/year)

AcronymsAD- Animal demandAU- Animal unitAUE- Animal unit equivalentLCL- Lower confidence limit UCL- Upper confidence limit VOI- Visual obstruction index
Reference Sheet
VOI Pounds/Acre
LCL UCL VOI Pounds/Acre
LCL UCL
1 598 477 719 13 2,709 2,465 2,953
2 774 642 905 14 2,885 2,631 3,139
3 950 808 1,091 15 3,061 2,797 3,325
4 1,126 974 1,277 16 3,237 2,962 3,511
5 1,301 1,140 1,463 17 3,412 3,128 3,697
6 1,477 1,305 1,650 18 3,588 3,294 3,883
7 1,653 1,471 1,836 19 3,764 3,459 4,069
8 1,829 1,637 2,022 20 3,940 3,625 4,255
9 2,005 1,802 2,208 21 4,116 3,791 4,442
10 2,181 1,968 2,394 22 4,292 3,957 4,628
11 2,357 2,134 2,580 23 4,468 4,122 4,814
12 2,533 2,300 2,766 24 4,644 4,288 5,000
Visual Obstruction Index Conversion Chart
Animal Unit Equivalents
Steps to Obtaining Plant Biomass
Animal Unit Body Weights (pounds) Animal Unit Equivalents Equivalent Number of Head
Cow 1,000 1.00 1Horse 1,100 1.27 1Domestic sheep 130 0.18 6 ewesBoer X Spanish Goat 125 0.19 5 nanniesWhite-tailed deer 100 0.13 7 Mule deer 135 0.18 6Pronghorn 90 0.14 7
Steps Description
1. Place grid over a map of the management area (i.e., the pasture you wish to graze) and randomly select sampling points. The number of desired points will be determined by management area size and suggested sampling intensity.
2. Insert a modified yard stick tipped with a nail into the ground at the sampling point, with the stick resting vertically or have an assistant hold the yard stick with the bottom flush to the ground.
3. Step off 13 feet from the yard stick. While kneeling (eye approximately 1 yard above the ground), estimate VOI by looking for the point where you can no longer see the numbers on the stick. Repeat in 4 cardinal directions and average the values to obtain an overall VOI for each sampling point.
4. Average all VOIs for all sampling points in the study area to obtain a final VOI.
5. Using the conversion table, obtain an estimate of plant biomass (pounds forage/acre) based on the final VOI.
AuthorsBeau VoelkelTexas A&M University Department of Wildlife and Fisheries SciencesMichael Marshall, Project Coordinator Texas A&M Natural Resources Institute
Alison Lund, Program CoordinatorTexas A&M Natural Resources Institute
Amanda Gobeli, Extension AssociateTexas A&M Natural Resources Institute
Roel Lopez, DirectorTexas A&M Natural Resources Institute
External ReviewersRob Cook, Planned Consultation Manager and Pasture and Range ConsultantNoble Research Institute Jeff Goodwin, Conservation Stewardship Leader and Pasture and Range ConsultantNoble Research Institute
Photo Credits Cover, Bill Stanley Page 1, Andrew JamesPage 2, Dr. James CatheyPage 4, Beau VoelkelPage 6, Amanda Gobeli
Contact usTexas A&M Natural Resources Institute578 John Kimbrough Blvd.College Station, TX 77843979.845.1851 [email protected]