A simple device for in-situ direct shear and sinkage · PDF fileThis work introduces a simple...
13
A simple device for in-situ direct shear and sinkage tests A. Jerves, H. Ling, J. Gabaldon, M. Usoltceva, C. Coust´ e, A. Agarwal, R. Hurley & J. Andrade Division of Engineering & Applied Science, California Institute of Technology, Pasadena, CA 91125, USA Abstract This work introduces a simple device designed to perform in-situ direct shear and sinkage tests on granular materials as sand, clays, or regolith. It consists of a box nested within a larger box. Both have open bottoms, allowing them to be lowered into the material. Afterwards, two rotating plates on opposite sides of the outer box will rotate outwards in order to clear regolith on either side, providing room for the inner box to move relative to the plates and perform a shear test without the resistance of the surrounding soil. From this test, Coulomb parameters, including cohesion and internal friction angle, as well as, Bekker parameters can be infferred. This device has been designed for a laboratory setting, but with few modifications, could be put on the underside of a rover for use in a remote location. The goal behind this work is to ultimately create a compact, but accurate measuring tool to put onto a rover or any kind of exploratory vehicle to test for regolith properties of celestial bodies. 1
Transcript of A simple device for in-situ direct shear and sinkage · PDF fileThis work introduces a simple...
A simple device for in-situ direct shear and sinkage tests
A. Jerves, H. Ling, J. Gabaldon, M. Usoltceva, C. Couste, A. Agarwal, R. Hurley & J. Andrade
Division of Engineering & Applied Science, California Institute of Technology, Pasadena, CA 91125, USA
Abstract
This work introduces a simple device designed to perform in-situ direct shear and sinkage testson granular materials as sand, clays, or regolith. It consists of a box nested within a largerbox. Both have open bottoms, allowing them to be lowered into the material. Afterwards, tworotating plates on opposite sides of the outer box will rotate outwards in order to clear regolithon either side, providing room for the inner box to move relative to the plates and perform ashear test without the resistance of the surrounding soil. From this test, Coulomb parameters,including cohesion and internal friction angle, as well as, Bekker parameters can be infferred.This device has been designed for a laboratory setting, but with few modifications, could beput on the underside of a rover for use in a remote location. The goal behind this work is toultimately create a compact, but accurate measuring tool to put onto a rover or any kind ofexploratory vehicle to test for regolith properties of celestial bodies.
1
1 Introduction
Currently, the standard method for testing shear strength from a remote location, such as, on arover, as described in [1], is to use a component of the wheel itself. The advantage here is that ittakes up no space on the rover’s body. However, testing with the wheel generates noisy data, andcauses a loss of cohesion within the soil. Therefore, great efforts are required in an attempt to recoveran accurate data and infer cohesion. The advantage of the device herein described is its compactnature and low requirement of energy. Although, it is slightly less space efficient, the nature ofthe data that can be obtained and inferred from the mentioned device is crucial for unraveling thegeological history, overcoming exploratory difficulties, landing vehicles, and developing any kind ofinfrastructure on celestial bodies.
2 Experimental Setup
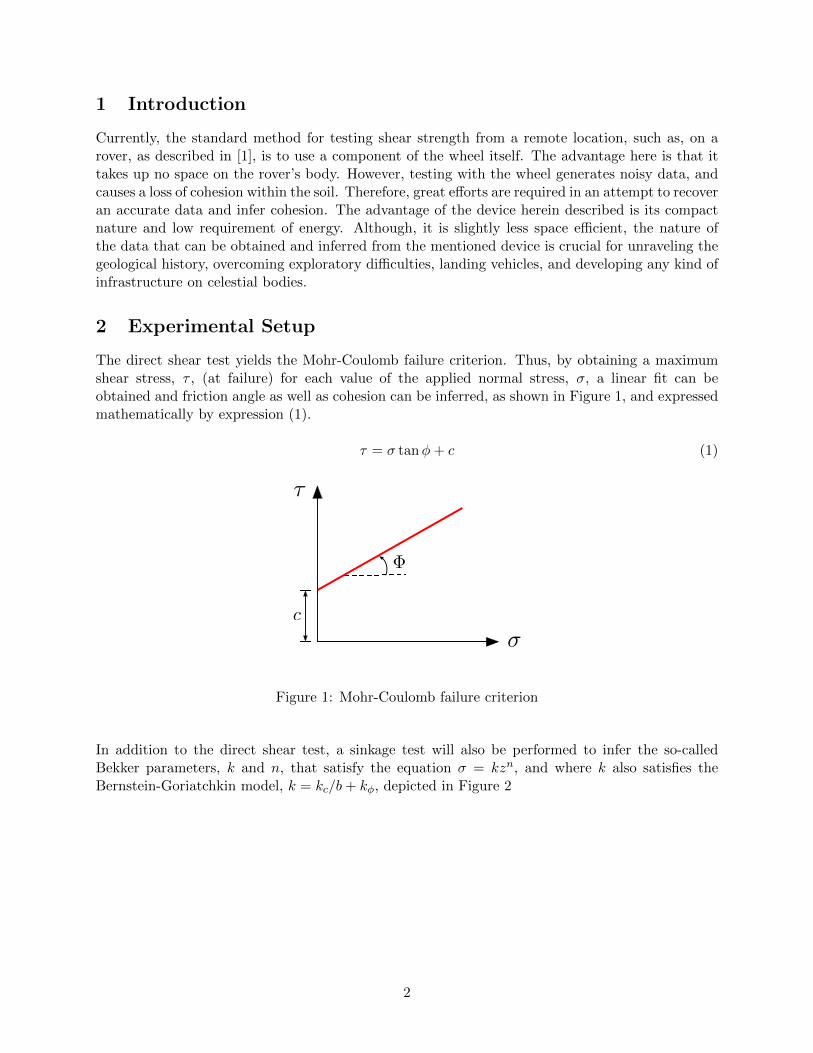
The direct shear test yields the Mohr-Coulomb failure criterion. Thus, by obtaining a maximumshear stress, τ , (at failure) for each value of the applied normal stress, σ, a linear fit can beobtained and friction angle as well as cohesion can be inferred, as shown in Figure 1, and expressedmathematically by expression (1).
τ = σ tanφ+ c (1)
�
⌧
�c
Figure 1: Mohr-Coulomb failure criterion
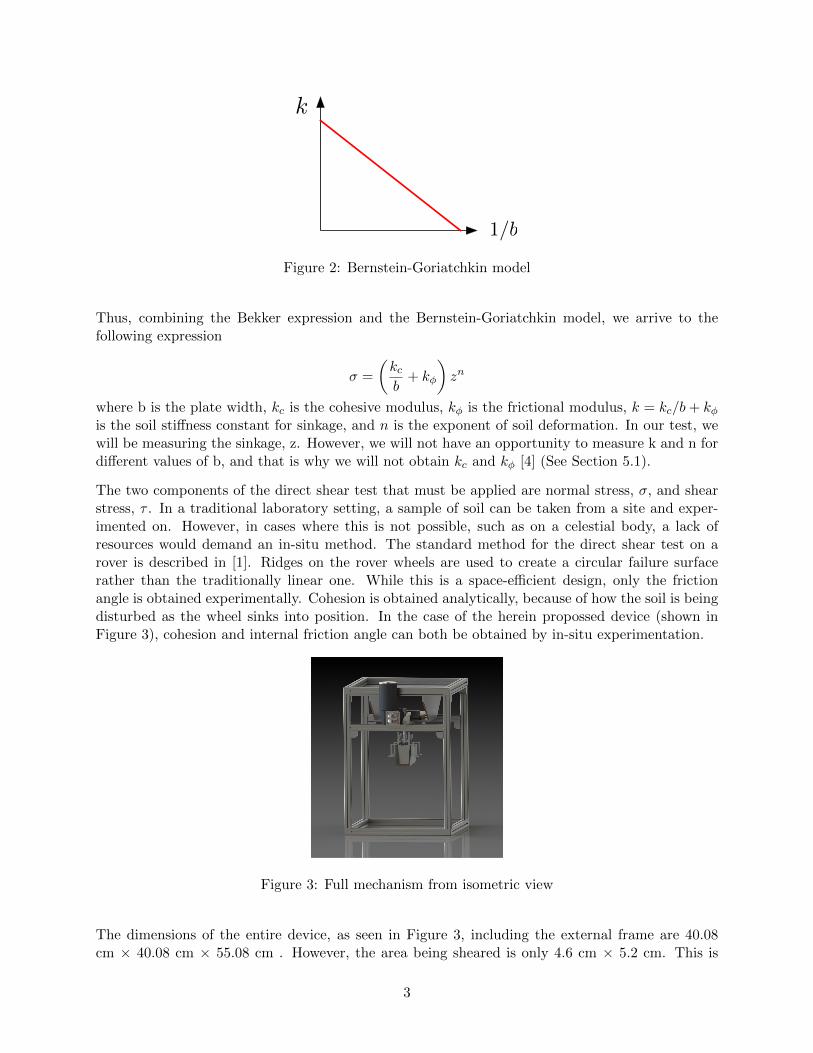
In addition to the direct shear test, a sinkage test will also be performed to infer the so-calledBekker parameters, k and n, that satisfy the equation σ = kzn, and where k also satisfies theBernstein-Goriatchkin model, k = kc/b+ kφ, depicted in Figure 2
2
1/b
k
Figure 2: Bernstein-Goriatchkin model
Thus, combining the Bekker expression and the Bernstein-Goriatchkin model, we arrive to thefollowing expression
σ =
(kcb
+ kφ
)zn
where b is the plate width, kc is the cohesive modulus, kφ is the frictional modulus, k = kc/b+ kφis the soil stiffness constant for sinkage, and n is the exponent of soil deformation. In our test, wewill be measuring the sinkage, z. However, we will not have an opportunity to measure k and n fordifferent values of b, and that is why we will not obtain kc and kφ [4] (See Section 5.1).
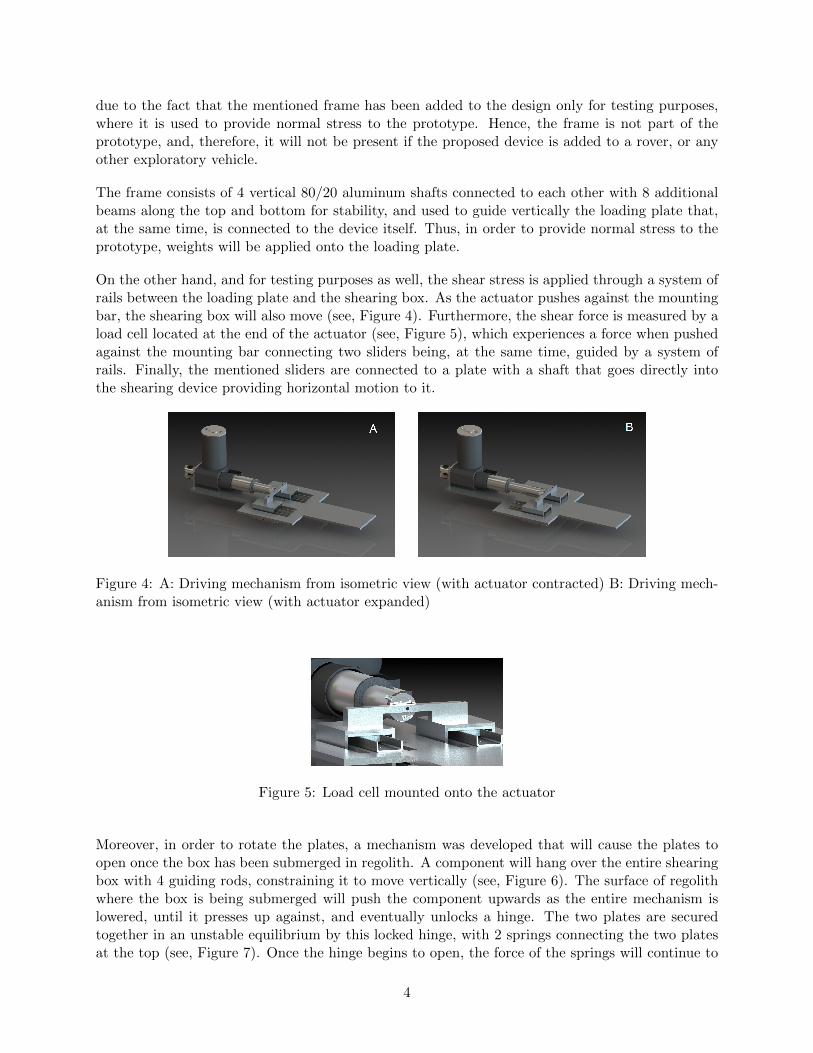
The two components of the direct shear test that must be applied are normal stress, σ, and shearstress, τ . In a traditional laboratory setting, a sample of soil can be taken from a site and exper-imented on. However, in cases where this is not possible, such as on a celestial body, a lack ofresources would demand an in-situ method. The standard method for the direct shear test on arover is described in [1]. Ridges on the rover wheels are used to create a circular failure surfacerather than the traditionally linear one. While this is a space-efficient design, only the frictionangle is obtained experimentally. Cohesion is obtained analytically, because of how the soil is beingdisturbed as the wheel sinks into position. In the case of the herein propossed device (shown inFigure 3), cohesion and internal friction angle can both be obtained by in-situ experimentation.
Figure 3: Full mechanism from isometric view
The dimensions of the entire device, as seen in Figure 3, including the external frame are 40.08cm × 40.08 cm × 55.08 cm . However, the area being sheared is only 4.6 cm × 5.2 cm. This is
3
due to the fact that the mentioned frame has been added to the design only for testing purposes,where it is used to provide normal stress to the prototype. Hence, the frame is not part of theprototype, and, therefore, it will not be present if the proposed device is added to a rover, or anyother exploratory vehicle.
The frame consists of 4 vertical 80/20 aluminum shafts connected to each other with 8 additionalbeams along the top and bottom for stability, and used to guide vertically the loading plate that,at the same time, is connected to the device itself. Thus, in order to provide normal stress to theprototype, weights will be applied onto the loading plate.
On the other hand, and for testing purposes as well, the shear stress is applied through a system ofrails between the loading plate and the shearing box. As the actuator pushes against the mountingbar, the shearing box will also move (see, Figure 4). Furthermore, the shear force is measured by aload cell located at the end of the actuator (see, Figure 5), which experiences a force when pushedagainst the mounting bar connecting two sliders being, at the same time, guided by a system ofrails. Finally, the mentioned sliders are connected to a plate with a shaft that goes directly intothe shearing device providing horizontal motion to it.
Figure 4: A: Driving mechanism from isometric view (with actuator contracted) B: Driving mech-anism from isometric view (with actuator expanded)
Figure 5: Load cell mounted onto the actuator
Moreover, in order to rotate the plates, a mechanism was developed that will cause the plates toopen once the box has been submerged in regolith. A component will hang over the entire shearingbox with 4 guiding rods, constraining it to move vertically (see, Figure 6). The surface of regolithwhere the box is being submerged will push the component upwards as the entire mechanism islowered, until it presses up against, and eventually unlocks a hinge. The two plates are securedtogether in an unstable equilibrium by this locked hinge, with 2 springs connecting the two platesat the top (see, Figure 7). Once the hinge begins to open, the force of the springs will continue to
4

pull it with enough force to clear the nearby regolith. Afterwards, the shearing mechanism will befree to move relative to the rotating plates (see, Appendix 6.2 - 6.3).
Figure 6: A: Opening mechanism from isometric view (closed) B: Opening mechanism from iso-metric view (open)
Figure 7: A: Shearing mechanism from side view (closed) B: Shearing mechanism from side view(open)
Finally, we allow the shearing unit to move independently with respect to the clearing plates by atrench in the horizontal plate to which the rotating flaps are connected (see, Figure 8). Once theclearing plates open, the shearing unit is free to move while the plates remain stationary. Oncethe entire mechanism is lifted out of the regolith and the plates are closed, the box will return toa default position because of the slots in the clearing plates. This design allows the mechanism toconsistently perform the test many times.
5
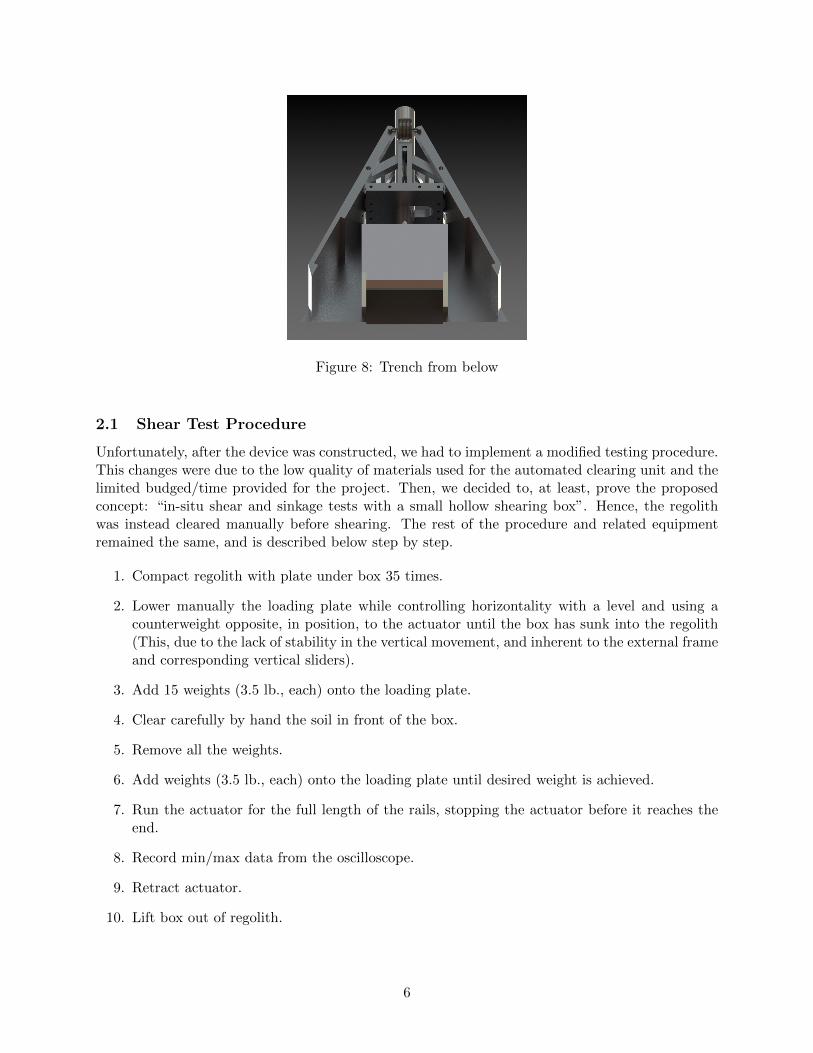
Figure 8: Trench from below
2.1 Shear Test Procedure
Unfortunately, after the device was constructed, we had to implement a modified testing procedure.This changes were due to the low quality of materials used for the automated clearing unit and thelimited budged/time provided for the project. Then, we decided to, at least, prove the proposedconcept: “in-situ shear and sinkage tests with a small hollow shearing box”. Hence, the regolithwas instead cleared manually before shearing. The rest of the procedure and related equipmentremained the same, and is described below step by step.
1. Compact regolith with plate under box 35 times.
2. Lower manually the loading plate while controlling horizontality with a level and using acounterweight opposite, in position, to the actuator until the box has sunk into the regolith(This, due to the lack of stability in the vertical movement, and inherent to the external frameand corresponding vertical sliders).
3. Add 15 weights (3.5 lb., each) onto the loading plate.
4. Clear carefully by hand the soil in front of the box.
5. Remove all the weights.
6. Add weights (3.5 lb., each) onto the loading plate until desired weight is achieved.
7. Run the actuator for the full length of the rails, stopping the actuator before it reaches theend.
8. Record min/max data from the oscilloscope.
9. Retract actuator.
10. Lift box out of regolith.
6
3 Tests and Results
Recalling, and as described in the previous sections of this document, we designed the proposeddevice to perform two types of tests: in-situ simple shear test, and in-situ sinkage test. As usual,the proposed model had to be built, and then tested in order to obtain and infer data that canbe compared to the data from other similar well-proven procedures and equipment and for a samekind of materials. Hence, for the tests, we used Mojave Mars Simulant with particles less than2mm in size (MMS<2mm), which was provided by JPL (NASA’s Jet Propulsion Laboratory at theCalifornia Institute of Technology).
The results of some of the test are explained and shown in the subsections below.
3.1 Direct Shear Test
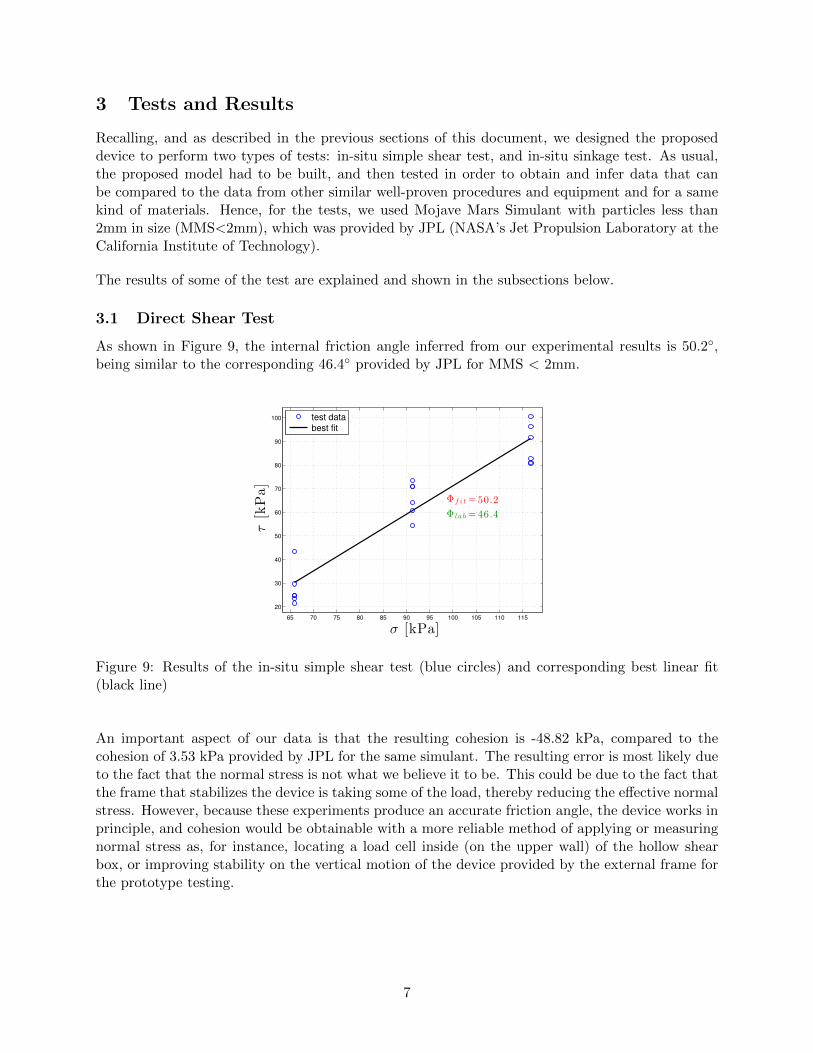
As shown in Figure 9, the internal friction angle inferred from our experimental results is 50.2◦,being similar to the corresponding 46.4◦ provided by JPL for MMS < 2mm.
65 70 75 80 85 90 95 100 105 110 115
20
30
40
50
60
70
80
90
100
σ [kPa]
τ[kPa]
Φf i t =50.2
Φ l a b=46.4
test data
best fit
Figure 9: Results of the in-situ simple shear test (blue circles) and corresponding best linear fit(black line)
An important aspect of our data is that the resulting cohesion is -48.82 kPa, compared to thecohesion of 3.53 kPa provided by JPL for the same simulant. The resulting error is most likely dueto the fact that the normal stress is not what we believe it to be. This could be due to the fact thatthe frame that stabilizes the device is taking some of the load, thereby reducing the effective normalstress. However, because these experiments produce an accurate friction angle, the device works inprinciple, and cohesion would be obtainable with a more reliable method of applying or measuringnormal stress as, for instance, locating a load cell inside (on the upper wall) of the hollow shearbox, or improving stability on the vertical motion of the device provided by the external frame forthe prototype testing.
7
3.2 Force vs. time and force vs. displacement
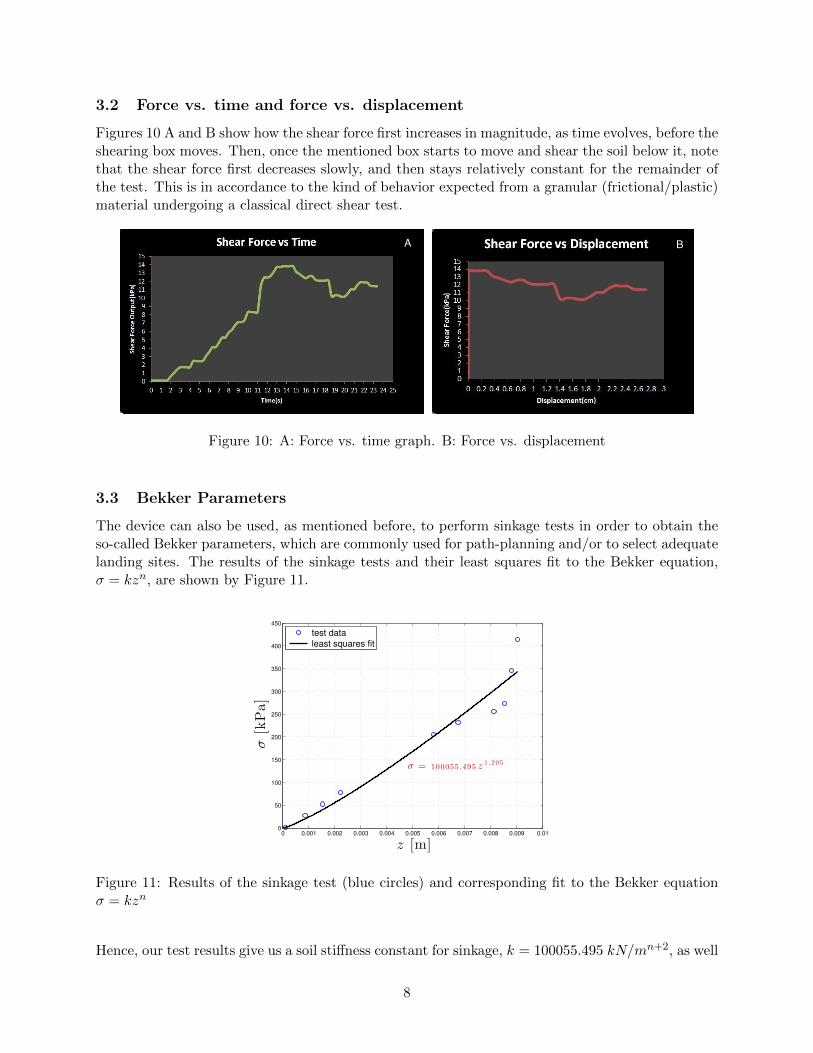
Figures 10 A and B show how the shear force first increases in magnitude, as time evolves, before theshearing box moves. Then, once the mentioned box starts to move and shear the soil below it, notethat the shear force first decreases slowly, and then stays relatively constant for the remainder ofthe test. This is in accordance to the kind of behavior expected from a granular (frictional/plastic)material undergoing a classical direct shear test.
A B
Figure 10: A: Force vs. time graph. B: Force vs. displacement
3.3 Bekker Parameters
The device can also be used, as mentioned before, to perform sinkage tests in order to obtain theso-called Bekker parameters, which are commonly used for path-planning and/or to select adequatelanding sites. The results of the sinkage tests and their least squares fit to the Bekker equation,σ = kzn, are shown by Figure 11.
0 0.001 0.002 0.003 0.004 0.005 0.006 0.007 0.008 0.009 0.010
50
100
150
200
250
300
350
400
450
z [m]
σ[kPa]
σ = 100055.495 z1 . 205
test data
least squares fit
Figure 11: Results of the sinkage test (blue circles) and corresponding fit to the Bekker equationσ = kzn
Hence, our test results give us a soil stiffness constant for sinkage, k = 100055.495 kN/mn+2, as well
8

as, an exponent of soil deformation, n=1.205. Unfortunately, so far, we have not been able to obtainofficial values of these parameters from JPL or any other University, laboratory, or publication, sowe cannot compare our data or calibrate our experimental setup. However, this is used as a proofof concept, to show that, in fact, an in-situ sinkage test can be performed using the device hereinproposed.
4 Conclusions
With the objective of inferring regolith properties of celestial bodies, a compact and efficient devicemust be designed in order to accommodate for the limited space and energy disposability in a roveror exploratory vehicle. The device has been designed with the intention of performing in-situ testson regolith or soil. While such a mechanism exists, it sacrifices accuracy for practicality. Thisdevice seeks to minimize the amount of space occupied, while still providing a higher degree ofreliability in results.
The most significant problems encountered in this study were of constructive type, and due tothe poor quality of the materials and procedures used to build the device. However, an improvedversion was designed and is presented in the videos on the website of the Keck Institute for SpaceStudies dedicated to this project: http://kiss.caltech.edu/study/regolith/. This improved versionincludes load cells placed inside of the shearing box. Additionally, a new external frame is designedfor improved linear vertical motion and strain control rather than force control.
Finally, the “in-situ simple shear test” concept and device was proven, obtaining a friction anglevalue similar to the provided by JPL for the regolith simulant, MMS<2mm, used for the tests ofthe proposed prototype. Hence, the device appears to work, and with the proposed improvementsmore consistent and automated measurements will be possible.
5 Acknowledgments
This work was possible thanks to the financial support of the Keck Institute for Space Studies(KISS), and the important contributions of Dr. Brian Trease, Dr. Matt Golombek, and Dr. JulieCastillo from the NASA’s Jet Propulsion Laboratory at the California Institute of Technology(JPL), who collaborated giving technical advise and providing regolith simulant (MMS<2mm) forthe experimental phase of the project.
9

6 Appendix
6.1 Bekker parameters approximation
6.1.1 Least squares
Let y = f(x, b) be a given function. On the other hand, as a result of m observations we have aseries of yµ, xµ values (µ=1, ... , m). Hence, we can compute:
yµ = f(xµ, b)
Then, a vector of residuals is defined by the difference:
eµ = yµ − yµ = yµ − f(xµ, b)
which, in its turn, is a function of the parameters b. Thus, the residual sum of squares (RSS) canbe minimized to obtain an approximation, b, of the mentioned parameters.
b = arg min RSS(b)
which can also be expressed as:
M(b) = RSS(b) = eTµeµ =m∑µ=1
(yµ − f(xµ, b))2
In the case of inferring Bekker parameters, σ = znk, we have
M(k, n) =
m∑µ=1
(σµ − znµk)2
Minimizing this last expression with respect to k and n
m∑µ=1
(σµ − znµk)znµ = 0
m∑µ=1
(σµ − znµk)znµ ln (zµ) = 0
so, we have a system of two equations with two unknowns. Hence, we have
k =
m∑µ=1
σµznµ
m∑µ=1
z2nµ
and,
f(n) =
m∑µ=1
z2nµ
m∑µ=1
σµznµ ln (zµ) −
m∑µ=1
σµznµ
m∑µ=1
z2nµ ln (zµ) = 0
with corresponding first derivative given by
10
f ′(n) =
m∑µ=1
z2nµ ln (zµ)
m∑µ=1
σµznµ ln (zµ) +
m∑µ=1
z2nµ
m∑µ=1
σµznµ ln2(zµ) − 2
m∑µ=1
σµznµ
m∑µ=1
z2nµ ln2(zµ)
Finally, since f(n) is a non-liner equation with no analytical solution, we use the Newton-Raphsonmethod to find its roots, as described in the following subsection.
6.1.2 The Newton-Raphson method
The Newton-Raphson is a method for finding successively better approximations to the roots,f(n) = 0, of a real-valued function f . A first educated guess, n0, for a root of f , starts the method.Then, the next approximation, n1, is given by
n1 = n0 −f(n0)
f ′(n0)
The process is iteratively repeated as:
ni+1 = ni −f(ni)
f ′(ni)
until an “accurate enough” value is reached. This method has quadratic convergence, as long as,the first approximation is chosen correctly enough. Otherwise, the method may fail to converge.
6.2 Displacement of regolith by rotating panels
6.2.1 Calculation of the force required to displace regolith
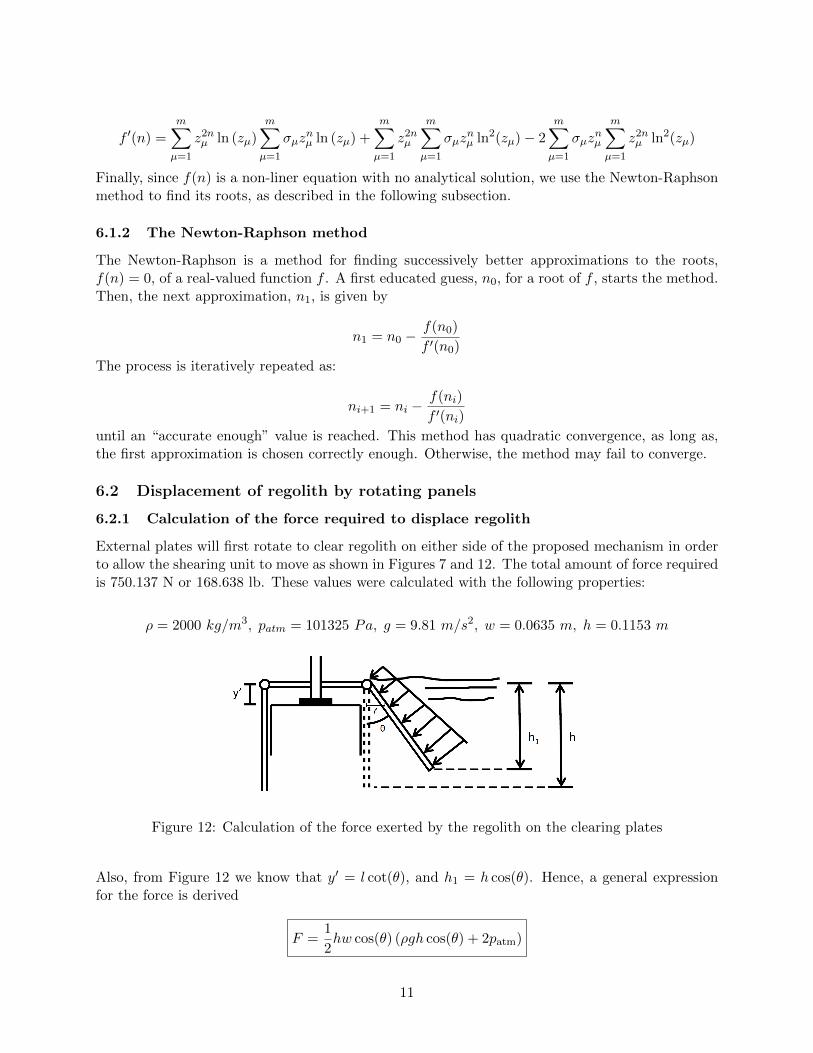
External plates will first rotate to clear regolith on either side of the proposed mechanism in orderto allow the shearing unit to move as shown in Figures 7 and 12. The total amount of force requiredis 750.137 N or 168.638 lb. These values were calculated with the following properties:
ρ = 2000 kg/m3, patm = 101325 Pa, g = 9.81 m/s2, w = 0.0635 m, h = 0.1153 m
Figure 12: Calculation of the force exerted by the regolith on the clearing plates
Also, from Figure 12 we know that y′ = l cot(θ), and h1 = h cos(θ). Hence, a general expressionfor the force is derived
F =1
2hw cos(θ) (ρgh cos(θ) + 2patm)
11

6.3 Calculation of moment due to regolith
If we want to clear the regolith by rotating the clearing plates with respect to the top plate, themoment that the regolith exerts on them must be overcome. Based on our data, the length of themoment arm is 5.7862 cm.
6.3.1 Calculating the center of gravity of the displaced regolith
Finally, we compute the point at which the total force exerted by the regolith on the clearing platesis applied on them, based on the corresponding pressure prism as depicted by Figure 13.
Figure 13: Pressure prism produced by the regolith acting on the clearing walls (worst case scenario)
The point at which the total force is being applied can be computed from the following expression
yTAT = yrAr + ytAt
where, AT , Ar, and At are the areas of the total trapezoid (pressure prism), as well as, the rect-angle and triangle, respectively. In the same way yT , yr, and yt are the centers of masses of thecorresponding geometric figures. Hence, the trapezoids area is
AT =(ρgh+ 2patm)h
2
In the same way,
yTAT =h
2hpatm +
h
3
1
2ρghh
=h2
6(3patm + ρgh)
Hence,
yT =h
3
3patm + ρgh
2patm + ρgh
But we want the arm y′T = h− yT , so
y′T = h
(1 − 1
3
3ρatm + ρgh
2ρatm + ρgh
)
12
References
[1] R. Sullivan, R. Anderson, J. Biesiadecki, T. Bond, and H. Stewart. ”Cohesions, Friction An-gles, and Other Physical Properties of Martian Regolith from Mars Exploration Rover WheelTrenches and Wheel Scuffs.” Journal of Geophysical Research 116.E2 (2011): n. pag. Print.
[2] Bekker, Mieczysaw Gregory. Theory of Land Locomotion. Ann Arbor: Univ. of Michigan Pr.1956. Print
[3] Das, Braja M. Principles of Geotechnical Engineering. Pacific Grove, CA: BrooksCole/Thompson Learning 2002, Print
[4] Rashidi, Majid, and Keyvan Seyfi. ”Comparative Studies on Bekker and Upadhyaya Modelsfor Soil Pressure-Sinkage Behavior Prediction.” American-Eurasian Journal of Agricultural &Environmental Sciences. 3.1 (2008): 19-25. Print.
13