A ROUGH COLLAPSE ASSESSMENT OF EARTHQUAKE...
17
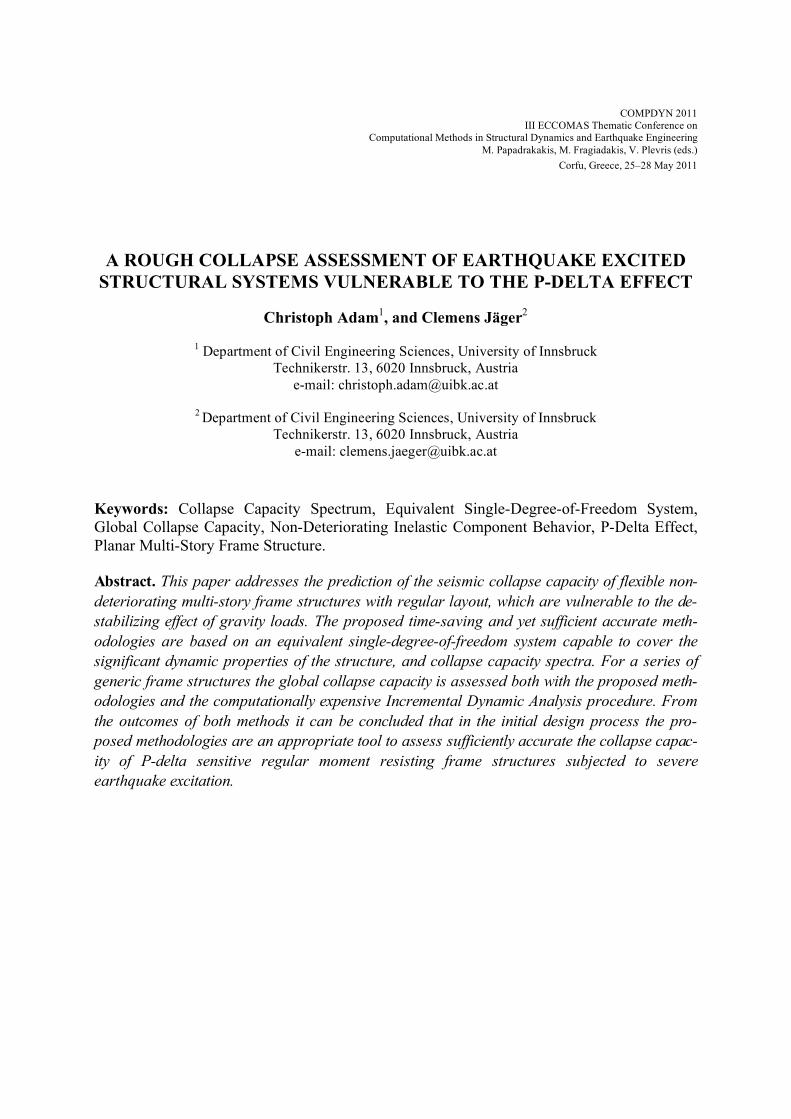
COMPDYN 2011 III ECCOMAS Thematic Conference on Computational Methods in Structural Dynamics and Earthquake Engineering M. Papadrakakis, M. Fragiadakis, V. Plevris (eds.) Corfu, Greece, 25–28 May 2011 A ROUGH COLLAPSE ASSESSMENT OF EARTHQUAKE EXCITED STRUCTURAL SYSTEMS VULNERABLE TO THE P-DELTA EFFECT Christoph Adam 1 , and Clemens Jäger 2 1 Department of Civil Engineering Sciences, University of Innsbruck Technikerstr. 13, 6020 Innsbruck, Austria e-mail: [email protected] 2 Department of Civil Engineering Sciences, University of Innsbruck Technikerstr. 13, 6020 Innsbruck, Austria e-mail: [email protected] Keywords: Collapse Capacity Spectrum, Equivalent Single-Degree-of-Freedom System, Global Collapse Capacity, Non-Deteriorating Inelastic Component Behavior, P-Delta Effect, Planar Multi-Story Frame Structure. Abstract. This paper addresses the prediction of the seismic collapse capacity of flexible non- deteriorating multi-story frame structures with regular layout, which are vulnerable to the de- stabilizing effect of gravity loads. The proposed time-saving and yet sufficient accurate meth- odologies are based on an equivalent single-degree-of-freedom system capable to cover the significant dynamic properties of the structure, and collapse capacity spectra. For a series of generic frame structures the global collapse capacity is assessed both with the proposed meth- odologies and the computationally expensive Incremental Dynamic Analysis procedure. From the outcomes of both methods it can be concluded that in the initial design process the pro- posed methodologies are an appropriate tool to assess sufficiently accurate the collapse capac- ity of P-delta sensitive regular moment resisting frame structures subjected to severe earthquake excitation.
-
Upload
truongthuy -
Category
Documents
-
view
222 -
download
2
Transcript of A ROUGH COLLAPSE ASSESSMENT OF EARTHQUAKE...
COMPDYN 2011
III ECCOMAS Thematic Conference on
Computational Methods in Structural Dynamics and Earthquake Engineering
M. Papadrakakis, M. Fragiadakis, V. Plevris (eds.)
Corfu, Greece, 25–28 May 2011
A ROUGH COLLAPSE ASSESSMENT OF EARTHQUAKE EXCITED
STRUCTURAL SYSTEMS VULNERABLE TO THE P-DELTA EFFECT
Christoph Adam1, and Clemens Jäger
2
1 Department of Civil Engineering Sciences, University of Innsbruck
Technikerstr. 13, 6020 Innsbruck, Austria
e-mail: [email protected]
2 Department of Civil Engineering Sciences, University of Innsbruck
Technikerstr. 13, 6020 Innsbruck, Austria
e-mail: [email protected]
Keywords: Collapse Capacity Spectrum, Equivalent Single-Degree-of-Freedom System,
Global Collapse Capacity, Non-Deteriorating Inelastic Component Behavior, P-Delta Effect,
Planar Multi-Story Frame Structure.
Abstract. This paper addresses the prediction of the seismic collapse capacity of flexible non-
deteriorating multi-story frame structures with regular layout, which are vulnerable to the de-
stabilizing effect of gravity loads. The proposed time-saving and yet sufficient accurate meth-
odologies are based on an equivalent single-degree-of-freedom system capable to cover the
significant dynamic properties of the structure, and collapse capacity spectra. For a series of
generic frame structures the global collapse capacity is assessed both with the proposed meth-
odologies and the computationally expensive Incremental Dynamic Analysis procedure. From
the outcomes of both methods it can be concluded that in the initial design process the pro-
posed methodologies are an appropriate tool to assess sufficiently accurate the collapse capac-
ity of P-delta sensitive regular moment resisting frame structures subjected to severe
earthquake excitation.
Christoph Adam, and Clemens Jäger
2
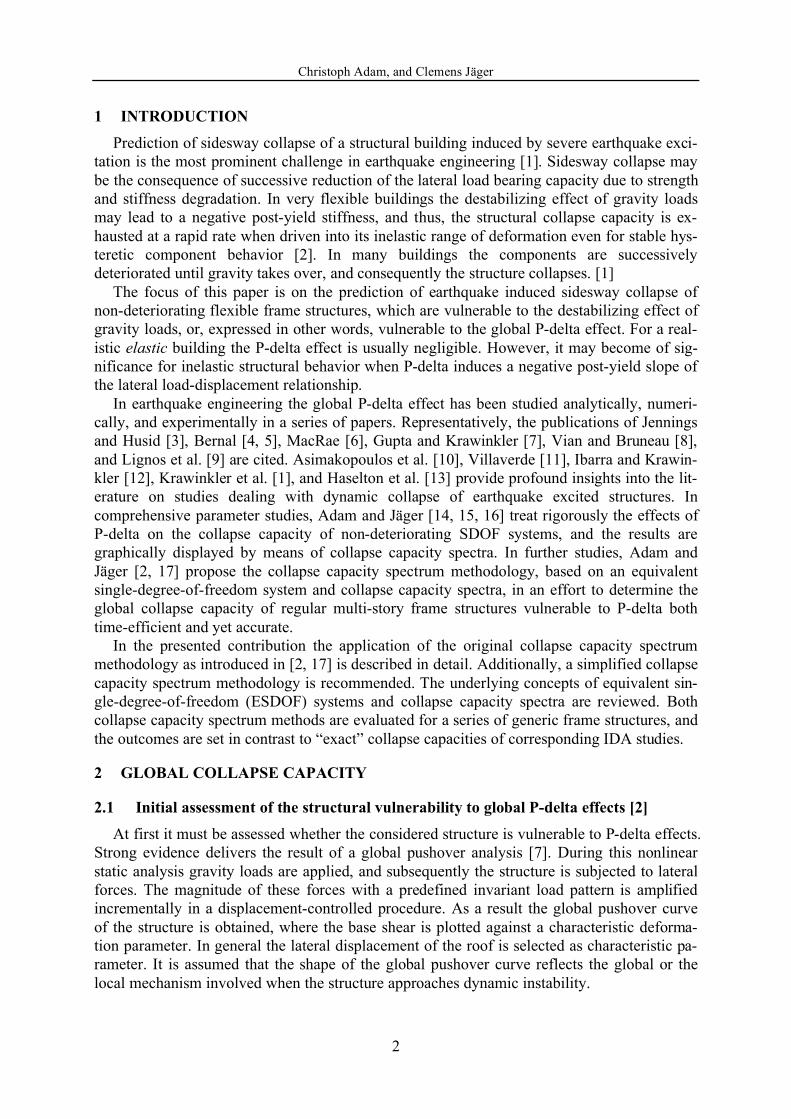
1 INTRODUCTION
Prediction of sidesway collapse of a structural building induced by severe earthquake exci-
tation is the most prominent challenge in earthquake engineering [1]. Sidesway collapse may
be the consequence of successive reduction of the lateral load bearing capacity due to strength
and stiffness degradation. In very flexible buildings the destabilizing effect of gravity loads
may lead to a negative post-yield stiffness, and thus, the structural collapse capacity is ex-
hausted at a rapid rate when driven into its inelastic range of deformation even for stable hys-
teretic component behavior [2]. In many buildings the components are successively
deteriorated until gravity takes over, and consequently the structure collapses. [1]
The focus of this paper is on the prediction of earthquake induced sidesway collapse of
non-deteriorating flexible frame structures, which are vulnerable to the destabilizing effect of
gravity loads, or, expressed in other words, vulnerable to the global P-delta effect. For a real-
istic elastic building the P-delta effect is usually negligible. However, it may become of sig-
nificance for inelastic structural behavior when P-delta induces a negative post-yield slope of
the lateral load-displacement relationship.
In earthquake engineering the global P-delta effect has been studied analytically, numeri-
cally, and experimentally in a series of papers. Representatively, the publications of Jennings
and Husid [3], Bernal [4, 5], MacRae [6], Gupta and Krawinkler [7], Vian and Bruneau [8],
and Lignos et al. [9] are cited. Asimakopoulos et al. [10], Villaverde [11], Ibarra and Krawin-
kler [12], Krawinkler et al. [1], and Haselton et al. [13] provide profound insights into the lit-
erature on studies dealing with dynamic collapse of earthquake excited structures. In
comprehensive parameter studies, Adam and Jäger [14, 15, 16] treat rigorously the effects of
P-delta on the collapse capacity of non-deteriorating SDOF systems, and the results are
graphically displayed by means of collapse capacity spectra. In further studies, Adam and
Jäger [2, 17] propose the collapse capacity spectrum methodology, based on an equivalent
single-degree-of-freedom system and collapse capacity spectra, in an effort to determine the
global collapse capacity of regular multi-story frame structures vulnerable to P-delta both
time-efficient and yet accurate.
In the presented contribution the application of the original collapse capacity spectrum
methodology as introduced in [2, 17] is described in detail. Additionally, a simplified collapse
capacity spectrum methodology is recommended. The underlying concepts of equivalent sin-
gle-degree-of-freedom (ESDOF) systems and collapse capacity spectra are reviewed. Both
collapse capacity spectrum methods are evaluated for a series of generic frame structures, and
the outcomes are set in contrast to “exact” collapse capacities of corresponding IDA studies.
2 GLOBAL COLLAPSE CAPACITY
2.1 Initial assessment of the structural vulnerability to global P-delta effects [2]
At first it must be assessed whether the considered structure is vulnerable to P-delta effects.
Strong evidence delivers the result of a global pushover analysis [7]. During this nonlinear
static analysis gravity loads are applied, and subsequently the structure is subjected to lateral
forces. The magnitude of these forces with a predefined invariant load pattern is amplified
incrementally in a displacement-controlled procedure. As a result the global pushover curve
of the structure is obtained, where the base shear is plotted against a characteristic deforma-
tion parameter. In general the lateral displacement of the roof is selected as characteristic pa-
rameter. It is assumed that the shape of the global pushover curve reflects the global or the
local mechanism involved when the structure approaches dynamic instability.
Christoph Adam, and Clemens Jäger
3
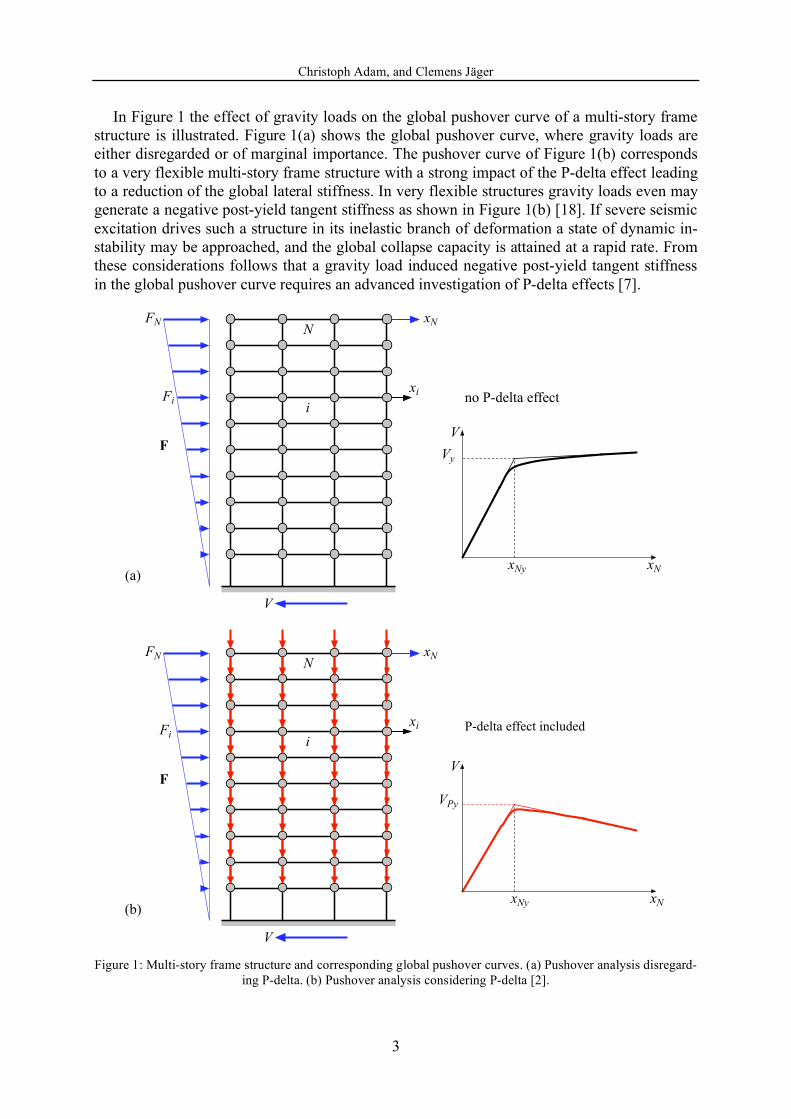
In Figure 1 the effect of gravity loads on the global pushover curve of a multi-story frame
structure is illustrated. Figure 1(a) shows the global pushover curve, where gravity loads are
either disregarded or of marginal importance. The pushover curve of Figure 1(b) corresponds
to a very flexible multi-story frame structure with a strong impact of the P-delta effect leading
to a reduction of the global lateral stiffness. In very flexible structures gravity loads even may
generate a negative post-yield tangent stiffness as shown in Figure 1(b) [18]. If severe seismic
excitation drives such a structure in its inelastic branch of deformation a state of dynamic in-
stability may be approached, and the global collapse capacity is attained at a rapid rate. From
these considerations follows that a gravity load induced negative post-yield tangent stiffness
in the global pushover curve requires an advanced investigation of P-delta effects [7].
V
xi
N
V
ino P-delta effect
(a)
(b)
xi
V
N
i
V
P-delta effect included
xN
xN
xNy
xNy
xN
xN
Vy
VPy
FN
Fi
FN
Fi
F
F
Figure 1: Multi-story frame structure and corresponding global pushover curves. (a) Pushover analysis disregard-
ing P-delta. (b) Pushover analysis considering P-delta [2].
Christoph Adam, and Clemens Jäger
4
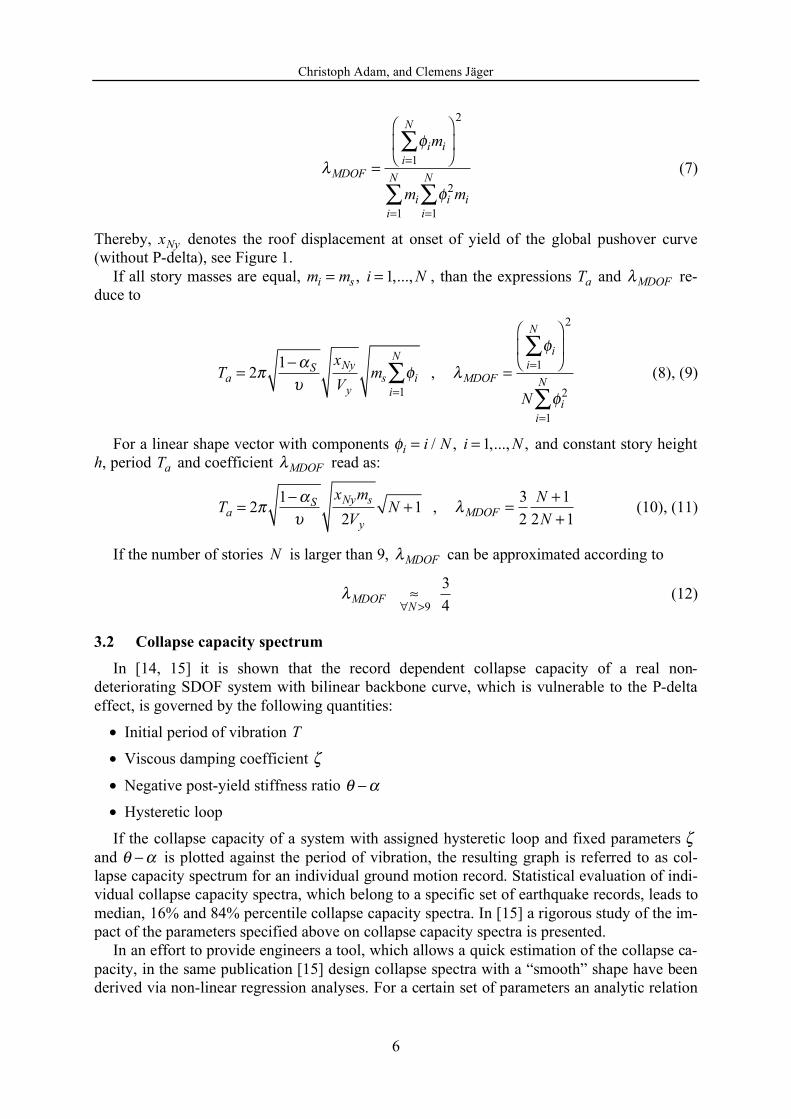
2.2 Assessment of the global collapse capacity
In the most general approach the Incremental Dynamic Analysis (IDA) procedure [19] is
applied to determine the smallest earthquake intensity, which leads to structural collapse [2].
Thereby, for one acceleration time history of an earthquake record dynamic time history
analyses are performed repeatedly, where in each subsequent run the intensity of the ground
motion is incremented. As an outcome a characteristic seismic intensity measure is plotted
against the corresponding maximum characteristic structural response quantity for each analy-
sis. The procedure is stopped when the response grows to infinity, i.e. structural failure occurs.
The corresponding intensity measure of the ground motion is referred to as collapse capacity
of the building for this specific ground motion record. There is no unique definition of inten-
sity of an earthquake record, however, the normalized 5% damped spectral acceleration at the
structure’s fundamental period Sa(T1) normalized by the product of the gravity of acceleration
g and the base shear coefficient , Sa(T1) / (g ), is widely accepted to characterize the inten-
sity appropriately. is defined as ratio between yield base shear Vy (from the pushover curve
without P-delta) and total weight W ( = Vy / W).
Since the result of an IDA study strongly depends on the selected record, IDAs are per-
formed for an entire set of n ground motion records, and the outcomes are evaluated statisti-
cally. In particular, the median of the sorted individual collapse capacities CCMDOF
i ,
i = 1,…, n, is considered as the representative collapse capacity for the examined structure
and the regarded set of ground motion records,
CCMDOF = med CCMDOF
i,i = 1,....,n ,
CCMDOFi
=Sa,i
gcollapse
(1)
Further significant statistical values of the collapse capacity are 16% and 84% percentiles of
the individual outcomes, CCMDOF
16 and CCMDOF
p84, respectively.
The IDA procedure requires the numerical solution of the equations of motions in each
time step of each time history analysis, and as a consequence, is both time-consuming and
computationally expensive. Thus, in [2, 17] for regular multi-story frame structures the so-
called collapse capacity spectrum methodology has been proposed to obtain a quick but yet
accurate approximation of the collapse capacity without performing time history analyses.
The proposed methodology is based on the observation that the global P-delta effect is mainly
governed by the fundamental mode. This holds also true if higher modes play a significant
role in the dynamic structural response. Consequently, the collapse capacity is assessed utiliz-
ing an equivalent single-degree-of-freedom (ESDOF) system, and a collapse capacity spec-
trum [14, 15, 16]. This methodology is particular useful in engineering practice, because the
structure can be evaluated with respect to its seismic collapse capacity in the initial design
process.
3 FUNDAMENTALS OF THE COLLAPSE CAPACITY SPECTRUM
METHODOLOGIES
3.1 Equivalent single-degree-of-freedom system
The ESDOF system is based on a time-independent shape vector , which describes the
displacement vector x of the N-story MDOF frame structure regardless of its magnitude,
x = x
N ,
N= 1 (2)
Christoph Adam, and Clemens Jäger
5
and on global pushover curves of the MDOF structure disregarding and considering gravity
loads. In the corresponding pushover analyses the lateral load pattern must be selected to be
affine to the displacement vector x ,
F = FN
(3)
and thus to the shape vector . xN
denotes the roof displacement, and FN
is the peak magni-
tude of the pushover load at the top of the frame structure, see Figure 1. The components i
of the shape vector and the story masses m
i, i = 1,..., N , of the MDOF structure enter mass
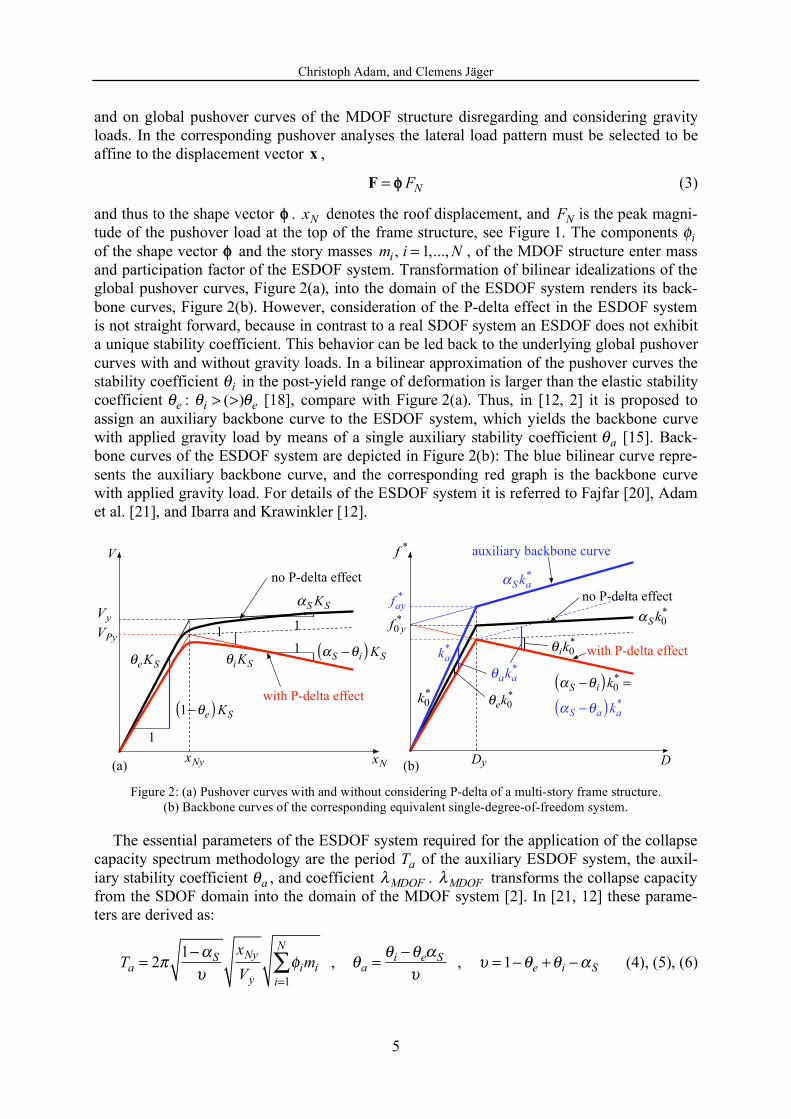
and participation factor of the ESDOF system. Transformation of bilinear idealizations of the
global pushover curves, Figure 2(a), into the domain of the ESDOF system renders its back-
bone curves, Figure 2(b). However, consideration of the P-delta effect in the ESDOF system
is not straight forward, because in contrast to a real SDOF system an ESDOF does not exhibit
a unique stability coefficient. This behavior can be led back to the underlying global pushover
curves with and without gravity loads. In a bilinear approximation of the pushover curves the
stability coefficient i in the post-yield range of deformation is larger than the elastic stability
coefficient e
: i
> (>)e [18], compare with Figure 2(a). Thus, in [12, 2] it is proposed to
assign an auxiliary backbone curve to the ESDOF system, which yields the backbone curve
with applied gravity load by means of a single auxiliary stability coefficient a
[15]. Back-
bone curves of the ESDOF system are depicted in Figure 2(b): The blue bilinear curve repre-
sents the auxiliary backbone curve, and the corresponding red graph is the backbone curve
with applied gravity load. For details of the ESDOF system it is referred to Fajfar [20], Adam
et al. [21], and Ibarra and Krawinkler [12].
DDy
auxiliary backbone curve
no P-delta effect
with P-delta effect
fay*
f0 y*
f *
θik0*
θek0*
θaka*
ka*
k0*
αS −θi( )k0* =αS −θa( )ka*
αSka*
αSk0*
1
1
V
no P-delta effect
with P-delta effect
11αS −θi( )KS
1−θe( )KS
VPy
θeKS θiKS
αSKS
xNy xN(a) (b)
Vy
Figure 2: (a) Pushover curves with and without considering P-delta of a multi-story frame structure.
(b) Backbone curves of the corresponding equivalent single-degree-of-freedom system.
The essential parameters of the ESDOF system required for the application of the collapse
capacity spectrum methodology are the period T
a of the auxiliary ESDOF system, the auxil-
iary stability coefficient a
, and coefficient MDOF .
MDOF transforms the collapse capacity
from the SDOF domain into the domain of the MDOF system [2]. In [21, 12] these parame-
ters are derived as:
Ta = 21 S
xNy
Vyimi
i=1
N
,
a =i e S ,
= 1 e + i S (4), (5), (6)
Christoph Adam, and Clemens Jäger
6
MDOF =
imi
i=1
N2
mi
i=1
N
i
2mi
i=1
N (7)
Thereby, xNy denotes the roof displacement at onset of yield of the global pushover curve
(without P-delta), see Figure 1.
If all story masses are equal, m
i= m
s, i = 1,..., N , than the expressions
T
a and
MDOF re-
duce to
Ta = 21 S
xNy
Vy
ms i
i=1
N
,
MDOF =
i
i=1
N2
N i
2
i=1
N (8), (9)
For a linear shape vector with components i
= i / N , i = 1,..., N , and constant story height
h, period T
a and coefficient
MDOF read as:
Ta = 21 S
xNyms
2VyN +1 ,
MDOF =
3
2
N +1
2N +1 (10), (11)
If the number of stories N is larger than 9, MDOF can be approximated according to
MDOFN>9
3
4 (12)
3.2 Collapse capacity spectrum
In [14, 15] it is shown that the record dependent collapse capacity of a real non-
deteriorating SDOF system with bilinear backbone curve, which is vulnerable to the P-delta
effect, is governed by the following quantities:
• Initial period of vibration T
• Viscous damping coefficient
• Negative post-yield stiffness ratio
• Hysteretic loop
If the collapse capacity of a system with assigned hysteretic loop and fixed parameters
and is plotted against the period of vibration, the resulting graph is referred to as col-
lapse capacity spectrum for an individual ground motion record. Statistical evaluation of indi-
vidual collapse capacity spectra, which belong to a specific set of earthquake records, leads to
median, 16% and 84% percentile collapse capacity spectra. In [15] a rigorous study of the im-
pact of the parameters specified above on collapse capacity spectra is presented.
In an effort to provide engineers a tool, which allows a quick estimation of the collapse ca-
pacity, in the same publication [15] design collapse spectra with a “smooth” shape have been
derived via non-linear regression analyses. For a certain set of parameters an analytic relation
Christoph Adam, and Clemens Jäger
7
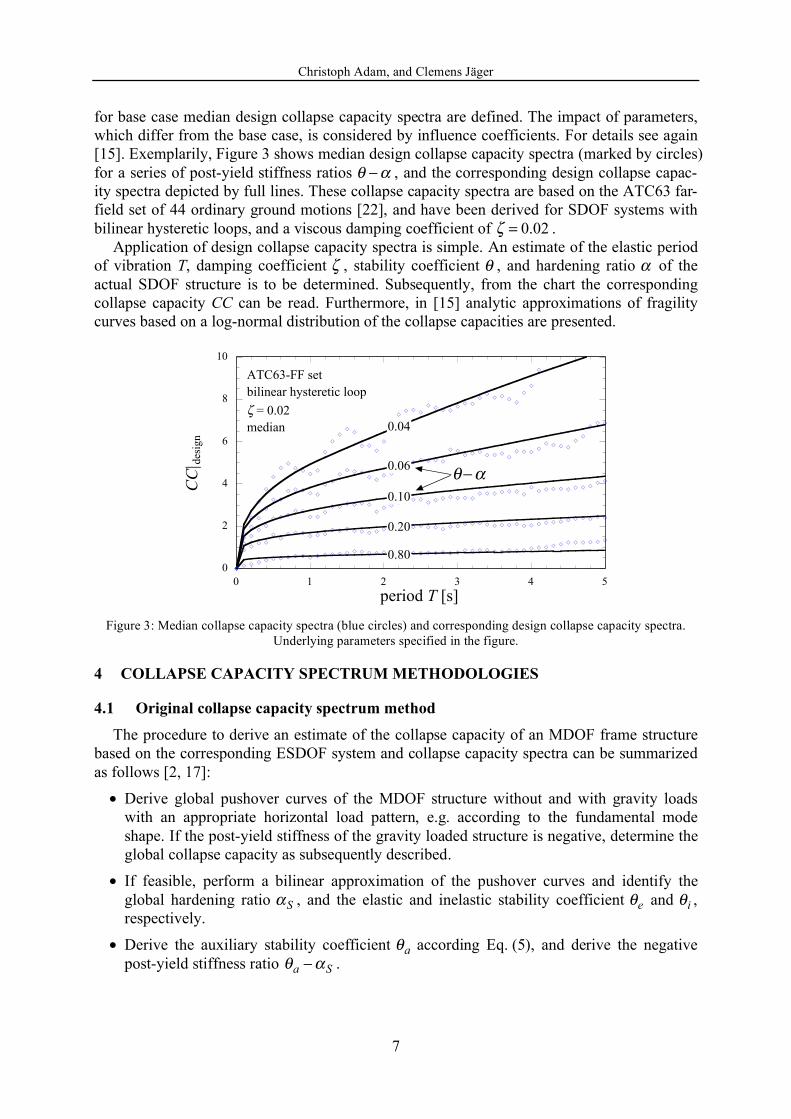
for base case median design collapse capacity spectra are defined. The impact of parameters,
which differ from the base case, is considered by influence coefficients. For details see again
[15]. Exemplarily, Figure 3 shows median design collapse capacity spectra (marked by circles)
for a series of post-yield stiffness ratios , and the corresponding design collapse capac-
ity spectra depicted by full lines. These collapse capacity spectra are based on the ATC63 far-
field set of 44 ordinary ground motions [22], and have been derived for SDOF systems with
bilinear hysteretic loops, and a viscous damping coefficient of = 0.02 .
Application of design collapse capacity spectra is simple. An estimate of the elastic period
of vibration T, damping coefficient , stability coefficient , and hardening ratio of the
actual SDOF structure is to be determined. Subsequently, from the chart the corresponding
collapse capacity CC can be read. Furthermore, in [15] analytic approximations of fragility
curves based on a log-normal distribution of the collapse capacities are presented.
0
2
4
6
8
10
0 1 2 3 4 5
= 0.02
bilinear hysteretic loop
period T [s]
CC| d
esig
n
ATC63-FF set
median
0.80
0.20
0.10
0.06
0.04
Figure 3: Median collapse capacity spectra (blue circles) and corresponding design collapse capacity spectra.
Underlying parameters specified in the figure.
4 COLLAPSE CAPACITY SPECTRUM METHODOLOGIES
4.1 Original collapse capacity spectrum method
The procedure to derive an estimate of the collapse capacity of an MDOF frame structure
based on the corresponding ESDOF system and collapse capacity spectra can be summarized
as follows [2, 17]:
• Derive global pushover curves of the MDOF structure without and with gravity loads
with an appropriate horizontal load pattern, e.g. according to the fundamental mode
shape. If the post-yield stiffness of the gravity loaded structure is negative, determine the
global collapse capacity as subsequently described.
• If feasible, perform a bilinear approximation of the pushover curves and identify the
global hardening ratio S , and the elastic and inelastic stability coefficient
e and
i,
respectively.
• Derive the auxiliary stability coefficient a
according Eq. (5), and derive the negative
post-yield stiffness ratio a S .
Christoph Adam, and Clemens Jäger
8
• Select the shape vector affine to the horizontal load pattern of the pushover analyses,
and derive the period Ta
of the auxiliary ESDOF system according to Eqs (4), (8), or
(10).
• Consult the appropriate design collapse capacity spectrum with respect to the underlying
ground motion set, viscous damping , hysteretic loop, and the negative post-yield stiff-
ness a S , and read at the period Ta
the median collapse capacity CC.
• Derive the coefficient MDOF according Eq. (7), (9), or (11) and transform CC into the
domain of the ESDOF system [2]:
CCESDOF =CC
MDOF
(13)
This outcome is an estimate of the actual median collapse capacity CCMDOF CCESDOF .
• If required, determine the 16% and 84% collapse capacities CCESDOF
p16 and
CCESDOF
p84, re-
spectively, in analogy to the relations for a real SDOF system as derived by Adam and
Jäger [15]:
CCESDOF
p16= CCESDOF / sl
* , sl
*(Ta ) =10
7Ta
1/20 (14, 15)
CCESDOF
p84= CCESDOFsu
* , su
*(Ta) =
3
2T
a
1/20 (16, 17)
• Assuming that the uncertainties in the collapse capacities follow a log-normal distribu-
tion derive the fragility curve from [15]
ln N (m, 2 ) (18)
with
m = ln CCESDOF( ) , = ln sl
*su* (19, 20)
4.2 Simplified collapse capacity spectrum method
In the following, a further simplification of the collapse capacity spectrum method for an
even faster assessment of the global collapse capacity is suggested.
Inspection of Eqs (4), (8), and (10) reveals that only for large stability coefficients, i.e.
a S >> 0 , the P-delta effect has a severe impact on the auxiliary period Ta
. However, for
flexible systems the gradient of collapse capacity spectra is small, if a S >> 0 , as it can
be seen from Figure 3. Consequently, the collapse capacity CC is not much affected, if an ap-
proximation of the period enters the collapse capacity spectrum. Thus, it is proposed that a
rough estimate of the fundamental structural period without taking account the gravity loads
can be utilized instead of the auxiliary period T
a. This period replaces
T
a in all relations of
the original collapse capacity spectrum methodology.
A second simplification concerns the negative post-yield stiffness ratio. It can be shown
that the auxiliary stability coefficient is always in-between the elastic and the inelastic stabil-
ity coefficient. Hence, i S is always larger than
a S . Assuming that i S is the
characteristic post-yield stiffness ratio, the corresponding collapse capacity estimation is more
Christoph Adam, and Clemens Jäger
9
conservative compared to the value based on a S . For a fast and rough assessment of the
collapse capacity the negative stiffness ratio derived according to i S may be utilized.
Finally, for an initial collapse assessment a transformation coefficient of MDOF = 3 / 4
may be employed, compare with Eq. (12).
5 EVALUATION OF THE COLLAPSE CAPACITY SPECTRUM
METHODOLOGIES
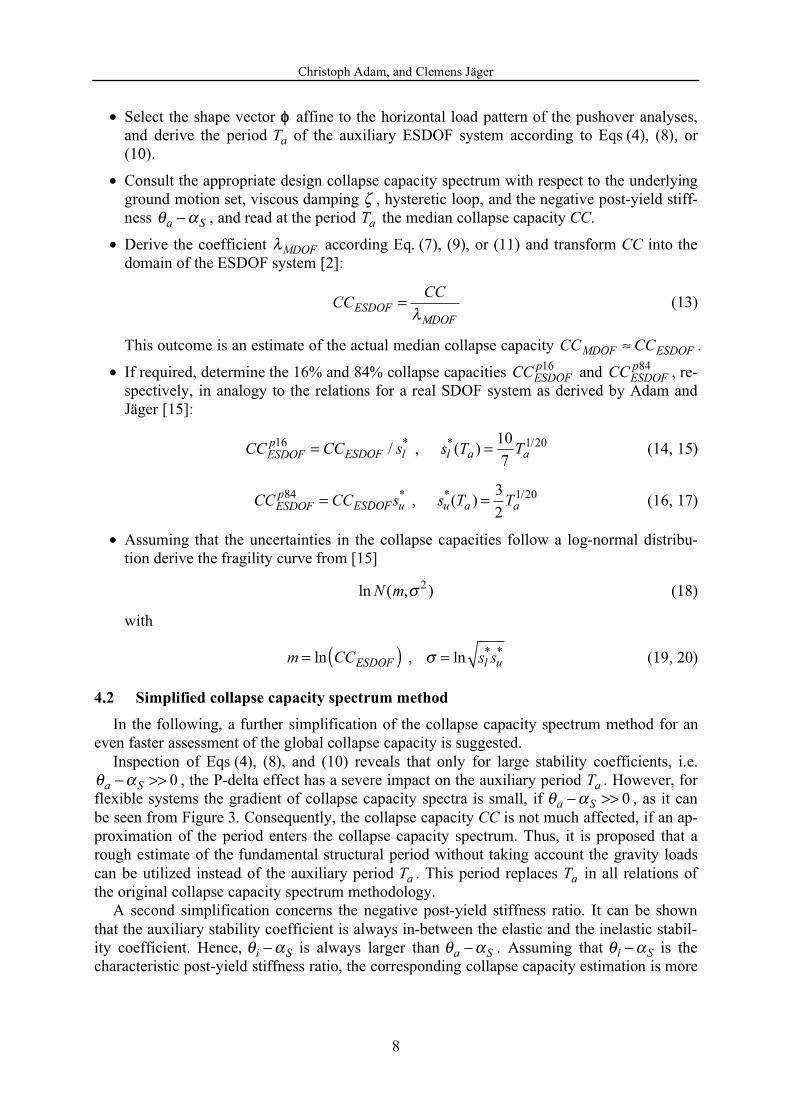
For several generic multi-story frame structures as depicted in Figure 4(a) the original col-
lapse capacity spectrum methodology and its simplified counterpart is evaluated setting its
results in contrast with the “exact” collapse capacity based on IDAs. All stories of the single-
bay structures of N stories are of uniform height h, and they are composed of rigid beams,
elastic flexible columns, and rotational springs at the ends of the beams. Nonlinear behavior at
the component level is modeled by non-degrading bilinear hysteretic behavior of the rota-
tional springs (compare with Figure 4(b)) to represent the global cyclic response under seis-
mic excitation. The strength of the springs is tuned such that yielding is initiated
simultaneously at all spring locations in a static pushover analysis (without gravity loads) un-
der an inverted triangular design load pattern. To each joint of the frames an identical point
mass mi/ 2 = m
s/ 2 , i = 1,..., N , is assigned. The bending stiffness of the columns and the
stiffness of the springs are tuned to render a straight line fundamental mode shape. Identical
gravity loads are assigned to each story to simulate P-delta effects. This implies that axial col-
umn forces due to gravity increase linearly from the top to the bottom of each frame. The
frame structures have a fundamental period of vibration of T1 = 0.2 N, which makes them
rather flexible.
N
i
rigidelastic
elasto-plastic
h
1
M
(b)(a)
xN
mS / 2
EJiKi
Ki
αKi
θ
mS / 2
mS / 2
Figure 4: (a) Planar generic multi-story frame structure. (b) Bilinear hysteretic loop of the rotational springs.
Christoph Adam, and Clemens Jäger
10
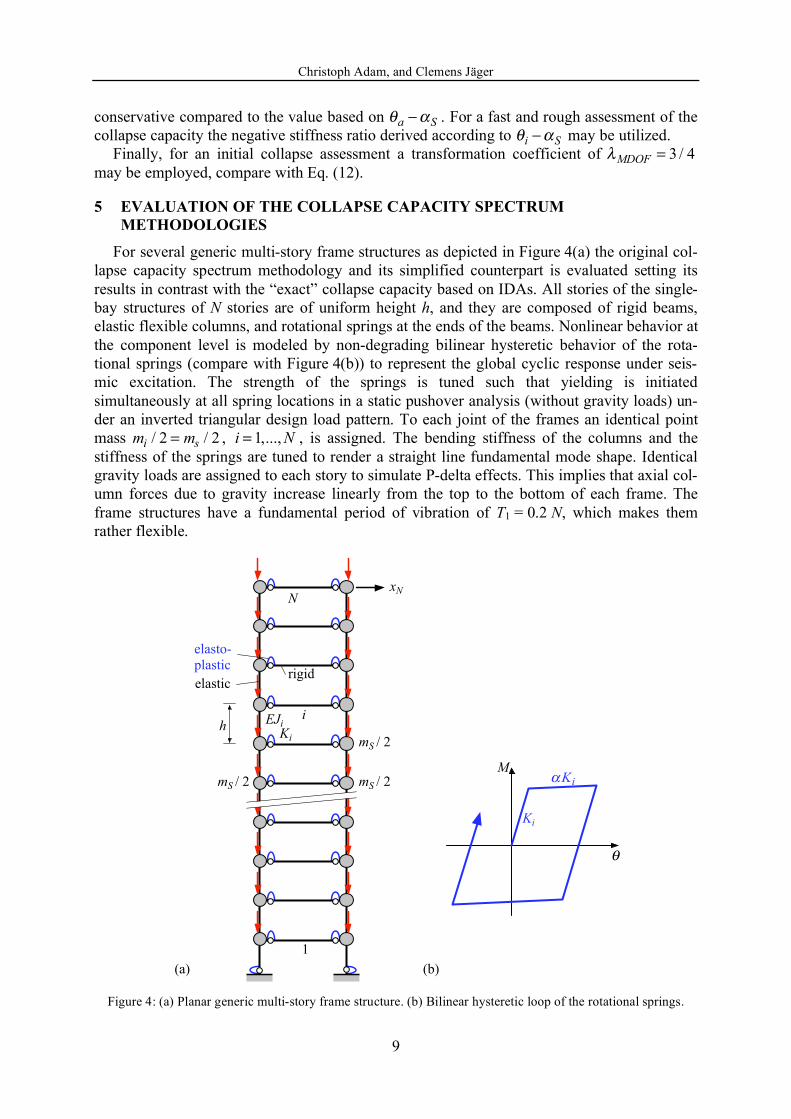
In a first example problem an 18-story frame structure is considered. The fundamental pe-
riod is T1 = 3.6 s. The hardening coefficient of all rotational springs is chosen to be = 0.01,
the ratio of dead load plus life load to dead load is = 1.0. Structural damping is considered
by means of mass and stiffness proportional Rayleigh damping of 2% of the first mode and
2% of that mode, where the sum of modal masses exceeds 95% of the total mass.
In Figure 5 the outcomes of an IDA procedure utilizing the 44 records of the ATC63-FF
set are shown. Each IDA curve displayed with light gray lines belongs to a specific record.
Thereby, the non-dimensional excitation intensity Sa / g( ) is plotted against the normalized
roof displacement xN / Sd . Sa and Sd are the spectral acceleration and spectral displacement,
respectively, at the period T = T1 of the 5% damped response spectrum of the considered re-
cord. The lowest intensity, where a specific IDA curve exhibits a horizontal tangent, is the
collapse capacity of the MDOF structure for the corresponding earthquake record. This figure
reveals the large record dependent dispersion of the individual collapse capacities. A blue fat
line represents the median IDA curve. From the results the “exact” median collapse capacity
of CCMDOF = 3.33 can be identified. Additionally, fat black lines correspond to the 16% per-
centile and 84% percentile IDA curves. The 16% percentile and 84% percentile collapse ca-
pacities are CCMDOF
16= 2.33 and
CCMDOF
84= 5.45 , respectively.
The assessment of the collapse capacity according to the collapse capacity spectrum meth-
odology requires the identification of the elastic and the inelastic stability coefficient, and the
global hardening ratio from global pushover curves without and with P-delta effect. The
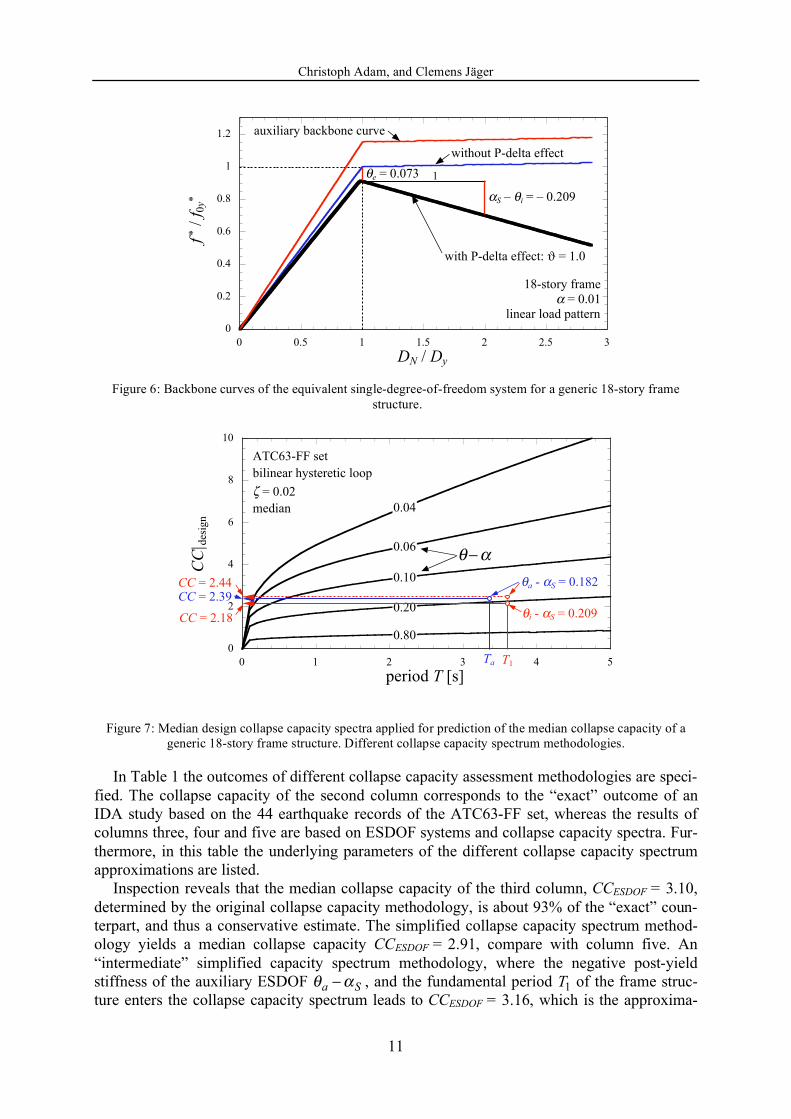
pushover curves of the structure are depicted in Figure 6. The parameters are determined as:
e = 0.073, i = 0.222, S = 0.013. Subsequent evaluation of Eqs (5) and (10) yields the auxil-
iary stability coefficient and the auxiliary period, respectively: a = 0.195, Ta = 3.35 s. The
transformation coefficient MDOF, Eq. (11), is derived as 0.770. The required post-yield stiff-
ness ratios are: a S = 0.182 ,
i S = 0.209 .
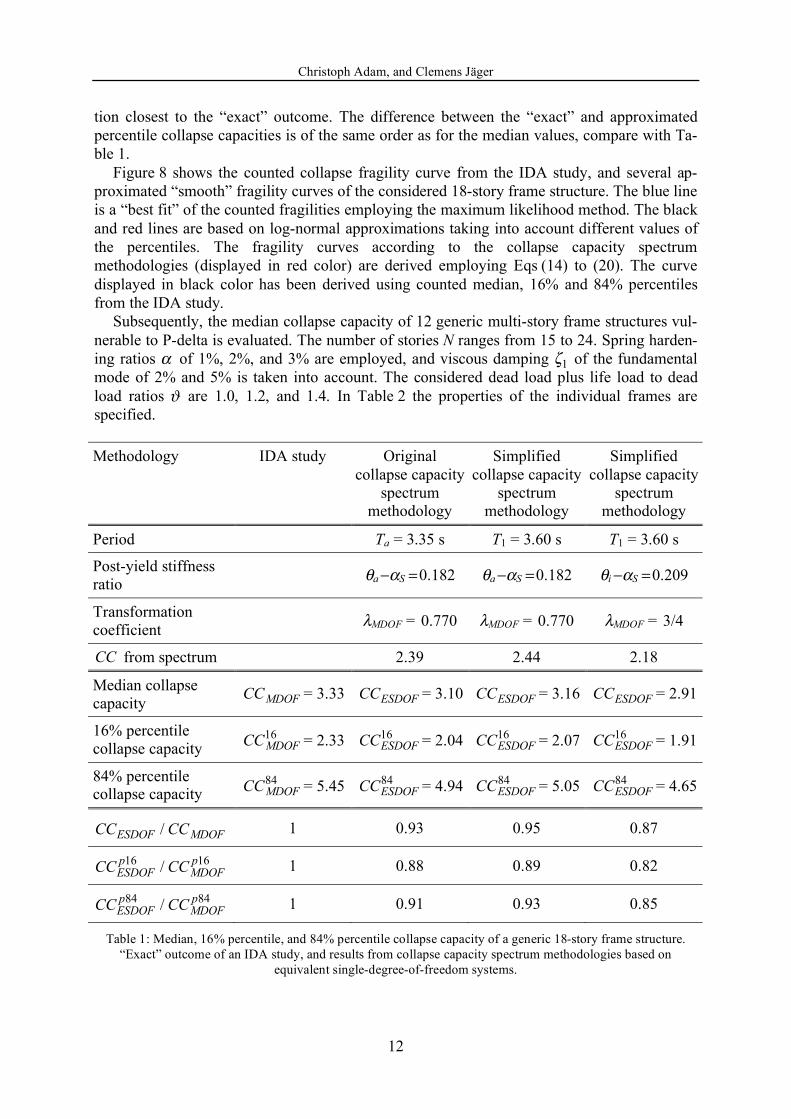
Figure 7 shows the utilized 2% damped median design collapse capacity spectra for bi-
linear hysteretic behavior and the ATC63-FF record set [15]. Herein, it is illustrated, how the
median collapse capacities for the proposed methodologies are determined.
0 1 2 3 4 5 6
0
1
2
3
4
5
6
xN / Sd
Sa
/ ( g
)
CCMDOF = 3.33
84% percentile
16% percentile
median
CCMDOF = 2.33
CCMDOF = 5.45
p16
p84
1 = 0.02
18-story frame
T1 = 3.6 s
= 1.0 = 0.01
Figure 5: IDA curves for 44 ground motions of the ATC63-FF set. Median, 16% percentile, and 84% percentile
IDA curves. Generic 18-story frame structure with a fundamental period of vibration of 3.6 s.
Christoph Adam, and Clemens Jäger
11
0
0.2
0.4
0.6
0.8
1
1.2
0 0.5 1 1.5 2 2.5 3
DN / Dy
f *
/ f
0y*
e = 0.073
S – i = – 0.209
1
without P-delta effect
with P-delta effect: = 1.0
18-story frame
= 0.01
linear load pattern
auxiliary backbone curve
Figure 6: Backbone curves of the equivalent single-degree-of-freedom system for a generic 18-story frame
structure.
0
2
4
6
8
10
0 1 2 3 4 5
= 0.02
bilinear hysteretic loop
period T [s]
CC| d
esig
n
ATC63-FF set
median
0.80
0.20
0.10
0.06
0.04
Ta T1
a - S = 0.182
i - S = 0.209
CC = 2.39CC = 2.44
CC = 2.18
Figure 7: Median design collapse capacity spectra applied for prediction of the median collapse capacity of a
generic 18-story frame structure. Different collapse capacity spectrum methodologies.
In Table 1 the outcomes of different collapse capacity assessment methodologies are speci-
fied. The collapse capacity of the second column corresponds to the “exact” outcome of an
IDA study based on the 44 earthquake records of the ATC63-FF set, whereas the results of
columns three, four and five are based on ESDOF systems and collapse capacity spectra. Fur-
thermore, in this table the underlying parameters of the different collapse capacity spectrum
approximations are listed.
Inspection reveals that the median collapse capacity of the third column, CCESDOF = 3.10,
determined by the original collapse capacity methodology, is about 93% of the “exact” coun-
terpart, and thus a conservative estimate. The simplified collapse capacity spectrum method-
ology yields a median collapse capacity CCESDOF = 2.91, compare with column five. An
“intermediate” simplified capacity spectrum methodology, where the negative post-yield
stiffness of the auxiliary ESDOF a S , and the fundamental period T1 of the frame struc-
ture enters the collapse capacity spectrum leads to CCESDOF = 3.16, which is the approxima-
Christoph Adam, and Clemens Jäger
12
tion closest to the “exact” outcome. The difference between the “exact” and approximated
percentile collapse capacities is of the same order as for the median values, compare with Ta-
ble 1.
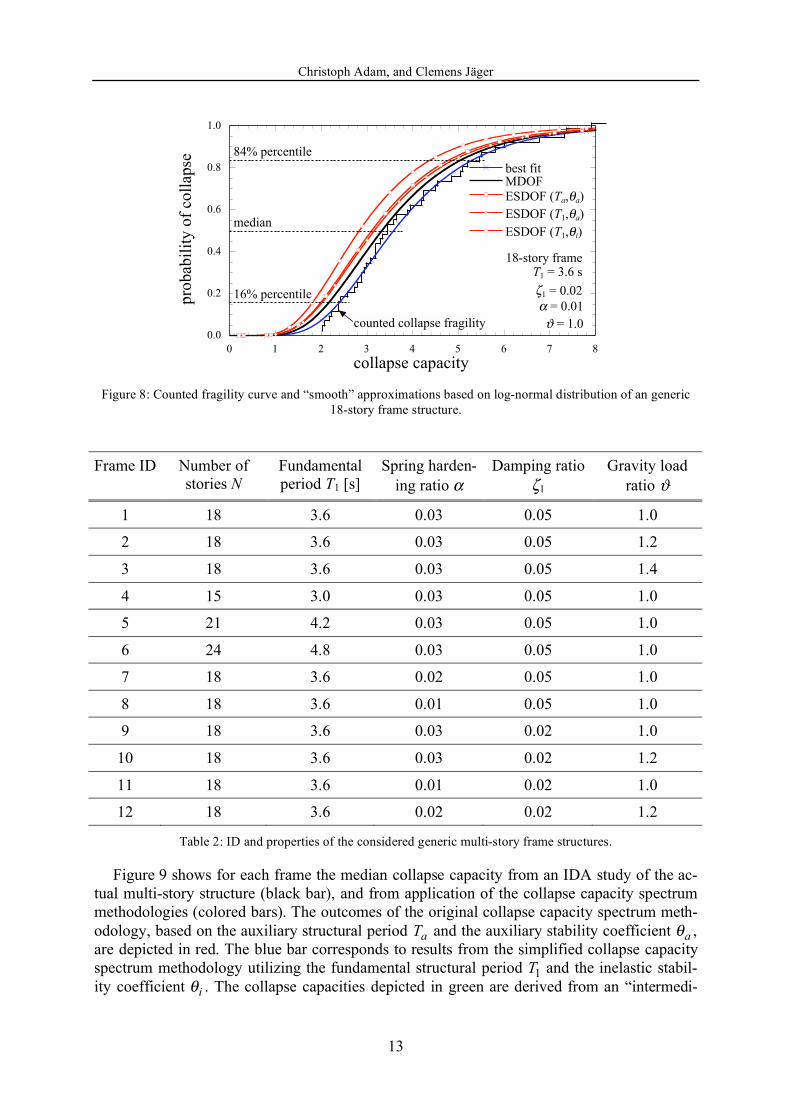
Figure 8 shows the counted collapse fragility curve from the IDA study, and several ap-
proximated “smooth” fragility curves of the considered 18-story frame structure. The blue line
is a “best fit” of the counted fragilities employing the maximum likelihood method. The black
and red lines are based on log-normal approximations taking into account different values of
the percentiles. The fragility curves according to the collapse capacity spectrum
methodologies (displayed in red color) are derived employing Eqs (14) to (20). The curve
displayed in black color has been derived using counted median, 16% and 84% percentiles
from the IDA study.
Subsequently, the median collapse capacity of 12 generic multi-story frame structures vul-
nerable to P-delta is evaluated. The number of stories N ranges from 15 to 24. Spring harden-
ing ratios of 1%, 2%, and 3% are employed, and viscous damping 1
of the fundamental
mode of 2% and 5% is taken into account. The considered dead load plus life load to dead
load ratios are 1.0, 1.2, and 1.4. In Table 2 the properties of the individual frames are
specified.
Methodology IDA study Original
collapse capacity
spectrum
methodology
Simplified
collapse capacity
spectrum
methodology
Simplified
collapse capacity
spectrum
methodology
Period Ta = 3.35 s T1 = 3.60 s T1 = 3.60 s
Post-yield stiffness
ratio
a S = 0.182 a S = 0.182 i S = 0.209
Transformation
coefficient
MDOF = 0.770 MDOF = 0.770 MDOF = 3/4
CC from spectrum 2.39 2.44 2.18
Median collapse
capacity CCMDOF = 3.33
CCESDOF = 3.10
CCESDOF = 3.16
CCESDOF = 2.91
16% percentile
collapse capacity CCMDOF
16 = 2.33 CCESDOF
16 = 2.04 CCESDOF
16 = 2.07 CCESDOF
16 = 1.91
84% percentile collapse capacity
CCMDOF84 = 5.45 CCESDOF
84 = 4.94 CCESDOF84 = 5.05 CCESDOF
84 = 4.65
CCESDOF / CCMDOF 1 0.93 0.95 0.87
CCESDOF
p16/ CCMDOF
p16 1 0.88 0.89 0.82
CCESDOF
p84/ CCMDOF
p84 1 0.91 0.93 0.85
Table 1: Median, 16% percentile, and 84% percentile collapse capacity of a generic 18-story frame structure.
“Exact” outcome of an IDA study, and results from collapse capacity spectrum methodologies based on
equivalent single-degree-of-freedom systems.
Christoph Adam, and Clemens Jäger
13
counted collapse fragility0.0
0.2
0.4
0.6
0.8
1.0
0 1 2 3 4 5 6 7 8
best fitMDOF
ESDOF (Ta, a)
ESDOF (T1, a)
ESDOF (T1, i)
collapse capacity
pro
bab
ilit
y o
f co
llap
se
84% percentile
median
16% percentile
18-story frameT1 = 3.6 s
1 = 0.02
= 0.01
= 1.0
Figure 8: Counted fragility curve and “smooth” approximations based on log-normal distribution of an generic
18-story frame structure.
Frame ID Number of
stories N
Fundamental
period T1 [s]
Spring harden-
ing ratio
Damping ratio
1
Gravity load
ratio
1 18 3.6 0.03 0.05 1.0
2 18 3.6 0.03 0.05 1.2
3 18 3.6 0.03 0.05 1.4
4 15 3.0 0.03 0.05 1.0
5 21 4.2 0.03 0.05 1.0
6 24 4.8 0.03 0.05 1.0
7 18 3.6 0.02 0.05 1.0
8 18 3.6 0.01 0.05 1.0
9 18 3.6 0.03 0.02 1.0
10 18 3.6 0.03 0.02 1.2
11 18 3.6 0.01 0.02 1.0
12 18 3.6 0.02 0.02 1.2
Table 2: ID and properties of the considered generic multi-story frame structures.
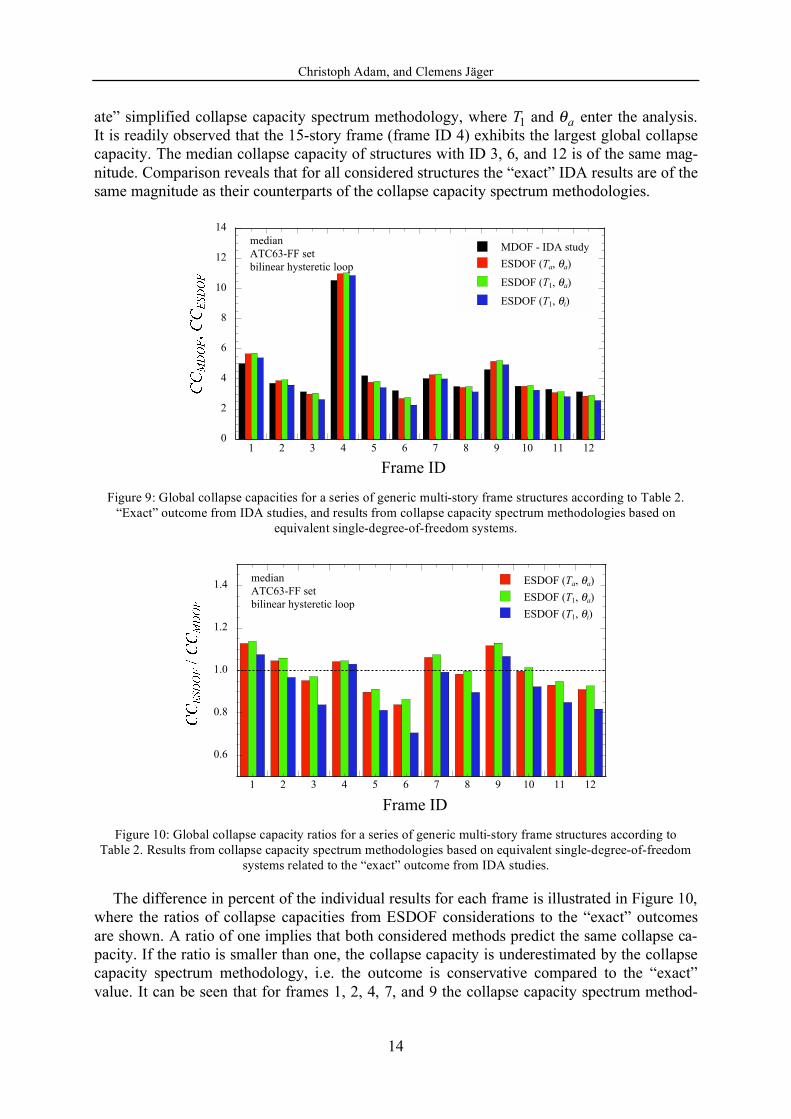
Figure 9 shows for each frame the median collapse capacity from an IDA study of the ac-
tual multi-story structure (black bar), and from application of the collapse capacity spectrum
methodologies (colored bars). The outcomes of the original collapse capacity spectrum meth-
odology, based on the auxiliary structural period T
a and the auxiliary stability coefficient
a,
are depicted in red. The blue bar corresponds to results from the simplified collapse capacity
spectrum methodology utilizing the fundamental structural period T
1 and the inelastic stabil-
ity coefficient i. The collapse capacities depicted in green are derived from an “intermedi-
Christoph Adam, and Clemens Jäger
14
ate” simplified collapse capacity spectrum methodology, where T
1 and
a enter the analysis.
It is readily observed that the 15-story frame (frame ID 4) exhibits the largest global collapse
capacity. The median collapse capacity of structures with ID 3, 6, and 12 is of the same mag-
nitude. Comparison reveals that for all considered structures the “exact” IDA results are of the
same magnitude as their counterparts of the collapse capacity spectrum methodologies.
0
2
4
6
8
10
12
14
MDOF - IDA study
ESDOF (Ta, a)
ESDOF (T1, a)
ESDOF (T1, i)
1 2 3 4 5 6 7 8 9 10 11 12
Frame ID
median
ATC63-FF set
bilinear hysteretic loop
Figure 9: Global collapse capacities for a series of generic multi-story frame structures according to Table 2.
“Exact” outcome from IDA studies, and results from collapse capacity spectrum methodologies based on
equivalent single-degree-of-freedom systems.
0.6
0.8
1.0
1.2
1.4
1 2 3 4 5 6 7 8 9 10 11 12
ESDOF (Ta, a)
ESDOF (T1, a)
ESDOF (T1, i)
Frame ID
median
ATC63-FF set
bilinear hysteretic loop
Figure 10: Global collapse capacity ratios for a series of generic multi-story frame structures according to
Table 2. Results from collapse capacity spectrum methodologies based on equivalent single-degree-of-freedom
systems related to the “exact” outcome from IDA studies.
The difference in percent of the individual results for each frame is illustrated in Figure 10,
where the ratios of collapse capacities from ESDOF considerations to the “exact” outcomes
are shown. A ratio of one implies that both considered methods predict the same collapse ca-
pacity. If the ratio is smaller than one, the collapse capacity is underestimated by the collapse
capacity spectrum methodology, i.e. the outcome is conservative compared to the “exact”
value. It can be seen that for frames 1, 2, 4, 7, and 9 the collapse capacity spectrum method-
Christoph Adam, and Clemens Jäger
15
ologies lead to slightly non-conservative predictions up to 12%. For frames 5 and 6 predic-
tions are very conservative.
Setting in contrast the results of the individual collapse capacity spectrum methodologies
for each frame separately reveals that the simplified method renders the smallest collapse ca-
pacity, and thus, for some structures over-conservative predictions.
However, taking into account the underlying simplifications it can be concluded that all
applied collapse capacity spectrum methodologies are capable to yield a collapse capacity es-
timate, which is sufficiently accurate for the initial design process of buildings.
6 CONCLUSIONS
The seismic collapse capacity of a series of non-deteriorating multi-story frame structures
vulnerable to the destabilizing effect of gravity loads was assessed employing the collapse
capacity spectrum methodology, a simplified subspecies of this methodology, and the IDA
procedure. Evaluation of the results reveals that both the original and simplified capacity spe-
ctrum methodology render sufficient accurate estimates of the global collapse capacity, and
thus can be utilized efficiently in the initial design process of buildings.
REFERENCES
[1] H. Krawinkler, F. Zareian, D.G. Lignos, L.F. Ibarra, Prediction of collapse of structures
under earthquake excitations. M. Papadrakakis, N.D. Lagaros, M. Fragiadakis eds. 2nd
International Conference on Computational Methods in Structural Dynamics and
Earthquake Engineering (COMPDYN 2009), Rhodes, Greece, June 22-24, 2009, CD-
ROM paper, paper no. CD449, 2009.
[2] C. Adam, C. Jäger, Seismic induced global collapse of non-deteriorating frame struc-
tures. Papadrakakis, M., Fragiadakis, M., Lagaros, N.D., eds. Computational Methods
in Earthquake Engineering, pp. 21 - 40, Springer, 2011.
[3] P.C. Jennings, R. Husid, Collapse of yielding structures during earthquakes. Journal of
the Engineering Mechanics Division, Proc. ASCE 94, 1045-1065, 1968.
[4] D. Bernal, Amplification factors for inelastic dynamic P- effects in earthquake analy-
sis. Earthquake Engineering and Structural Dynamics 15, 635-651, 1987.
[5] D. Bernal, Instability of buildings during seismic response. Engineering Structures 20,
496-502, 1998.
[6] G.A. MacRae, P- effects on single-degree-of-freedom structures in earthquakes.
Earthquake Spectra 10, 539-568, 1994.
[7] A. Gupta, H. Krawinkler, Seismic demands for performance evaluation of steel moment
resisting frame structures. Report No. 132. The John A. Blume Earthquake Engineering
Research Center, Department of Civil and Environmental Engineering, Stanford Uni-
versity, Stanford, CA, 1999.
[8] D. Vian, M. Bruneau, Tests to structural collapse of single degree of freedom frames
subjected to earthquake excitation. Journal of Structural Engineering 129, 1676-1685,
2003.
Christoph Adam, and Clemens Jäger
16
[9] D.G. Lignos, H. Krawinkler, A. Whittaker, Prediction and validation of sidesway col-
lapse of two scale models of a 4-story steel moment frame. Earthquake Engineering
and Structural Dynamics, accepted for publication.
[10] A.V. Asmialopoulos, D.L. Karabalis, D.E. Beskos, Inclusion of P- effect in displace-
ment-based seismic design of steel moment resisting frames. Earthquake Engineering
and Structural Dynamics 36, 2171-2188, 2007.
[11] R. Villaverde, Methods to assess the seismic collapse capacity of building structures:
State of the art. Journal of Structural Engineering 133, 57-66, 2007.
[12] L.F. Ibarra, H. Krawinkler, Global collapse of frame structures under seismic excita-
tions. Report No. PEER 2005/06, Pacific Earthquake Engineering Research Center,
University of California, Berkeley, CA, 2005.
[13] C.B. Haselton, A.B. Liel, G.G. Deierlein, Simulating structural collapse due to earth-
quakes: Model idealization, model calibration, and numerical simulation algorithms.
Papadrakakis M., Lagaros, N.D., Fragiadakis, M., eds. 2nd
International Conference on
Computational Methods in Structural Dynamics and Earthquake Engineering
(COMPDYN 2009), June 22-24, 2009, Rhodes, Greece, CD-ROM paper, paper no.
CD497, 2009.
[14] C. Adam, P-delta effects in earthquake excited structures. Yamanaka, H., Morikawa, H.,
Satoshi, Y. eds. Proc. Sixth International Conference on Urban Earthquake Engineer-
ing, Tokyo Institute of Technology, Japan, March 3-4, 2009, pp. 231 – 234, 2009.
[15] C. Adam, C. Jäger, Seismic collapse capacity of basic inelastic structures vulnerable to
the P-delta effect. Earthquake Engineering and Structural Dynamics (submitted for
publication).
[16] C. Adam, C. Jäger, Collapse capacity spectra for finite ductility thresholds, to be pub-
lished.
[17] C. Adam, C. Jäger, Assessment of the dynamic stability of tall buildings subjected to
severe earthquake excitation. Highrise Towers and Tall Buildings 2010, International
Conference at the Technische Universität München, Germany, April 14 - 16, 2010, CD-
ROM paper, 8 pp., 2010.
[18] R.A. Medina, H. Krawinkler, Seismic demands for nondeteriorating frame structures
and their dependence on ground motions. Report No. 144. The John A. Blume Earth-
quake Engineering Research Center, Department of Civil and Environmental Engineer-
ing, Stanford University, Stanford, CA, 2003.
[19] D. Vamvatsikos, C.A. Cornell, Incremental dynamic analysis. Earthquake Engineering
and Structural Dynamics 31, 491-514, 2002.
[20] P. Fajfar, Structural analysis in earthquake engineering - a breakthrough of simplified
non-linear methods. 12th European Conference on Earthquake Engineering, CD-ROM
paper, Paper Ref. 843, 20 pp., Elsevier, 2002.
[21] C. Adam, L.F. Ibarra, H. Krawinkler, Evaluation of P-delta effects in non-deteriorating
MDOF structures from equivalent SDOF systems. 13th World Conference on Earth-
quake Engineering, August 1 - 6, 2004, Vancouver B.C., Canada. DVD-ROM paper, 15
pp., Canadian Association for Earthquake Engineering, 2004.

Christoph Adam, and Clemens Jäger
17
[22] FEMA P695 - Quantification of Building Seismic Performance Factors. Federal Emer-
gency Management Agency, Washington D.C., 2009.