A ROBUST SPECTRAL TARGET RECOGNITION METHOD FOR HYPERSPECTRAL DATA BASED ON COMBINED SPECTRAL...
21
A ROBUST SPECTRAL TARGET RECOGNITION METHOD FOR HYPERSPECTRAL DATA BASED ON COMBINED SPECTRAL SIGNATURES IGARSS 2011 Vancouver, 24-29 July Xiao Fan, Ye Zhang, Feng Li, Yushi Chen, Tao Shao, Shuang Zhou from Harbin Institute of Technology, China
-
Upload
karl-jerkins -
Category
Documents
-
view
219 -
download
2
Transcript of A ROBUST SPECTRAL TARGET RECOGNITION METHOD FOR HYPERSPECTRAL DATA BASED ON COMBINED SPECTRAL...

A ROBUST SPECTRAL TARGET RECOGNITION METHOD FOR
HYPERSPECTRAL DATA BASED ON COMBINED SPECTRAL
SIGNATURESIGARSS 2011 Vancouver, 24-29 July
Xiao Fan, Ye Zhang, Feng Li, Yushi Chen, Tao Shao, Shuang Zhoufrom Harbin Institute of Technology, China

Conclusions
Experiments & Results
Method & System
Techniques
Motivation
Content

Motivation
Spectral Target recognition
Importance
important application for Hyperspectral Image Processing
Goal
high accuracy & robustness
Problem
spectral variation by complicated imaging environment
Solution
SVDDtechniques
derivative

Conclusions
Experiments & Results
Method & System
Techniques
Motivation
Content

Techniques
1.Support Vector Data Description (SVDD)
Inspired by Support Vector Machine (SVM)
A learning machine, first used for anomaly detection in hyperspectral image processing
A detector for spectral target recognition
Alleviate the heterogeneous spectra within homogeneous object
Techniques
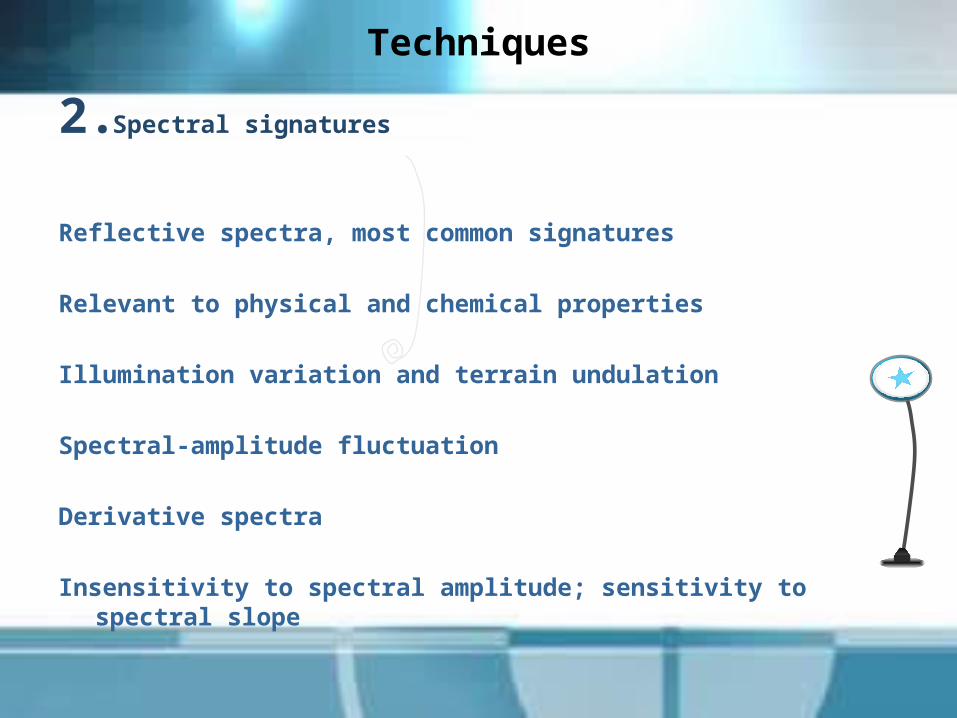
2.Spectral signatures
Reflective spectra, most common signatures
Relevant to physical and chemical properties
Illumination variation and terrain undulation
Spectral-amplitude fluctuation
Derivative spectra
Insensitivity to spectral amplitude; sensitivity to spectral slope

Conclusions
Experiments & Results
Method & System
Techniques
Starting point
Content

Method & System
Combined spectral signatures
Simply connecting, curse of dimensionality
Combining on gray decision level
Combined weights of the signatures
Based on the role of each signatures
According to the data characteristic

Train SVDD
Fusion Rule
Reflectance 1st Derivative
Test SVDD Test SVDD
Binary Recognition Result
Threshold
Discriminating Gray Value
Train SVDD
Discriminating Gray Value
Fused Discriminating Gray Value

Conclusions
Experiments & Results
Method & System
Techniques
Starting point
Content

Experimental Data
Asphalt
Meadows
Gravel
Trees
Metal sheets
Bare soil
Bitumen
Bricks
Shadow

Experiment 1
Unavoidable noise makes heterogeneous spectra within the homogeneous object
SVDD detector vs spectral match-based detector
SAM
SID
SVDD with
linear,
quadratic polynomial,
and cubic polynomial kernel

0 0.5 10
0.2
0.4
0.6
0.8
1
Prob. of False Alarm
Pro
b. o
f D
etec
tion
Asphalt
SAMSID
linear SVDD
poly 2 SVDD
poly 3 SVDDgauss SVDD
0 0.5 10
0.2
0.4
0.6
0.8
1
Prob. of False Alarm
Pro
b. o
f D
etec
tion
Gravel
SAMSID
linear SVDD
poly 2 SVDD
poly 3 SVDDgauss SVDD
0 0.5 10
0.2
0.4
0.6
0.8
1
Prob. of False Alarm
Pro
b. o
f D
etec
tion
Trees
SAMSID
linear SVDD
poly 2 SVDD
poly 3 SVDDgauss SVDD
0 0.5 10
0.2
0.4
0.6
0.8
1
Prob. of False Alarm
Pro
b. o
f D
etec
tion
Metal sheet
SAMSID
linear SVDD
poly 2 SVDD
poly 3 SVDDgauss SVDD
0 0.5 10
0.2
0.4
0.6
0.8
1
Prob. of False Alarm
Pro
b. o
f D
etec
tion
Bare soil
SAMSID
linear SVDD
poly 2 SVDD
poly 3 SVDDgauss SVDD
0 0.5 10
0.2
0.4
0.6
0.8
1
Prob. of False Alarm
Pro
b. o
f D
etec
tion
Bitumen
SAMSID
linear SVDD
poly 2 SVDD
poly 3 SVDDgauss SVDD
0 0.5 10
0.2
0.4
0.6
0.8
1
Prob. of False Alarm
Pro
b. o
f D
etec
tion
Bricks
SAMSID
linear SVDD
poly 2 SVDD
poly 3 SVDDgauss SVDD
0 0.5 10
0.2
0.4
0.6
0.8
1
Prob. of False AlarmP
rob.
of
Det
ectio
n
Shadow
SAMSID
linear SVDD
poly 2 SVDD
poly 3 SVDDgauss SVDD
0 0.5 10
0.2
0.4
0.6
0.8
1
Prob. of False Alarm
Pro
b. o
f D
etec
tion
Meadows
SAMSID
linear SVDD
poly 2 SVDD
poly 3 SVDDgauss SVDD

Experiment 1
Area under the ROC curve with Pf from 0 to 1
Category
DetectorAsphalt Meadows Gravel Trees
Metalsheet
Bare soil Bitumen Bricks Shadow
SAM 0.896 0.8958 0.935 0.9598 0.9987 0.8095 0.97 0.9437 0.9441
SID 0.8999 0.8585 0.933 0.9559 0.9987 0.8042 0.9662 0.9432 0.9231
Linear 0.8978 0.8894 0.9345 0.959 0.9987 0.7987 0.97 0.9434 0.9558
Poly2 0.9505 0.8972 0.9322 0.9572 0.9996 0.7744 0.9852 0.9668 0.9983
Poly3 0.9505 0.8968 0.9322 0.9538 0.9996 0.7661 0.9852 0.9668 0.9983
Gaussian 0.9529 0.9309 0.9403 0.945 0.9994 0.8358 0.9869 0.9734 0.9987
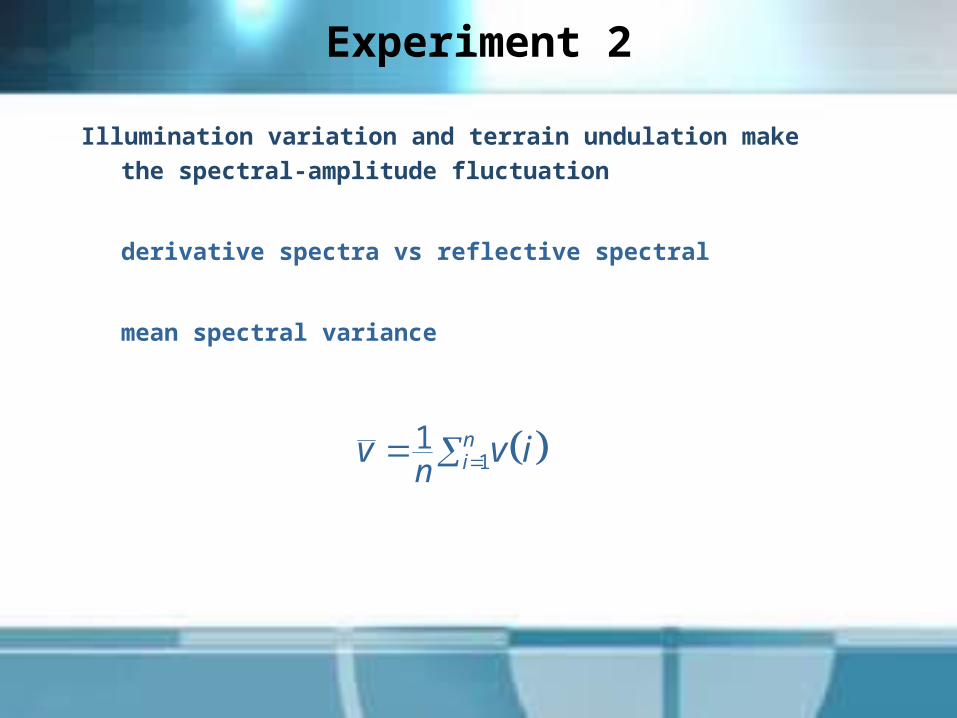
Experiment 2
Illumination variation and terrain undulation make the spectral-amplitude fluctuation
derivative spectra vs reflective spectral
mean spectral variance
11 n
inv v i

0 0.5 10
0.2
0.4
0.6
0.8
1
Prob. of False Alarm
Pro
b. o
f D
etec
tion
Asphalt
reflective
derivative
0 0.5 10
0.2
0.4
0.6
0.8
1
Prob. of False Alarm
Pro
b. o
f D
etec
tion
Meadows
reflective
derivative
0 0.5 10
0.2
0.4
0.6
0.8
1
Prob. of False Alarm
Pro
b. o
f D
etec
tion
Gravel
reflective
derivative
0 0.5 10
0.2
0.4
0.6
0.8
1
Prob. of False Alarm
Pro
b. o
f D
etec
tion
Trees
reflective
derivative
0 0.5 10
0.2
0.4
0.6
0.8
1
Prob. of False Alarm
Pro
b. o
f D
etec
tion
Metal sheet
reflective
derivative
0 0.5 10
0.2
0.4
0.6
0.8
1
Prob. of False Alarm
Pro
b. o
f D
etec
tion
Bare soil
reflective
derivative
0 0.5 10
0.2
0.4
0.6
0.8
1
Prob. of False Alarm
Pro
b. o
f D
etec
tion
Bitumen
reflective
derivative
0 0.5 10
0.2
0.4
0.6
0.8
1
Prob. of False Alarm
Pro
b. o
f D
etec
tion
Bricks
reflective
derivative
0 0.5 10
0.2
0.4
0.6
0.8
1
Prob. of False Alarm
Pro
b. o
f D
etec
tion
Shadow
reflective
derivative

Experiment 2
Area under the ROC curve with Pf from 0 to 1
Category Asphalt Meadows Gravel TreesMetalsheet
Bare soil Bitumen Bricks Shadow
variance(10-3)
13.057 4.5778 3.5456 2.8492 1.5595 1.2505 0.6827 0.3948 0.2574
reflective 0.9994 0.8358 0.945 0.9309 0.9529 0.9403 0.9734 0.9987 0.9869
derivative 0.9999 0.8367 0.9717 0.8611 0.9205 0.9026 0.8936 0.9678 0.9155

Experiment 3
Combined the two spectral signatures by different weights
Equal weights
Unequal weights
0.5r d
p
r p p
c
c v
0 0.005 0.010
0.2
0.4
0.6
0.8
1
variance
wei
ght
of r
efle
ctan
ce
equal
p=1
p=4

0 0.5 10
0.2
0.4
0.6
0.8
1
Prob. of False Alarm
Pro
b. o
f D
etec
tion
Asphalt
worse
equal
p=1p=4
better
0 0.5 10
0.2
0.4
0.6
0.8
1
Prob. of False Alarm
Pro
b. o
f D
etec
tion
Meadows
worse
equal
p=1p=4
better
0 0.5 10
0.2
0.4
0.6
0.8
1
Prob. of False Alarm
Pro
b. o
f D
etec
tion
Gravel
worse
equal
p=1p=4
better
0 0.5 10
0.2
0.4
0.6
0.8
1
Prob. of False Alarm
Pro
b. o
f D
etec
tion
Trees
worse
equal
p=1p=4
better
0 0.5 10
0.2
0.4
0.6
0.8
1
Prob. of False Alarm
Pro
b. o
f D
etec
tion
Metal sheet
worse
equal
p=1p=4
better
0 0.5 10
0.2
0.4
0.6
0.8
1
Prob. of False Alarm
Pro
b. o
f D
etec
tion
Bare soil
worse
equal
p=1p=4
better
0 0.5 10
0.2
0.4
0.6
0.8
1
Prob. of False Alarm
Pro
b. o
f D
etec
tion
Bitumen
worse
equal
p=1p=4
better
0 0.5 10
0.2
0.4
0.6
0.8
1
Prob. of False Alarm
Pro
b. o
f D
etec
tion
Bricks
worse
equal
p=1p=4
better
0 0.5 10
0.2
0.4
0.6
0.8
1
Prob. of False Alarm
Pro
b. o
f D
etec
tion
Shadow
worse
equal
p=1p=4
better

Experiment 3
Area under the ROC curve with Pf from 0 to 1
Category
DetectorAsphalt Meadows Gravel Trees
Metalsheet
Bare soil Bitumen Bricks Shadow
Worse 0.9994 0.8358 0.945 0.8611 0.9026 0.9205 0.8936 0.9678 0.9155
Equal 0.9998 0.8472 0.9572 0.9242 0.9439 0.9574 0.973 0.9976 0.9868
P=1 0.9999 0.8525 0.9576 0.9251 0.9442 0.9566 0.9734 0.998 0.9871
P=4 0.9999 0.8566 0.9591 0.9273 0.9437 0.9537 0.9738 0.9986 0.9872
Better 0.9999 0.8367 0.9717 0.9309 0.9403 0.9529 0.9734 0.9987 0.9869

Thank YouEmail: [email protected]