A Ride on the Consumer’s Rollercoaster of Choices...
61
A Ride on the Consumer’s Rollercoaster of Choices: Predicting Healthy Shopping Behavior Linda Grondsma 14 th of June 2016
Transcript of A Ride on the Consumer’s Rollercoaster of Choices...

A Ride on the Consumer’s Rollercoaster of Choices:
Predicting Healthy Shopping Behavior
Linda Grondsma
14th of June 2016

2
Master Thesis
A Ride on the Consumer’s Rollercoaster of Choices:
Predicting Healthy Shopping Behavior
Date 14th of June
Name L.M. Grondsma
Student number 2228947
Educational program Master in Marketing Intelligence and Marketing Management
Department Department of Marketing
Educational institution Rijksuniversiteit Groningen
Address Peizerweg 18A,
9726 JJ Groningen
Phone number 06 37440748
Email address [email protected]
1st Supervisor Prof. Dr. ir. K. van Ittersum
2nd Supervisor Prof. Dr. T.H.A. Bijmolt
Company Plus Retail
Company supervisor A. Westerveld Msc., Consumer Insights Manager at Plus Retail

3
EXECUTIVE SUMMARY
As a result of the problem of obesity, a trend towards the promotion of healthier choices has evolved
over the past years. This problem is largely driven by overconsumption of unhealthy foods. A good
starting point to solve the problem is where people purchase their food products: grocery stores. Many
studies have been performed there on product-level, but due to recent technological developments it
now possible to take the entire shopping trip into account. Preliminary studies have shown that there
is reason to believe that the healthiness of choices across the shopping trip evolve, which are called
‘Healthy Shopping Dynamics (HSD)’. The purpose of this research is to discover how such dynamics
evolve, what influences healthy shopping baskets and whether such dynamics can be used to forecast
the healthiness of future choices. This gives many insight in customers’ healthy shopping behaviors.
To perform this research, basket-level scanner data was made available by Plus, one of the
largest grocery retailers in the Netherlands. This data was used to uncover drivers of healthy shopping
baskets and to find out what determines the healthiness of the next purchase could be performed.
The results of this study suggest that several drivers of the healthiness of shopping baskets and
of the healthiness of the next purchase can be distinguished. In particular the drivers of HSD seem to
have an impact on the healthiness levels. No effects were found for the three other drivers: general
promotions, health labels and economic health interventions. Most importantly it seems that healthy
shopping dynamics evolve first positively towards healthy behavior after the first few choices.
However, after a number of choices there is a tipping point and behavior becomes oriented towards
unhealthier choices, perhaps due to licensing effects where customers allow themselves to make
unhealthier choices if they already made healthy ones before. Moreover, the insignificance of general
promotions and health labels contradicts a great deal of existing literature.
All these findings have some specific implications for Plus, but also broader implications for
the entire grocery retailing sector. This study gives new insights in how healthy shopping dynamics
evolve over the course of a shopping trip and that analysing this type of data has a lot of potential for
future research.
Keywords: obesity, healthy shopping dynamics, healthy shopping baskets, in-store decision making,
scanner data

4
PREFACE
“What is success? I think it is a mixture of having a flair for the thing that you are doing; knowing that
is not enough, that you have got to have hard work and a certain sense of purpose”
Margaret Thatcher
When I started studying at the University of Groningen in 2011, I was not sure what degree would fit
my interests. I choose to follow the bachelor Business Economics, which is where I first got in touch
with marketing. Soon my interest for marketing began to grow and in February 2015 I started the
masters Marketing Management and Marketing Intelligence. Together, these tracks have taught me
several facets of the marketing field. I developed a passion for data analytics and am truly grateful that
I received the opportunity to put this passion into practice with this thesis. For this, I owe much to my
second supervisor prof. dr. T.H.A. Bijmolt, who suggested this project to me in the first place. I thank
both him and my first supervisor prof. dr. ir. K. van Ittersum for their thorough guidance, feedback and
their pure interest for the research I performed. Moreover, I would like to thank Plus for the
opportunity to use their data and to thank Astrid Westerveld Msc. and Marco Maatman Msc. for their
support, feedback and interesting insights. In addition to them, I also would like to thank my research
partner Rutmer Faber. Even though we wrote two different theses, I appreciate the time we spent
together to help each other when needed.
This is also a good opportunity for me to thank my parents, Klaas Jan and Sita, and my sister
Daniëlle for their ongoing support during my study time in Groningen. Thank you for always believing
in my capabilities and giving me the chance to develop myself into the person I have become. My
friends have been of great value too and I would like to thank my best friend Hetty in particular. Not
only for her help with the development of this thesis, but also for making my study time here in
Groningen unforgettable. Finally, I am grateful for all the support I have received from my boyfriend
Ricardo. Whenever I was stressed, tired or just very enthusiastic, you were always by my side.
To you who is holding this thesis now: I hope you enjoy reading it!
Linda Grondsma
Groningen, June 2016

5
TABLE OF CONTENT
EXECUTIVE SUMMARY ............................................................................................................................. 3
PREFACE .................................................................................................................................................. 4
TABLE OF CONTENT ................................................................................................................................. 5
1. INTRODUCTION ................................................................................................................................... 7
1.1 RESEARCH QUESTIONS .................................................................................................................. 8
1.2 RELEVANCE .................................................................................................................................. 10
1.3 OUTLINE ....................................................................................................................................... 11
2. THEORETICAL FRAMEWORK .............................................................................................................. 12
2.1 CONCEPTUAL FRAMEWORK ........................................................................................................ 12
2.2 HEALTHY SHOPPING DYNAMICS.................................................................................................. 13
2.2.1 HEALTH INDEX OF THE FIRST PURCHASE DECISION ............................................................. 14
2.2.2 HEALTH INDEX OF THE PREVIOUS PURCHASE DECISION ..................................................... 14
2.2.3 TREND ................................................................................................................................... 15
2.2.4 PEAKS .................................................................................................................................... 16
2.2.5 VOLATILITY ............................................................................................................................ 16
2.2.6 AVERAGE HEALTHINESS OF THE BASKET SO FAR ................................................................. 17
2.3 DRIVERS OF HSD .......................................................................................................................... 18
2.3.1 GENERAL PROMOTIONS ....................................................................................................... 18
2.3.2 HEALTH LABELS ..................................................................................................................... 18
2.3.3 ECONOMIC HEALTH INTERVENTIONS .................................................................................. 20
2.4 SELF-REGULATION THEORY ......................................................................................................... 21
2.4.1 SELF-REGULATION AND HEALTHY SHOPPING DYNAMICS .................................................... 22
2.4.2 SELF-REGULATION AND DRIVERS OF HSD ............................................................................ 23
2.5 OVERVIEW HYPOTHESES ............................................................................................................. 24
3. METHODOLOGY ................................................................................................................................. 25
3.1 DATA COLLECTION ....................................................................................................................... 25
3.2 SAMPLE AND CRITERIA SCREENING ............................................................................................ 25
3.3 OPERATIONALIZATION OF VARIABLES ........................................................................................ 26
3.3.1 HEALTH INDICES ................................................................................................................... 26
3.3.2 TREND AND VOLATILITY ....................................................................................................... 27
3.3.3 DRIVERS OF HSD ................................................................................................................... 28
3.4 RESEARCH METHOD .................................................................................................................... 29
4. RESULTS ............................................................................................................................................. 32
4.1 MODEL 1 ...................................................................................................................................... 32

6
4.1.1 EXPLORATORY ANALYSIS ...................................................................................................... 32
4.1.2 MODEL ASSUMPTIONS ......................................................................................................... 34
4.1.3 INTERPRETATION .................................................................................................................. 35
4.2 MODEL 2 ...................................................................................................................................... 38
4.2.1 EXPLORATORY ANALYSIS ...................................................................................................... 38
4.2.2 MODEL ASSUMPTIONS ......................................................................................................... 40
4.2.3 INTERPRETATION .................................................................................................................. 40
4.3.4 PREDICTIVE VALIDITY ............................................................................................................ 43
5. CONCLUSION ..................................................................................................................................... 45
5.1 DISCUSSION ................................................................................................................................. 46
5.1.1 HEALTHY SHOPPING DECISIONS ........................................................................................... 46
5.1.2 DISCOVERING PATTERNS TO FORECAST DECISIONS ............................................................ 47
5.2 LIMITATIONS AND FURTHER RESEARCH...................................................................................... 49
5.3 MANAGERIAL IMPLICATIONS ...................................................................................................... 50
5.4 FINAL CONCLUSION ..................................................................................................................... 51
REFERENCES .......................................................................................................................................... 52
APPENDICES ........................................................................................................................................... 56
APPENDIX 1: DIFFERENCES BETWEEN STORES .................................................................................. 56
APPENDIX 2: PROMOTION WEEK ...................................................................................................... 57
APPENDIX 3: MODEL ASSUMPTIONS MODEL 1 ................................................................................. 57
3.1 MULTICOLLINEARITY ............................................................................................................... 57
3.2 NORMALITY ............................................................................................................................. 57
3.3 HETEROSCEDASTICITY ............................................................................................................. 59
APPENDIX 4: MODEL ASSUMPTIONS MODEL 2 ................................................................................. 59
4.1 MULTICOLLINEARITY ............................................................................................................... 59
4.2 NORMALITY ............................................................................................................................. 59
4.3 HETEROSCEDASTICITY ............................................................................................................. 61

7
1. INTRODUCTION
Over the past years, several trends in consumer food markets have evolved. In particular, the trend
towards ‘healthy choices’ in particular has been quite substantial, as a result of a worldwide problem:
obesity. Since 1980, worldwide obesity has doubled, leading to several consequences, such as
cardiovascular diseases, diabetes, musculoskeletal disorders and multiple types of cancer (World
Health Organization, 2015). Especially in the Netherlands, the rates for obesity are shocking: 40% of
the population of 4 years and older is overweight and another 10% of the people is considered to be
obese (CBS, 2014). According to Ng et al. (2014), overweight and obesity caused 3 to 4 million deaths,
3-9% of years of life lost, and 3-8% of disability-adjusted life-years in 2010 only. On a large scale, this
problem is driven by overconsumption of unhealthy, energy-dense and nutrient-poor foods that have
high concentrations of fat, sugar, and salt (Asfaw, 2011). This identifies the need for healthier lifestyles,
which can be stimulated by grocery retailers themselves (Payne et al., 2014). In fact, many grocery
retailers aim their promotional activities towards stimulating customers to make more conscious,
healthy choices. In order to do this more effectively, it would be insightful to know how people shop
at a grocery store: how does the healthiness of customers’ shopping behavior play a role and what the
sequence is in which they buy products. Unfortunately, there is still little understanding on how this
influences the healthiness of the shopping basket.
Until now, most research in this area was limited to single-product purchases, which does not
give any indication on how customers behave throughout the supermarket (Waterlander et al., 2012;
2013). Preliminary results of a recent pilot study indicate that it is most likely that some patterns in
the way customers make healthy choices throughout the shopping trip exist (Van Ittersum and Bijmolt,
2015). Such a pattern could be called ‘Healthy shopping Dynamics’ (HSD), as it represents the dynamics
of health-levels of sequential choices that customers make during a grocery shopping trip. These
dynamics then identify the influence of previous purchases on the next purchase or average
healthiness of the complete basket, which could be influenced by several other drivers as well. To
uncover what these drivers are and how they affect customers’ choices during the shopping trip, a
study needs to be performed to find out how customers can be triggered to make healthier purchase
decisions. A lot of research has been oriented to the role of emotions (Mukhopadhyay and Johar, 2007;
Williams and DeSteno, 2008; Chen and Sengupta, 2014) and self-regulation (Baumeister and
Heatherton, 1996) which can be linked to healthy shopping decisions. These are, however, not
practical theories to change behavior, but merely describe how people make decisions. In this study,
several different drivers will be identified to build a prediction model to see why customers decide to
make a certain (un)healthy decision.
8
To observe consumer decisions in the most natural way, data from a Dutch grocery retailer will
be used. Grocery retailers are one of the most interesting sources for observing consumer behavior
for several reasons. First, even though the growth of online stores is a major trend in consumer food
markets, still around 50% of all groceries are purchased in brick-and-mortar grocery stores (Glanz et
al., 2012). Second, several other trends are ongoing, such as that the recession of the past years has
led to a cost-saving-orientation of the shopping public. As a result, shoppers’ stated priorities when
choosing their groceries are aimed towards quality, taste or price. Finally, the interest for making
healthy choices has grown among customers. However, their actual purchase behaviors do not always
seem to actually follow this state of mind.
In this study, a first step will be made to uncover such drivers of (un)healthy shopping behavior
based on real purchase data. Plus, a large Dutch grocery retailer, has made data that incorporates the
sequence in which customers do their groceries available for this research. Plus is a grocery chain with
255 supermarkets held by 218 entrepreneurs (Plus, 2016a). The fact that all supermarkets are
franchisers, makes this retailer a special case compared to other grocery retailers. The entrepreneurs
have more freedom when it comes to including for instance local products in the supermarket, while
still following the national marketing campaigns. These campaigns incorporate the four brand values
that the company stands for: Attention, Quality, Local, and Responsible (Plus, 2015). Recently, Plus
received the award for being the best supermarket in promoting Corporate Social Responsibility,
making it even more interesting to take Plus as a source to study healthy shopping behavior (GfK,
2016).
1.1 RESEARCH QUESTIONS
This paragraph lists and explains several research questions that guide this study. Even though the
importance of finding several drivers of healthy shopping behavior has been mentioned before, the
main goal of this research is to uncover what affects customers’ healthy decision-making. The HSD that
were mentioned before, could be an example of such drivers. Real-time data should uncover what
these dynamics look like in actual data, as up to now the only preliminary results that reflect this are
based on experimental data (Van Ittersum and Bijmolt, 2015). When there is an idea of how such
dynamics evolve, the effect of HSD of all shopping decisions will be tested on the average health of the
basket. Besides, the roles of emotion and self-regulation will be included in this research, as they might
explain why certain patterns exist.
Beside investigating the HSD over the whole shopping trip, the existence of other drivers of
healthy shopping behavior will be tested. So far, much research is aimed at different health
interventions that can be performed by the grocery retailer, even though little is known on which
9
methods work the best (Giesen et al, 2011; Wansink and Chandon, 2006; Waterlander et al., 2013). In
this study, two health interventions that drive healthy shopping behavior will be included: Economic
Health Interventions and Health Labels. In collaboration with Plus, two health interventions can be
studied. These are not only the specific marketing campaigns of the supermarket that can be called
‘Economic Interventions’ (the promotion period where relatively more fruits and vegetables are on
promotion), but also health labels, which are widely available on products in the Netherlands since the
introduction of ‘Het Vinkje’ in 2006 (Het Vinkje, 2016). This label is carried in the food and beverage
industry, retail and foodservice and is created to help consumers in making healthier decisions. Beside
these two, another driver of shopping behavior is included: ‘General Promotions’. Supermarkets have
different price options and many customers do their groceries in a very price conscious manner (Glanz
et al., 2012). Therefore, it is expected that such promotions probably also drive the final decision and
that price can be chosen over ‘healthiness’. This all results in the following research question and
subquestions:
1. How are healthy shopping decisions influenced during a shopping trip?
1.1 What do HSD look like in real purchases?
1.2 Do HSD affect the average healthiness of decisions throughout the shopping trip?
1.3 Do other drivers, such as health interventions and general promotions affect the average
healthiness of decisions throughout the shopping trip?
Addressing these issues will help uncovering what influences healthy choices. However, this still poses
a problem, because knowing what drives healthy choices does not necessarily mean that customers’
behaviors are always intentionally influenced. Naturally, we assume that people are rational beings
and make conscious choices. That would imply that people’s behavior is then predictable. However, a
lot of unplanned buying occurs in the supermarket, which implies that behavior is perhaps not always
rational (Gilbride et al., 2015). Therefore, a prediction model will be formed afterwards, to investigate
whether people make rational choices and if it is even useful to try and influence people when they
are tempted to buy products impulsively. This results in the second research question:
2. Can a pattern be distinguished in the scanner data that can forecast the
healthiness of customers’ purchase decisions?
10
2.1 Can the drivers of healthy shopping decisions of Model 1 be used to predict customers’
behavior?
1.2 RELEVANCE
The objective of this study is to discover whether there is such a phenomenon as HSD, how the
dynamics of choices during the shopping trip affect the healthiness average level of the basket and if
such dynamics can be used to forecast the healthiness of future choices. This will give an indication in
how grocery retailers can direct customers towards interchanging unhealthier options for healthier
alternatives. Subsequently, the effects of two types of health interventions and of general promotions
will be absorbed in the model to investigate whether these have an impact on the HSD and eventually
influence the healthiness of the current decision, which gives the possibility to predict the healthiness
level of the next purchase.
Up to now, much research has been oriented at discovering what influences the healthiness
of product-decisions customers make during the shopping trip. This has shown that for instance the
size and shape of the package of a product has an influence (Ordabayeva and Chandon, 2013; Wansink,
1996), as well as the location of healthy and unhealthy food products inside the supermarket (Desai
and Ratneshwar, 2003) and prices of these food products (An 2012; Andreyeva, Long and Brownell,
2010) influence the healthiness of single-product purchases. However, there is little to no research
performed on subsequent purchases during the shopping trip. So far, only the study of Waterlander et
al. (2013) takes the total shopping trip into account. Outcomes of this study are striking: the positive
effect of the single product-purchases may be eradicated when taken as part of a larger shopping trip.
Additionally, food labels do not have a large effect on food purchases, whereas price discounts do
encourage the purchase of healthy products. However, these price cuts do not discourage the
purchase of unhealthy foods and lead to larger end-of-trip basket. Therefore, different articles indicate
that more research is needed to unravel how pricing strategies can best be designed to result in overall
improved food purchases and what role food labels could have to reach this goal. Besides, a pilot study
by Van Ittersum and Bijmolt (2015) has shown that there is reason to believe HSD exist.
Taking the previous mentioned studies together, there is enough reason to investigate this
matter. A question remains why this has not been investigated in the past. Due to the lack of availability
of data of grocery shoppers that take the sequence of shopping into account, specific research to find
out how customers make healthy shopping decisions was simply not possible until this point. Recently,
supermarkets introduced the options for customers to skip the line and scan their groceries already
while doing them using a handscanner. This scanner saves the sequence in which the groceries are into
the basket and thus provides the academic world a grand insight in to how customers shop.
11
This research does not only contribute to the relevance from an academic perspective, but it
aims to provide added value to Plus as well. As one of the brand values of the grocery retailer is focused
on responsibility and health, it is of great importance to understand how HSD evolve during the
shopping trips and how active health interventions of the supermarket can stimulate the purchases of
healthier food products. With the current consumer trends to eat healthier and the growing problem
of obesity, more supermarkets in the Netherlands are developing campaigns that focus on healthier,
more responsible purchases (Plus, 2016a). Plus can use the results of this study to stay competitive and
continuously keep its customers satisfied.
1.3 OUTLINE
The remainder of this study has the following structure. The next chapter shows the conceptual
models, followed by a deeper look at theories from previous literature that can be linked to the
relationships of the model, resulting in numerous hypotheses. Then, chapter 3 describes the data and
methodology of this study, resulting in a model that tests the stated hypotheses. Chapter 4 discusses
the results of the model and the final chapter embodies a discussion of these results and a number of
managerial implications. Finally, limitations and guidelines for future research are discussed.

12
2. THEORETICAL FRAMEWORK
This chapter reviews existing literature to propose the underlying hypotheses to answer the research
questions. First, the conceptual model is represented in a visual way. Afterwards, numerous
paragraphs elaborate on the variables that are pointed out in the models and several hypotheses are
presented. Moreover, a number of psychological theories are linked to the relationships in the models
to give possible explanations for the relationships in the model. Finally, at the end of the chapter an
overview of all hypotheses is provided.
2.1 CONCEPTUAL FRAMEWORK
As shortly explained before, the objective of this study is to uncover the influence of health
interventions, promotions and HSD on the average health index of the basket, which is displayed in
Fig. 1 by the blue arrows. Subsequently, the aim is to uncover whether such choices are all rational and
if a prediction model can be estimated, which is visually displayed with the red variable and red arrows.
Fig 1 Conceptual Framework
13
2.2 HEALTHY SHOPPING DYNAMICS
In the first chapter HSD were already mentioned briefly, but no clear definition of this phenomenon
has been stated yet. This paragraph will first discuss different researches that already looked into
shopping dynamics in general, followed by a short elaboration on previous work in the field of healthy
food purchases, resulting in a definition of the term.
Up to now, the existence of shopping dynamics in general has been proven in different studies,
where mainly the contribution of Dhar et al. (2007) is important. They identified that customers go
through a process which is called the shopping momentum. This refers to the psychological impulse
that is provided when an initial purchase is made and that enhances the purchase of a second,
unrelated product. This theory was linked to previous work by Gollwitzer et al. (1990), which explains
the occurrence of the shopping momentum as a result of the psychological process caused by the initial
purchase. This makes the consumer move from a deliberative to an implemental mind-set, driving
subsequent purchases. Dhar et al. (2007) also describe manners in which this shopping momentum
can be interrupted.
Beside the shopping momentum, there is also an excessive amount of literature on the
phenomenon of impulsive and unplanned purchase behavior. When customers walk through a
supermarket, they are confronted with many items that they could potentially purchase, possibly
leading to unplanned buying (Gilbride et al., 2015). In this state, two types of dynamics can be
distinguished: carryover effects of earlier purchases on subsequent unplanned versus planned
purchases, and a change in the probability of making an unplanned versus a planned purchase over
the course of the shopping trip (Gilbride et al., 2015). One of the reasons that such impulsive purchases
take place is affect, or better said the mood of the consumer at the moment of making the purchase
decision (Vohs and Faber, 2007). Several other theories, both social and psychological, could underlie
these dynamics (Cannuscio et al., 2014), which will be further discussed in paragraph 2.4.
There is thus existing literature on shopping dynamics, but surprisingly little research is
performed in the area shopping dynamics when purchasing healthy food products. Until now, the only
research directed to HSD was a pilot study of Van Ittersum and Bijmolt (2015), in which 54 MTurk
participants were asked to make eleven purchase decisions. For every available product four options
and a no-purchase option were available, and a picture of the product, its price and calorie information
were provided. The results of this study lead to a pattern in which participants shop, which is visually
represented in Fig. 2. The pattern does not seem to evolve linearly, but more in ‘rollercoaster’ type of
manner.

14
Fig. 2 Healthy shopping Dynamics - results from pilot
study
Source: Van Ittersum and Bijmolt (2015)
Thus, according to this pilot study there is reason to believe that HSD exist. Along this line, the following
definition of HSD will be leading throughout this study: ‘HSD are shifts in the healthiness indices of all
combined purchase decisions throughout the shopping trip’. The following subparagraphs describe six
ways in which HSD can possibly be measured. It needs to be noted that there is a difference between
the meaning of the health index that is used in this study and healthiness. An increase in the health
index denotes a decrease in the healthiness of the basket/next purchase, since the health index is
based on the number of calories. When this number increases, the healthiness thus decreases. All
hypotheses will be stated in terms of the health index of the basket or of the next purchase.
2.2.1 HEALTH INDEX OF THE FIRST PURCHASE DECISION
The first experience in a sequence of experiences tends to have a stronger influence on the judgment
of individuals than the following experiences, due to primacy effects (Montgomery and Unnava, 2009).
An example of such effects is that when people memorize a list of words, they put greater attention
on the first words compared to the following ones, resulting in better memorization of them (Greene,
1986). In the topic of healthy choice behavior, this indicates that the healthiness of the first purchase
would have a great impact on the following shopping behavior of the customer. This should be taken
into account and results in the following hypotheses:
H1A The health index of the first purchase decision is positively related to the average health
index of the basket
H2A The health index of the first purchase decision is positively related to health index of the
next purchase
2.2.2 HEALTH INDEX OF THE PREVIOUS PURCHASE DECISION
Just as the first decision, also the last decision that was made tends to be weighted more heavily by
customers, due to so called recency effects (Greene, 1986). Sticking to the example of memorizing
words, this recency effect entails that people tend to recall items that they studied at the end more
often than those in the middle, just as they do with the first few items (Greene, 1986). Strong proof
15
for recency effects was found in an experiment by Kahneman et al. (1993). They show that people
choose to rather feel pain for a longer amount of time, provided that this experience is ended with a
pleasant feeling, instead of feeling pain for a shorter amount of time, where this pleasant part is not
present. Translating this in the context of healthy shopping behavior, this implies that customers recall
the healthiness of their most recent purchase decision more than of the decisions they made before
that, making the last purchase decision an interesting factor to take into consideration. Combining this
fact with the self-regulation theories on guilt that will be described in paragraph 2.4, it is expected that
customers will compensate the relative unhealthiness of their previous purchase with a healthier next
choice. This results in the second hypothesis for Model 2:
H2B The health index of the previous purchase decision is negatively related to the health index
of the next purchase
Besides, as compared to primacy effects, recency effects are expected to dominate when affecting the
healthiness of the current purchase decision, because recall diminishes when the time since the first
decision increases (Greene, 1986). Therefore, the third hypothesis for Model 2 is stated:
H2C The effect of the health index of the previous purchase decision on the health index of the
next purchase decision is larger than the effect of the health index of the first purchase
2.2.3 TREND
A trend of subsequent experiences can either be increasing or decreasing. Consumers usually prefer
improvement over a certain amount of time compared to decline, which is called their negative time
preference (Loewenstein and Prelec, 1993). In the case of healthy purchase behavior, it can be
concluded that customers with an improving trend of healthy choices are more likely to choose a
relatively healthy product again than customers with a more negative trend. Even though the pilot
study by Van Ittersum and Bijmolt (2015) suggests that the pattern in HSD is not linear, it is still valuable
to discover whether healthy shopping behavior improves or declines throughout the shopping trip,
which results in the next hypotheses:
H1B An improving trend of healthy choices has a positive influence on the average health index
of the basket
H2D An improving trend of healthy choices has a positive influence on the health index of the
next purchase
16
2.2.4 PEAKS
During the shopping trip, peak moments in the level of healthiness will occur. Such peaks have an
impact on later choice behavior, because the most intensive moments are remembered the best
(Montgomery and Unnava, 2009). The same holds for the reversed situation: an extreme ‘low point’ is
also remembered more. It does not matter when the healthy/unhealthy peak takes place during the
shopping trip. When a very healthy choice is made, this might strengthen the motivation to make
healthy decisions again through feelings of pride, or to do the opposite and find the justification to
choose unhealthier products, which is called licensing (Khan and Dhar, 2006; Mukhopadhyay and
Johar, 2007; Williams and DeSteno, 2008). These concepts are further elaborated upon in paragraph
2.4. Therefore, it is expected that the healthy peak has an influence in both models, but the sign is
unknown. For the unhealthy peaks, it is expected that through feeling of guilt customers will tend to
make a healthier decision afterwards (Chen and Sengupta, 2014). This concept of guilt will also be
discussed later on in paragraph 2.4. This results in the following hypotheses:
H1C Healthy peaks during the shopping trip have an influence on the average health index of
the basket
H1D Unhealthy peaks during the shopping trip have a negative influence on the average health
index of the basket
H2E Healthy peaks during the shopping trip have an influence on the health index of the next
purchase
H2F Unhealthy peaks during the shopping trip have a negative influence on the health index of
the next purchase
2.2.5 VOLATILITY
Volatility is a term that is used a lot to describe stock prices in financial markets. Stock prices tend to
vary a lot over time, and the many peaks in these patterns are considered to be volatile. In this area of
stock prices, many theories describe such volatile behaviors, of which one is called the theory of
‘random walks’. This theory implies that a series of stock price changes has no memory, meaning that
the past history of the series cannot be used to predict the future in any meaningful way (Fama, 1965).
Of course, this is a very extreme theory and many changes in stock prices can be described by current
events. Putting this in the context of shopping behavior we also see that the volatility in shopping
decisions cannot be explained conclusively. Research shows that when there were more peaks in
emotional moment-to-moment evaluations (so higher volatility) this can results in both a feeling of
excitement that leads to a positive evaluation (Teixeira et al., 2012) as well as a feeling of uncertainty

17
that results in a negative evaluation (Anderson, 2003). Thus, existing literature does not seem to give
a clear result of volatility, and applying this to healthy shopping decisions it seems logical that when
customers choose many products with very different levels of healthiness, it is harder to predict their
next move than for customers who have quite stochastic behavior. Although it is expected that there
is some influence, the next hypotheses cannot give a conclusive direction:
H1E The volatility of the health indices of previous purchases influences the average health index
of the basket
H2G The volatility of the health indices of previous purchases influences the health index of the
next purchase
2.2.6 AVERAGE HEALTHINESS OF THE BASKET SO FAR
For Model 2 the dependent variable of Model 1 is included in the model as an additional driver of the
next purchase decision. When shopping, customers have orientations that differ from one another.
Some of them might go grocery shopping and buy certain items for hedonic reasons, whereas other
customers might feel the urge to buy healthy items (Arnold and Reynolds, 2003). The overall
healthiness level of the previous purchase decisions that were made could give an indication for
people’s intention to buy healthier products. Therefore, when customers already made relatively
healthy choices overall before, they must have a higher probability of making a healthier decision again
and vice versa. Such a causality closely follows the ideas of self-regulation theory, which describes how
people set goals and how they need to control themselves in order to achieve such goals. If customers
shop for, on average, healthier groceries over the trip, this may indicate that they will choose healthier
products again. More elaboration on this and more accompanying theories will follow in paragraph
2.4. Taking everything in consideration, this results in the following hypothesis:
H2H The average health index of previous purchases has a positive influence on the health index
of the next purchase
18
2.3 DRIVERS OF HSD
Now that HSD have clearly been defined and that several indicators have been established, a deeper
look is taken into what drives customers’ healthy choice behavior. First, these could be general
promotions. Second, this could be health interventions. The importance of health interventions by
retailers or suppliers has been investigated in several studies (Giesen et al, 2011; Wansink and
Chandon, 2006; Waterlander et al., 2013). They distinguish between different methods in which
customers could be guided towards making healthier purchase-decisions. In these articles two main
groups of health interventions can be identified: health labels and economic interventions. The first
subparagraph describes the effect of general promotions, which are also expected to influence buying
behavior. The following two subparagraphs will elaborate on the before mentioned interventions.
2.3.1 GENERAL PROMOTIONS
Every week, supermarkets have different items on promotion. Such promotions have the purpose for
customers to make more unplanned purchases, and with success (Inman et al., 1990). In fact, low
cognition customers even purchase goods that are on promotion by just the look of the promotion
signal, without even checking whether there is a real price discount (Inman et al., 1990). Moreover,
research has shown that promotions can accelerate purchases in 2 ways. First, the acceleration of
customers’ purchases of the product and second the acceleration of the shopping trip to the store
(Kahn and Schmittlein, 1992). Therefore, general promotions in grocery stores do have a large impact.
However, it will also result in more unplanned behavior, having a negative impact as customers might
lose track of their shopping goal. More theories that can be linked to this are provided in paragraph
2.4. The more products on promotion are added to the basket, the higher the health index of the
basket is expected to be, thereby decreasing the healthiness. This results in the following two
hypotheses:
H1F General promotions have a positive influence on the average health index of the basket
H2I General promotions have a positive influence on the health index of the next purchase
2.3.2 HEALTH LABELS
With the growing problem of obesity, many regulatory agencies wonder whether low-fat nutrition
labels influence people’s food consumption (Wansink and Chandon, 2006). Up to now, researchers
have looked into the subject of health labels, with different results. In their work, Wansink and
Chandon (2006) found that the use of a ‘low-fat’ label has a significantly different impact on overweight

19
consumers compared to people with a normal weight. Their results show that low-fat labels lead to
overconsumption of snack foods by all consumers, but that these effects are stronger for people who
already are overweight. Besides, the presence of salient serving-size information such as ‘Contains two
Servings’ reduces overeating for people with a normal weight, but has no impact on overweight
consumers. Therefore, this research thus indicates that food labels do have an impact on consumers.
However, the people that are overweight are not paying enough attention to such health labels. To
stimulate this to a greater extent, manufacturers and retailers could consider making labels more
explicit by altering the packages or promoting these characteristics more heavily. However,
other work by Waterlander et al. (2013) on health labels and pricing strategies to influence healthy
shopping behavior gives different results. The outcomes of this study show that price effects
overshadow the effects of food labels. These food labels per se do not have any significant effect on
the purchase of healthy foods.
In this study, the effectiveness of ‘Het Vinkje’, which was shortly mentioned before, will be
investigated. There are two types of Vinkjes as shown in Fig. 3: one with a green and another with a
blue circle (Het Vinkje, 2016).
Fig. 3 Het Vinkje
The green logo indicates that the food product belongs to the healthier products of the food pyramid
and contains important nutrients that you need on a daily basis. The blue logo indicates that the
product does not belong to the food pyramid and that you should not eat this too often, but that it is
a better choice within the product category. The effectiveness of the Vinkje is shown in an internal
research by Plus (2016b), which indicates that 83% of the customers are aware of the Vinkjes and 65%
experiences it as a positive addition. The case is, however, that only 19% of the customers actively pays
attention to the Vinkjes while doing groceries.
Recently, the largest Dutch customers association ‘De Consumentenbond’ started a campaign
against this health label. According to them, Dutch consumers are not well aware of what the two
labels mean and according to them it does not result in healthier choices (Consumentenbond, 2016).
This is all based on a qualitative research among 1057 panel members. An interesting fact about these
researches about the Vinkjes is that they are based on questionnaires that were filled out by a panel.
There is, however, no known research that investigates the Vinkjes in a quantitative way. Therefore,
this study might add different insights to the effects of this health label.
Based on the previous research about the Vinkje and health labels in general, there seems to
be some inconclusiveness on the effect of health labels. Therefore, it is assumed that the health labels
themselves on the product do have an impact, but no direction of this relationship can be established.
20
This reflects the effect of the health label itself, not of the healthiness of the products that carry it. It
does not necessarily have to concern a very healthy product, but as the blue labels indicated it can also
be placed on a product that is a better choice within a relatively unhealthy product category. This
results in the following hypotheses:
H1G Health labels have an influence on the average health index of the basket
H2J Health labels have an influence on the health index of the next purchase
2.3.3 ECONOMIC HEALTH INTERVENTIONS
Mainly due to economic shocks such as a recession, falling income or dramatic increases of food prices,
purchase behavior can be influenced (Andreyeva et al., 2010). Times like these create pressure to
purchase food that is lowest in cost, making processed, unhealthier foods more attractive. In theory,
there would be two ways to deal with situations like these and stimulate healthier purchase-behavior:
either lowering prices of healthy food products (i.e. a subsidy), or raising prices of relatively unhealthy
products (i.e. a fat tax). Different studies already indicated that mainly the first intervention, a subsidy
on healthier products, could be a successful way to stimulate healthy shopping. According to An (2012),
subsidizing healthier foods tends to be effective in modifying dietary behavior. The only constraint to
this finding is that long-term effectiveness and impact on the overall diet intake are unknown.
Waterlander et al. (2012) studied the effects of price subsidies and taxes on respectively
healthy and unhealthy foods throughout the entire shopping trip. They found that price increases on
unhealthy food products up to 25% of the original price do not result in differences in healthy food
purchases. This indicates that the tendency to purchase healthier food products will only increase
when a substantial tax on unhealthy food is introduced. Besides, their results showed that price
discounts on healthy foods have two effects. On the one hand they encourage customers to purchase
healthy products. On the other hand it makes customers increase the energy of the total shopping
basket, resulting in an equally (un)healthy shopping basket. This indicates that the complete purchase
process of customers is more dynamic and is not only explained by prices.
There thus seems to be a positive influence of economic interventions when single-product
purchases are made, but no change on the healthiness of the complete basket. Therefore, it is
expected that there is some influence of economic health interventions in both models, but no clear
cut direction of that relationship. This results in the following hypotheses:
H1H Economic health interventions have an influence on the average health index of the basket
H2K Economic health interventions have an influence on the health index of the next purchase
21
2.4 SELF-REGULATION THEORY
This paragraph discusses different psychological theories that interfere with how customers make
decisions in a grocery store. This study focuses on the decisions customers make during a shopping trip
and there are many possible influences that can distract them. The paragraph continues by describing
several underlying mechanisms that possibly explain why customers make certain choices, in
combination with the variables that were described previously in the conceptual model.
When making the decision to buy a healthy product, a certain level of self-regulation is
required. Baumeister and Heatherton (1996) describe three ingredients of this self-regulation. First,
standards are important, which are ideals, goals or other conceptions of possible states. These
standards are essential, as either a dilemma of conflicting standards or even a lack of having any
obstructs effective self-regulation. Second, monitoring entails the current state of being that is
compared to the standard and loops of feedback of one’s actions which are necessary to guide an
individual to their goals. When people cease to follow their actions, they tend to lose control. The third
and last phase is called operate, which follows the second phase closely. If it turns out that the current
state is not compatible with the standards, a certain process is set in motion to change this. The first
two ingredients have been researched widely, but it is quite unsure how these processes in the last
phase actually function as they seem to be much more complex.
This self-regulation resource is, however, limited and can thus be depleted (Baumeister and
Heatherton, 1996). An individual’s capacity to self-regulate is limited, as someone simply cannot
regulate everything at once, which of course differs on a case to case basis due to individual
differences. Besides, a person can become exhausted from making many simultaneous demands and
can therefore sometimes fail at self-control of choices they would normally succeed in. Moreover, the
self-regulation muscle can be trained in order to make it stronger and the more this is done, the easier
it becomes to self-regulate. Multiple studies have already shown the effects of certain stimulants to
boost this muscle. For example, in an experiment by Tice et al. (2007) people made an initial act of self-
regulation. After being shown a comedy video or given a surprise gift, their self-regulatory resource
was recharged, whereas people who did not experience these events showed resource depletion.
Another example was shown in research by Gailliot et al. (2007), whose results showed that acts of
self-control would reduce blood glucose levels in the body, resulting in poor performance on self-
control tasks. They found that consuming a glucose drink would restore these values and self-control
performance would improve. These examples indicate that self-resource depletion can be overcome,
posing an opportunity for grocery retailers to help customers achieve this.
22
2.4.1 SELF-REGULATION AND HEALTHY SHOPPING DYNAMICS
Some of the theories described in the previous paragraph can be closely linked to the decision process
that is researched in this study: is an individual going to choose something they might like better in
terms of taste, but is unhealthy, or can they regulate their actions and choose for healthier products?
It goes without saying that customers need to have the internal goal to make such decisions. When
customers simply do not care about eating healthier, this theory cannot be applied.
Since the publication of the article of Baumeister and Heatherton (1996), many researchers
followed this up with studies on self-regulation theory and depletion of the self-regulatory resources.
In more recent work, an opposite phenomenon is found with regard to the self-regulation resource.
When two consecutive self-regulatory situations require similar control processes, the self-regulation
resource does not get exhausted, but in fact enhances (DeWitte et al., 2009).
Beside exercising this control, customers also feel more subjective emotions during the
shopping trip. Different concepts such as licensing, pride and guilt can be linked to the process that is
captured within HSD. These three concepts all have their influence in different ways, but affect the
choice for healthy products in a positive way. First, licensing occurs when “a prior, virtuous intent
boosts people’s self-concepts, thus reducing negative self-attributions associated with the purchase of
relative luxuries” (Khan and Dhar, 2006, p. 256). In the current research context, this means that when
customers have to motivation to make a healthy choice, this boosts their self-concepts and results in
a them feeling that it is justified to make a second, unhealthier choice. Second, pride can play a part
within the shopping trip. When a consumer made the choice to purchase a healthy product instead of
a relatively unhealthy one, he or she resisted and facilitated self-regulation, which will give a sense of
pride (Mukhopadhyay and Johar, 2007; Williams and DeSteno, 2008). Third, guilt plays its part too
when customers are unable to resist the temptation of buying a relatively unhealthy product, making
them feel more motivated to continue their shopping trip with the purchase of a healthier product
(Chen and Sengupta, 2014).
In addition to these three concepts that boost healthy shopping behavior, there is one final
concept that needs to be discussed briefly. It is possible that customers continue to buy unhealthy
foods after their first failure, which is called What-The-Hell (Cochran and Tesser, 1996). The name itself
already reflects that this behavior cannot be explained by any of the previous theories and is thus
merely observed. All of these concepts will most likely be identified within the data that is made
available by Plus.
Decisions during the shopping process are sometimes rational, but as a result of distraction it
is possible that unplanned or impulsive buying occurs. A lot of research has been done in the field of
unplanned buying. Gilbride et al. (2015) investigate how unplanned versus planned purchases are

23
determined by elements of the current trip and previous shopping trips. Their findings indicate that
the probability for unplanned behavior increases as the shopping trip continues.
Since even research does not seem to agree on how self-regulatory processes develop during
a series of choices, it is hard to predict HSD. In the next subparagraph, a closer look will be taken into
the interconnection of self-regulation theory and drivers of HSD.
2.4.2 SELF-REGULATION AND DRIVERS OF HSD
It is also a possibility to connect self-regulation theory to health interventions, as these
interventions aim to influence customers’ choice behavior and general promotions. Not a lot of
research within self-regulation is performed with regard to promotions within the store. At the start
of their shopping trip, most customers have some idea of what they want to buy, but shopping goals
might be a bit fuzzy (Lee and Ariely, 2006). As the trip proceeds, these goals become clearer. However,
promotions influence customers spending more when their goals are less concrete compared to
customers with less fuzzy goals (Lee and Ariely, 2006). In general, promotions already seem to
influence behavior more than health labels (Waterlander, 2013). Thus the influence of promotions is
expected to be larger than the influence of health labels in influencing healthy shopping behavior,
resulting in the last hypotheses:
H3A The effect of (healthy) promotions is larger than the effect of health labels in influencing
healthy shopping decisions in Model 1
H3B The effect of (healthy) promotions is larger than the effect of health labels in influencing
healthy shopping decisions in Model 2
The concepts of self-regulation that have been described before can be linked to these three drivers
of HSD as well. Licensing (Khan and Dhar, 2006), pride (Mukhopadhyay and Johar, 2007; Williams and
DeSteno, 2008) and guilt (Chen and Sengupta, 2014) might eradicate the mistake to buy a relatively
unhealthy product in the beginning of the trip, and as consumer goals become clearer, customers’
decisions might become less ambiguous. These two theories can thereby strengthen each other. This
is especially applicable to the increased unplanned buying behavior as a result of general promotions
throughout the store.

24
2.5 OVERVIEW HYPOTHESES
Table 1 Overview of all hypotheses
Hypotheses +/-
H1A The health index of the first purchase decision is positively related to the average health index of the basket
+
H1B An improving trend of healthy choices has a positive influence on the average health index of the basket
+
H1C Healthy peaks during the shopping trip have an influence on the average health index of the basket +/-
H1D Unhealthy peaks during the shopping trip have a negative influence on the average health index of the basket
-
H1E The volatility of the health indices of previous purchases influences the average health index of the basket
+/-
H1F General promotions have a positive influence on the average health index of the basket +
H1G Health labels have an influence on the average health index of the basket +/-
H1H Economic health interventions have an influence on the average health index of the basket +/-
H2A The health index of the first purchase decision is positively related to health index of the next purchase
+
H2B The health index of the previous purchase decision is negatively related to the health index of the next purchase
-
H2C The effect of the health index of the previous purchase decision on the health index of the next purchase decision is larger than the effect of the health index of the first purchase
H2D An improving trend of healthy choices has a positive influence on the health index of the next purchase
+
H2E Healthy peaks during the shopping trip have an influence on the health index of the next purchase +/-
H2F Unhealthy peaks during the shopping trip have a negative influence on the health index of the next purchase
-
H2G The volatility of the health indices of previous purchases influences the health index of the next purchase
+/-
H2H The average health index of previous purchases has a positive influence on the health index of the next purchase
+
H2I General promotions have a positive influence on the health index of the next purchase +
H2J Health labels have an influence on the health index of the next purchase +/-
H2K Economic health interventions have an influence on the health index of the next purchase +/-
H3A The effect of (healthy) promotions is larger than the effect of health labels in influencing healthy shopping decisions in Model 1
H3B The effect of (healthy) promotions is larger than the effect of health labels in influencing healthy shopping decisions in Model 2

25
3. METHODOLOGY
3.1 DATA COLLECTION
The data used in this study is made available by Plus, one of the largest Dutch grocery retailers. Since
the introduction of their new store concept a few years ago, Plus provided the availability of self-
scanning devices for customers in many grocery stores. What makes this data unique from regular
scanner data is that it saves the sequence in which customers scanned the items as they walked
through the grocery store. In this manner, the way customers grocery shop and the sequence in which
they make decisions can be traced precisely.
The data was collected in January and February of 2016 and contained one pre-promotion
week, one promotion week and one post-promotion week for three different Plus stores. These three
different stores are similar in size, but differ in the type of neighbourhood where they are located. To
test whether there are any differences between supermarkets, a one-way ANOVA and three
regressions were performed (Appendix 1). These tests indicate that there are no major differences
between the three stores. Therefore, the customers that form three groups divided over the different
stores are combined in one data file to look at the total customer database available for this research.
The three weeks for which there is data available (i.e. the pre-promotion, promotion and post-
promotion week) were used to test the previously stated hypotheses.
In addition to this scanner data, the internal data of Plus on the nutritional information of their
products was also used to create insights about the healthiness phenomena. The nutritional
information was, however, far from complete and thus calorie information for all missing products had
to be found on product catalogues from other retailers, blogs and articles available online. When this
file was complete, it was merged with the scanner data file. Afterwards, the calories were recalculated
and transformed into indices. Paragraph 3.3 provides more detail on the operationalization of the
healthiness of the products.
3.2 SAMPLE AND CRITERIA SCREENING
The scanner-data initially contained 47.082 customers, with shopping baskets ranging from a few to
hundreds of products. As stated before, HSD are expected to arise when customers make several
decisions when walking through the supermarket. Therefore, very short shopping trips that include
only a few choices are not very likely to capture these dynamics to the same extent as the longer trips.
To solve this, all shopping baskets were screened for two criteria:
26
1. HSD are expected to be found with different choices. When a customer chose the same
product a number of times in a row, this was observed as one choice they made. The
aggregation of all baskets resulted in smaller baskets for almost all customers;
2. These smaller baskets were then categorized in remaining sizes. All baskets that contained less
than 10 different products were deleted from the dataset. This way the dataset is based on
customers with shopping baskets that were formed through a substantial amount of choices.
As a result, the remaining baskets all contained at least 10 products without any duplicates.
Subsequently, due to issues with the missing nutritional information, it was necessary to take
subsamples from every store for every week. Samples of 300 customers were drawn, which resulted
in a final sample of 2.700 customers.
3.3 OPERATIONALIZATION OF VARIABLES
In this sub-paragraph, the operationalization of several of variables in the model will be described.
3.3.1 HEALTH INDICES
To measure the healthiness of purchase decisions, the nutritional information of the products that
customers bought is used. For customers, this information is available at the back of each product in
the supermarket, containing information about for instance sugar, calories, salt and carbs. The
importance of such information becomes clear in the research by Burton et al. (2006), where
customers filled out a survey and participated in an experiment that aimed to uncover how well
customers are aware of the amounts of fat and calories. Their results specify that a shocking amount
of customers is not aware of the high amount of calories and fat in the food they consume. This
illustrates the added value of nutritional information, as it can have a positive impact on public health
and should therefore not be overlooked. Other researches also uncover the important added value
that calorie information has on customers’ awareness of the (un)healthiness of the food they consume
as well (Giesen et al., 2011). In this study, the number of calories that a product contains were used as
an indicator of the healthiness of that product. The amount of calories per 100 grams that is always
provided on the package of the product was used. Not only because this gives an equal idea of the
relative (un)healthiness of products with in their category, but also because this is the information that
customers have available when shopping at the grocery store.
In this study, nutritional information is used to form a ‘health index’ based on the relative
healthiness of every product within the entire product category, which leads to certain health scores
per product. An index of 1 implies that the healthiness of the product is average for the given product

27
category, an index <1 implies that the product is relatively healthy, and an index >1 implies that it is
relatively unhealthy. Besides, the average healthiness of each product category is calculated by taking
the average amount of calories of each product category, and creating health indices for every product
category. Then the health index of each product is multiplied by the health index of the product
category it belongs to. This operationalizes what healthy choices are and how they evolve over a
shopping trip. To illustrate this a bit more clearly, the process of creating the health indices is described
with the following formulas in two steps:
1. Average number of calories of the product category =Total number of calories within the product category
Total number of products in the category
2. Health Index of the product = Number of calories of Product J
Average number of calories of the product category (1)
The second formula shows the final health index that was used for each product. This health index
adjusts the healthiness of the product for the healthiness of the product category it belongs to.
Moreover, the calculated health indices under (2) were used as a basis to operationalize the
variables for the primacy and recency effects and the healthy and unhealthy peaks:
- Primacy effect = First adjusted Health Index (2) for each customer i
- Recency effect = Previous adjusted Health Index (2) for each customer i
- Healthy peak = Lowest/minimum adjusted Health Index (2) for each customer i
- Unhealthy peak = Highest/maximum adjusted Health Index (2) for each customer i
Finally, the dependent variable ‘average health index’ indicates whether the customer chose relatively
more healthier or unhealthier products during the trip. This variable is calculated by
𝐴𝑣𝑒𝑟𝑎𝑔𝑒 𝐻𝑒𝑎𝑙𝑡ℎ 𝐼𝑛𝑑𝑒𝑥𝑖 = 𝑇𝑜𝑡𝑎𝑙 𝑠𝑢𝑚 𝑜𝑓 ℎ𝑒𝑎𝑙𝑡ℎ 𝑖𝑛𝑑𝑖𝑐𝑒𝑠 𝑜𝑓 𝑎𝑙𝑙 𝑝𝑟𝑜𝑑𝑢𝑐𝑡 𝑐ℎ𝑜𝑖𝑐𝑒𝑠 𝑏𝑦 𝑐𝑢𝑠𝑡𝑜𝑚𝑒𝑟 𝑖
𝑇𝑜𝑡𝑎𝑙 𝑎𝑚𝑜𝑢𝑛𝑡 𝑜𝑓 𝑝𝑟𝑜𝑑𝑢𝑐𝑡𝑠 𝑝𝑢𝑟𝑐ℎ𝑎𝑠𝑒𝑑 𝑏𝑦 𝑐𝑢𝑠𝑡𝑜𝑚𝑒𝑟 𝑖
3.3.2 TREND AND VOLATILITY
For every customer in the dataset, a trend line is calculated which describes the linear trend for the
health indices (HI) for all t moments during the shopping trip:
HI = ß0 + ß1 t + Ɛt (1)
As a result, Eq. (1) is estimated separately for each customer. The ß1 estimator reflects the linear trend.
In their study, Shehu et al. (2016) calculated the trend line in a similar way. They calculated volatility
28
as well and their method for calculating this will be closely followed in this study. In order to find out
how volatile the health indices are from choice to choice, the autocorrelation of the error terms of Eq.
(1) can be used. Autocorrelation can arise in two ways: positive or negative. Positive autocorrelation
refers to the occurrence of residuals in t that have the same sign as the residual in t-1. Negative
autocorrelation shows a pattern of positive and negative values for the residuals compared to the
trend line interchanging (Leeflang et al., 2015). In the case of health indices, it is expected that healthy
and unhealthy choices will interchange a lot, resulting in a curved patterns, which was shown before
in Fig. 2. Therefore, negative autocorrelation would reflect this the best way. As a measure to evaluate
this autocorrelation, the Durbin-Watson statistic is used. This statistic ranges from 0 to 4, where a value
close to 0 indicates positive autocorrelation, close to 2 indicates non-autocorrelation and close to 4
indicates negative autocorrelation (Shehu et al., 2016). Therefore, a higher value of the Durbin-Watson
statistic indicates higher volatility. When following the method performed in the study by Shehu et al.
(2016), it becomes clear that in this dataset the average Durbin-Watson statistic is 1,6812, which
indicates that most of the patterns show slight positive autocorrelation. This implies that most cases
do not show strong variability.
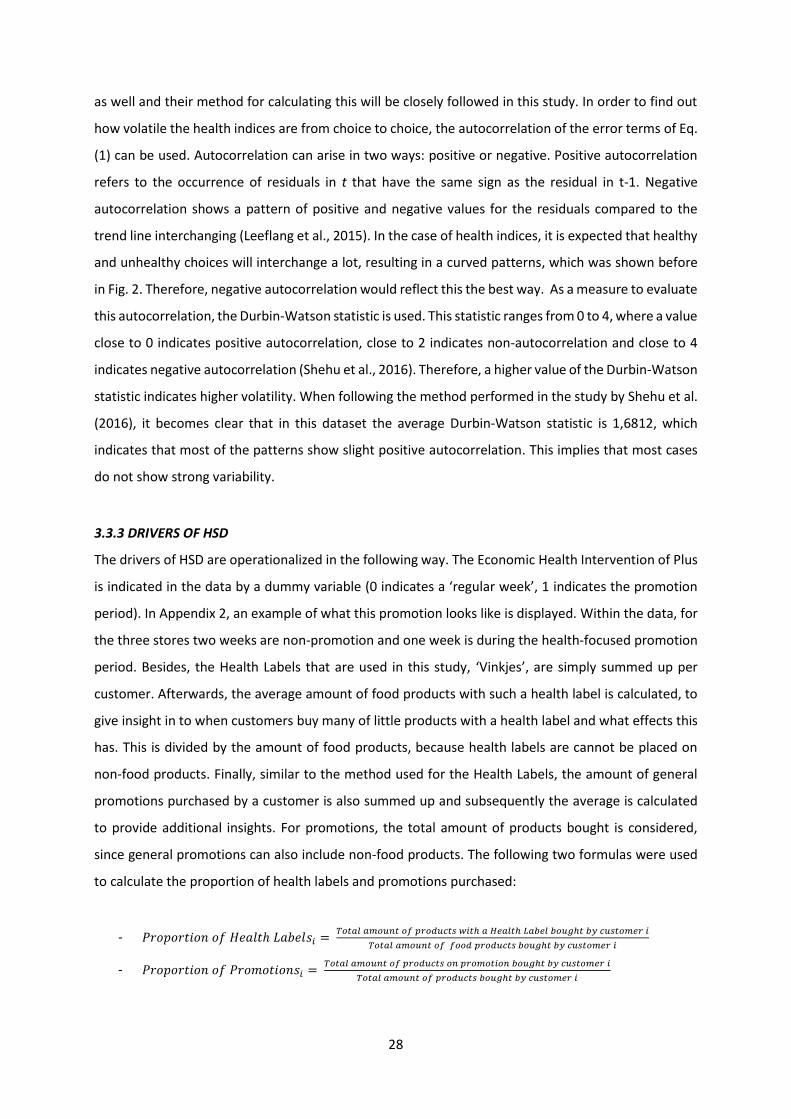
3.3.3 DRIVERS OF HSD
The drivers of HSD are operationalized in the following way. The Economic Health Intervention of Plus
is indicated in the data by a dummy variable (0 indicates a ‘regular week’, 1 indicates the promotion
period). In Appendix 2, an example of what this promotion looks like is displayed. Within the data, for
the three stores two weeks are non-promotion and one week is during the health-focused promotion
period. Besides, the Health Labels that are used in this study, ‘Vinkjes’, are simply summed up per
customer. Afterwards, the average amount of food products with such a health label is calculated, to
give insight in to when customers buy many of little products with a health label and what effects this
has. This is divided by the amount of food products, because health labels are cannot be placed on
non-food products. Finally, similar to the method used for the Health Labels, the amount of general
promotions purchased by a customer is also summed up and subsequently the average is calculated
to provide additional insights. For promotions, the total amount of products bought is considered,
since general promotions can also include non-food products. The following two formulas were used
to calculate the proportion of health labels and promotions purchased:
- 𝑃𝑟𝑜𝑝𝑜𝑟𝑡𝑖𝑜𝑛 𝑜𝑓 𝐻𝑒𝑎𝑙𝑡ℎ 𝐿𝑎𝑏𝑒𝑙𝑠𝑖 = 𝑇𝑜𝑡𝑎𝑙 𝑎𝑚𝑜𝑢𝑛𝑡 𝑜𝑓 𝑝𝑟𝑜𝑑𝑢𝑐𝑡𝑠 𝑤𝑖𝑡ℎ 𝑎 𝐻𝑒𝑎𝑙𝑡ℎ 𝐿𝑎𝑏𝑒𝑙 𝑏𝑜𝑢𝑔ℎ𝑡 𝑏𝑦 𝑐𝑢𝑠𝑡𝑜𝑚𝑒𝑟 𝑖
𝑇𝑜𝑡𝑎𝑙 𝑎𝑚𝑜𝑢𝑛𝑡 𝑜𝑓 𝑓𝑜𝑜𝑑 𝑝𝑟𝑜𝑑𝑢𝑐𝑡𝑠 𝑏𝑜𝑢𝑔ℎ𝑡 𝑏𝑦 𝑐𝑢𝑠𝑡𝑜𝑚𝑒𝑟 𝑖
- 𝑃𝑟𝑜𝑝𝑜𝑟𝑡𝑖𝑜𝑛 𝑜𝑓 𝑃𝑟𝑜𝑚𝑜𝑡𝑖𝑜𝑛𝑠𝑖 = 𝑇𝑜𝑡𝑎𝑙 𝑎𝑚𝑜𝑢𝑛𝑡 𝑜𝑓 𝑝𝑟𝑜𝑑𝑢𝑐𝑡𝑠 𝑜𝑛 𝑝𝑟𝑜𝑚𝑜𝑡𝑖𝑜𝑛 𝑏𝑜𝑢𝑔ℎ𝑡 𝑏𝑦 𝑐𝑢𝑠𝑡𝑜𝑚𝑒𝑟 𝑖
𝑇𝑜𝑡𝑎𝑙 𝑎𝑚𝑜𝑢𝑛𝑡 𝑜𝑓 𝑝𝑟𝑜𝑑𝑢𝑐𝑡𝑠 𝑏𝑜𝑢𝑔ℎ𝑡 𝑏𝑦 𝑐𝑢𝑠𝑡𝑜𝑚𝑒𝑟 𝑖
29
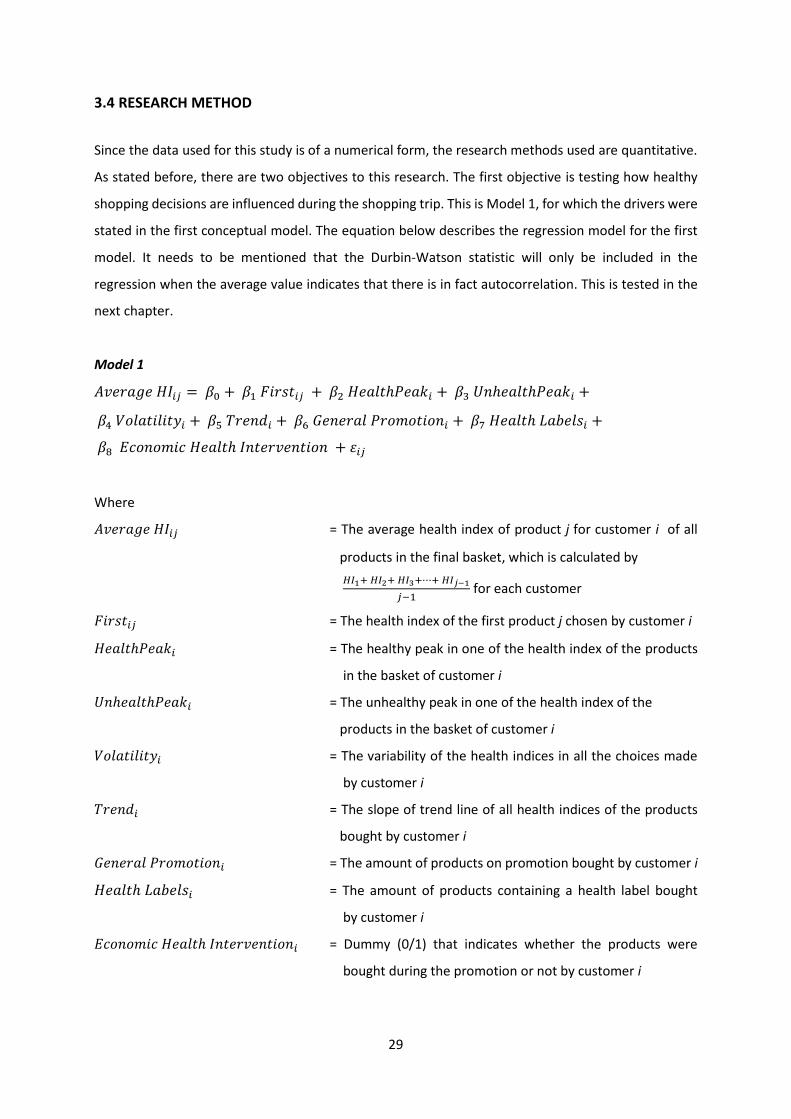
3.4 RESEARCH METHOD
Since the data used for this study is of a numerical form, the research methods used are quantitative.
As stated before, there are two objectives to this research. The first objective is testing how healthy
shopping decisions are influenced during the shopping trip. This is Model 1, for which the drivers were
stated in the first conceptual model. The equation below describes the regression model for the first
model. It needs to be mentioned that the Durbin-Watson statistic will only be included in the
regression when the average value indicates that there is in fact autocorrelation. This is tested in the
next chapter.
Model 1
𝐴𝑣𝑒𝑟𝑎𝑔𝑒 𝐻𝐼𝑖𝑗 = 𝛽0 + 𝛽1 𝐹𝑖𝑟𝑠𝑡𝑖𝑗 + 𝛽2 𝐻𝑒𝑎𝑙𝑡ℎ𝑃𝑒𝑎𝑘𝑖 + 𝛽3 𝑈𝑛ℎ𝑒𝑎𝑙𝑡ℎ𝑃𝑒𝑎𝑘𝑖 +
𝛽4 𝑉𝑜𝑙𝑎𝑡𝑖𝑙𝑖𝑡𝑦𝑖 + 𝛽5 𝑇𝑟𝑒𝑛𝑑𝑖 + 𝛽6 𝐺𝑒𝑛𝑒𝑟𝑎𝑙 𝑃𝑟𝑜𝑚𝑜𝑡𝑖𝑜𝑛𝑖 + 𝛽7 𝐻𝑒𝑎𝑙𝑡ℎ 𝐿𝑎𝑏𝑒𝑙𝑠𝑖 +
𝛽8 𝐸𝑐𝑜𝑛𝑜𝑚𝑖𝑐 𝐻𝑒𝑎𝑙𝑡ℎ 𝐼𝑛𝑡𝑒𝑟𝑣𝑒𝑛𝑡𝑖𝑜𝑛 + 𝜀𝑖𝑗
Where
𝐴𝑣𝑒𝑟𝑎𝑔𝑒 𝐻𝐼𝑖𝑗 = The average health index of product j for customer i of all
products in the final basket, which is calculated by
𝐻𝐼1+ 𝐻𝐼2+ 𝐻𝐼3+⋯+ 𝐻𝐼𝑗−1
𝑗−1 for each customer
𝐹𝑖𝑟𝑠𝑡𝑖𝑗 = The health index of the first product j chosen by customer i
𝐻𝑒𝑎𝑙𝑡ℎ𝑃𝑒𝑎𝑘𝑖 = The healthy peak in one of the health index of the products
in the basket of customer i
𝑈𝑛ℎ𝑒𝑎𝑙𝑡ℎ𝑃𝑒𝑎𝑘𝑖 = The unhealthy peak in one of the health index of the
products in the basket of customer i
𝑉𝑜𝑙𝑎𝑡𝑖𝑙𝑖𝑡𝑦𝑖 = The variability of the health indices in all the choices made
by customer i
𝑇𝑟𝑒𝑛𝑑𝑖 = The slope of trend line of all health indices of the products
bought by customer i
𝐺𝑒𝑛𝑒𝑟𝑎𝑙 𝑃𝑟𝑜𝑚𝑜𝑡𝑖𝑜𝑛𝑖 = The amount of products on promotion bought by customer i
𝐻𝑒𝑎𝑙𝑡ℎ 𝐿𝑎𝑏𝑒𝑙𝑠𝑖 = The amount of products containing a health label bought
by customer i
𝐸𝑐𝑜𝑛𝑜𝑚𝑖𝑐 𝐻𝑒𝑎𝑙𝑡ℎ 𝐼𝑛𝑡𝑒𝑟𝑣𝑒𝑛𝑡𝑖𝑜𝑛𝑖 = Dummy (0/1) that indicates whether the products were
bought during the promotion or not by customer i

30
Model 2 will be presented after an explanation of the operationalization of the second dependent
variable: health index of the next purchase. The objective of Model 2 is to find out whether a pattern
can be distinguished in the healthy shopping decisions customers make while shopping for groceries.
One product category will be taken into account to test whether it is possible to build a prediction
model that forecasts how relatively healthy the next purchase decision in this category will be. In
theory, this could be attempted for all product categories in the supermarket. However, to try whether
it works, it will first only be built for one category. All categories have different healthiness scores
relative to the other categories, and some of them have larger differences between the health scores
of products within the category than others. In this study, the product category ‘dairy’ is chosen to test
the prediction model, for the following reasons:
1. When looking at the store plan of the average Plus supermarket, it becomes evident that the
dairy section is situated in the second part of the store. This means that customers already
made a number of choices before getting to this section, which provides the basis for building
a prediction model;
2. Dairy is usually perceived as quite a healthy product, as it contains calcium which is good for
the body and can prevent for instance osteoporosis at a later age (Voedingscentrum, 2016).
The data also shows that compared to other product categories, dairy is a relatively very
healthy category, with a health index far below one (0,3933). As this study investigates healthy
shopping behavior, it makes sense to choose a category that is healthy and to see whether the
healthy choices can be predicted;
3. Even though that on average the dairy section contains relatively healthy products, within the
category itself the decisions can vary from very healthy (Lowest Health Index = 0,130) to very
unhealthy (Highest Health Index = 5,547). Therefore, even while the decision to buy a dairy
product per se is healthy, within the section the choice can still be possibly unhealthy.
Since the dairy section offers a number of interesting factors, this category is chosen to build the
prediction model. In order to do this, the dataset had to be altered. All customers who did not buy any
dairy products were excluded, leaving a dataset containing 2003 customers. This means that all
customers are included: not only the ones that only made a few decisions before arriving at the dairy
section, but also customers who made more than fifty decisions. The dataset was split at the first dairy
purchase made by the customers, deleting all following product choices. The first dairy purchase
became the dependent variable. For the prediction part of the analysis, this variable was excluded
from the dataset and the remaining variables were used to predict the health indices of the first dairy
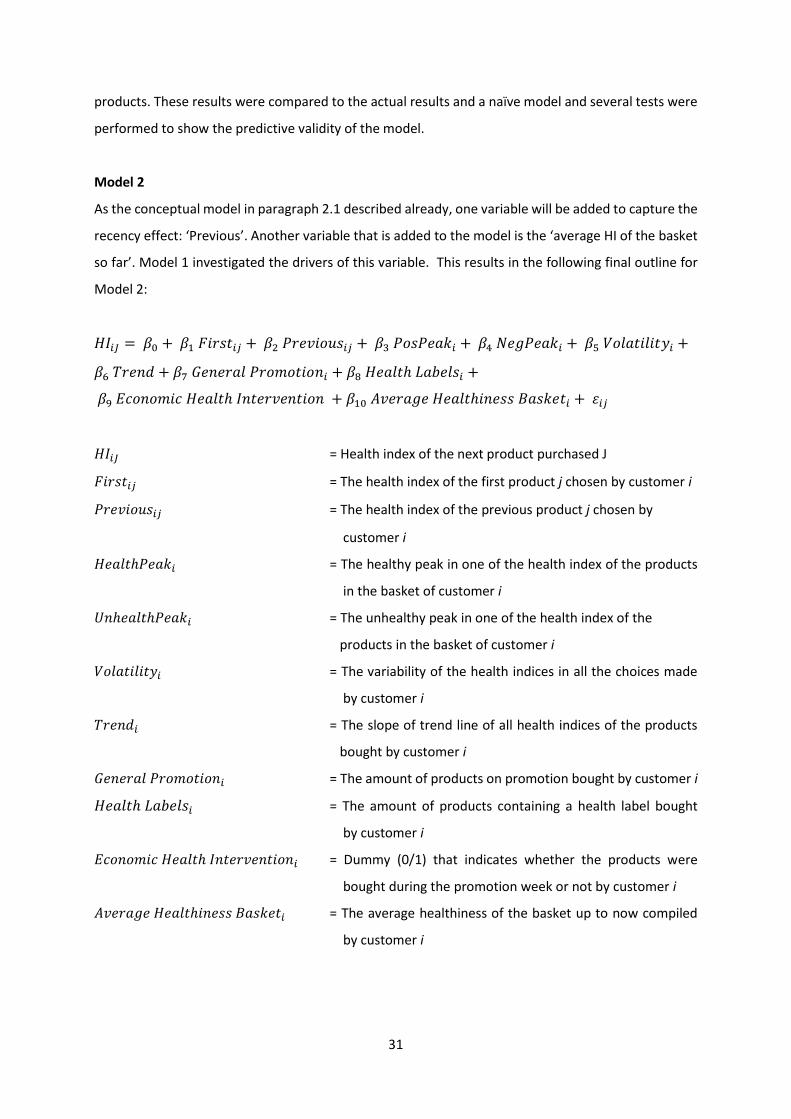
31
products. These results were compared to the actual results and a naïve model and several tests were
performed to show the predictive validity of the model.
Model 2
As the conceptual model in paragraph 2.1 described already, one variable will be added to capture the
recency effect: ‘Previous’. Another variable that is added to the model is the ‘average HI of the basket
so far’. Model 1 investigated the drivers of this variable. This results in the following final outline for
Model 2:
𝐻𝐼𝑖𝐽 = 𝛽0 + 𝛽1 𝐹𝑖𝑟𝑠𝑡𝑖𝑗 + 𝛽2 𝑃𝑟𝑒𝑣𝑖𝑜𝑢𝑠𝑖𝑗 + 𝛽3 𝑃𝑜𝑠𝑃𝑒𝑎𝑘𝑖 + 𝛽4 𝑁𝑒𝑔𝑃𝑒𝑎𝑘𝑖 + 𝛽5 𝑉𝑜𝑙𝑎𝑡𝑖𝑙𝑖𝑡𝑦𝑖 +
𝛽6 𝑇𝑟𝑒𝑛𝑑 + 𝛽7 𝐺𝑒𝑛𝑒𝑟𝑎𝑙 𝑃𝑟𝑜𝑚𝑜𝑡𝑖𝑜𝑛𝑖 + 𝛽8 𝐻𝑒𝑎𝑙𝑡ℎ 𝐿𝑎𝑏𝑒𝑙𝑠𝑖 +
𝛽9 𝐸𝑐𝑜𝑛𝑜𝑚𝑖𝑐 𝐻𝑒𝑎𝑙𝑡ℎ 𝐼𝑛𝑡𝑒𝑟𝑣𝑒𝑛𝑡𝑖𝑜𝑛 + 𝛽10 𝐴𝑣𝑒𝑟𝑎𝑔𝑒 𝐻𝑒𝑎𝑙𝑡ℎ𝑖𝑛𝑒𝑠𝑠 𝐵𝑎𝑠𝑘𝑒𝑡𝑖 + 𝜀𝑖𝑗
𝐻𝐼𝑖𝐽 = Health index of the next product purchased J
𝐹𝑖𝑟𝑠𝑡𝑖𝑗 = The health index of the first product j chosen by customer i
𝑃𝑟𝑒𝑣𝑖𝑜𝑢𝑠𝑖𝑗 = The health index of the previous product j chosen by
customer i
𝐻𝑒𝑎𝑙𝑡ℎ𝑃𝑒𝑎𝑘𝑖 = The healthy peak in one of the health index of the products
in the basket of customer i
𝑈𝑛ℎ𝑒𝑎𝑙𝑡ℎ𝑃𝑒𝑎𝑘𝑖 = The unhealthy peak in one of the health index of the
products in the basket of customer i
𝑉𝑜𝑙𝑎𝑡𝑖𝑙𝑖𝑡𝑦𝑖 = The variability of the health indices in all the choices made
by customer i
𝑇𝑟𝑒𝑛𝑑𝑖 = The slope of trend line of all health indices of the products
bought by customer i
𝐺𝑒𝑛𝑒𝑟𝑎𝑙 𝑃𝑟𝑜𝑚𝑜𝑡𝑖𝑜𝑛𝑖 = The amount of products on promotion bought by customer i
𝐻𝑒𝑎𝑙𝑡ℎ 𝐿𝑎𝑏𝑒𝑙𝑠𝑖 = The amount of products containing a health label bought
by customer i
𝐸𝑐𝑜𝑛𝑜𝑚𝑖𝑐 𝐻𝑒𝑎𝑙𝑡ℎ 𝐼𝑛𝑡𝑒𝑟𝑣𝑒𝑛𝑡𝑖𝑜𝑛𝑖 = Dummy (0/1) that indicates whether the products were
bought during the promotion week or not by customer i
𝐴𝑣𝑒𝑟𝑎𝑔𝑒 𝐻𝑒𝑎𝑙𝑡ℎ𝑖𝑛𝑒𝑠𝑠 𝐵𝑎𝑠𝑘𝑒𝑡𝑖 = The average healthiness of the basket up to now compiled
by customer i
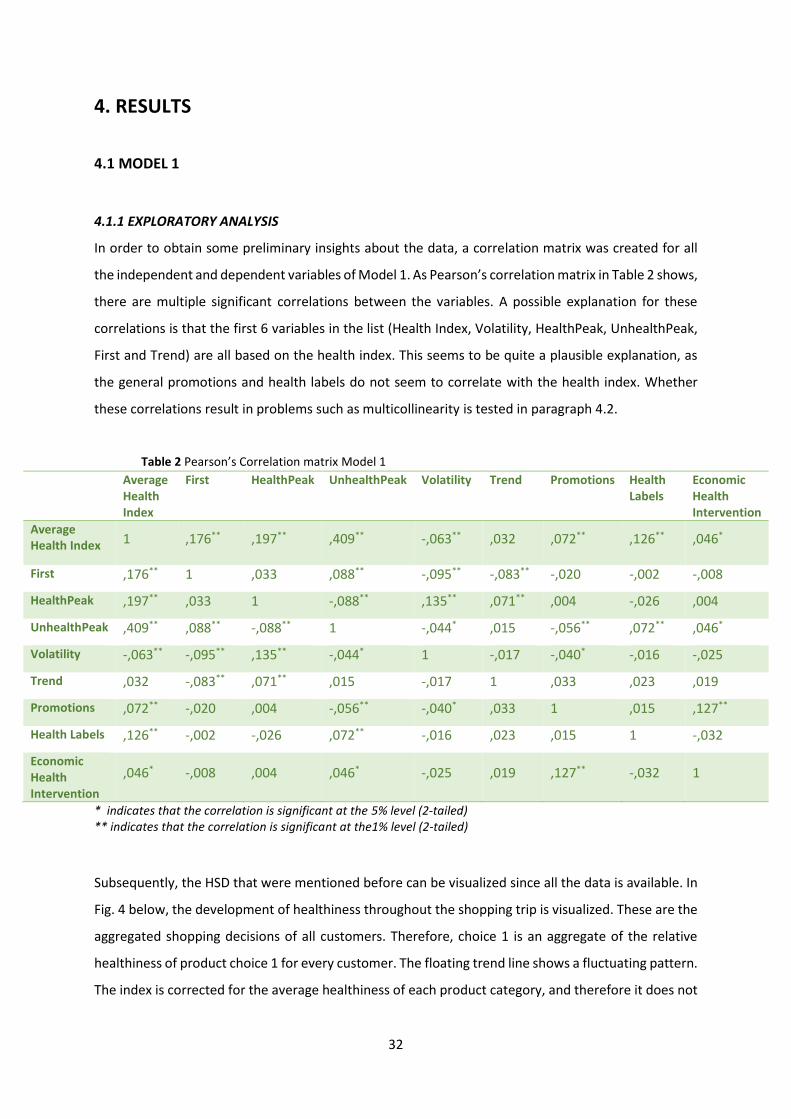
32
4. RESULTS
4.1 MODEL 1
4.1.1 EXPLORATORY ANALYSIS
In order to obtain some preliminary insights about the data, a correlation matrix was created for all
the independent and dependent variables of Model 1. As Pearson’s correlation matrix in Table 2 shows,
there are multiple significant correlations between the variables. A possible explanation for these
correlations is that the first 6 variables in the list (Health Index, Volatility, HealthPeak, UnhealthPeak,
First and Trend) are all based on the health index. This seems to be quite a plausible explanation, as
the general promotions and health labels do not seem to correlate with the health index. Whether
these correlations result in problems such as multicollinearity is tested in paragraph 4.2.
Table 2 Pearson’s Correlation matrix Model 1
Average Health Index
First HealthPeak UnhealthPeak Volatility Trend Promotions Health Labels
Economic Health Intervention
Average Health Index 1 ,176** ,197** ,409** -,063** ,032 ,072** ,126** ,046*
First ,176** 1 ,033 ,088** -,095** -,083** -,020 -,002 -,008
HealthPeak ,197** ,033 1 -,088** ,135** ,071** ,004 -,026 ,004
UnhealthPeak ,409** ,088** -,088** 1 -,044* ,015 -,056** ,072** ,046*
Volatility -,063** -,095** ,135** -,044* 1 -,017 -,040* -,016 -,025
Trend ,032 -,083** ,071** ,015 -,017 1 ,033 ,023 ,019
Promotions ,072** -,020 ,004 -,056** -,040* ,033 1 ,015 ,127**
Health Labels ,126** -,002 -,026 ,072** -,016 ,023 ,015 1 -,032
Economic Health Intervention
,046* -,008 ,004 ,046* -,025 ,019 ,127** -,032 1
* indicates that the correlation is significant at the 5% level (2-tailed) ** indicates that the correlation is significant at the1% level (2-tailed)
Subsequently, the HSD that were mentioned before can be visualized since all the data is available. In
Fig. 4 below, the development of healthiness throughout the shopping trip is visualized. These are the
aggregated shopping decisions of all customers. Therefore, choice 1 is an aggregate of the relative
healthiness of product choice 1 for every customer. The floating trend line shows a fluctuating pattern.
The index is corrected for the average healthiness of each product category, and therefore it does not

33
matter in which sequence the categories are visited. The average amount of products purchased
during all shopping trips is 18 items. Therefore, only these and an additional number of items in the
sequence are displayed in Fig. 4.
Fig. 4 Healthy Shopping Dynamics
Note: <1 = relatively healthy, 1= relatively neutral and >1 = relatively unhealthy.
The trend line resembles the ‘rollercoaster’ pattern that was mentioned before. It shows that
customers usually start their shopping trip with a relatively unhealthy trend. Afterwards, from item 5
until item 17, customers seem to pick products that are relatively healthy (<1) for a very long time.
Then, it seems that the pattern changes and trend of the shopping behavior becomes quite unhealthy.
Given that this graph was made with the shopping behavior of approximately 2.700 customers, it can
be said that this pattern is quite robust. The fluctuations in the figure prove that HSD can be
distinguished in real purchases. If there was a flat line around 1, this would indicate that customers all
shop very differently and that the average sequence of all customers would add up the same for each
point in the trip. The fact that there are a lot of fluctuations throughout the shopping trip, indicates
that HSD do evolve.
Finally, it might be interesting to find out whether the economic health intervention leads to
any differences in healthiness of customers’ baskets at all. Of course this effect is included in the
regression model, but it is interesting to gain some extra insights into this promotional campaign.

34
Table 3 Independent Samples T-test for economic health intervention
Economic Health Interventions
Economic Health Intervention Mean St. Deviation
Average HI 0 ,9957 ,17311
1 1,0123 ,18492
Independent Samples T-Test
Levene’s Test for Equality of Variances
F Significance T-value DF Significance
Equal variances not
assumed (α < 0,10) ,001 ,076* -2,244 1694,77 0,025
As Table 3 shows, the difference between the shopping weeks is significantly different. What is striking,
is that the average health index of the baskets is lower in weeks where there is no economic health
intervention, and thus the baskets are healthier in those weeks. This is not the expected effect,
considering that the promotional weeks are focusing on getting customers to choose healthier
products. Whether this effect will also come through in the regression analysis, is identified in
paragraph 4.1.3.
Before finding out whether any of the drivers are statistically significant and interpreting the
beta’s of the variables of the regression model, the model assumptions need to be checked. In the case
that there are violations of these assumptions, remedies might change the betas and their
corresponding levels of significance (Leeflang et al., 2015).
4.1.2 MODEL ASSUMPTIONS
Model assumptions about multicollinearity, normality, autocorrelation and heteroscedasticity were
tested. First of all, multicollinearity is no issue in this model, as VIF scores range from 1,005 to 1,057
and tolerance levels from 0,947 to 0,995 (Appendix 3.1). According to Leeflang et al. (2015), VIF scores
of >5 and tolerance levels <0,2 indicate problems with multicollinearity, which is not the case here.
Second, possible problems with normality were tested for the unstandardized residuals. Here,
the null hypothesis states that the error terms are normally distributed (Leeflang et al. 2015). As a
result, both the Kolmogorov-Smirnov test as the Shapiro-Wilk test indicated that with levels of
significance of p = 0,000 the null-hypothesis is rejected (Appendix 3.2). To account for this lack in
normality, the same regression was performed using a bootstrapping method, performed 1.000 times.
The results of this bootstrap are practically identical to the results of the first regression, which
indicates that the output of this regression can be interpreted without problems (Appendix 3.2). The
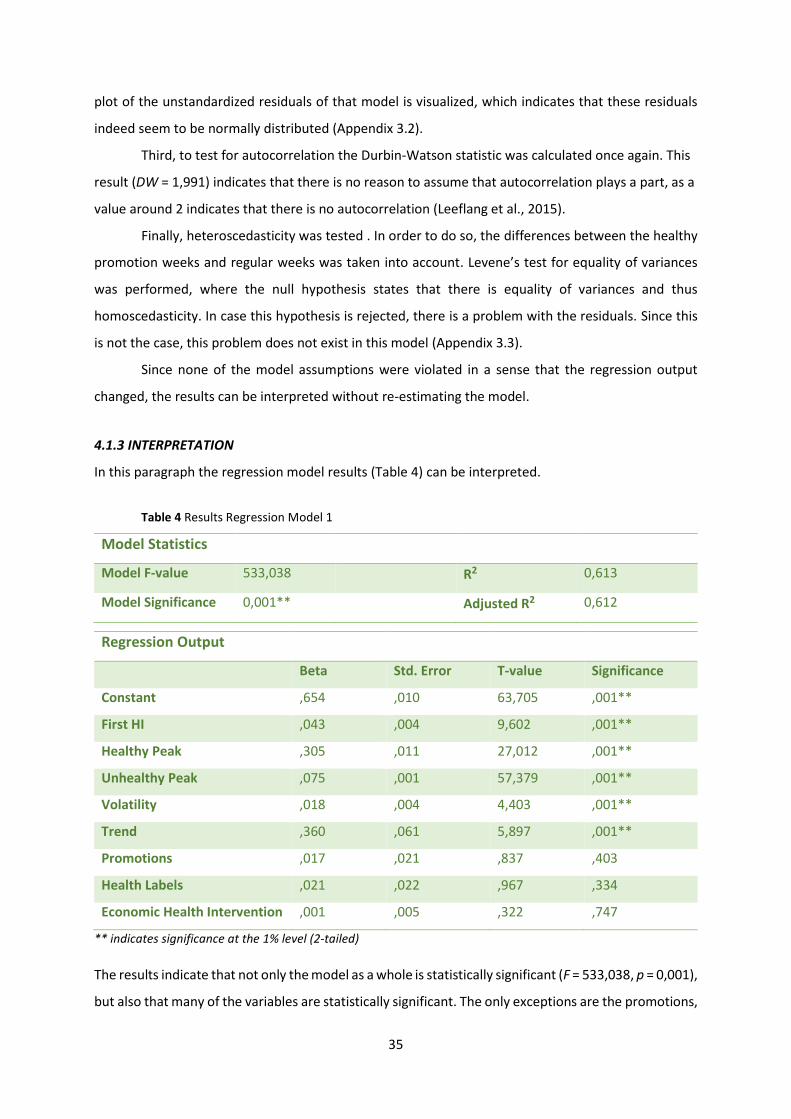
35
plot of the unstandardized residuals of that model is visualized, which indicates that these residuals
indeed seem to be normally distributed (Appendix 3.2).
Third, to test for autocorrelation the Durbin-Watson statistic was calculated once again. This
result (DW = 1,991) indicates that there is no reason to assume that autocorrelation plays a part, as a
value around 2 indicates that there is no autocorrelation (Leeflang et al., 2015).
Finally, heteroscedasticity was tested . In order to do so, the differences between the healthy
promotion weeks and regular weeks was taken into account. Levene’s test for equality of variances
was performed, where the null hypothesis states that there is equality of variances and thus
homoscedasticity. In case this hypothesis is rejected, there is a problem with the residuals. Since this
is not the case, this problem does not exist in this model (Appendix 3.3).
Since none of the model assumptions were violated in a sense that the regression output
changed, the results can be interpreted without re-estimating the model.
4.1.3 INTERPRETATION
In this paragraph the regression model results (Table 4) can be interpreted.
Table 4 Results Regression Model 1
Model Statistics
Model F-value 533,038 R2 0,613
Model Significance 0,001** Adjusted R2 0,612
Regression Output
Beta Std. Error T-value Significance
Constant ,654 ,010 63,705 ,001**
First HI ,043 ,004 9,602 ,001**
Healthy Peak ,305 ,011 27,012 ,001**
Unhealthy Peak ,075 ,001 57,379 ,001**
Volatility ,018 ,004 4,403 ,001**
Trend ,360 ,061 5,897 ,001**
Promotions ,017 ,021 ,837 ,403
Health Labels ,021 ,022 ,967 ,334
Economic Health Intervention ,001 ,005 ,322 ,747
** indicates significance at the 1% level (2-tailed)
The results indicate that not only the model as a whole is statistically significant (F = 533,038, p = 0,001),
but also that many of the variables are statistically significant. The only exceptions are the promotions,

36
health labels and the dummy that indicates the difference between the promotion and regular weeks,
which have a p-value that is higher than an α = 0,10 (resp. p = 0,401, p = 0,334 and p = 0,747). Therefore,
hypotheses 1F, 1G and 1H cannot be supported by the data. It is interesting to see that the economic
health intervention is not significant in this model, whereas the separate test showed that there is a
difference between the effect of the weeks on the average health index. This could be explained by
the other variables that are present in the model, that might rule out the effect of this variable.
Hypothesis 3A which suggested that the effect of promotions is larger than the effect of health labels
cannot be supported as well, due to the insignificance of both variables. These results mean that none
of the distinguished drivers of HSD have influence on the average health index of the basket, which is
quite unexpected. After the interpretation of all variables, an additional test was performed for the
two health labels separately, to assess whether perhaps one of the two labels influences the basket
health. The R2 of 0,613 indicates that 61,3% of the variation in the average healthiness of the basket is
explained by the variables that are included in the model.
None of the other beta’s lay within the range to be zero, and therefore all contribute to the
health indices. One by one the independent variables will be interpreted. First, the health index of the
first product purchased has a positive influence on the average health index of the basket (ß = 0,043,
p = 0,001), thereby supporting hypothesis 1A. This means that when the first purchase was one index
point higher and therefore unhealthier, it results in a shopping basket that was on average 0,043 index
points higher and therefore unhealthier and vice versa.
Second, the healthy peak (healthiest product bought) has a positive influence on the average
health index of the basket (ß = 0,305, p = 0,001), thereby supporting hypothesis 1C, which shows that
healthy peaks do indeed have an influence. Thus, when the healthiest product purchased would
increase the amount of calories with 1 index point, this would increase the average index of calories
of the shopping basket with 0,305 index points, thereby making the basket unhealthier. The other way
around, when the healthiest product would become one index point healthier, this would make the
average basket healthier, lowering the index with 0,305 index points.
Third, the unhealthy peak (unhealthiest product bought) has a positive influence on the
average health index of the basket (ß = 0,075, p = 0,000), thereby rejecting hypothesis 1D. The result
indicates that when instead of this product an even unhealthier product of 1 index point higher is
purchased, this results in an average basket health that is 0,075 index points unhealthier and vice
versa. It was expected that out of guilt, the more extremely unhealthy peaks would influence the
basket health more positively (Chen and Sengupta, 2014). However, the evidence provided by the test
suggests that this is not the case.
Fourth, the volatility of the levels of healthiness throughout the shopping trip has a slight
negative influence on the average health index of the basket (ß = 0,018, p = 0,001), thereby supporting
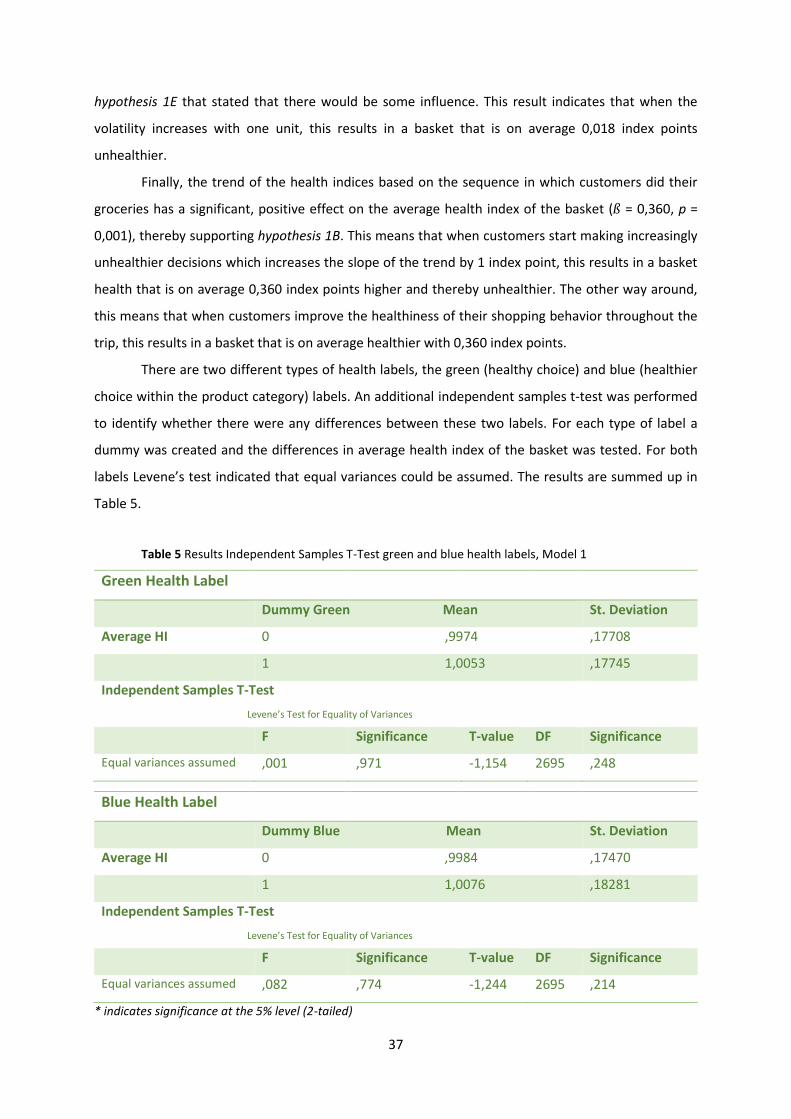
37
hypothesis 1E that stated that there would be some influence. This result indicates that when the
volatility increases with one unit, this results in a basket that is on average 0,018 index points
unhealthier.
Finally, the trend of the health indices based on the sequence in which customers did their
groceries has a significant, positive effect on the average health index of the basket (ß = 0,360, p =
0,001), thereby supporting hypothesis 1B. This means that when customers start making increasingly
unhealthier decisions which increases the slope of the trend by 1 index point, this results in a basket
health that is on average 0,360 index points higher and thereby unhealthier. The other way around,
this means that when customers improve the healthiness of their shopping behavior throughout the
trip, this results in a basket that is on average healthier with 0,360 index points.
There are two different types of health labels, the green (healthy choice) and blue (healthier
choice within the product category) labels. An additional independent samples t-test was performed
to identify whether there were any differences between these two labels. For each type of label a
dummy was created and the differences in average health index of the basket was tested. For both
labels Levene’s test indicated that equal variances could be assumed. The results are summed up in
Table 5.
Table 5 Results Independent Samples T-Test green and blue health labels, Model 1
Green Health Label
Dummy Green Mean St. Deviation
Average HI 0 ,9974 ,17708
1 1,0053 ,17745
Independent Samples T-Test
Levene’s Test for Equality of Variances
F Significance T-value DF Significance
Equal variances assumed ,001 ,971 -1,154 2695 ,248
Blue Health Label
Dummy Blue Mean St. Deviation
Average HI 0 ,9984 ,17470
1 1,0076 ,18281
Independent Samples T-Test
Levene’s Test for Equality of Variances
F Significance T-value DF Significance
Equal variances assumed ,082 ,774 -1,244 2695 ,214
* indicates significance at the 5% level (2-tailed)
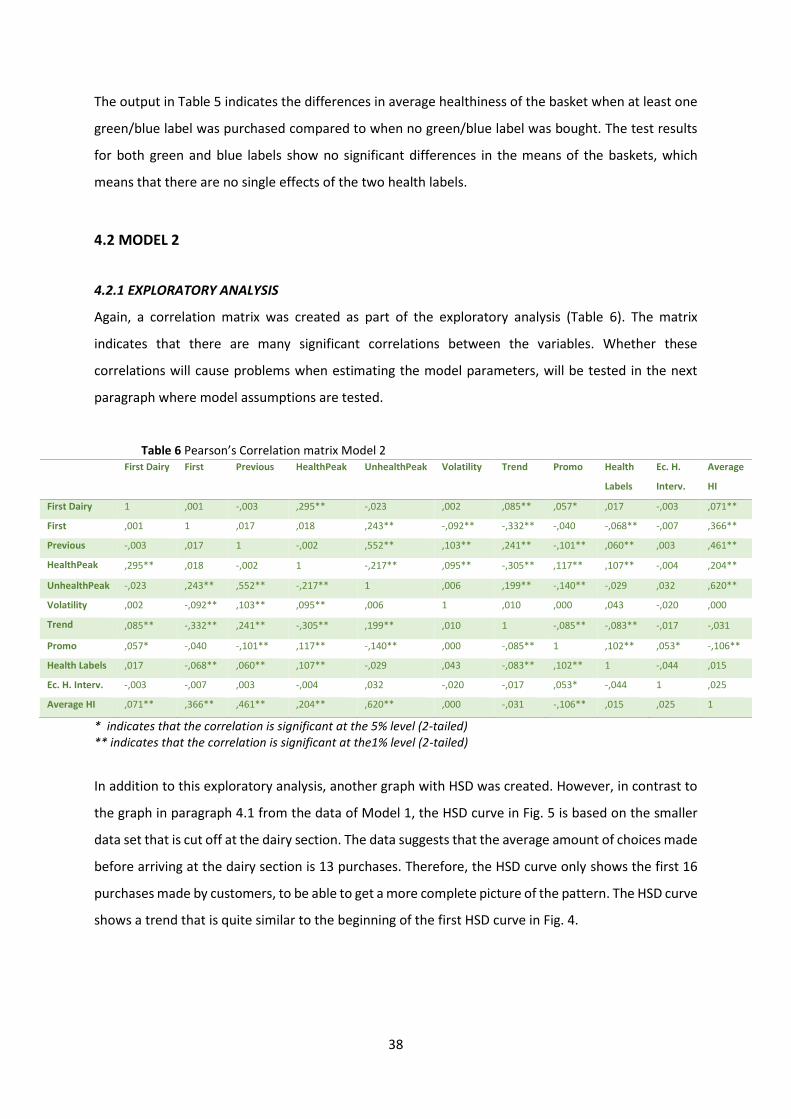
38
The output in Table 5 indicates the differences in average healthiness of the basket when at least one
green/blue label was purchased compared to when no green/blue label was bought. The test results
for both green and blue labels show no significant differences in the means of the baskets, which
means that there are no single effects of the two health labels.
4.2 MODEL 2
4.2.1 EXPLORATORY ANALYSIS
Again, a correlation matrix was created as part of the exploratory analysis (Table 6). The matrix
indicates that there are many significant correlations between the variables. Whether these
correlations will cause problems when estimating the model parameters, will be tested in the next
paragraph where model assumptions are tested.
Table 6 Pearson’s Correlation matrix Model 2 First Dairy First Previous HealthPeak UnhealthPeak Volatility Trend Promo Health
Labels
Ec. H.
Interv.
Average
HI
First Dairy 1 ,001 -,003 ,295** -,023 ,002 ,085** ,057* ,017 -,003 ,071**
First ,001 1 ,017 ,018 ,243** -,092** -,332** -,040 -,068** -,007 ,366**
Previous -,003 ,017 1 -,002 ,552** ,103** ,241** -,101** ,060** ,003 ,461**
HealthPeak ,295** ,018 -,002 1 -,217** ,095** -,305** ,117** ,107** -,004 ,204**
UnhealthPeak -,023 ,243** ,552** -,217** 1 ,006 ,199** -,140** -,029 ,032 ,620**
Volatility ,002 -,092** ,103** ,095** ,006 1 ,010 ,000 ,043 -,020 ,000
Trend ,085** -,332** ,241** -,305** ,199** ,010 1 -,085** -,083** -,017 -,031
Promo ,057* -,040 -,101** ,117** -,140** ,000 -,085** 1 ,102** ,053* -,106**
Health Labels ,017 -,068** ,060** ,107** -,029 ,043 -,083** ,102** 1 -,044 ,015
Ec. H. Interv. -,003 -,007 ,003 -,004 ,032 -,020 -,017 ,053* -,044 1 ,025
Average HI ,071** ,366** ,461** ,204** ,620** ,000 -,031 -,106** ,015 ,025 1
* indicates that the correlation is significant at the 5% level (2-tailed) ** indicates that the correlation is significant at the1% level (2-tailed)
In addition to this exploratory analysis, another graph with HSD was created. However, in contrast to
the graph in paragraph 4.1 from the data of Model 1, the HSD curve in Fig. 5 is based on the smaller
data set that is cut off at the dairy section. The data suggests that the average amount of choices made
before arriving at the dairy section is 13 purchases. Therefore, the HSD curve only shows the first 16
purchases made by customers, to be able to get a more complete picture of the pattern. The HSD curve
shows a trend that is quite similar to the beginning of the first HSD curve in Fig. 4.

39
Fig 5 HSD curve Model 2
Finally, it might be interesting to find out whether the economic health intervention leads to any
differences in healthiness of customers’ first healthy choice. In theory it does not necessarily have to
be the case, since the promotion period mainly focused on the promotion of potatoes, fruit and
vegetables. The results in Table 7 show indeed that this is not the case. Of course the effect of the
economic health intervention is still included in the regression model.
Table 7 Independent Samples T-test for economic health intervention
Economic Health Interventions
Economic Health Intervention Mean St. Deviation
Average HI 0 ,89787 ,486014
1 ,89546 ,547446
Independent Samples T-Test
Levene’s Test for Equality of Variances
F Significance T-value DF Significance
Equal variances assumed ,423 ,515 ,100 2001 ,920
Again, before interpreting the beta’s of the variables of this model, the model assumptions need to be
checked. In the case that there are violations of these assumptions, remedies might change the beta’s
and their corresponding levels of significance (Leeflang et al., 2015).
40
4.2.2 MODEL ASSUMPTIONS
In this paragraph, the model assumptions multicollinearity, normality, autocorrelation and
heteroscedasticity are tested again. First, multicollinearity is no issue in this dataset, as all VIF-scores
are <5 (range from 1,010 – 1,132) and tolerance levels >0,2 (range from 0,884 – 0,990) (Appendix 4.1).
Second, normality was visualized with a histogram and tested with the Kolmogorov-Smirnov
and the Shapiro-Wilk test (Appendix 4.2). The figure illustrates that there is a bell curve, albeit slightly
skewed. The tests need to point out whether this light skewedness is influential to the normality. The
results of the tests indicated that the unstandardized residuals (that were derived with the logarithmic
dependent variable) were not normally distributed (Appendix 4.2). To deal with the non-normality, a
bootstrap was performed (Appendix 4.2). The outcomes of this bootstrap does not indicate differences
in the significance of the betas compared to the original regression model. Therefore, the regression
results can be interpreted without problems.
Third, the Durbin-Watson statistic was used to test for autocorrelation. The result (DW = 2,001)
indicates that autocorrelation does not play a part, as a value around 2 indicates no autocorrelation
(Leeflang et al., 2015).
Finally, heteroscedasticity was tested with Levene’s test for equality of variances, where once
again the unstandardized residuals were saved for the regression and the factor used was again the
healthy promotion week versus the regular weeks. The results indicate that there is no issue with the
variances over time (Levene statistic = 0,850, p = 0,357) (Appendix 4.3).
Since none of the assumptions were violated, the regression results are interpreted in the next
subparagraph.
4.2.3 INTERPRETATION
The regression output is summarized in Table 8 on the next page.
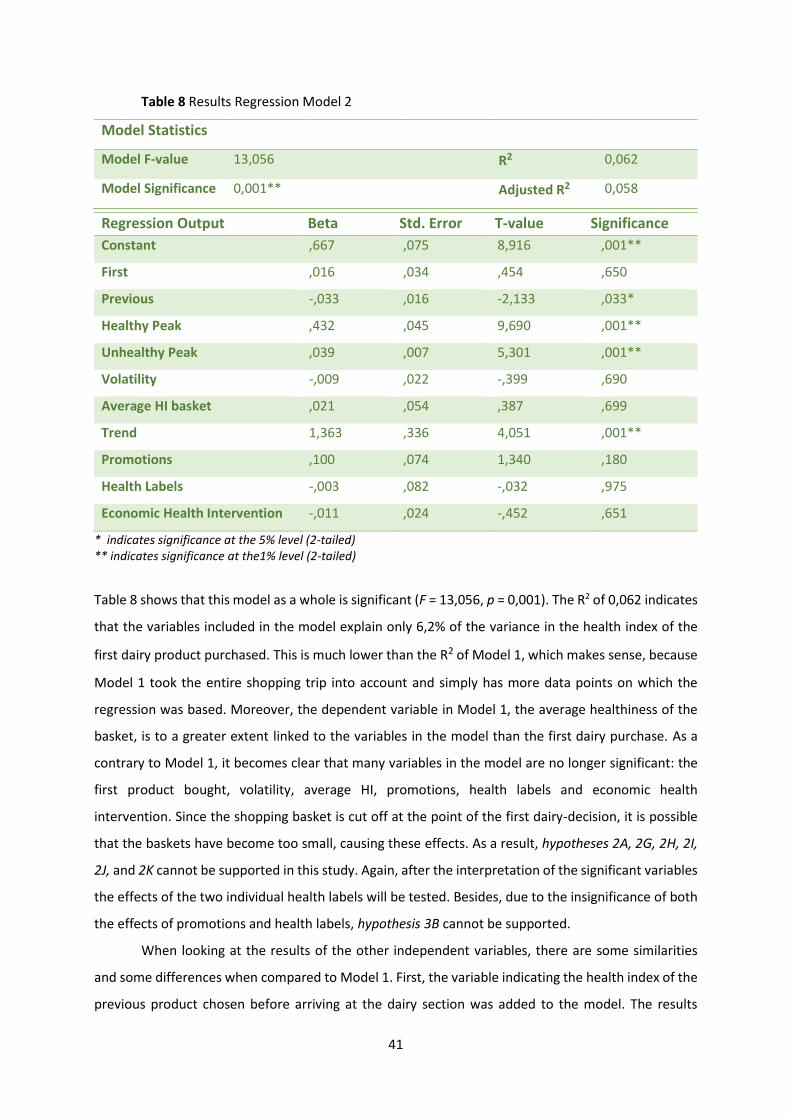
41
Table 8 Results Regression Model 2
Model Statistics
Model F-value 13,056 R2 0,062
Model Significance 0,001** Adjusted R2 0,058
Regression Output Beta Std. Error T-value Significance
Constant ,667 ,075 8,916 ,001**
First ,016 ,034 ,454 ,650
Previous -,033 ,016 -2,133 ,033*
Healthy Peak ,432 ,045 9,690 ,001**
Unhealthy Peak ,039 ,007 5,301 ,001**
Volatility -,009 ,022 -,399 ,690
Average HI basket ,021 ,054 ,387 ,699
Trend 1,363 ,336 4,051 ,001**
Promotions ,100 ,074 1,340 ,180
Health Labels -,003 ,082 -,032 ,975
Economic Health Intervention -,011 ,024 -,452 ,651
* indicates significance at the 5% level (2-tailed) ** indicates significance at the1% level (2-tailed)
Table 8 shows that this model as a whole is significant (F = 13,056, p = 0,001). The R2 of 0,062 indicates
that the variables included in the model explain only 6,2% of the variance in the health index of the
first dairy product purchased. This is much lower than the R2 of Model 1, which makes sense, because
Model 1 took the entire shopping trip into account and simply has more data points on which the
regression was based. Moreover, the dependent variable in Model 1, the average healthiness of the
basket, is to a greater extent linked to the variables in the model than the first dairy purchase. As a
contrary to Model 1, it becomes clear that many variables in the model are no longer significant: the
first product bought, volatility, average HI, promotions, health labels and economic health
intervention. Since the shopping basket is cut off at the point of the first dairy-decision, it is possible
that the baskets have become too small, causing these effects. As a result, hypotheses 2A, 2G, 2H, 2I,
2J, and 2K cannot be supported in this study. Again, after the interpretation of the significant variables
the effects of the two individual health labels will be tested. Besides, due to the insignificance of both
the effects of promotions and health labels, hypothesis 3B cannot be supported.
When looking at the results of the other independent variables, there are some similarities
and some differences when compared to Model 1. First, the variable indicating the health index of the
previous product chosen before arriving at the dairy section was added to the model. The results
42
indicate that the health index of the previous product choice has a negative influence on the health
index of the first dairy product purchased (ß = -0,033, p = 0,033), thereby supporting hypothesis 2B.
This indicates that when the health index of the previous product choice would be 1 index point higher,
the health index of the first dairy product decreases with 0,033 index points, making the dairy decisions
healthier. In Chap. 2 it was stated in another hypothesis that the effect of the previous decision would
be larger than of the first decision, as it was expected that recency effects would be larger than primacy
effects. Due to the insignificance of the primacy effect, hypothesis 2C cannot be supported.
Second, the healthy peak (healthiest product bought so far) has a positive influence on the
health index of the first dairy product purchased (ß = 0,432, p = 0,001), thereby supporting hypothesis
2E showing that healthy peaks do indeed have an influence. This implies that the healthiest product
chosen, so far, would decrease the calorie-index with 1 point, this would decrease the calorie-index of
the first dairy product choice with 0,432 index points, making this healthier and vice versa.
Third, the unhealthy peak (unhealthiest product bought so far) also has a positive influence on
the health index of the first dairy product purchased (ß = 0,039, p = 0,001), thereby rejecting hypothesis
2F. The result indicates that when instead of this product an even unhealthier product of 1 index point
higher is purchased, this results in a first dairy purchase that is 0,075 index points unhealthier and vice
versa. It was expected that out of guilt, the more extremely unhealthy peaks would influence the
health index of the dairy purchase in a positive way (Chen and Sengupta, 2014). However, this does
not turn out to be the case.
Finally, the trend of the health indices based on the sequence in which customers did their
groceries until the dairy section has a positive effect on the health index of the first dairy product
purchased (ß = 1,363, p = 0,001), thereby supporting hypothesis 2D. This effect indicates that when
customers start making increasingly unhealthier decisions which increases the slope of the trend by 1
index point, the health index of the first dairy product chosen increases with 1,363. The other way
around, this means that when customers improve the healthiness of their shopping behavior
throughout the trip, this results in a dairy choice that is 1,363 index points healthier.
Even though the health labels in the model were not significant, it is possible that there is a
minor effect of one of the labels, that was subsequently ruled out by the other insignificant health
label. Again, an independent samples t-test was performed to identify if one of the two health labels
affect the health index of the first dairy product differently. The results are summed up in Table 9 on
the next page.
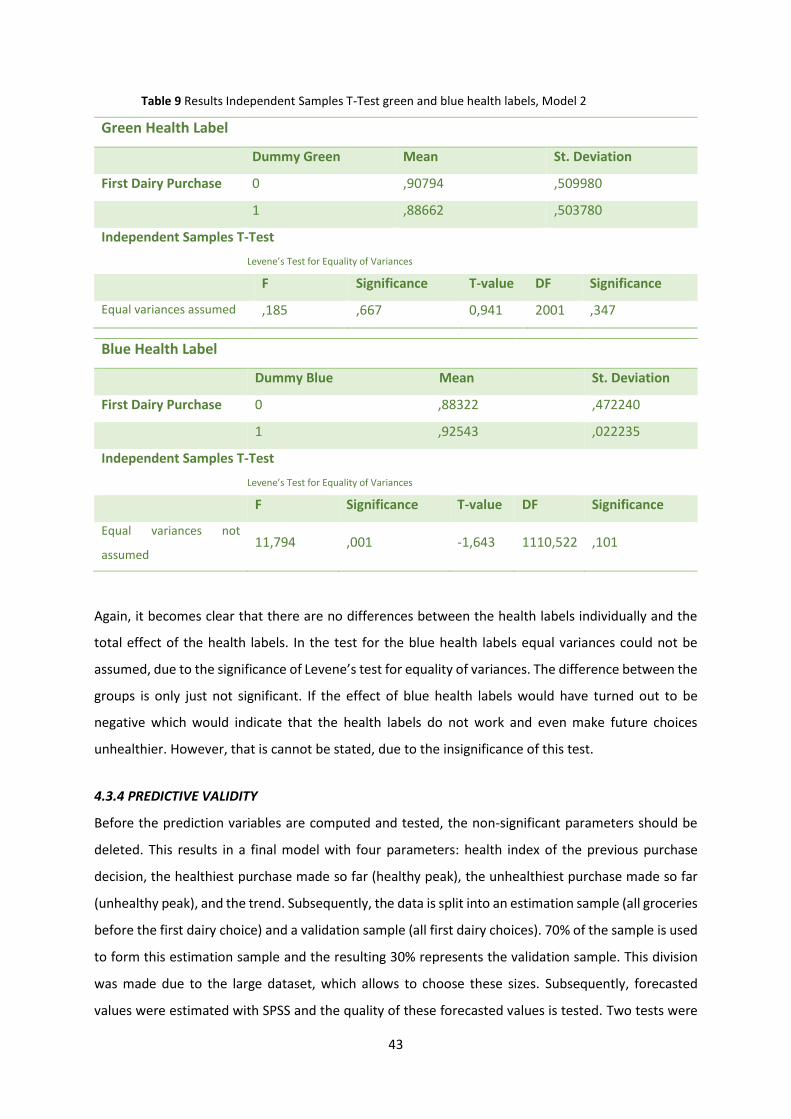
43
Table 9 Results Independent Samples T-Test green and blue health labels, Model 2
Green Health Label
Dummy Green Mean St. Deviation
First Dairy Purchase 0 ,90794 ,509980
1 ,88662 ,503780
Independent Samples T-Test
Levene’s Test for Equality of Variances
F Significance T-value DF Significance
Equal variances assumed ,185 ,667 0,941 2001 ,347
Blue Health Label
Dummy Blue Mean St. Deviation
First Dairy Purchase 0 ,88322 ,472240
1 ,92543 ,022235
Independent Samples T-Test
Levene’s Test for Equality of Variances
F Significance T-value DF Significance
Equal variances not
assumed 11,794 ,001 -1,643 1110,522 ,101
Again, it becomes clear that there are no differences between the health labels individually and the
total effect of the health labels. In the test for the blue health labels equal variances could not be
assumed, due to the significance of Levene’s test for equality of variances. The difference between the
groups is only just not significant. If the effect of blue health labels would have turned out to be
negative which would indicate that the health labels do not work and even make future choices
unhealthier. However, that is cannot be stated, due to the insignificance of this test.
4.3.4 PREDICTIVE VALIDITY
Before the prediction variables are computed and tested, the non-significant parameters should be
deleted. This results in a final model with four parameters: health index of the previous purchase
decision, the healthiest purchase made so far (healthy peak), the unhealthiest purchase made so far
(unhealthy peak), and the trend. Subsequently, the data is split into an estimation sample (all groceries
before the first dairy choice) and a validation sample (all first dairy choices). 70% of the sample is used
to form this estimation sample and the resulting 30% represents the validation sample. This division
was made due to the large dataset, which allows to choose these sizes. Subsequently, forecasted
values were estimated with SPSS and the quality of these forecasted values is tested. Two tests were

44
used for this evaluation: the MAPE and RAE. The MAPE (Mean Absolute Percentage Error) is a measure
that evaluates the robustness of the predictive performance of the model and is used because it is
dimensionless and uses the absolute value of the error terms (Leeflang et al., 2015). The lower the
percentage of the MAPE, the lower the deviation of what is estimated is. Therefore, this measure is
quite insightful. The T denotes the total sample size in the dataset and T* denotes the estimation
sample that was used to generate the prediction results. Furthermore, yt stands for the true health
index of the first dairy purchase, whereas �̂�𝑡 indicates the predicted health index. For this model, the
MAPE is
𝑀𝐴𝑃𝐸 = 1
𝑇 − 𝑇 ∗ ∑
|𝑦𝑡 − �̂�𝑡|
𝑦𝑡
𝑇
𝑡=𝑇∗ +1
𝑥 100% = 51,91%
The result of the MAPE is quite high with a percentage of about 50%, which implies that more than
half of the time the predicted values have a large deviation from the actual values. To test whether
this model still works better than a naïve model where simply the health index of the first dairy
purchase of the previous customer is expected to be the same for the next customer (Leeflang et al.,
2015). To test this, the RAE is calculated, which weighs the prediction model against this naïve model.
For this model, the RAE is
𝑅𝐴𝐸 = ∑ |𝑦𝑡 − �̂�𝑡|𝑇
𝑡=𝑇∗ +1
∑ |𝑦𝑡 − 𝑦𝑦−1|𝑇𝑡=𝑇∗ +1
= 0,69072
The RAE is <1, which indicates that the regression model functions better than a naïve model. However,
due to the negative result of the MAPE, it can be said that this regression model is not suitable for
predicting customers’ healthy choices in the dairy section.
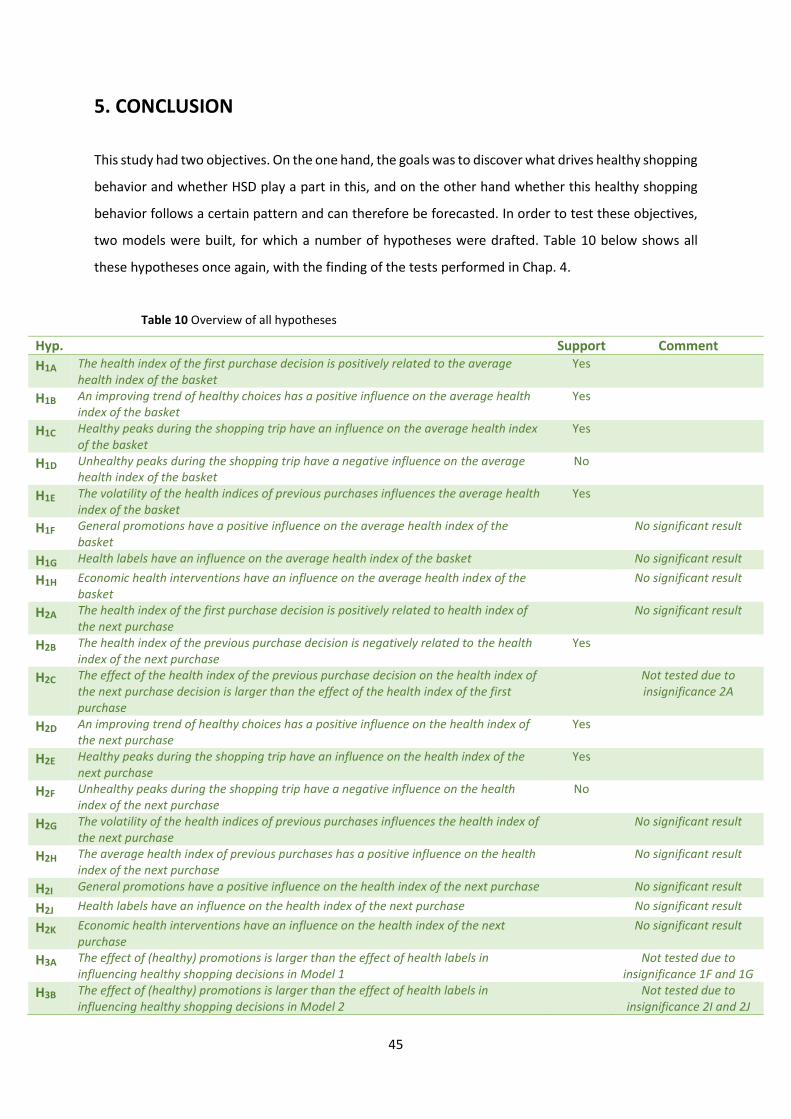
45
5. CONCLUSION
This study had two objectives. On the one hand, the goals was to discover what drives healthy shopping
behavior and whether HSD play a part in this, and on the other hand whether this healthy shopping
behavior follows a certain pattern and can therefore be forecasted. In order to test these objectives,
two models were built, for which a number of hypotheses were drafted. Table 10 below shows all
these hypotheses once again, with the finding of the tests performed in Chap. 4.
Table 10 Overview of all hypotheses
Hyp. Support Comment
H1A The health index of the first purchase decision is positively related to the average health index of the basket
Yes
H1B An improving trend of healthy choices has a positive influence on the average health index of the basket
Yes
H1C Healthy peaks during the shopping trip have an influence on the average health index of the basket
Yes
H1D Unhealthy peaks during the shopping trip have a negative influence on the average health index of the basket
No
H1E The volatility of the health indices of previous purchases influences the average health index of the basket
Yes
H1F General promotions have a positive influence on the average health index of the basket
No significant result
H1G Health labels have an influence on the average health index of the basket No significant result
H1H Economic health interventions have an influence on the average health index of the basket
No significant result
H2A The health index of the first purchase decision is positively related to health index of the next purchase
No significant result
H2B The health index of the previous purchase decision is negatively related to the health index of the next purchase
Yes
H2C The effect of the health index of the previous purchase decision on the health index of the next purchase decision is larger than the effect of the health index of the first purchase
Not tested due to insignificance 2A
H2D An improving trend of healthy choices has a positive influence on the health index of the next purchase
Yes
H2E Healthy peaks during the shopping trip have an influence on the health index of the next purchase
Yes
H2F Unhealthy peaks during the shopping trip have a negative influence on the health index of the next purchase
No
H2G The volatility of the health indices of previous purchases influences the health index of the next purchase
No significant result
H2H The average health index of previous purchases has a positive influence on the health index of the next purchase
No significant result
H2I General promotions have a positive influence on the health index of the next purchase No significant result
H2J Health labels have an influence on the health index of the next purchase No significant result
H2K Economic health interventions have an influence on the health index of the next purchase
No significant result
H3A The effect of (healthy) promotions is larger than the effect of health labels in influencing healthy shopping decisions in Model 1
Not tested due to insignificance 1F and 1G
H3B The effect of (healthy) promotions is larger than the effect of health labels in influencing healthy shopping decisions in Model 2
Not tested due to insignificance 2I and 2J
46
5.1 DISCUSSION
In this paragraph the outcomes of both models are discussed while taking into consideration the theory
developed in Chap. 2. Moreover, the research questions addressed in this study are answered in the
two paragraphs below.
5.1.1 HEALTHY SHOPPING DECISIONS
The first model was built in order to find solutions to the first research question: How are healthy
shopping decisions influenced during a shopping trip? and the three sub-questions. The first of these
questions asked what HSD look like in real purchases. The scanner data that was made available by
Plus consisted solely of 2.700 real shopping trips and was thus able to present a realistic picture. The
HSD curve in Fig. 4 (paragraph 4.1.1) proves that the healthiness of all these purchases along the
sequence of the shopping trip is not flat. The curve shows that resource depletion perhaps plays a role
in the consumer’s mind (Baumeister and Heatherton, 1996). As the curve indicates, the first half of the
trip (after the first 5 choices) is full of relatively healthy choices, whereas the second half is relatively
unhealthier. This is a great example of how customers’ self-regulation resources are limited and thus,
at a certain point, become depleted or mentally exhausted (Baumeister and Heatherton, 1996). This
explains a lot about customers’ shopping behaviors and poses an opportunity for grocery retailers to
help customers with this problem.
To answer the second sub-question that looked into the effect of HSD on the average health
index of the basket, several tests were performed. The first purchase, healthiest product purchased,
unhealthiest product purchased and the volatility were the HSD-variables that affected the average
health index of the basket. Primacy effects were proven to affect the average health index of the basket
positively, indicating that this decision in the sequence is remembered well by customers
(Montgomery and Unnava, 2009). Moreover, both healthy and unhealthy peaks have a positive
influence on the average basket healthiness. It was expected that moments of extremeness are
remembered better by customers (Montgomery and Unnava, 2009). However, the opposite effect was
expected for the unhealthy peak. Apparently feelings of guilt do not necessarily matter, which can be
caused by a lot of customers that simply do not care about shopping for healthy products yet (Chen
and Sengupta, 2014). They do not compensate their unhealthy choices for healthy ones, which could
explain this phenomenon. The positive effects for the healthy peaks may be caused by an underlying
feeling of pride (Mukhopadhyay and Johar, 2007; Williams and DeSteno, 2008). Finally, also the
volatility showed a positive influence on the average health index of the basket. The rationale behind
this effect is quite logical: when customers show more volatile behavior (Durbin-Watson statistic
increases toward negative autocorrelation), the average health index of the basket becomes higher,
47
thereby making it unhealthier. This implies that when the choice behavior fluctuates substantially,
customers lose touch with their shopping goals, resulting in a negative influence on the healthiness.
Therefore, the second sub-question can be answered with that the established HSD drivers affect the
average health index of the shopping basket at the end of the trip.
Beside these HSD-related variables, there were three other drivers included in the model to
explain healthy choices that answers last sub-question. First, buying more promotions has no
significant effect on the healthiness of shopping baskets. It was expected that when customers buy
more promotions for instance due to unplanned buying, they lose track of their healthy shopping goals,
but this did not turn out to be the case (Inman et al., 1990). Second, the total effect of health labels
did not significantly influence the average healthiness of the shopping basket. This finding is in line
with what the Consumentenbond has said as a result of their researches (Consumentenbond, 2016).
They claim that ‘Het Vinkje’ does not have a positive influence on customers’ healthy shopping
behavior. This quantitative study did find the same results as their panels indicated. There was also no
individual effect of either one of the health labels separately as well. Finally, the economic health
interventions that are used by Plus do not lead to differences in the healthiness of the shopping
baskets. This implies that as much as the campaign aims to influence customers’ healthy shopping
behavior, this does not happen. Even though this was not significant in the model, a closer look to
these economic health interventions showed that between regular and promotional weeks there is a
difference in the average health index of the basket. Surprisingly, it turns out that in regular weeks
customers have healthier end-of-trip baskets than during the promotion. Considering that the health-
focused promotion is aimed towards helping customers buy more products in the potatoes, fruit and
vegetable section, it is striking that the baskets are unhealthier during these weeks. Perhaps this can
be explained by licensing effects which eradicate the effect of a few healthy products purchased
through compensation with unhealthier products later on in the shopping trip (Waterlander et al.,
2013). The overall effect of the economic health intervention in the regression model, however, was
not significant. Therefore, the answer to the third sub-question is that none of the three identified
drivers significantly affect the average health index of the shopping basket at the end of the trip.
Considering the mentioned results, there are thus several drivers that influence healthy
shopping decisions during the shopping trip, but only in the form of HSD. In many cases, these effects
can be explained by psychological underlying processes that may not even be consciously made.
5.1.2 DISCOVERING PATTERNS TO FORECAST DECISIONS
The second model has a different purpose than the first one, as tries to find an answer to the second
research question: Can a pattern be distinguished in the scanner data that can forecast the healthiness
of customers’ purchase decisions? and a sub-question. This sub-question asks whether the drivers that

48
were used in Model 1 can be used in Model 2 to predict consumer behavior. Outcomes of tests
indicated that that was the case for some of the variables.
The primacy effects that were significant in the first model, turned out not to have an impact
in this second model. Recency effects, on the contrary, do affect the health index of the first dairy
purchase. However, this effect is negative, which could be explained by feelings of guilt of the customer
or licensing effects (Chen and Sengupta, 2014; Khan and Dhar, 2006). When a customer chooses a
relatively unhealthy product before going to the dairy section, this results in a relatively healthy dairy
purchase (due to guilt) and vice versa (licensing). It slowly becomes clear that psychological processes
in the customer’s mind play a bigger part than can be seen or perhaps even consciously felt during the
shopping trip.
Moreover, the effect of the healthiest product purchased (healthy peak) is found to be of
influence as well, as expected. Moments of extremeness stick to the mind and result in an impact on
behavior (Montgomery and Unnava, 2009). The result indicates that when the calorie index of the
healthiest choice would rise, the health index of the first dairy purchase rises as well. This is also
represented in the trend throughout the shopping trip so far: an improving trend in terms of calories
results in an unhealthier dairy choice and vice versa. This effect is also shown in the HSD curves from
both Model 1 and Model 2. In the beginning of the trip (where also the first dairy decision takes place,
when taking the average of all customers), the behavior seems to be quite determined after the first
five purchases. This might be explained by customers’ negative time preference, where they prefer an
improving trend over time compared to a declining one (Loewenstein and Prelec, 1993). In the part of
the trip until the dairy section customers seem to keep their behavior together, as there is a straight
trend towards healthier behavior. The before mentioned resource depletion does not play a part in
this part of the store (Baumeister and Heatherton, 1996). This is an important finding, as depletion
apparently starts playing a role at another section in the store. Beside the healthiest product purchase,
the unhealthiest product purchased (unhealthy peak) has a positive influence on the health index of
the first dairy product purchased. As well as in the first model, this is not in accordance with the
expectations, which indicated that they would influence the health index in a positive way due to
feelings of guilt (Chen and Sengupta, 2014). This is more in accordance with the described ‘What-The-
Hell-effect’, where customers continue to choose unhealthy foods after a first failure (Cochran and
Tesser, 1996). The unhealthiest product bought does not necessarily have to be the first unhealthy
product chosen, but it certainly affects the healthiness of the first dairy purchase in a negative way.
Again, the three separate drivers that were distinguished (promotions, health labels and
economic health intervention) proved all not to be of significance to determine the height of the health
index of the first dairy purchase. These findings are similar to the findings in Model 1, that were
discussed in the previous paragraph.
49
5.2 LIMITATIONS AND FURTHER RESEARCH
Even though this research has provided a lot of insight in the underexplored area of basket-level
scanner data, there are a number of limitations to the study. First of all, one of the larger limitations is
that the health index that is used to verify the healthiness of every purchase decision is solely based
on the amount of calories that the product contains. This information was easily available for each
product and therefore the health index was limited to the amount of calories. However, to get a
completer view of the real healthiness of a product, more information such as the amount of sugar,
fat or salt could be used as well.
Second, the dataset was limited in many ways. For starters, there was no information available
about the customers. This made it impossible to distinguish behavior between different customers and
no insight could be derived in the form of for instance differences between men and women. Besides,
there was no information available on what customers’ shopping goals were. Customers with the idea
to already shop for healthy groceries versus customers who do not care about this will most likely have
very different baskets. When it would be possible to distinguish between them, it could become clear
how their behaviors differ and how grocery retailers can help everyone towards a healthier lifestyle.
Another limitation of the dataset lies within the samples that needed to be made before the
analyses were performed. Due to a large amount of missing calorie information, it was necessary to
make these samples. Therefore, not all of the available customer data could be used. Besides, the data
was collected from only 3 weeks of 3 different stores. To acquire more in-depth insights, it would be
more interesting to include additional weeks and look at differences that could be a result of the time
of the year for instance. It seems logical that customers’ shopping behaviors are different during the
winter than in summer time. If that would be the case, grocery retailers could get a more specific idea
of how to target customers differently throughout the year.
The model created in this study appeared not to predict the next choice in the supermarket
too well. One solution for this could be to include more possible drivers of the next purchase made or
to include more customer information. Besides, it is possible that the dairy section is not the most
appropriate place in the grocery store to predict the healthiness of the next purchase. However, it
might also be a possibility that consumer behavior simply cannot be modelled in this way. Thus, more
research with this type of basket-level scanner data is thus needed.
Besides, customers seem to have the tendency to start their trip with a relatively healthy trend
until approximately the seventeenth decision. After this point, their decision behavior switches
towards relatively unhealthier choices. It is still unknown what causes this switch and therefore more
research needs to be performed to be able to forecast in which section or at after how many choices
customers seem to pass this tipping point.

50
Finally, the psychological theories discussed such as licensing were found in the patterns that
the analyses discovered (Khan and Dhar, 2006). The fact that this study used real life data makes this
finding very insightful, since such effects actually seem to exist. This implies that this type of data
should be further used in the future. Another advantage of this kind of data, is that the customers who
did the groceries were not aware that their data was going to be used for this research. In a way, they
might have even made decisions that represent their real behavior more truly than when they had to
pass a cash register, since the person behind this register would see what customers buy. Therefore,
it might also be an interesting future study to look at the differences between the healthiness of
baskets of customers that used a hand scanner versus customers who paid their groceries at a register.
5.3 MANAGERIAL IMPLICATIONS
In the Dutch grocery environment, the importance of corporate social responsibility is growing and
Plus gives the perfect example of a supermarket that is trying to help customers to do their groceries
in a healthier, more responsible way. With their promotional campaign they aim to help customers
towards purchasing healthier products. However, the results of this study only indicate that the
differences in healthiness of the baskets between regular and promotional weeks appear to be the
opposite of what was expected: customers have unhealthier baskets during the promotion week
compared to the weeks around the promotion. Therefore, it is most likely that customers compensate
their healthier choices with unhealthier ones, which gives an unwanted result. Plus might want to
change their promotional campaign slightly. Something else indicated by the results, for instance, is
that primacy effects have an influence on the healthiness of shopping baskets. This implies that
perhaps advertisements for healthy products could be placed again at the beginning of the store, since
customers seem to remember this well throughout the trip. Perhaps a display with healthy recipes,
clear posters with what healthy promotions can be bought or in-store demonstrations of how to make
healthy food with the promotions of that week could be used to help here. These are of course simply
some examples.
Moreover, the effect of the health labels was not found significant, which only backs the
research of the Consumentenbond who is already trying to get the ‘Vinkje’ out of the supermarkets.
These specific health labels are probably too confusing. If this health label would leave, it could be
replaced with a new health label. There lies an opportunity within the Dutch grocery market to
introduce a new type of label or to improve the understanding of current health label.
Finally, HSD seem to exist and evolve as the shopping trip continues and a pattern can be
distinguished. Customers seem to start their trips relatively healthy, except for the first 5 purchases.
The research has suggested that the first purchase a person makes influences the healthiness of the
51
basket. Given that the first few purchases with a negative trend towards unhealthier products, the
proposed implication of increasing marketing at the beginning of the store might also work to tackle
this phenomenon.
Moreover, after about 17 choices this trend switches to relatively unhealthy choices for a long
time. It looks like customers are trying to purchase relatively healthy products, but seem to struggle as
their shopping trip evolves, which is called depletion of the self-regulation resource. This poses an
opportunity for grocery retailers to help their customers. Different researches indicated manners to
help overcome this depletion, such as watching a comedy movie halfway, drinking a glucose drink or
receiving a surprise gift. Especially this last one could be used by grocery retailers in a trial. An example
of how this could work is by using the handscanner in the customer’s hand. For instance, after choosing
seventeen different products a message pops up saying the customer gets a 50% discount on a selected
healthy product if they purchase it in this trip. This could cause their self-regulation muscle to recharge.
5.4 FINAL CONCLUSION
This study has resulted in several implications for Dutch grocery retailers. Due to the low predictive
validity of the model, it does seem to be the case that even though drivers of future behavior can be
distinguished, this cannot provide a strong model for prediction. The rollercoaster-like patterns that
were established by the HSD give reason to believe that drivers for future behavior can be found. The
basket-level data provided interesting insights in the shopping behavior of customers and a lot of
different, new insights can be drawn from this type of data. Future research based on the same type
of data can help to understand healthy shopping dynamics even more and positively influence the
healthiness of consumers’ shopping behavior.
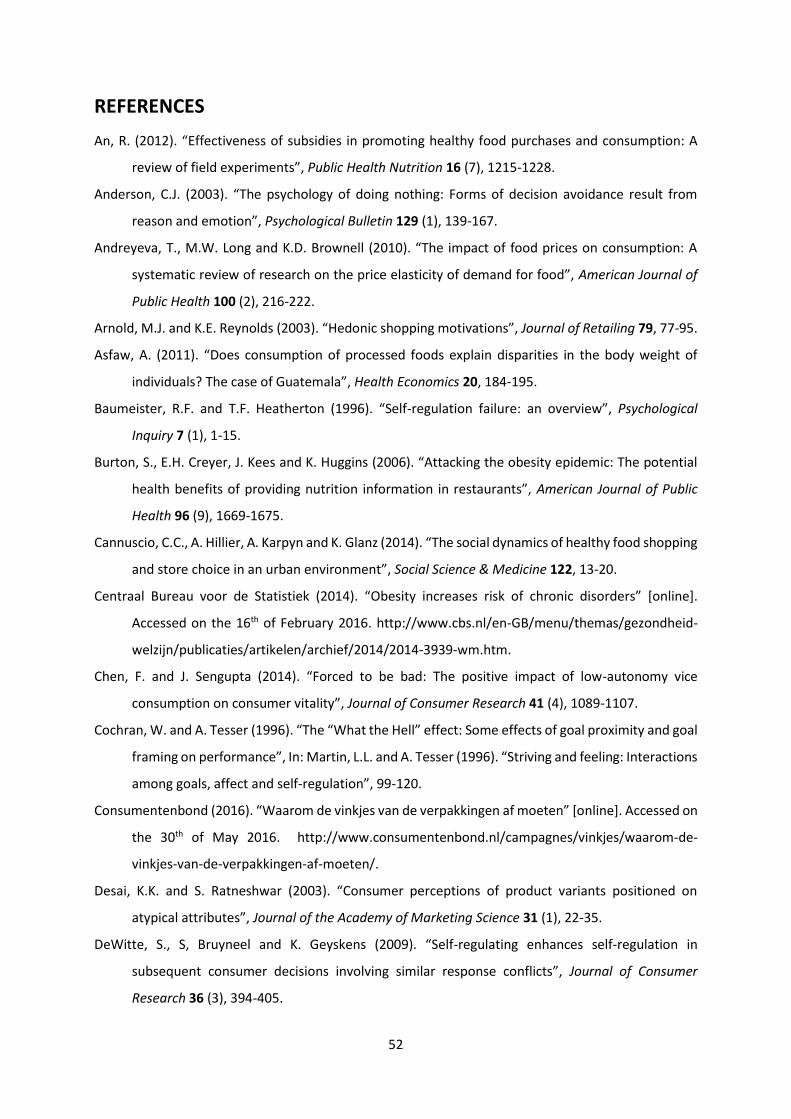
52
REFERENCES
An, R. (2012). “Effectiveness of subsidies in promoting healthy food purchases and consumption: A
review of field experiments”, Public Health Nutrition 16 (7), 1215-1228.
Anderson, C.J. (2003). “The psychology of doing nothing: Forms of decision avoidance result from
reason and emotion”, Psychological Bulletin 129 (1), 139-167.
Andreyeva, T., M.W. Long and K.D. Brownell (2010). “The impact of food prices on consumption: A
systematic review of research on the price elasticity of demand for food”, American Journal of
Public Health 100 (2), 216-222.
Arnold, M.J. and K.E. Reynolds (2003). “Hedonic shopping motivations”, Journal of Retailing 79, 77-95.
Asfaw, A. (2011). “Does consumption of processed foods explain disparities in the body weight of
individuals? The case of Guatemala”, Health Economics 20, 184-195.
Baumeister, R.F. and T.F. Heatherton (1996). “Self-regulation failure: an overview”, Psychological
Inquiry 7 (1), 1-15.
Burton, S., E.H. Creyer, J. Kees and K. Huggins (2006). “Attacking the obesity epidemic: The potential
health benefits of providing nutrition information in restaurants”, American Journal of Public
Health 96 (9), 1669-1675.
Cannuscio, C.C., A. Hillier, A. Karpyn and K. Glanz (2014). “The social dynamics of healthy food shopping
and store choice in an urban environment”, Social Science & Medicine 122, 13-20.
Centraal Bureau voor de Statistiek (2014). “Obesity increases risk of chronic disorders” [online].
Accessed on the 16th of February 2016. http://www.cbs.nl/en-GB/menu/themas/gezondheid-
welzijn/publicaties/artikelen/archief/2014/2014-3939-wm.htm.
Chen, F. and J. Sengupta (2014). “Forced to be bad: The positive impact of low-autonomy vice
consumption on consumer vitality”, Journal of Consumer Research 41 (4), 1089-1107.
Cochran, W. and A. Tesser (1996). “The “What the Hell” effect: Some effects of goal proximity and goal
framing on performance”, In: Martin, L.L. and A. Tesser (1996). “Striving and feeling: Interactions
among goals, affect and self-regulation”, 99-120.
Consumentenbond (2016). “Waarom de vinkjes van de verpakkingen af moeten” [online]. Accessed on
the 30th of May 2016. http://www.consumentenbond.nl/campagnes/vinkjes/waarom-de-
vinkjes-van-de-verpakkingen-af-moeten/.
Desai, K.K. and S. Ratneshwar (2003). “Consumer perceptions of product variants positioned on
atypical attributes”, Journal of the Academy of Marketing Science 31 (1), 22-35.
DeWitte, S., S, Bruyneel and K. Geyskens (2009). “Self-regulating enhances self-regulation in
subsequent consumer decisions involving similar response conflicts”, Journal of Consumer
Research 36 (3), 394-405.
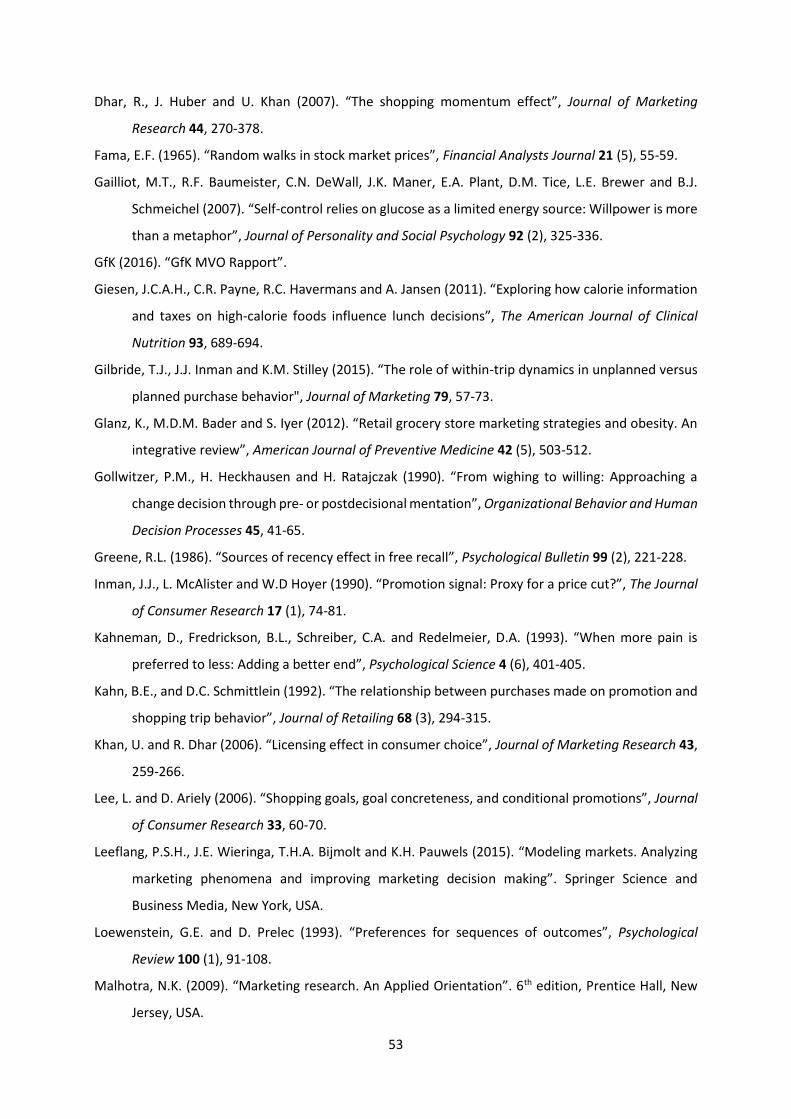
53
Dhar, R., J. Huber and U. Khan (2007). “The shopping momentum effect”, Journal of Marketing
Research 44, 270-378.
Fama, E.F. (1965). “Random walks in stock market prices”, Financial Analysts Journal 21 (5), 55-59.
Gailliot, M.T., R.F. Baumeister, C.N. DeWall, J.K. Maner, E.A. Plant, D.M. Tice, L.E. Brewer and B.J.
Schmeichel (2007). “Self-control relies on glucose as a limited energy source: Willpower is more
than a metaphor”, Journal of Personality and Social Psychology 92 (2), 325-336.
GfK (2016). “GfK MVO Rapport”.
Giesen, J.C.A.H., C.R. Payne, R.C. Havermans and A. Jansen (2011). “Exploring how calorie information
and taxes on high-calorie foods influence lunch decisions”, The American Journal of Clinical
Nutrition 93, 689-694.
Gilbride, T.J., J.J. Inman and K.M. Stilley (2015). “The role of within-trip dynamics in unplanned versus
planned purchase behavior", Journal of Marketing 79, 57-73.
Glanz, K., M.D.M. Bader and S. Iyer (2012). “Retail grocery store marketing strategies and obesity. An
integrative review”, American Journal of Preventive Medicine 42 (5), 503-512.
Gollwitzer, P.M., H. Heckhausen and H. Ratajczak (1990). “From wighing to willing: Approaching a
change decision through pre- or postdecisional mentation”, Organizational Behavior and Human
Decision Processes 45, 41-65.
Greene, R.L. (1986). “Sources of recency effect in free recall”, Psychological Bulletin 99 (2), 221-228.
Inman, J.J., L. McAlister and W.D Hoyer (1990). “Promotion signal: Proxy for a price cut?”, The Journal
of Consumer Research 17 (1), 74-81.
Kahneman, D., Fredrickson, B.L., Schreiber, C.A. and Redelmeier, D.A. (1993). “When more pain is
preferred to less: Adding a better end”, Psychological Science 4 (6), 401-405.
Kahn, B.E., and D.C. Schmittlein (1992). “The relationship between purchases made on promotion and
shopping trip behavior”, Journal of Retailing 68 (3), 294-315.
Khan, U. and R. Dhar (2006). “Licensing effect in consumer choice”, Journal of Marketing Research 43,
259-266.
Lee, L. and D. Ariely (2006). “Shopping goals, goal concreteness, and conditional promotions”, Journal
of Consumer Research 33, 60-70.
Leeflang, P.S.H., J.E. Wieringa, T.H.A. Bijmolt and K.H. Pauwels (2015). “Modeling markets. Analyzing
marketing phenomena and improving marketing decision making”. Springer Science and
Business Media, New York, USA.
Loewenstein, G.E. and D. Prelec (1993). “Preferences for sequences of outcomes”, Psychological
Review 100 (1), 91-108.
Malhotra, N.K. (2009). “Marketing research. An Applied Orientation”. 6th edition, Prentice Hall, New
Jersey, USA.
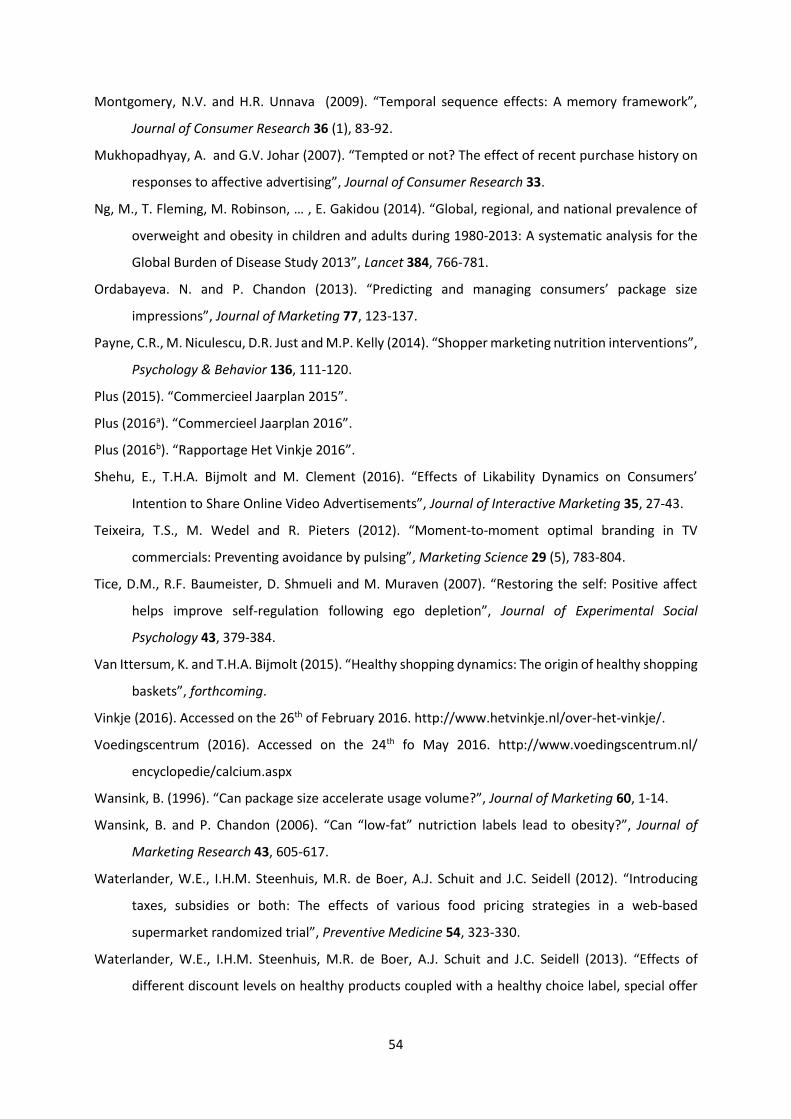
54
Montgomery, N.V. and H.R. Unnava (2009). “Temporal sequence effects: A memory framework”,
Journal of Consumer Research 36 (1), 83-92.
Mukhopadhyay, A. and G.V. Johar (2007). “Tempted or not? The effect of recent purchase history on
responses to affective advertising”, Journal of Consumer Research 33.
Ng, M., T. Fleming, M. Robinson, … , E. Gakidou (2014). “Global, regional, and national prevalence of
overweight and obesity in children and adults during 1980-2013: A systematic analysis for the
Global Burden of Disease Study 2013”, Lancet 384, 766-781.
Ordabayeva. N. and P. Chandon (2013). “Predicting and managing consumers’ package size
impressions”, Journal of Marketing 77, 123-137.
Payne, C.R., M. Niculescu, D.R. Just and M.P. Kelly (2014). “Shopper marketing nutrition interventions”,
Psychology & Behavior 136, 111-120.
Plus (2015). “Commercieel Jaarplan 2015”.
Plus (2016a). “Commercieel Jaarplan 2016”.
Plus (2016b). “Rapportage Het Vinkje 2016”.
Shehu, E., T.H.A. Bijmolt and M. Clement (2016). “Effects of Likability Dynamics on Consumers’
Intention to Share Online Video Advertisements”, Journal of Interactive Marketing 35, 27-43.
Teixeira, T.S., M. Wedel and R. Pieters (2012). “Moment-to-moment optimal branding in TV
commercials: Preventing avoidance by pulsing”, Marketing Science 29 (5), 783-804.
Tice, D.M., R.F. Baumeister, D. Shmueli and M. Muraven (2007). “Restoring the self: Positive affect
helps improve self-regulation following ego depletion”, Journal of Experimental Social
Psychology 43, 379-384.
Van Ittersum, K. and T.H.A. Bijmolt (2015). “Healthy shopping dynamics: The origin of healthy shopping
baskets”, forthcoming.
Vinkje (2016). Accessed on the 26th of February 2016. http://www.hetvinkje.nl/over-het-vinkje/.
Voedingscentrum (2016). Accessed on the 24th fo May 2016. http://www.voedingscentrum.nl/
encyclopedie/calcium.aspx
Wansink, B. (1996). “Can package size accelerate usage volume?”, Journal of Marketing 60, 1-14.
Wansink, B. and P. Chandon (2006). “Can “low-fat” nutriction labels lead to obesity?”, Journal of
Marketing Research 43, 605-617.
Waterlander, W.E., I.H.M. Steenhuis, M.R. de Boer, A.J. Schuit and J.C. Seidell (2012). “Introducing
taxes, subsidies or both: The effects of various food pricing strategies in a web-based
supermarket randomized trial”, Preventive Medicine 54, 323-330.
Waterlander, W.E., I.H.M. Steenhuis, M.R. de Boer, A.J. Schuit and J.C. Seidell (2013). “Effects of
different discount levels on healthy products coupled with a healthy choice label, special offer

55
label or both: Results from a web-based supermarket experiment”, International Journal of
Behavioral Nutrition and Physical Activity 10, 1-8.
Williams, L.A. and D. DeSteno (2008). “Pride and perseverance: The motivational role of pride”, Journal
of Personality and Social Psychology 94 (6), 1007-1017.
World Health Organization (2015). “Obesity and overweight, fact sheet 311” [online]. Accessed on the
16th of February 2016. http://www.who.int/mediacentre/factsheets/fs311/en/.
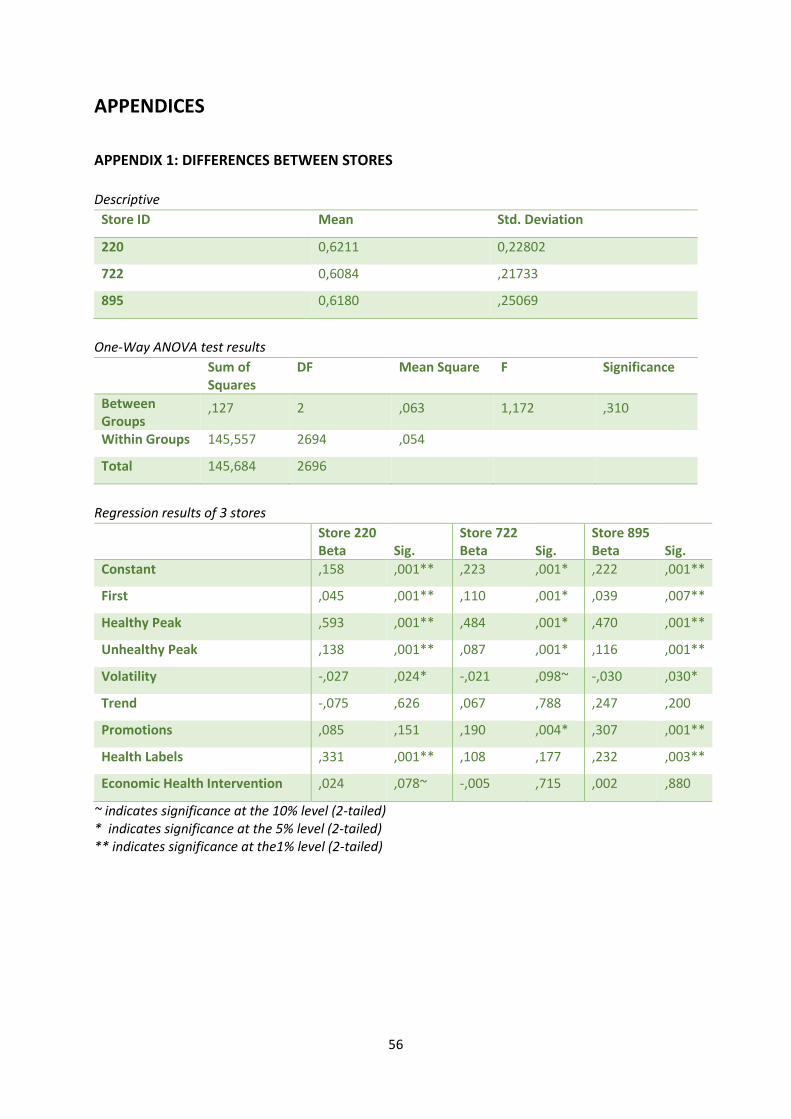
56
APPENDICES
APPENDIX 1: DIFFERENCES BETWEEN STORES
Descriptive
Store ID Mean Std. Deviation
220 0,6211 0,22802
722 0,6084 ,21733
895 0,6180 ,25069
One-Way ANOVA test results
Sum of Squares
DF Mean Square F Significance
Between Groups
,127 2 ,063 1,172 ,310
Within Groups 145,557 2694 ,054
Total 145,684 2696
Regression results of 3 stores
Store 220 Beta
Sig.
Store 722 Beta
Sig.
Store 895 Beta
Sig.
Constant ,158 ,001** ,223 ,001* ,222 ,001**
First ,045 ,001** ,110 ,001* ,039 ,007**
Healthy Peak ,593 ,001** ,484 ,001* ,470 ,001**
Unhealthy Peak ,138 ,001** ,087 ,001* ,116 ,001**
Volatility -,027 ,024* -,021 ,098~ -,030 ,030*
Trend -,075 ,626 ,067 ,788 ,247 ,200
Promotions ,085 ,151 ,190 ,004* ,307 ,001**
Health Labels ,331 ,001** ,108 ,177 ,232 ,003**
Economic Health Intervention ,024 ,078~ -,005 ,715 ,002 ,880
~ indicates significance at the 10% level (2-tailed) * indicates significance at the 5% level (2-tailed) ** indicates significance at the1% level (2-tailed)
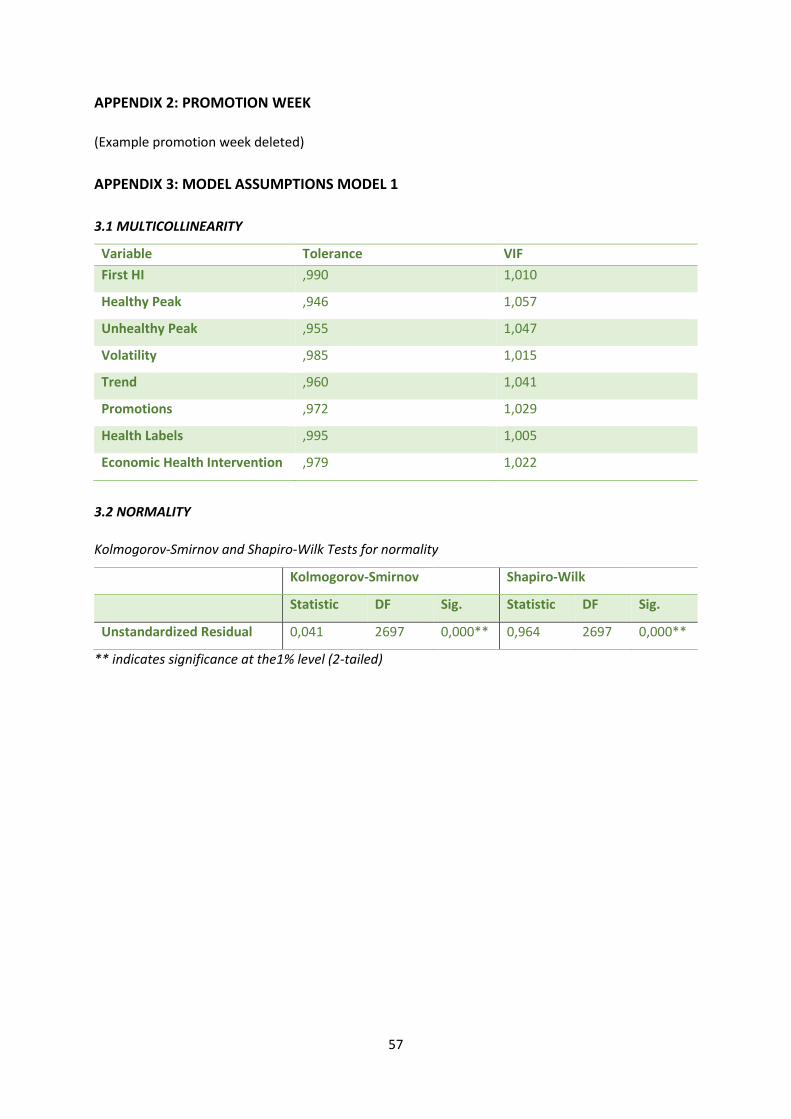
57
APPENDIX 2: PROMOTION WEEK
(Example promotion week deleted)
APPENDIX 3: MODEL ASSUMPTIONS MODEL 1
3.1 MULTICOLLINEARITY
Variable Tolerance VIF
First HI ,990 1,010
Healthy Peak ,946 1,057
Unhealthy Peak ,955 1,047
Volatility ,985 1,015
Trend ,960 1,041
Promotions ,972 1,029
Health Labels ,995 1,005
Economic Health Intervention ,979 1,022
3.2 NORMALITY
Kolmogorov-Smirnov and Shapiro-Wilk Tests for normality
Kolmogorov-Smirnov Shapiro-Wilk
Statistic DF Sig. Statistic DF Sig.
Unstandardized Residual 0,041 2697 0,000** 0,964 2697 0,000**
** indicates significance at the1% level (2-tailed)

58
Plot of distribution of unstandardized residuals
Regression and Bootstrap results
Regression Output Beta Std. Error T-value Significance
Constant ,654 ,010 63,705 ,001**
First HI ,043 ,004 9,602 ,001**
Healthy Peak ,305 ,011 27,012 ,001**
Unhealthy Peak ,075 ,001 57,379 ,001**
Volatility ,018 ,004 4,403 ,001**
Trend ,360 ,061 5,897 ,001**
Promotions ,017 ,021 ,837 ,403
Health Labels ,021 ,022 ,967 ,334
Economic Health Intervention ,001 ,005 ,322 ,747
Bootstrap Output Beta Bias Std. Error Significance
Constant ,654 ,000 ,013 ,001**
First HI ,043 3,143E-5 ,007 ,001**
Healthy Peak ,305 ,000 ,012 ,001**

59
Unhealthy Peak ,075 -5,811E-5 ,002 ,001**
Volatility ,018 3,651E-5 ,004 ,001**
Trend ,360 -,004 ,119 ,004**
Promotions ,017 ,001 ,022 ,402
Health Labels ,021 -,001 ,023 ,352
Economic Health Intervention ,001 4,581E-5 ,005 ,755
3.3 HETEROSCEDASTICITY
Levene’s Test for Homogeneity of Variance
Levene Statistic Df1 Df2 Significance
2,404 1 2695 0,121
APPENDIX 4: MODEL ASSUMPTIONS MODEL 2
4.1 MULTICOLLINEARITY
Variable Tolerance VIF
First ,935 1,069
Previous ,884 1,132
Healthy Peak ,885 1,130
Unhealthy Peak ,929 1,077
Volatility ,986 1,014
Average_HI ,885 1,130
Trend ,946 1,057
Promotions ,959 1,043
Health Labels ,981 1,019
Economic Health Intervention ,990 1,010
4.2 NORMALITY
Kolmogorov-Smirnov and Shapiro-Wilk Tests for normality
Kolmogorov-Smirnov Shapiro-Wilk
Statistic DF Sig. Statistic DF Sig.
Unstandardized Residual 0,096 1970 0,000** 0,873 1970 0,000**
** indicates significance at the1% level (2-tailed)
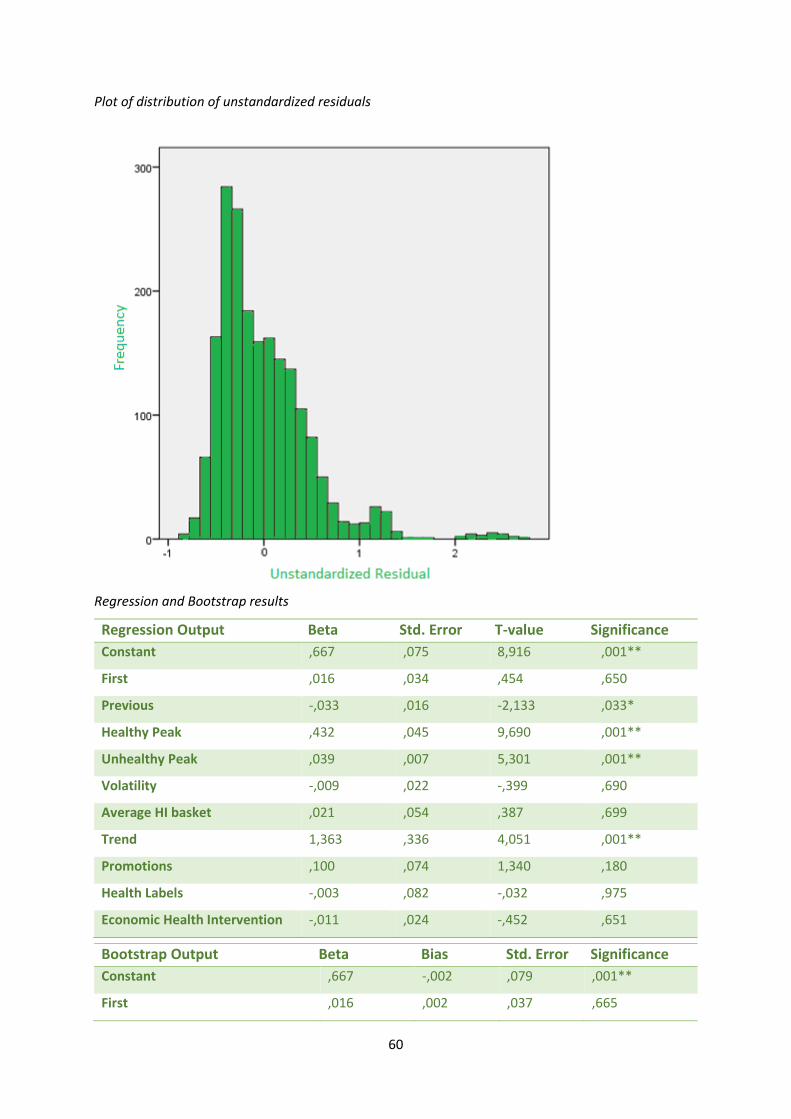
60
Plot of distribution of unstandardized residuals
Regression and Bootstrap results
Regression Output Beta Std. Error T-value Significance
Constant ,667 ,075 8,916 ,001**
First ,016 ,034 ,454 ,650
Previous -,033 ,016 -2,133 ,033*
Healthy Peak ,432 ,045 9,690 ,001**
Unhealthy Peak ,039 ,007 5,301 ,001**
Volatility -,009 ,022 -,399 ,690
Average HI basket ,021 ,054 ,387 ,699
Trend 1,363 ,336 4,051 ,001**
Promotions ,100 ,074 1,340 ,180
Health Labels -,003 ,082 -,032 ,975
Economic Health Intervention -,011 ,024 -,452 ,651
Bootstrap Output Beta Bias Std. Error Significance
Constant ,667 -,002 ,079 ,001**
First ,016 ,002 ,037 ,665
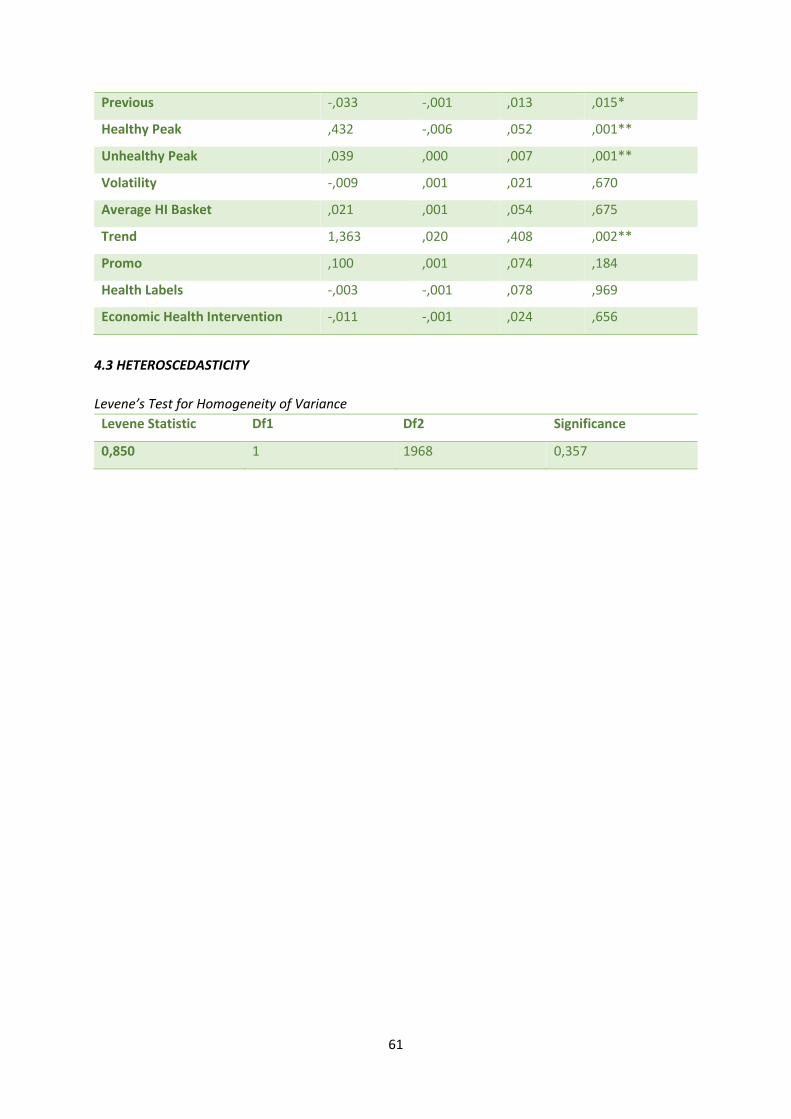
61
Previous -,033 -,001 ,013 ,015*
Healthy Peak ,432 -,006 ,052 ,001**
Unhealthy Peak ,039 ,000 ,007 ,001**
Volatility -,009 ,001 ,021 ,670
Average HI Basket ,021 ,001 ,054 ,675
Trend 1,363 ,020 ,408 ,002**
Promo ,100 ,001 ,074 ,184
Health Labels -,003 -,001 ,078 ,969
Economic Health Intervention -,011 -,001 ,024 ,656
4.3 HETEROSCEDASTICITY
Levene’s Test for Homogeneity of Variance
Levene Statistic Df1 Df2 Significance
0,850 1 1968 0,357