A Review on Step-by-Step Analytical Method Validationiosrphr.org/papers/v5i10/B051007019.pdf · A...
13
IOSR Journal Of Pharmacy (e)-ISSN: 2250-3013, (p)-ISSN: 2319-4219 www.iosrphr.org Volume 5, Issue 10 (October 2015), PP. 07-19 7 A Review on Step-by-Step Analytical Method Validation Panchumarthy Ravisankar* 1 , Ch. Naga Navya 1 , D. Pravallika 1 , D. Navya Sri 1 1 Vignan Pharmacy College, Vadlamudi, Guntur (Dist.) - 522213, Andhra Pradesh State, India. Abstract: When analytical method is utilized to generate results about the characteristics of drug related samples it is essential that the results are trustworthy. They may be utilized as the basis for decisions relating to administering the drug to patients. Analytical method validation required during drug development and manufacturing and these analytical methods are fit for their intended purpose. To comply with the requirements of GMP pharmaceutical industries should have an overall validation policy which documents how validation will be performed. The purpose of this validation is to show that processes involved in the development and manufacture of drug, production and analytical testing can be performed in an effective and reproducible manner. This review article provides guidance on how to perform validation characteristics for the analytical method which are utilized in pharmaceutical analysis. Keywords: Analytical method validation, Pharmaceutical analysis, Specificity, Precision, Accuracy. I. INTRODUCTION It may be defined that Analytical chemistry is the study of separation, quantification and chemical components identification of natural and artificial materials constituted with one or more compounds or elements. Analytical chemistry is separated into two main categories, qualitative analysis that is to say the identification with regard to the chemical components exist in the sample, where as quantitative analysis estimates the amount of certain element or compound in the substance i.e., sample. Pharmaceutical analysis [1-3] plays a very outstanding role in the examination of pharmaceutical formulations and bulk drugs regarding the quality control and assurance. Rapid increase in pharmaceutical industries [4] and production of drug in and around the world bring forward a rise in inevitable demand to seek novel and systematic analytical techniques in the pharmaceutical industries. As a consequence, analytical method development has become the basic activity of analysis. Development in scientific and concrete analytical methods has been resulted from the advancements of analytical instruments. The improvements of the analytical method development and analytical instruments have reduced the time and cost of analysis [5] and enhanced precision and accuracy. Techniques pertaining to analysis are developed and validated for active pharmaceutical ingredients, excipients, related substances, drug products, degradation products and, residual solvents, etc. Resulting which become an integral part of the required necessities for regulatory organization [6] . Analytical method development finally results in official test methods [7] . Consequently quality control laboratories used these methods to check the efficacy, identity, purity, safety as well as performance of products of the drug. Regulatory authorities give utmost importance on analytical methods in manufacturing. Drug approval by regulatory authorities requires the applicant to prove control of the entire process of drug development by using validated analytical methods [8] . The numerous novel drugs are being introduced and are constantly growing day by day. Therefore it is absolutely imperative to evolve novel methods and introduced them for controlling their quality. Modern pharmaceutical analysis needs the following requirements. 1. The analysis should take a minimal time and should be economical. 2. The accuracy of the analysis must accept the guidelines of Pharmacopoeia. 3. The chosen method should be precise and selective.
Transcript of A Review on Step-by-Step Analytical Method Validationiosrphr.org/papers/v5i10/B051007019.pdf · A...

IOSR Journal Of Pharmacy
(e)-ISSN: 2250-3013, (p)-ISSN: 2319-4219
www.iosrphr.org Volume 5, Issue 10 (October 2015), PP. 07-19
7
A Review on Step-by-Step Analytical Method Validation
Panchumarthy Ravisankar*1, Ch. Naga Navya
1, D. Pravallika
1, D. Navya Sri
1
1 Vignan Pharmacy College, Vadlamudi, Guntur (Dist.) - 522213, Andhra Pradesh State, India.
Abstract: When analytical method is utilized to generate results about the characteristics of drug related
samples it is essential that the results are trustworthy. They may be utilized as the basis for decisions relating to
administering the drug to patients. Analytical method validation required during drug development and
manufacturing and these analytical methods are fit for their intended purpose. To comply with the requirements of
GMP pharmaceutical industries should have an overall validation policy which documents how validation will be
performed. The purpose of this validation is to show that processes involved in the development and manufacture
of drug, production and analytical testing can be performed in an effective and reproducible manner. This review
article provides guidance on how to perform validation characteristics for the analytical method which are
utilized in pharmaceutical analysis.
Keywords: Analytical method validation, Pharmaceutical analysis, Specificity, Precision, Accuracy.
I. INTRODUCTION It may be defined that Analytical chemistry is the study of separation, quantification and chemical
components identification of natural and artificial materials constituted with one or more compounds or
elements. Analytical chemistry is separated into two main categories, qualitative analysis that is to say the
identification with regard to the chemical components exist in the sample, where as quantitative
analysis estimates the amount of certain element or compound in the substance i.e., sample.
Pharmaceutical analysis [1-3]
plays a very outstanding role in the examination of pharmaceutical
formulations and bulk drugs regarding the quality control and assurance. Rapid increase in pharmaceutical
industries [4]
and production of drug in and around the world bring forward a rise in inevitable demand to seek
novel and systematic analytical techniques in the pharmaceutical industries. As a consequence, analytical
method development has become the basic activity of analysis.
Development in scientific and concrete analytical methods has been resulted from the advancements of
analytical instruments. The improvements of the analytical method development and analytical instruments have
reduced the time and cost of analysis [5]
and enhanced precision and accuracy. Techniques pertaining to analysis
are developed and validated for active pharmaceutical ingredients, excipients, related substances, drug products,
degradation products and, residual solvents, etc. Resulting which become an integral part of the required
necessities for regulatory organization[6]
.
Analytical method development finally results in official test methods[7]
. Consequently quality control
laboratories used these methods to check the efficacy, identity, purity, safety as well as performance of products
of the drug. Regulatory authorities give utmost importance on analytical methods in manufacturing. Drug
approval by regulatory authorities requires the applicant to prove control of the entire process of drug
development by using validated analytical methods[8]
.
The numerous novel drugs are being introduced and are constantly growing day by day. Therefore it is
absolutely imperative to evolve novel methods and introduced them for controlling their quality. Modern
pharmaceutical analysis needs the following requirements.
1. The analysis should take a minimal time and should be economical.
2. The accuracy of the analysis must accept the guidelines of Pharmacopoeia.
3. The chosen method should be precise and selective.
A Review on Step-by-Step Analytical…
8
II. TYPICAL INSTRUMENTAL TECHNIQUES The methods of estimation of drugs are separated into physical, chemical, physicochemical and
biological categories. Of these methods, generally physical and physicochemical methods are used and the most
of the physical methods pertaining to analysis engross the studying of the different physical properties of a
substance. They are determination of the solubility, transparency or degree of turbidity, color, density or specific
gravity (for liquids), melting, freezing, boiling points and moisture content. Physicochemical methods[9, 10]
are
utilized to examine the physical phenomena that happened as a result of chemical reactions. In the
Physicochemical methods Optical (Refractometry, Polarimetry, Emission Spectrophotometry and Nephelometry
or Turbidometry), Electrochemical (Potentiometry, Amperometry and Polarography) and Chromatography
(Paper, Column, Thin Layer[11],
Gas Liquid Chromatography[12]
High Performance Liquid Chromatography[13, 14]
methods are usually preferable. Methods involving nuclear reaction like Nuclear Magnetic Resonance happened
to be more popular. GC-MS combination is one of the prominent powerful tools available. The chemical
methods include the volumetric and gravimetric procedures, which are mainly depend on complex formation,
acid – base and redox reactions. Titrations in complexometry and non-aqueous media have been extensively
utilizing in pharmaceutical analysis whenever the sensitivity at mg level is sufficient and the interferences are
negligible. The modern methods (HPLC, UPLC, GLC, GC-MS/MS, LC-NMR and Liquid chromatography–
mass spectrometry are the available choices for assay involving sophisticated equipment, which are highly
sensitive, accurate and consume very tiny amount of samples for analysis.
III. ANALYTICAL METHOD DEVELOPMENT[15-18]
When there are no authoritative methods are available, new methods are being developed for analysis
of novel products. To analyze the existing either pharmacopoeial or non-pharmacopoeial products novel
methods are developed to reduce the cost besides time for better precision and ruggedness. These methods are
optimized and validated through trial runs. Alternate methods are proposed and put into practice to replace the
existing procedure in the comparative laboratory data with all available merits and demerits.
3.1. Purpose of analytical method development
Drug analysis reveals the identification characterization & determination of the drugs in mixtures like
dosage forms & biological fluids. During manufacturing process and drug development the main purpose of
analytical methods is to provide information about potency (which can be directly related to the requirement of a
known dose), impurity (related to safety profile of the drug), bioavailability (includes key drug characteristics
such as crystal form, drug uniformity and drug release ), stability ( which indicates the degradation products ),
and effect of manufacturing parameters to ensure that the production of drug products is consistent[19]
.
The concept of quality control is intended to examine and identify a genuine and right product by series
of measures designed to avoid and get rid of errors at varied stages in production. To take a decision to release
or discard a product is based on one or more sorts of control actions. Providing simple and analytical process for
various complex formulations is a subject matter of utmost importance. Rapid increase in pharmaceutical
industries and constant production of drug in various parts of the world has brought a quick rise in demand for
new analytical techniques in the pharmaceutical industries as a consequence, analytical method development has
become the basic activity of analysis in a quality control laboratory.
The reasons for the development of novel methods of drug analysis are:
a) When there is no official drug or drug combination available in the pharmacopoeias.
b) When there is no decorous analytical process for the existing drug in the literature due to patent
regulations.
c) When there are no analytical methods for the formulation of the drug due to the interference caused
by the formulation excipients.
d) Analytical methods for the quantitation of the analyte in biological fluids are found to be unavailable.
e) The existing analytical procedures may need costly reagents and solvents. It may also involve
burdensome extraction and separation procedures.

A Review on Step-by-Step Analytical…
9
3.2. Steps for the development of the method Development procedure follows with the proper documentation. All data relating to these studies must
be recorded either in laboratory notebook or in an electronic database.
3.3. Analyte standard characterization
a) All known important information about the analyte and its structure that is to say physico-chemical
properties like solubility, optical isomerism etc., is collected.
b) The standard analyte (≈100 % purity) is obtained. Necessary arrangement is to be made for the perfect
storage (refrigerator, desiccators, and freezer).
c) In the sample matrix when multiple components are to be analyzed, the number of components is noted
duly presenting the data and the accessibility of standards is estimated.
d) Methods like spectroscopic, HPLC, GC, MS etc., are considered when matched with the sample
stability.
3.4. Method requirements The requirements of the analytical method need to develop the analytical figures of merit such as
linearity, selectivity, range, accuracy, precision, detection limits etc., shall be defined.
3.5. Literature search and prior methodology All the information of literature connected with the drug is reviewed for physico-chemical properties,
synthesis, solubility and appropriate analytical methods with reference to relevant books, journals, USP/NF,
AOAC and ASTM publications and it is highly convenient to search Chemical Abstracts Service automated
computerized literature.
3.6. Choosing a method
a) Duly utilizing the information available from the literature, methodology is evolved since the
methods are changed wherever required. Occasionally it is imperative to get additional
instrumentation to develop, modify or reproduce and validate existing procedures for analytes and
samples.
b) If there are no past suitable methods available to analyze the analyte to be examined.
3.7. Instrumental setup and initial studies
Installation, operational and performance qualification of instrumentation with reference to laboratory
standard operating procedures is verified by setting up appropriate instrumentation.
3.8. Optimization
While performing optimization, one parameter is changed at a time and a set of conditions are isolated,
before utilizing trial and error approach. The said work need to be accomplished basing on a systematic
methodical plan duly observing all steps and documented with regard to dead ends.
3.9. Documentation of analytical figures of merit
The actual decided analytical figures of merit like Limit of quantitation, Limit of detection, linearity,
time taken for analysis, cost, preparation of samples etc. are also documented.
3.10. Evaluation of development method with real samples
The sample solution should lead to unequivocal, total identification of the peak interest of the drug
apart from all other matrix components.
3.11. Estimation of percent recovery of real samples and demonstration of quantitative
sample analysis
Percent recovery of spiked, genuine standard drug into a sample matrix which contains no analyte is
estimated. Optimization to reproducibility of recovery (average ± standard deviation) from sample to sample
has to be showed. It is not necessary to get 100% recovery so far as the results are reproducible to recognize
with a high degree of certainty.

A Review on Step-by-Step Analytical…
10
IV. ANALYTICAL METHOD VALIDATION The process of validation of analytical method
[20-24] is adopted to confirm that the employed analytical
procedure for a specific tests meet the intended requirements. Guidelines from the USP, ICH, FDA etc., can
provide a framework for validations of pharmaceutical methods. Results from the method validation can be
considered to judge its quality, reliability as well consistency pertaining to analytical results. In the realm of
pharmaceutical industry the prominent reasons for validating assay are the first crucial one is validation of assay
which is the integral part of the quality-control system and secondly regulation of genuine manufacturing
practices inevitably needs assay validation.
Parameters of Analytical Method Validation
Analytical methods have been validated in pursuance of ICH guidelines of Q2 (R1)[25]
. Validation
parameters are:
1. System suitability
1. Specificity
2. Linearity
3. Precision
4. Accuracy
5. LOD
7. LOQ
8. Robustness
4.1. System Suitability System suitability testing originally believed by the industry of pharmaceuticals to decide whether a
chromatographic system is being utilized day today in a routine manner in pharmaceutical laboratories where
quality of results is most important which is suitable for a definite analysis.
The parameters used in the system suitability tests (SST) report are as follows:
Number of theoretical plates or Efficiency (N).
Capacity factor (K).
Separation or Relative retention (α).
Resolution (Rs).
Tailing factor (T).
Relative Standard Deviation (RSD).
Number of theoretical plates/Efficiency (N)
In a specified column, efficiency is defined as the measurement of the degree of peak dispersion and it
should have the column characteristics. The efficiency is conveyed in terms of number of theoretical plates‟.
The formula of calculation of N is illustrated bellow in the following Figure 1.1. (Half height method).
Figure 1. Half height method relating to determination of N.
A Review on Step-by-Step Analytical…
11
N = Efficiency / Number of theoretical plates.
Ve = Retention time of analyte.
h = Height of the peak.
w 1/2 = Gaussian function of the peak width at the half- height.
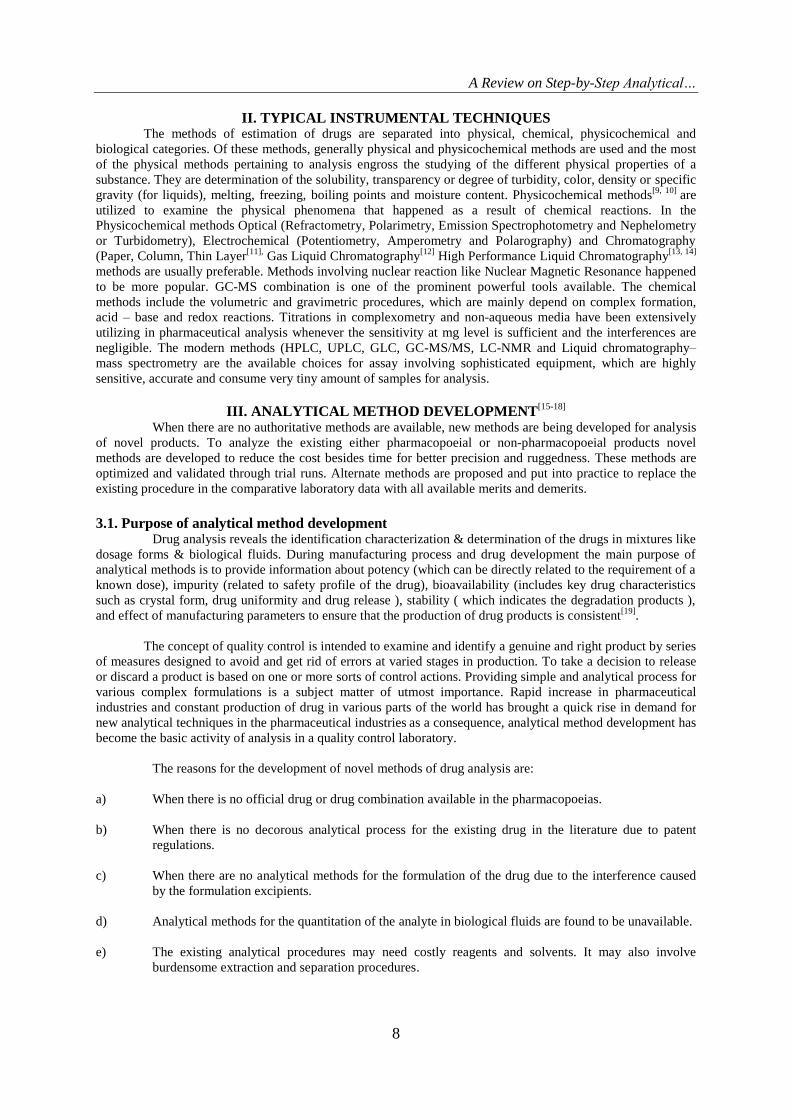
Sigma/tangential method (USP method) With the help of sigma/tangential method N is calculated which is shown in the following figure 1.2 duly noting
the formula for calculation of N.
Figure 2. Sigma/tangential method relating to determination of N.
N = Number of theoretical plates.
Ve = elution volume, retention time or retention distance (mL, sec, or cm).
h = peak height.
wb = width of the peak at the base line (mL, sec, or cm).
The plate number depends on column length. Theoretical plate number is the measure of column
efficiency. As stated by plate theory, the analyte will be in instant equilibrium with stationary phase and column
has to be divided into number of hypothetical plates and each plate consists of a fixed height and analyte spends
finite time in the plate. Height equivalent to theoretical plate (HETP) is given by following formula:
HETP = L/N, Where, (1)
L = length of column.
N = plate number.
Capacity ratio or Capacity factor (k )
(2)
The above said capacity factor sometimes is called as a retention factor which has no dimension and
independent from flow rate of mobile phase as well as column dimensions which is the measure of extent of
retention relating to an analyte relative to an un-retained peak. Where tR implies retention time of the sample
peak and retention time of an un-retained peak is tM.
k' = 0 means no compound is left in the column. Generally the value of k' is > 2.
Figure 3. Determination of capacity factor/ capacity ratio.

A Review on Step-by-Step Analytical…
12
Relative retention or separation factor (α)
(3)
= Relative retention.
= Retention time calculated from point of injection.
= Unretained peak time (Retention time (tR) of an inert component not retained by
the column).
= the retention time from the point of injection of reference peak defined. (Suppose no reference peak is
found, value would be zero).
Resolution (Rs)
Resolution is the capability of the column to separate 2 drugs in 2 individual peaks or chromatographic
zones and it is improved by enhancing column length, reduction of particle size and rising temperature, altering
the eluent or stationary phase. It can be told in terms of ratio of separation of the apex of two peaks by the
tangential width average of the peaks. By using the following formula resolution is calculated.
(4)
Figure 4. Determination of resolution between two peaks.
tR1 and tR2 are the retention times for the two peaks of components.
tw1 and tw2 = At the baseline lies between tangents drawn to the sides of the peaks. (Tangents are drawn at 0.6
times the peak height). If the peaks are correctly symmetric, provided the valley between the two peaks should
touch the baseline Rs is 1.5. Generally good value of resolution is Rs ≥2 should be adequate and preferred
normally.
Resolution factor (R)
Resolution is a function of capacity factor, function of selectivity and a function of efficiency (or)
number of theoretical plates (N). In order to separate any two peaks you must have right capacity factor ideally
between 2 and 10, but appropriate selectivity is required i.e., ideally 1.2 and enough efficiency i.e., number of
theoretical plates (more than 2000 theoretical plates). Resolution should be ≥ 1.5. 1.5 defines baseline
resolution.
Tailing factor or Asymmetry factor
Chromatographic peak assumed to have a Gaussian shape under ideal conditions. However in
practical conditions, there is always a deviation from normal distribution which indicates non-uniform migration
and non-uniform distribution process. Hence the regulatory organizations like USP and EP have recommended
this as one of the system suitability parameter. The asymmetry factor and tailing factor are roughly same and
rarely accurate and equal in most cases. Values should normally between 1.0-1.5 and values greater than 2 are
unacceptable. The peak asymmetry is computed by utilizing the following formula.
As = B/A (6)
Where:
As = peak asymmetry factor.
(5)
A Review on Step-by-Step Analytical…
13
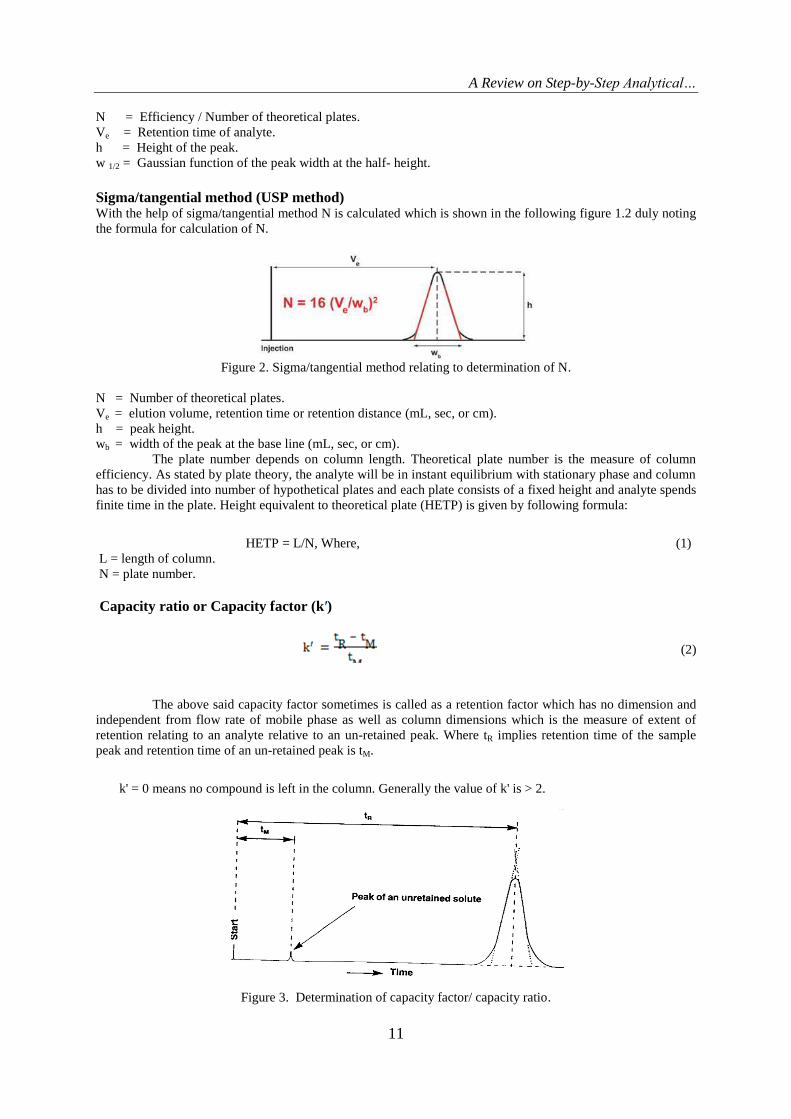
B = distance from the point at peak midpoint to the trailing edge.
(measured at 10 % of peak height).
A = distance from the leading edge of peak to the midpoint.
(measured at 10 % of peak height).
Ideally, peaks should be Gaussian in shape or totally symmetrical. Determination of tailing and asymmetric
factor is shown in Figure 1.5.
Figure 5. Determination of tailing and asymmetric factor.
Acceptance criteria (limits) of system suitability parameters are shown in the following Table 1.1.
Table 1. Acceptance criteria for system suitability parameters.
S.No Parameter name Acceptance criteria
1 Number of theoretical plates or Efficiency (N) > 2000
2 Capacity factor (K) < 1
3 Separation or Relative retention (α) > 1
4 Resolution (Rs) > 1.5
5 Tailing factor or Asymmetry(T) < 2
6 Relative Standard Deviation (RSD) < 2
4.2. Specificity One of the significant features of HPLC is its ability to generate signals free from interference.
Specificity refers to the ability of the analytical method to differentiate and quantify the analyte in complex
mixtures. An investigation of specificity is to be conducted during the determination of impurities and validation
of identification tests.
An ICH guideline defines specificity as ability to assess unequivocally the analyte in the presence of
other compounds that may be likely to be present. Typically these might be impurities, degradants, matrix, etc.
The definition has the following implications:
Identification test: Identification tests should be able to differentiate compounds of closely related
structure which are expected to be present i.e., to assure identity of an analyte.
Purity test: To ensure that the analytical procedure performed allows an accurate statement of
content of the impurity of an analyte i.e. related substances, residual solvents content, heavy metals,
etc.
Assay: To arrive at an accurate result, this permits a correct report on the potency or content of analyte
in a sample.
A Review on Step-by-Step Analytical…
14
4.3. Linearity and Range The linearity of a method is a measure of how well a calibration plot of response vs. concentration
approximates a straight line. Linearity can be assessed by performing single measurements at several analyte
concentrations. The data is then processed using a linear least-squares regression. The resulting plot slope,
intercept and correlation coefficient provide the desired information on linearity.
4.4. Precision The precision of an analytical procedure represents the nearness of agreement between a series of
measurements got from multiple sampling of the same homogenous sample under the similar analytical
conditions and it is divided into 3 categories.
Repeatability: precision under same operating conditions, same analyst over a short period of time.
Intermediate precision: method is tested on multiple days, instruments, analysts etc.
Reproducibility: inter-laboratory studies.
The ICH guidelines suggest that repeatability should be conformed duly utilizing at least 9
determinations with specified range for the procedure (e.g., three concentrations / three replicates each) or a
minimum of 6 determinations at 100 % of the test concentration.
4.5. Accuracy The accuracy of a measurement is defined as the closeness of the measured value to the true value. In
a method with high accuracy, a sample (whose “true value” is known) is analyzed and the measured value is
identical to the true value. Typically, accuracy is represented and determined by recovery studies. There are
three ways to determine accuracy:
1. Comparison to a reference standard.
2. Recovery of the analyte spiked into blank matrix.
3. Standard addition of the analyte.
It should be clear how the individual or total impurities are to be determined.
4.6. Limit of detection LOQ is determined by the analysis of samples with known concentration of analyte and by
establishing that minimum level at which the analyte can reliably detected, but not necessarily quantitated as
precise value, under the stated experimental conditions. The detection limit is generally expressed in the
concentration of analyte (ppm) in the sample.
A number of approaches are recommended by the ICH for determining the detection limit of sample,
depending on instrument used for analysis, nature of analyte and suitability of the method. The acceptable
approaches are
Visual evaluation.
Signal-to-noise ratio.
Standard deviation of the response.
Standard deviation of the slope of linearity plot.
The formula for calculating LOD is
LOD = 3.3 δ/S (7)
Where δ = standard deviation of intercepts of calibration curves.
S = the slope of linearity plot.
4.7. Limit of quantitation
Limit of quantitation is the least concentration of drug in a sample which is estimated with
appropriate precision and accuracy under the affirmed experimental conditions.

A Review on Step-by-Step Analytical…
15
Similar to LOD, ICH recommends the following four methods for estimation of LOQ. The acceptable
approaches are
Visual evaluation.
Signal-to-noise ratio.
Standard deviation of the response.
Standard deviation of the slope of linearity plot.
The formula for calculating LOQ is
LOQ = 10 δ/S (8)
Where δ = standard deviation of response.
S = Mean of slopes of the calibration curves.
4.8. Robustness
Robustness is defined by the measure of the capability of an analytical method to stay unchanged by
small deliberate changes in method parameters. The variable method parameters in HPLC technique may
involves flow rate, column temperature, sample temperature, pH and mobile phase composition.
V. STATISTICAL TREATMENT OF ANALYTICAL DATA
The function of analyst is to attain a specific result as near to the true value as feasible by the exact
application by employing analytical procedure. The state of confidence that the analyst may enjoy with his
results will be very small unless he has knowledge of the accuracy and precision of the method used as well as
being aware of the sources of error which may be introduced. Experimental measurements always have some
variability, so no conclusion can be drawn with certainty. Statistics give us tools to let conclusions that have a
high probability of being exact and to reject improbable conclusions.
The purpose of carrying out a determination is to achieve a valid estimate of a 'true' value. When one
considers the criteria as said by which an analytical procedure is selected; precision and accuracy are generally
the primary prominent point to come to mind for application. Precision and accuracy together determine the
error of an individual determination. They are among the most significant critical parameters for judging the
analytical procedures by their achieved results.
5.1. Precision
Precision may be defined as the concordance of a series of measurements (n) of the same quantity.
Precision expresses the „reproducibility‟ of a measurement. One of the most common statistical terms employed
for precision is the sample standard deviation which is shown in the following equation.
(9)
The square of standard deviation is called Variance (S2). RSD or % RSD is the absolute value of the
CV (Coefficient of Variation) and it is often stated as a % which is used to juxtapose the uncertainty among
different measurements of varying total magnitude.
5.2. Accuracy[26]
Accuracy normally refers to the difference between the mean „x‟ of the set of results and the true or
most probable value for the quantity measured. As stated by IUPAC, accuracy relates to the difference between
result (or) mean and the true value. For analytical methods, there are two feasible ways of determining the
accuracy: absolute method and comparative method.
Absolute method The test of the accuracy of the method under consideration is carried out by taking amounts of the
constituents and proceeds as said by specified instructions to perform the test for accuracy of the method. The
difference between the means of an adequate number of results and amount of constituent in fact present,
usually expressed as parts per hundred (%) which is termed as % error.
A Review on Step-by-Step Analytical…
16
The constituent in question will be determined in the presence of other substances, and it will therefore
be necessary to know the effect of the determination. This will require testing the influence of a large number of
probable compounds in the chosen samples of each varying amounts. In a few instances, the accuracy of the
method is controlled by separations (usually solvent extraction or chromatography technique) involved.
Comparative method In the analysis of pharmaceutical formulations (or solid synthetic samples of desired composition), the
content of the constituent to be sought has been determined by one or more accurate analysis methods. Basically
if several distant (dissimilar) methods of analysis for a given constituent are available, e.g. gravimetric,
titrimetric, spectrophotometric, or chromatographic, the agreement between at least two methods of essentially
different character can generally be accepted as indication of the absence of an appreciable systematic error in
either method.
Recovery experiments A known amount of the constituent being estimated is added to the sample, which is analyzed for the
total amount of constituent present. The difference between the analytical results for samples with and without
the added constituent gives the recovery of the amount of the added constituent. If the recovery is satisfactory,
our confidence in the accuracy of the procedure is improved.
5.3. Evaluation of precision and accuracy by comparison of two procedures[27]
By comparing the test method (method to be investigated) has to be compared with reference method
(existing method) to attain the accuracy of the method to be investigated.
Student t-test Student t-test is used to compare the means of two related (paired) samples analyzed by reference and
test methods. It gives answer to the correctness of the null hypothesis with a certain confidence such as 95 % or
99 %. If the number of pairs (n) is less than 30, the condition normality of x or at least the normality of the
difference (di) is required. If this is the case the quantity has a student t-distribution with (n -1) degrees of
freedom.
ns
dt
d
i
/
(10)
Where di = xR (Reference method) – xT. (Test method) and sd is the standard deviation.
F-test By the F-test we can test the significance of the difference in variances of reference and test methods.
Let us suppose that one carried out n1 replicate measurements by test methods and n2 replicate measurements by
using reference method. If the null hypothesis is true then the estimates ST2 (variance of the test method) and SR
2
(variance of reference method) do not differ very much and their ratio should not differ much from unity. In
fact, one uses the ratio of variances.
It is conventional to calculate the F - ratio by dividing the larger variance by the smaller variance in
order to attain a value equal or larger than unity. If the calculated F - value is smaller than F - value from the F-
table, one can conclude that the procedures are not significantly different in precision at a given confidence
level.
5.4. Calibration A very essential part of all analytical procedures is the calibration and standardization process.
Calibration determines the relationship between the analytical response (Absorbance, peak area, peak height
etc.,) and the analyte concentration. Generally this is accomplished by the use of chemical standards. A good
precision and accuracy can only be obtained when an excellent calibration procedure is used. In pharmaceutical
analysis the following calibration procedures are normally employed.
F = ST2 / SR
2 (11)

A Review on Step-by-Step Analytical…
17
External standard calibration
An external standard is prepared separately from the sample. External standards are used to calibrate
instruments and procedures when there are no interference effects from matrix components in the analyte
solution. A series of such external standards containing the analyte in known concentration is prepared. Ideally
three or more such solutions are used in the calibration process. Calibration is achieved by obtaining the
response signal as a function of the known analyte concentration. A calibration curve is prepared by plotting the
data or by fitting them to a suitable mathematical equation such as the linear relationship used in the method of
least squares. The next step is the prediction step, in which the response signal obtained for the sample is used to
predict the unknown analyte concentration from the calibration curve or the best fit equation.
Internal standard calibration
An internal standard is an amount of compound, different from the analyte that is added to unknown.
The signal of analyte is juxtaposed and compared with signal of internal standard to know how much quantity of
an analyte is present.
Standard addition
In standard addition, known quantities of drug are added to the unknown. From the increase in signal
and then figure out how much analyte existed in the original unknown. The standard addition method gets a
linear response to analyte.
5.5. The method of least squares[28]
In the calibration procedures ideally a linear response should be obtained. The method of least square
is a key statistical tool available for fitting the data into a linear model.
Least-squares regression analysis can be used to express the relationship between response (y) and
concentration (x). The relationship can be represented by the general function.
Y = f (x, a, b1, …….…. bm)
Where a, b1..........., bm are the parameters of the function.
We adopt the convention that the x values relate to the controlled or independent variable (e.g. the
concentration of a standard) and the y values are related to the dependent variable (the response measurements).
This means that the X values have no error. On the condition that the errors made in preparing the standards are
significantly smaller than the measuring error (which is usually the case in analytical problems). The values of
the unknown parameters a, b1, ....bm must be estimated in such a way that the model fits the experimental data
points (xi, yi) as closely as possible. The true relationship between x and y is considered to be given by a straight
line. The relation between each observation pair (Xi, Yi) can be represented as
Yi = + Xi + ei (12)
The signal yi is composed of deterministic component predicted by linear model and a random
component ei. One must now find the estimates of a and b of the two values and . This can be done by
calculating values a and b for which ei2 is minimal. The component ei represent the differences between the
observed yi values and the predicted yi values by the model. The ei are called the residuals, a and b are the
intercept and slope respectively.
2
1 1
2
1 11
n
i
n
i
ii
n
i
n
i
ii
n
i
ii
xxn
yxyxn
b
(13)

A Review on Step-by-Step Analytical…
18
2
1 1
2
1 11
2
1
n
i
n
i
ii
n
i
n
i
ii
n
i
ii
n
i
i
xxn
yxxxy
a
Standard error of estimation (Se) The standard error of estimation is a measurement of the difference between experimental and
computed values of the dependent variable. It is represented by the following equation,
)2/()(1
2
nyySn
i
iie (14)
iy and
iy , are the observed and predicted values, respectively. Standard deviations on slopes (Sb)
and intercepts (Sa) are quoted less frequently, even though they are used to evaluate proportional differences
between or among methods as well as to compute the independent variables such as concentration etc. It is
important to understand how uncertainties in the slope are influenced by the controllable properties of the data
set such as the number and range of data points and also how properties of data sets can be designed to optimize
the confidence in such data.
Standard deviation of slope (Sb)
The standard deviation of slope is proportional to standard error of estimate and inversely
proportional to the range and square root of the number of data points.
Where
ix is the arithmetic mean of xi value
Standard deviation of intercept (Sa) Intercept values of least squares fits of data and are often used to calculate additive errors between or
among different methods.
Here
ix is the
arithmetic mean of ix values
Correlation coefficient (r) In order to ascertain whether there is a linear relationship between two variables „x‟ and „y‟, the
correlation coefficient (r) is used. To achieve a correlation coefficient, the co-variance is divided by the product
of the standard deviation of x and y.
)2(
)(1
2
n
yy
S
n
i
ii
b
*
n
i
ii xx1
2)(
1
(15)
)2(
)(1
2
n
yy
S
n
i
ii
a
*
n
i
ii xx1
2)(
1
*
n
xn
i
i1
2
(16)
A Review on Step-by-Step Analytical…
19
222 )1/()()(
)1/())((
nyyxx
nyyxx
rn
ii
n
ii
(17)
VI. CONCLUSION This article provides an idea how to perform validation process to prove that the method is apt for its
intended purpose and to assure the capabilities of the test method. The definitions of method validation
parameters are well explained. Although the requirements of validation have been clearly documented by
regulatory authorities, the approach to validation is varied and opened to interpretation, and validation
requirements differ during the development process of pharmaceuticals. Validation is an important procedure in
the pharmaceutical industry and it is utilized to ensure that quality is built in to the processes supporting drug
development and manufacture.
REFERENCES [1] G. David Watson, Pharmaceutical Analysis (3rd Ed., Churchill Livingstone, London: Harcourt Publishers Limited, Essex CM 20
2JE, 2012). [2] A.H. Beckett, and J.B. Stenlake, Practical Pharmaceutical Chemistry (4th Ed., Vol. I & II. CBS Publishers and Distributors, New
Delhi: 2007).
[3] T. Higuchi, and Brochman-Hansen, Pharmaceutical Analysis, (3rd edition, CBS Publishers and Distributors pvt. Ltd., New Delhi:1997).
[4] G. Oliver, R. Gerrit, and VZ. Maxmilian, Leading Pharmaceutical Innovation, „Trends and drivers for Growth in the
pharmaceutical industry, (2nd Ed., Springer, 2008)12-15. [5] Br. Jay, J. Kelvin, and B. Pierre, Understanding and Implementing Efficient Analytical Methods Development and Validation,
2003.
[6] R.M. Christopher, and W.R. Thomas, Quality Systems approach to Pharmaceutical cGMP Development and validation of Analytical Methods, (1st Ed., 2005) 147-152.
[7] R. Lloyd Snyder, J. Joseph Kirkland and L. Joseph Glajah, Practical HPLC method development (2nd Ed., 1997) 179-184.
[8] B.K. Sharma, Instrumental method of chemical analysis (29th Ed., Meerut, Chromatography, HPLC, Goel Publishing House, 2013) 286-385.
[9] H.H. Willard, L.L. Merrit, J.A. Jr. Dean, and F.A. Jr. Settle, Instrumental Methods of Analysis (CBS Publishers, New Delhi:
1986). [10] R.A. Day, and A.L, Underwood, Quantitative Analyses, (5th Ed., Prentice Hall, New Delhi: 1986).
[11] Macek and Karel, Pharmaceutical Applications of Thin Layer and Paper Chromatography, 62(6) 1972,1032.
[12] G. Ramana Rao, S.S.N. Murthy, and P. Khadgapathi, Gas Chromatography to Pharmaceutical Analysis, Eastern Pharmacist, 30(353), 1987, 35.
[13] G. Ramana Rao, S.S.N. Murthy, and P. Khadgapathi, High Performance Liquid Chromatography and its Role in Pharmaceutical
Analysis, Eastern Pharmacist, 29(346), 1986,53. [14] C.S.P. Sastry, T.N.V. Prasad, and E.V. Rao, Recent applications of High Performance Liquid chromatography in Pharmaceutical
analysis, Indian J. Pharm. Education, 21 (37),1987.
[15] Ravisankar P, Gowthami S, and Devala Rao G, A review on analytical method development, Indian journal of research in pharmacy and biotechnology, 2(3), 2014, 1183-1195.
[16] Ravisankar P, Rajyalakshmi G, Devadasu Ch, and Devala Rao G, Instant tips for right and effective approach to solve HPLC
trouble shooting, Journal of chemical and pharmaceutical sciences. 7(3), 2014, 259-274. [17] Jay Breaux, Kevin Jones, and Pierre Boulas, Development services analytical method development and validation
„Pharmaceutical technology, 27(1), 2003, 6-13.
[18] E. Michael Swartz, and Iras Krull, Analytical method development and validation, CRC press, Marcel dekker, Inc., Madison
Avenue, New York: 1997.
[19] K. Yuri, and LB. Rosario, HPLC for pharmaceutical scientists, (John Wiley and Sons, Inc., Hoboken, New Jersey, 2007) 92-98.
[20] G. P. Carr, and J. C. Wahlichs. „A practical approach to method validation in pharmaceutical analysis‟, J. Pharm, Biomed. Anal,8,1990,613-618.
[21] United States Pharmacopoeia,24, National Formulary 19, section <1225> „Validation of compendial methods‟. US Pharmacopoeial convention, Rockville, Validation of analytical procedures text and methodology Q2 (R1), November, 2000:
2005.
[22] International conference on harmonization (ICH) of technical requirements for registration of pharmaceuticals for human use, Validation of analytical procedures: Text methodology, (Q2 (R1) Geneva, 2005) 6-13.
[23] Draft guidance analytical procedures and method validation, US food and drug administration, Centre for drugs and biologics,
Department of Health and Human Services. http://www.fda.gov/cder/guidance/2396 dft.htm#111, 2000. [24] Orr J.D, Krull I.S and Swartz M.E, Validation of impurity methods Part II, (LC North Am; 21, 2003) 1146-1152.
[25] ICH Q2 (R1), Validation of analytical procedures (definitions and terminology); 2005; pp. 9-10.
[26] D.L. Massart, B.G.M. Vandeginste, S.N. Deming, Y. Michotte and L. Kaufman, Chemometrics: A Text Book, Elsevier, Amsterdam: 1988.
[27] M.M. Kiser and J.W. Dolan, Selecting the best curve fit LC-GC (Europe: 2004)138-143.
[28] R.E. Moore, Interval analysis (Englewood Cliffs, NJ: Prentice-Hall, 1966).