
A review on ipce and pec measurements and materials p.basnet
97
Journal Club Presentation By: Pradip Basnet, Ph.D. Candidate The University of Georgia Department of Physics & Astronomy [email protected] PEC characterization: towards IPCE measurement and development of new materials - A review P. Basnet 2/17/2015
-
Upload
pradip-basnet -
Category
Science
-
view
637 -
download
4
Transcript of A review on ipce and pec measurements and materials p.basnet

Journal Club Presentation
By:
Pradip Basnet, Ph.D. Candidate
The University of Georgia
Department of Physics & Astronomy
PEC characterization: towards IPCE measurement
and development of new materials
- A review
P. Basnet2/17/2015

P. Basnet
Photoelectrochemical (PEC) Reactions
ANALOGY
Light absorption
Biased potential
Electrolyte and so on…
2/17/2015
chemwiki.ucdavis.edu
Electron transfer in plants (vs. semiconductor/electrolyte solution)
-- most of the energy storage in photosynthesis
is in water splitting, not CO2 fixation!

2/17/2015P. Basnet
What we can make to happen in PEC Cell?
http://chemistry.harvard.edu/people/daniel-g-nocera

2/17/2015P. Basnet
PEC Cell
metal
e-
e-
A
D
A
D
e-
h+
Light is Converted to Electrical + Chemical Energy
LiquidSolid
?

2/17/2015P. Basnet
Outline:
1. PEC: Overview
- Measurements: Apparatus; Setup; Techniques etc.
- What Do We Measure/Compare in PEC Characterization?
2. Development of the New Materials:
- Theoretical, Computational & Experimental Viewpoints
3. Literature Summary: New Materials & Their Efficiencies

2/17/2015P. Basnet
PEC: Overview
Via light absorption & creating electron –hole pairs in photoelectrodes.
Then electron–hole pairs separation in electrodes (photo-cathode/anode).
Electrode processes & related charge transfer within PECs.
Light into Electrical and/or Chemical Energy; how?

2/17/2015P. Basnet
PEC: Measurement; Apparatus; Setup
TWO- COMPONENTS
Lamp
Monochromator(I): P(λ)
Lock-in amplifier
Shu
tte
r
Using Si detector
(II): I(λ)S1227
Pre-amplifierconnected to S1227(of known responsivity)
Source of monochromatic light
1. Record incident P(λ)
Potentiostat
CERef.
A
V A = current
V = bias voltage
2. Record V, I(t) (=A)

2/17/2015P. Basnet
Chen et. al., J. Mat. Res., 2010, 25, 3-16.
What do/should we measure for PEC characterization ?

2/17/2015P. Basnet
J. A. Turner, Science 285, 687 (1999)
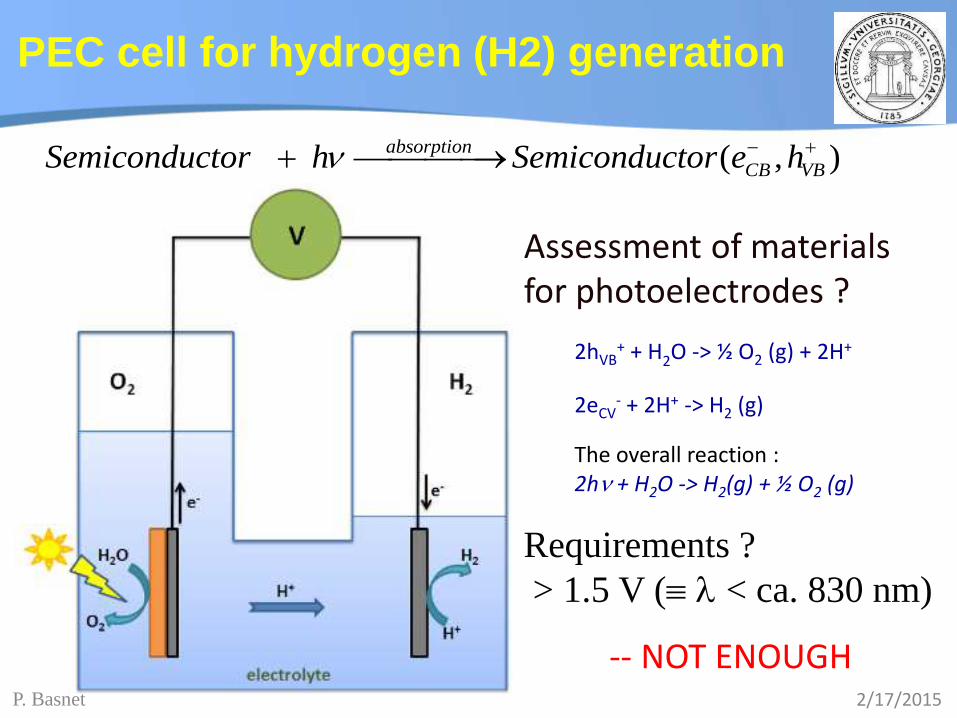
PEC cell for hydrogen (H2) generation
2/17/2015P. Basnet
Assessment of materials for photoelectrodes ?
( , )absorption
CB VBSemiconductor h Semiconductor e h
Requirements ?
> 1.5 V ( < ca. 830 nm)
-- NOT ENOUGH
2hVB+ + H2O -> ½ O2 (g) + 2H+
2eCV- + 2H+ -> H2 (g)
The overall reaction :2h + H2O -> H2(g) + ½ O2 (g)
PEC cell for hydrogen (H2) generation

2/17/2015P. Basnet
Generation of PEC voltage required for water decomposition
Ideal Condition for Water Splitting
H2O(l) H2(g) + ½ O2
G0 = 237 kJ/mol
E0 = G0/nF = 1.23 V
hν ≥ 400 nm
A. Kudo and Y. Miseki, Chemical Society Reviews, 2009

2/17/2015P. Basnet
Why is it difficult to achieve?
• Oxides
• Stable but efficiency is low (large gap)
• III-Vs
• Efficiency is good but surfaces corrode
• Approaches
• Dye sensitization (lifetime issues)
• Surface catalysis
• No practical PEC H2
production demonstrated with single material yet.
• Efficiency and lifetime
Adapted from M. Grätzel, Nature 414, 388 (2001)

2/17/2015P. Basnet
What are the fundamental issues?
Band structure engineering
To match water redox potentials and achieve high solar efficiency
Fundamental understanding of the electrode/ electrolyte interface
To accelerate water splitting reaction and reduce corrosion
2/17/2015P. Basnet
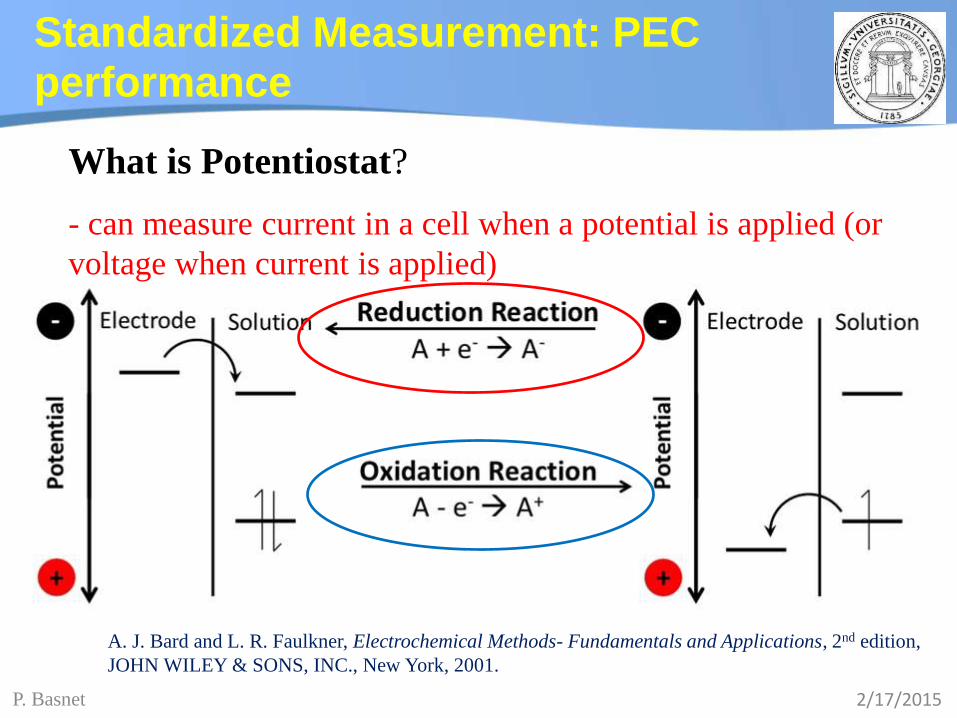
Standardized Measurement: PEC performance
A. J. Bard and L. R. Faulkner, Electrochemical Methods- Fundamentals and Applications, 2nd edition,
JOHN WILEY & SONS, INC., New York, 2001.
- can measure current in a cell when a potential is applied (or
voltage when current is applied)
What is Potentiostat?

2/17/2015P. Basnet
• Do you need to know how a Potentiostat works?
• No. But if you know it, is a plus.
• Do you need to be able to recognize when something is wrong?
• Yes! You must!
• Why would something go wrong?
• Because the performance of the Potentiostat is affected by the electrical characteristics of the sample…or something in the cell is causing a problem…or the Potentiostat is busted!
What one “MUST” know about the
following:
2/17/2015P. Basnet
DATA EVALUATION!
Electrochemical data is “ALWAYS” a collection of individual data points…one followed smoothly by another.
Noisy data is “BAD”.
Flat-lined data is “BAD”.
Overloads are “BAD”.
It is VERY rare to collect bad data that looks good.

2/17/2015P. Basnet
Potential or Voltage (E, sometimes V):
• Unit: Volt
• The Potential is the driving force for the redox reaction.
• The potential is related to the thermodynamics of the system:
ΔG = -n F ΔE (negative ΔG is spontaneous)
• Potential is always measured versus a Reference Electrode.
• A positive voltage is oxidative and a negative voltage is reductive.
• 0 Volts is not nothing!
What is Potential?
A. J. Bard and L. R. Faulkner; 2001.

2/17/2015P. Basnet
What is Current?
Current (i):
• Unit: Ampere
• Electron flow is the result of a redox reaction.
• Current measures the rate of the reaction (electrons persecond).
• Zero current is nothing, i.e., if the current is zero, no redox reactions are occurring (that’s not quite true in corrosion!).
• Anodic (oxidation) and cathodic (reduction) currents have different polarity (signs).
• Current may be expressed as current or current density.

2/17/2015P. Basnet
A. J. Bard and L. R. Faulkner; 2001.
Ideal Electrodes

2/17/2015P. Basnet
A. J. Bard and L. R. Faulkner; 2001.
Real Electrodes
2/17/2015P. Basnet
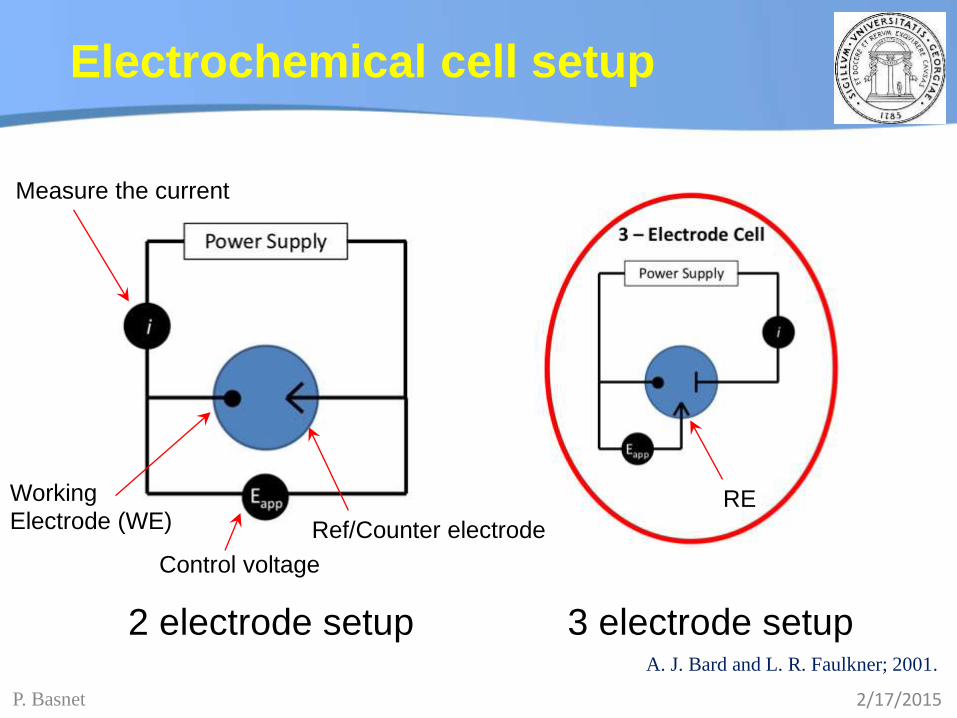
Electrochemical cell setup
2 electrode setup 3 electrode setup A. J. Bard and L. R. Faulkner; 2001.
Measure the current
Working
Electrode (WE) Ref/Counter electrode
Control voltage
RE
2/17/2015P. Basnet
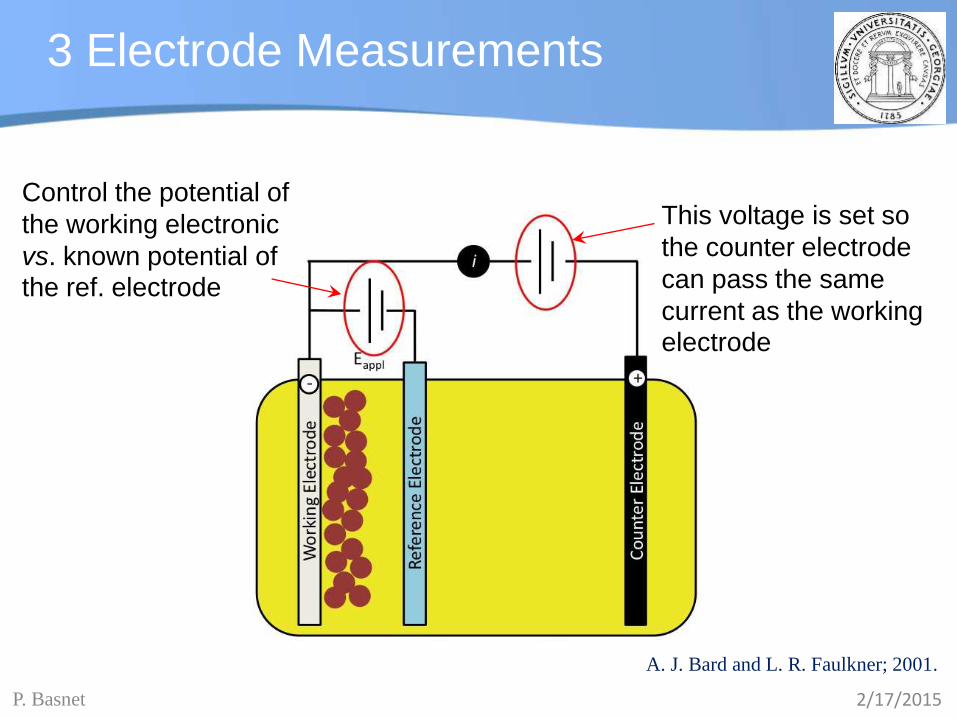
3 Electrode Measurements
Control the potential of
the working electronic
vs. known potential of the ref. electrode
This voltage is set so
the counter electrode
can pass the same
current as the working electrode
A. J. Bard and L. R. Faulkner; 2001.
2/17/2015P. Basnet
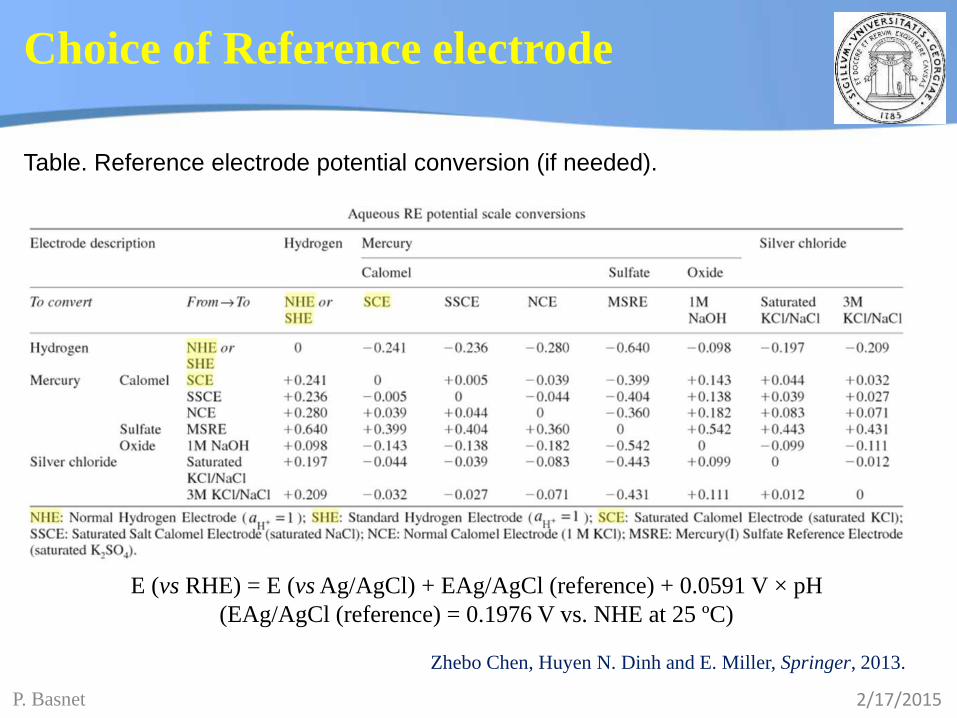
Table. Reference electrode potential conversion (if needed).
Choice of Reference electrode
E (vs RHE) = E (vs Ag/AgCl) + EAg/AgCl (reference) + 0.0591 V × pH
(EAg/AgCl (reference) = 0.1976 V vs. NHE at 25 ºC)
Zhebo Chen, Huyen N. Dinh and E. Miller, Springer, 2013.
2/17/2015P. Basnet
Pay Special Attention to the RE
• A Potentiostat needs a low impedance Reference Electrode!
• Use large junction reference electrodes
• Replace isolation frits regularly
• Avoid narrow Luggin Capillaries
• Potentiostats are less forgiving of high-impedance Reference Electrodes than pH Meters!
• If there’s an problem with the cell, it’s almost always the Reference Electrode!

2/17/2015P. Basnet
Role of the Counter Electrode
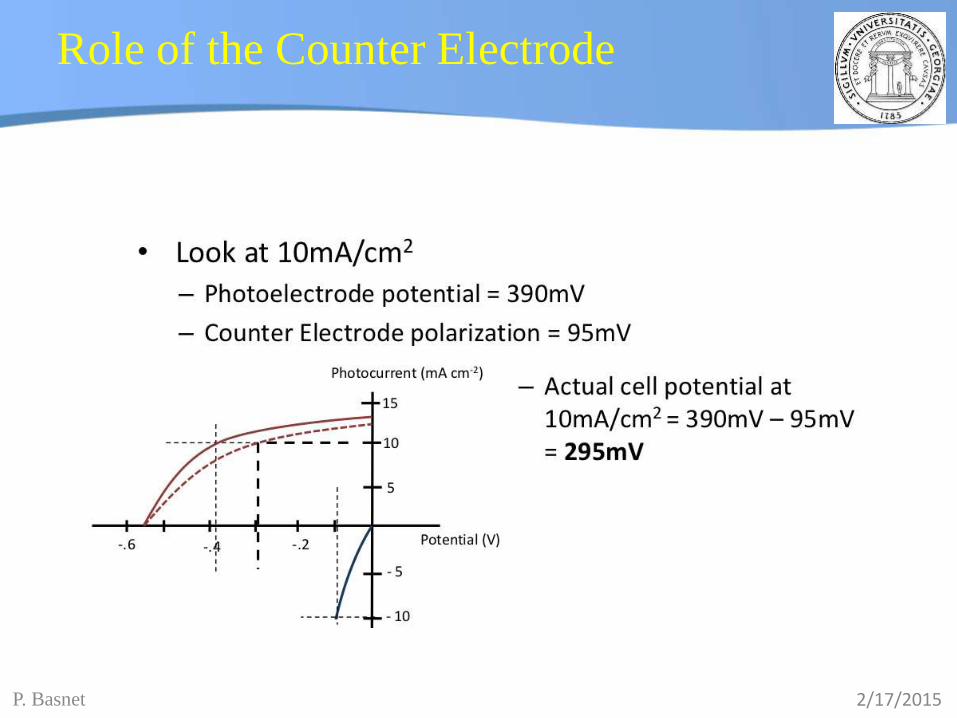
2/17/2015P. Basnet
Role of the Counter Electrode

2/17/2015P. Basnet
Hodes, G., J., Phys. Chem. Lettr., 2012, 3(9), pp 1208-1213
Ideal vs. Real Counter Electrodes
2/17/2015P. Basnet
A. J. Bard and L. R. Faulkner; 2001.
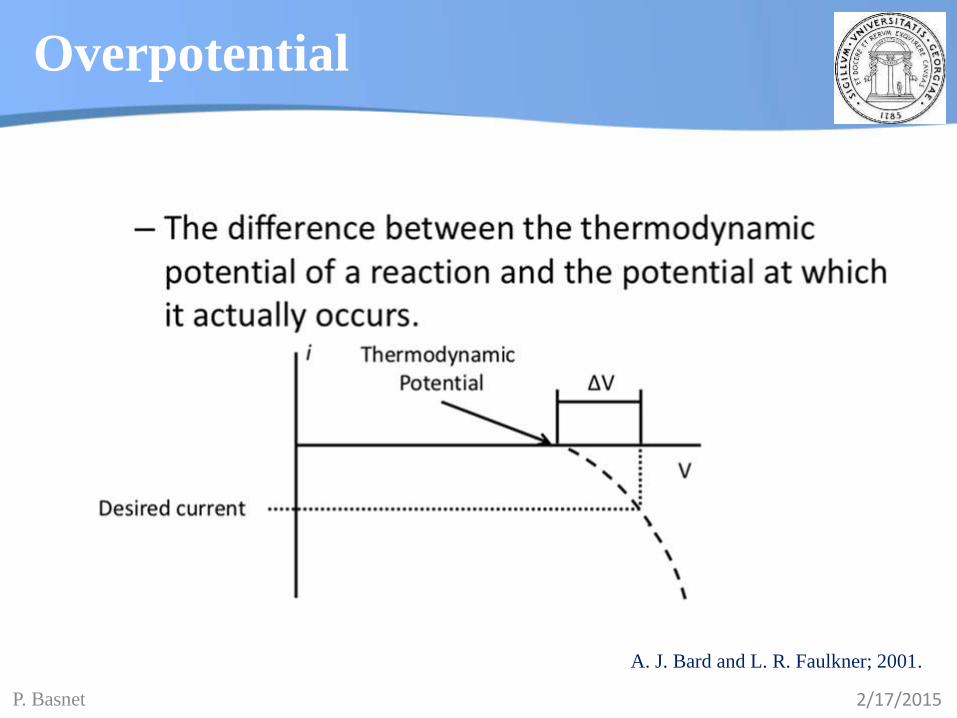
Overpotential

2/17/2015P. Basnet
Overpotential
Electron transfer across charge double layer
Depletion of concentration at electrode surface
Chemical reactions that must occur before electron
transfer
And more...
2/17/2015P. Basnet
ftp.kdis.edu.cn/211-xkkr-12/doc/10.1007_978-1-4614-8298-7.pdf
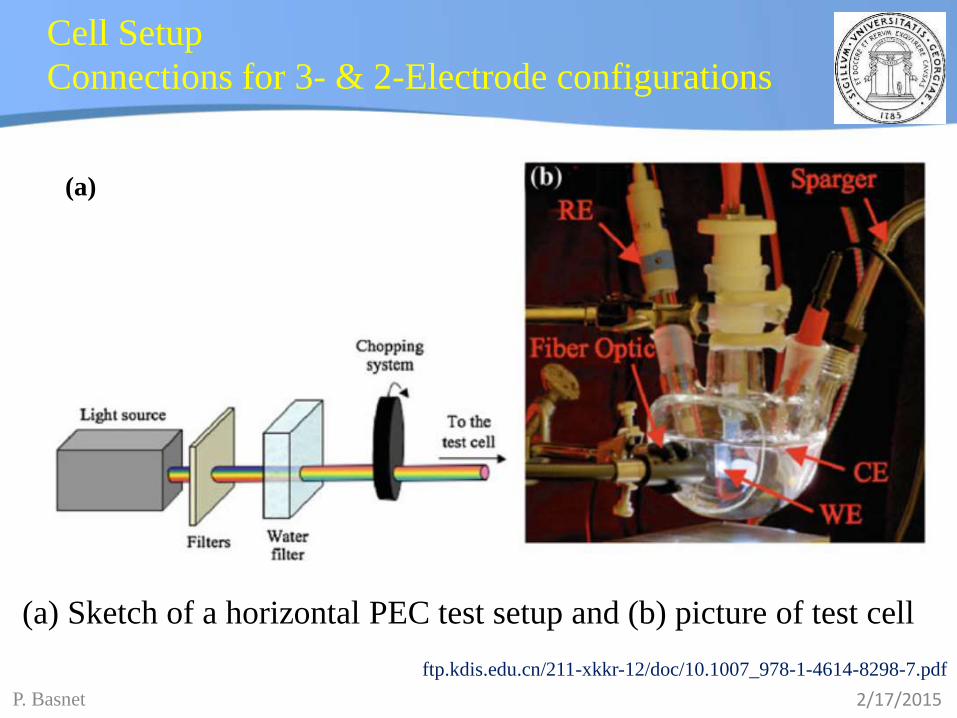
Cell Setup
Connections for 3- & 2-Electrode configurations
(a) Sketch of a horizontal PEC test setup and (b) picture of test cell
(a)

2/17/2015P. Basnet
How to know if the Data is Bad?
1. Calibrate the Potentiostat.
2. If calibration is successful, check the Potentiostat by running a dummy cell (a network of resistors/capacitors that give a known result).
3. If the instrument is OK, then check the cell. Check the Reference Electrode first!
4. If the cell is OK, then it’s something in your sample chemistry.
5. At some point, you should contact your Potentiostat supplier for technical support.

2/17/2015P. Basnet
Equation/s we need to know
• Ohm’s Law
• E = iR
• If I apply 100 mV to a 1000 ohm resistor, I should measure a current of…
• 100 µA

2/17/2015P. Basnet
1) Cyclic voltammetry (CV): Redox potentials and stability
2) Linear sweep voltammetry (LSV): Onset Potential
3) Photocurrent (or density), Iph: Dynamic photoresponse
(light on/off cycles at a certain frequency)
4) IPCE%: Efficiency (quantitative comparison)
PEC Measurements/Characterizations
100)(
1240
)w(
)amp(%
nmp
IIPCE
ph
… Iph and P(λ) need to be measured

2/17/2015P. Basnet
Other imp. features in PEC characterizations:
Band Bending
http://solar.iphy.ac.cn/index.php/?page_id=1775&lang=en
Photoelectrochemical water splitting systems using n-type
semiconductor photoanode (a), p-type semiconductor
photocathode (b), and tandem system (c)

2/17/2015P. Basnet
Outline:
1. PEC: Overview
- Measurements: Apparatus; Setup; Techniques etc.
- What Do We Measure/Compare in PEC Characterization?
► Development of the New Materials:
- Theoretical, Computational & Experimental Viewpoints
3. Literature Summary: New Materials & Their Efficiencies
2/17/2015P. Basnet
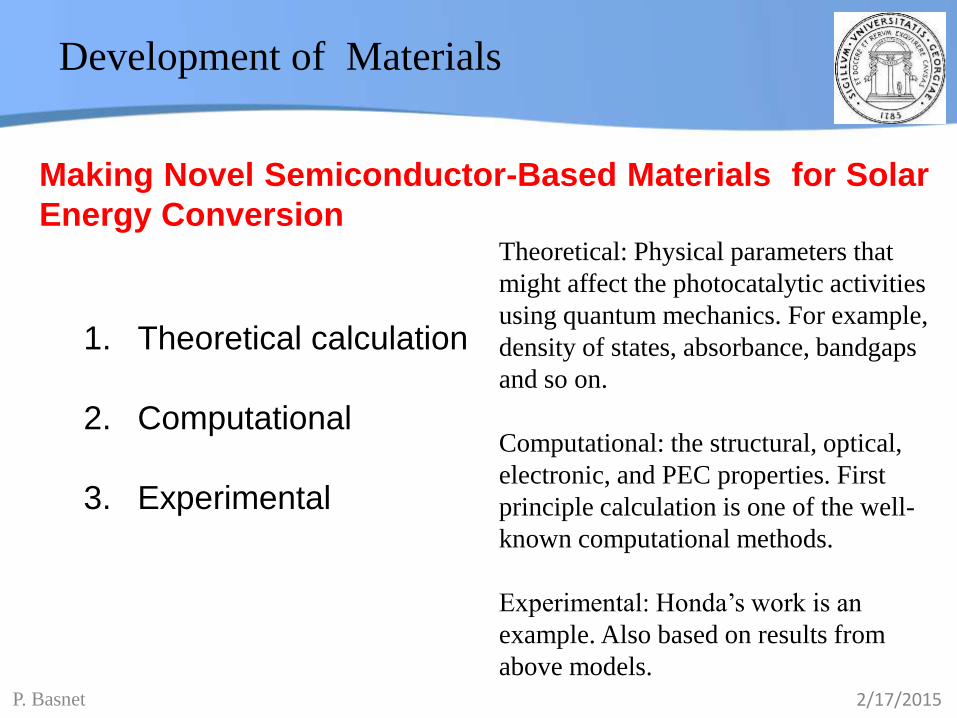
Development of Materials
1. Theoretical calculation
2. Computational
3. Experimental
Making Novel Semiconductor-Based Materials for Solar
Energy ConversionTheoretical: Physical parameters that
might affect the photocatalytic activities
using quantum mechanics. For example,
density of states, absorbance, bandgaps
and so on.
Computational: the structural, optical,
electronic, and PEC properties. First
principle calculation is one of the well-
known computational methods.
Experimental: Honda’s work is an
example. Also based on results from
above models.

Periodic Table of the Elements
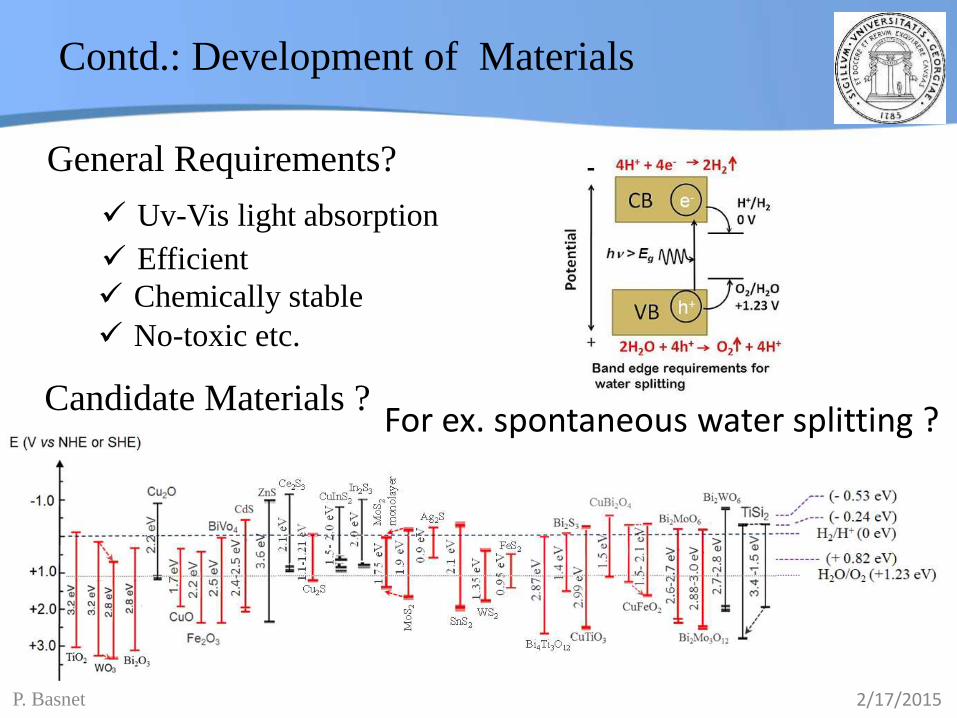
Contd.: Development of Materials
2/17/2015 P. Basnet

Periodic Table of the Elements
Contd.: Development of Materials
2/17/2015 P. Basnet
2/17/2015P. Basnet
Candidate Materials ?
General Requirements?
Contd.: Development of Materials
Uv-Vis light absorption
Chemically stable
No-toxic etc.
Efficient
For ex. spontaneous water splitting ?

2/17/2015P. Basnet
Approximation: Jmax- STH vs. Eg
Chen et. al., J. Mat. Res., 2010, 25, 3-16.
Theoretical predicted values for
Jmax- STH as a function of
material Bandgap (Eg). The
calculation was made assuming
a complete collection and
conversion to electronic-current
of photogenerated electron-hole
pairs by using the following
eqn.:
d: sample’s thickness; λ :
wavelength; q: electronic
charge; Φ(λ): photon flux of the
AM 1.5 solar spectrum
ddqJ ))(exp(1)(max

2/17/2015P. Basnet
S. Chen and L.-W. Wang, Chem Mater, 2012, 24, 3659-3666.
Stability of a photoelectrode: Thermodynamic
viewpoint

2/17/2015P. Basnet
Contd.: Stability of a photoelectrode
S. Chen and L.-W. Wang, Chem Mater, 2012, 24, 3659-3666.

2/17/2015P. Basnet
PH dependent band edges: redox couple

2/17/2015P. Basnet
Source of apparent dark reduction reaction
Thermodynamic conditions: Ered<ECBMEVBM<Eox and
VB
Oxidation
CB
Reduction
First principles scheme to evaluate band edge positions: Towards Stability of photoelectrode
L. I. Bendavid and E. A. Carter, J. of Phy.
Chem. B, 2013, 117, 15750-15760.

2/17/2015P. Basnet
Outline:
1. PEC: Overview
- Measurements: Apparatus; Setup; Techniques etc.
- What Do We Measure/Compare in PEC Characterization?
2. Development of the New Materials:
- Theoretical, Computational & Experimental Viewpoints
► Literature Summary: New Materials & Their Efficiencies

2/17/2015P. Basnet
Literature Summary: Current Reported Efficiencies
A. Fujishima and K. Honda, Nature, 1972, 238, 37-38.
In 1972, Fujishima and Honda first showed direct water splitting
using n-TiO2 (photoanode), using a PEC Cell (at 840 mV bias).
Since then, a large number of semiconductor materials have
been investigated for PEC electrodes for H2 production.
Metal oxides, with wide bandgap
(2.5–3.5 eV) are polpular
TiO2, ZnO, Fe2O3, SrTiO3, WO3 and
Cu2O are typically more stable in
aqueous media.
Best multijunction/PV bias is: 8.5%
(S. Kahn et. al., Science, 297, (2002)

2/17/2015P. Basnet
Cu2O for overall water splitting under
visible light irradiation
Hara et. al. Chem. Comm., 1998
water into H2 and O2 on Cu2O
under visible light irradiation is
investigated; the photocatalytic
water splitting on Cu2O powder
proceeds without any noticeable
decrease in the activity for more
than 1900 h.
Cu2O has been regarded as an unstable material for water decomposition
under light irradiation from the results of PEC; this study has revealed
Cu2O to be a photocatalyst able to decompose water into H2 and O2 under
visible light irradiation. NO reaction mechanism was available.
The particle size and surface area of
P-type Cu2O were estimated to be 0.3–
0.5 mm and 6 m2 g21, respectively.H2 and O2 evolution
2/17/2015P. Basnet
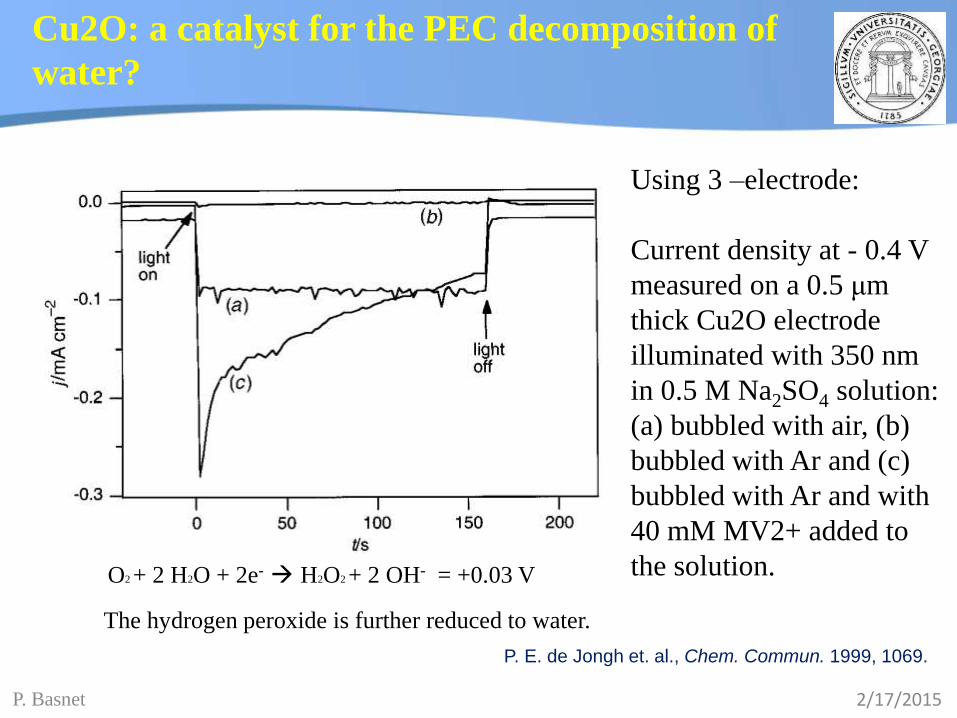
Cu2O: a catalyst for the PEC decomposition of
water?
P. E. de Jongh et. al., Chem. Commun. 1999, 1069.
Using 3 –electrode:
Current density at - 0.4 V
measured on a 0.5 μm
thick Cu2O electrode
illuminated with 350 nm
in 0.5 M Na2SO4 solution:
(a) bubbled with air, (b)
bubbled with Ar and (c)
bubbled with Ar and with
40 mM MV2+ added to
the solution.O2 + 2 H2O + 2e- H2O2 + 2 OH- = +0.03 V
The hydrogen peroxide is further reduced to water.

2/17/2015P. Basnet
Overview of
the redox pot.
of the relevant
reactions w.r.t.
the estimated
position of the
Cu2O band
edges.
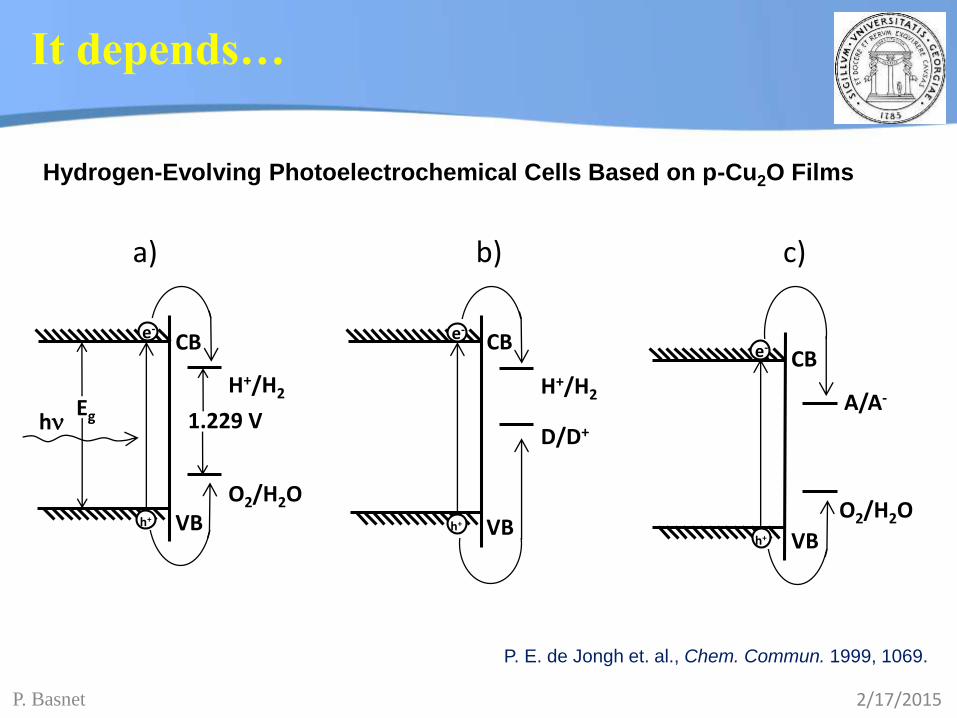
It depends…
2/17/2015P. Basnet
Hydrogen-Evolving Photoelectrochemical Cells Based on p-Cu2O Films
hEg
VB
H+/H2
O2/H2O
CB
1.229 V
e-
h+
VB
H+/H2
D/D+
CBe-
h+
VB
A/A-
O2/H2O
CBe-
h+
a) b) c)
P. E. de Jongh et. al., Chem. Commun. 1999, 1069.
It depends…

2/17/2015P. Basnet
2H+ + 2e H2
-1.0
1.5
1.0
0.5
0.0
-1.5
p - Cu2O
VB
CB
2CuO + H2O + 2e Cu2O + 2OH-
Cu2O + H2O + 2e 2Cu + 2OH-
O2 + 2H2O + 4e 4OH-
Electrolyte (pH = 7)
E vs S
HE
(V
olts)
P. E. de Jongh et. al., Chem. Commun. 1999, 1069.
Visible light
h h+ + e-
2.1 eV
Why the TiO2 stable then?

2/17/2015P. Basnet
TiO2:
Stable n-type semiconductor.
Band gap energy is ~3.2 eV.
Wavelength region that suits this energy is < 400
nm (UV region).
The efficiency of solar energy conversion is low.
PO
TE
NT
IAL
VS
SH
E (
VO
LT
S)
-1
3
2
1
0
n -TiO2
3.2 eV
p -Cu2O
2.1 eV
Contd.:

2/17/2015P. Basnet
Efficient nanocrystalline CoO
L. Liao, et. al., Nat Nano., 2014, 9, 69-73.
TEM of CoO nanoparticles.Conversion of black Co3O4 to brown CoO powders through thermal decomposition.
Before this, Solar to H2 conversion eff. ~ 0.1%; Here we show that cobalt(II) oxide (CoO) nanoparticles can carry out overall water splitting with a solar-to-hydrogen efficiency of around 5%
solar water-splitting using CoO- prepared by two distinct
methods (femtosecond laser ablation and mechanical ball
milling)

2/17/2015P. Basnet
Bandgaps and band-
edge positions of
CoO nanoparticles
and micropowders.
L. Liao, et. al., Nat Nano., 2014, 9, 69-73.
Efficient nanocrystalline CoO

2/17/2015P. Basnet
Characterizations of hydrogen and oxygen evolutions with gas chromatography and
mass spectrometry. (a) A typical GC trace of evolved hydrogen and oxygen.(b) Production of H2 and O2 from CoO nanoparticles (~12 mg) as a function of incident laser power. The laser wavelength is 532 nm.
L. Liao, et. al., Nat Nano., 2014, 9, 69-73.
Efficient nanocrystalline CoO
2/17/2015P. Basnet
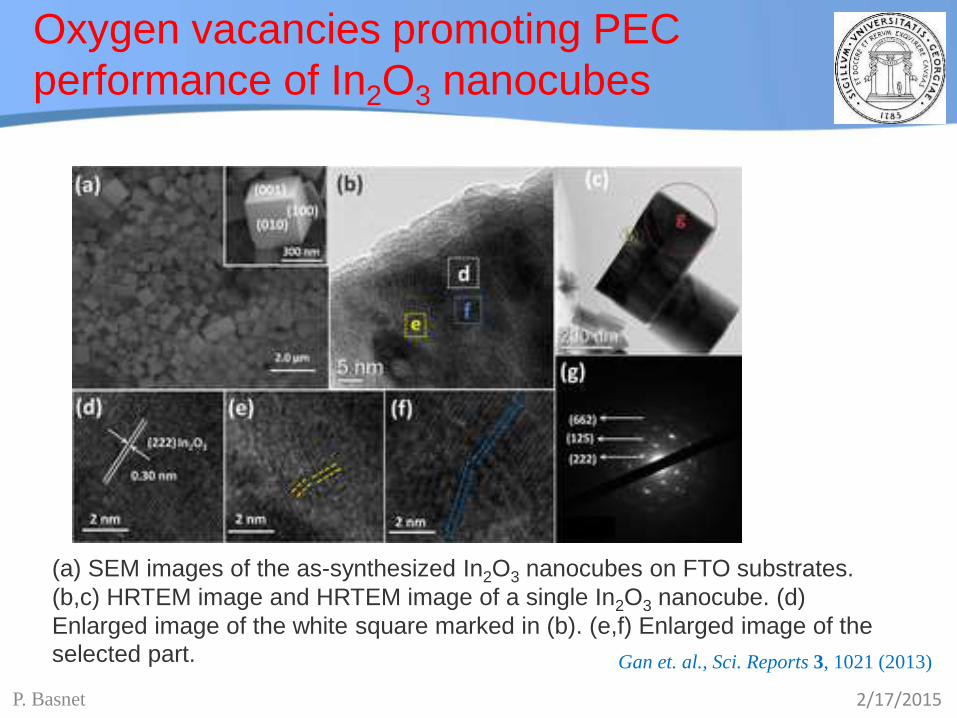
(a) SEM images of the as-synthesized In2O3 nanocubes on FTO substrates.
(b,c) HRTEM image and HRTEM image of a single In2O3 nanocube. (d)
Enlarged image of the white square marked in (b). (e,f) Enlarged image of the
selected part.
Oxygen vacancies promoting PEC
performance of In2O3 nanocubes
Gan et. al., Sci. Reports 3, 1021 (2013)

2/17/2015P. Basnet
Fig. Comparison of XRD patterns of as-prepared In(OH)3 without heat
treatment and In2O3 nanocubes obtained by calcination in air at 250°C,
350°C and 450°C, respectively.
In2O3 nanocubes

2/17/2015P. Basnet
Fig. Linear sweeps voltammogram collected from In2O3nanocubes obtained by
calcination in air at 250°C, 350°C, and 450°C with (a) sunlight on and off and (b)
visible light (400<λ<700 nm) on and off.
In2O3 nanocubes

2/17/2015P. Basnet
Plot of the best IPCE efficiency at the
visible wavelength over 400 nm of
In2O3nanocubes obtained by calcination
in air at 250°C, 350°C, 450°C, as a
function of the relative oxygen vacancy
amount.
IPCE spectra of In2O3 nanocubes
obtained by calcination in air at
250°C, 350°C, 450°C, collected at the
incident wavelength range from 300
to 650 nm at a potential of −0.6 V vs
Ag/AgCl.
In2O3 nanocubes

2/17/2015P. Basnet
Splitting water with rust: α-Fe2O3
T. W. Hamann, Dalton Transactions, 2012, 41, 7830-7834
Hamann Studied Efficiency vs. thickness: “Nano-cauliflower” hematite developed by Gratzel and co-workers. J. Am. Chem. Soc. 2006, 128, 15714-15721
2/17/2015P. Basnet
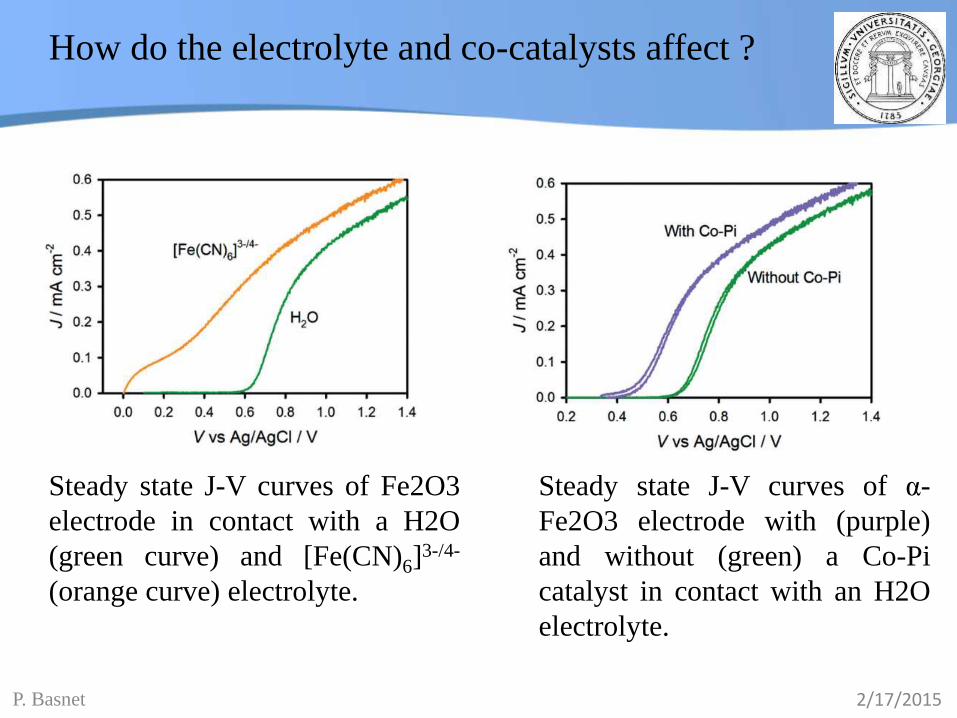
Steady state J-V curves of α-
Fe2O3 electrode with (purple)
and without (green) a Co-Pi
catalyst in contact with an H2O
electrolyte.
Steady state J-V curves of Fe2O3
electrode in contact with a H2O
(green curve) and [Fe(CN)6]3-/4-
(orange curve) electrolyte.
How do the electrolyte and co-catalysts affect ?

2/17/2015P. Basnet
water oxidation on BiVO4
Figure 2. SEM images of (a) BiVO4, (b) BiVO4 at high resolution, (c) CoPi/BiVO4, and (d) CoPi/BiVO4 at high resolution.
BiVO4 with CoPi cocatalyst & EDS data.
2/17/2015P. Basnet
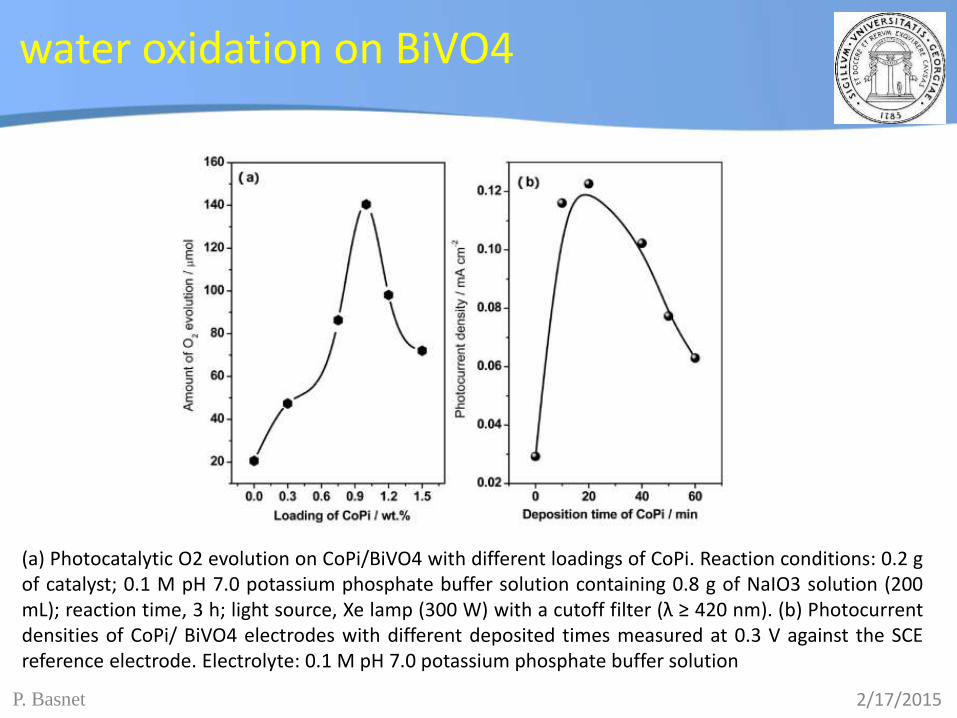
(a) Photocatalytic O2 evolution on CoPi/BiVO4 with different loadings of CoPi. Reaction conditions: 0.2 gof catalyst; 0.1 M pH 7.0 potassium phosphate buffer solution containing 0.8 g of NaIO3 solution (200mL); reaction time, 3 h; light source, Xe lamp (300 W) with a cutoff filter (λ ≥ 420 nm). (b) Photocurrentdensities of CoPi/ BiVO4 electrodes with different deposited times measured at 0.3 V against the SCEreference electrode. Electrolyte: 0.1 M pH 7.0 potassium phosphate buffer solution
water oxidation on BiVO4

2/17/2015P. Basnet
Photocatalytic O2 evolution on 0.44 wt % MOx/BiVO4 prepared by the impregnation method. Reaction conditions: 0.2 g of catalyst; 0.1 M pH 7.0 potassium phosphate buffer solution containing 0.8 g of NaIO3 (200 mL); reaction time, 3 h; light source, Xe lamp (300 W) with a cutoff filter (λ ≥ 420 nm). (b) Photocurrent densities of MOx/BiVO4 electrodes with the same loading of MOx measured at 0.5 V against the SCE reference electrode. Electrolyte: 0.1 M pH 7.0 potassium phosphate buffer solution.
water oxidation on BiVO4

2/17/2015P. Basnet
water oxidation on BiVO4
Photocurrent measurement. (a) Photocurrent−potential characteristics of BiVO4 and CoPi/BiVO4electrodes with different deposited times of CoPi measured (scan rate, 10 mV/s) with chopped light. (b)Photocurrent−potential characteristics of BiVO4 and MOx/BiVO4 electrodes with the same loading ofMOx measured (scan rate, 10 mV/s) with chopped light. Electrolyte: 0.1 M pH 7.0 potassium phosphatebuffer solution.

2/17/2015P. Basnet
(a) XRD of Bi0.5Y0.5VO4 synthesizedby solid state reaction. (b) UV−visdiffuse reflectance spectra ofBi0.5Y0.5VO4 synthesized by solidstate reaction.
Photocatalytic water splitting onBi0.5Y0.5VO4 loaded with CoPi and Pt frompure water. Reaction conditions: 0.2 g ofcatalyst; pure water (200 mL); light source,Xe lamp (300 W), reaction time, 9 h.
water oxidation on BiVO4

2/17/2015P. Basnet

2/17/2015P. Basnet
Back up Slides

2/17/2015P. Basnet
Noble-metal-free Cu2S-modified
Chen et. al., RSC Adv., 2015, 5, 18159
XRD patterns of CdS, CuxS, and CuxS/CdS samples with various Cu/Cd molar ratios.
(a) Cu 2p XPS spectra and (b) the Auger Cu LMM spectra of CuxS and CuxS/CdS-0.05 samples.
- enhanced photocatalytic H2 production by forming nanoscale p–n junction structure
2/17/2015P. Basnet
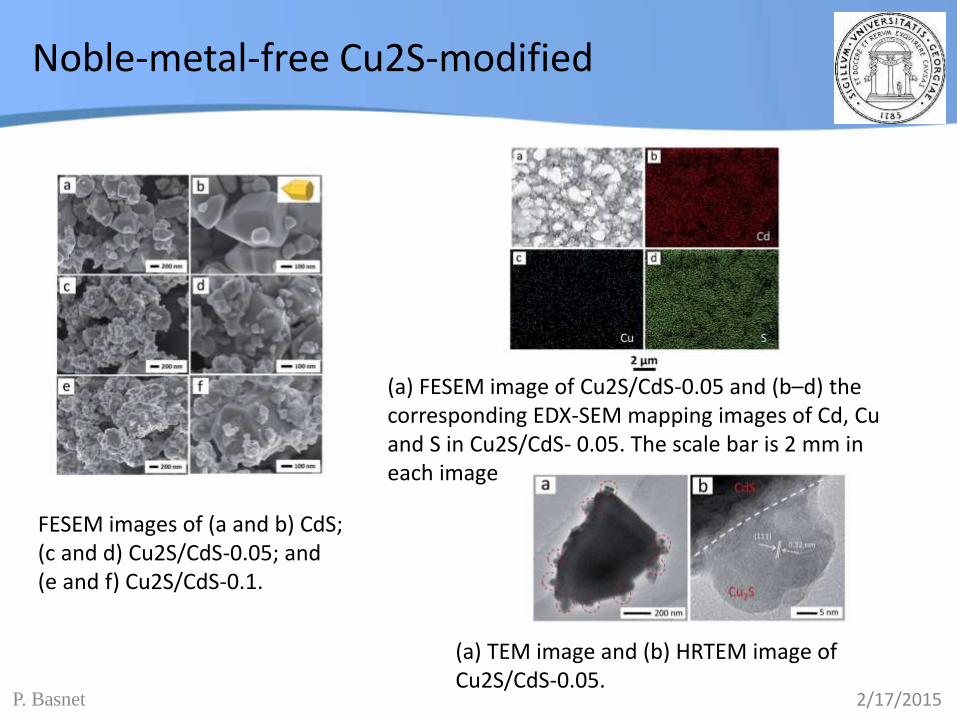
FESEM images of (a and b) CdS; (c and d) Cu2S/CdS-0.05; and (e and f) Cu2S/CdS-0.1.
(a) FESEM image of Cu2S/CdS-0.05 and (b–d) the corresponding EDX-SEM mapping images of Cd, Cu and S in Cu2S/CdS- 0.05. The scale bar is 2 mm in each image
(a) TEM image and (b) HRTEM image of Cu2S/CdS-0.05.
Noble-metal-free Cu2S-modified

2/17/2015P. Basnet
Noble-metal-free Cu2S-modified
UV-vis absorption spectra of Cu2S/CdS hybrid photocatalysts with different Cu/Cd molar ratios.
PL spectra of CdS and Cu2S/CdS-0.05. The excitation wavelength was 420 nm.

2/17/2015P. Basnet
Noble-metal-free Cu2S-modified
(a) Photocatalytic hydrogen production over Cu2S/CdS hybrid photocatalystswith different Cu/Cd molar ratios and (b) long-time photocatalytic test ofCu2S/CdS-0.05 sample for hydrogen production. Reaction conditions: 0.2 g ofCdS photocatalyst; appropriate amount of Cu2S deposited by the in situ method;190 mL of aqueous solution containing 0.25 M Na2SO3/0.35 M Na2S; 300 W Xelamp equipped with a cutoff filter (420 nm)

2/17/2015P. Basnet
(a) The schematic diagram of forming p–n junction and charge transfer process in Cu2S/CdS and (b) the band structure for Cu2S/CdS heterojunction and charge separation process under illumination
Noble-metal-free Cu2S-modified

2/17/2015P. Basnet
Ti-Fe2O3/Cu2O heterojunction photoelectrode
a) UV-visible absorption spectra for (A) pristine Cu2O, (B) hematite, (C) Ti-Fe2O3,
(D) Fe2O3/Cu2O, and (E) Ti-Fe2O3/Cu2O heterojunction thin films and Tauc plots
for (A) pristine Cu2O, (B) hematite, and (C) Ti-Fe2O3.
Sharma et. al., , Thin Solid Films, 2015, 574, 125-131.

2/17/2015P. Basnet
SEM images for
pristine Ti-Fe2O3,
Ti-Fe2O3/Cu2O
heterojunction
sample E, and the
energy-dispersive
X- ray image for
Ti-Fe2O3/Cu2O
heterojunction
thin film.
(a) AFM image for pristine Ti-Fe2O3.
(b) AFM image for Ti-Fe2O3/Cu2O
heterojunction sample E.
Ti-Fe2O3/Cu2O heterojunction photoelectrode

2/17/2015P. Basnet
Photocurrent density vs. applied potential curve for (A) pristine Cu2O, (B) hematite,
(C) Ti-Fe2O3, (D) Fe2O3/Cu2O, and (E) Ti-Fe2O3/Cu2O heterojunction thin films,
respectively, under visible light illumination in 0.1 M NaOH electrolytic solution.
Ti-Fe2O3/Cu2O heterojunction photoelectrode

2/17/2015P. Basnet
IPCE performance of for (A) pristine Cu2O, (B) hematite, (C) Ti-Fe2O3, (D)
Fe2O3/Cu2O, and (E) Ti-Fe2O3/Cu2O heterojunction thin films, respectively, under
visible light illumination in 0.1 M NaOH electrolyte.
Ti-Fe2O3/Cu2O heterojunction photoelectrode

2/17/2015P. Basnet
Vertically Aligned Ta3N5
-- fabricated by through-mask anodization and nitridation for water splitting.
The Ta3N5 nanorods, working as photoanodes of a photoelectrochemical cell,
yield a high photocurrent density of 3.8 mA cm−2 at 1.23 V vs RHE under AM
1.5G simulated sunlight and an incident photon-to-current conversion efficiency
of 41.3% at 440 nm, one of the highest activities reported for photoanodes so
far.
Nanorod Arrays for Solar Driven Photoelectrochemical Water Splitting
Li et. al., Adv. Mat. 2013, 25, 125-131.
2/17/2015P. Basnet
Vertically Aligned Ta3N5
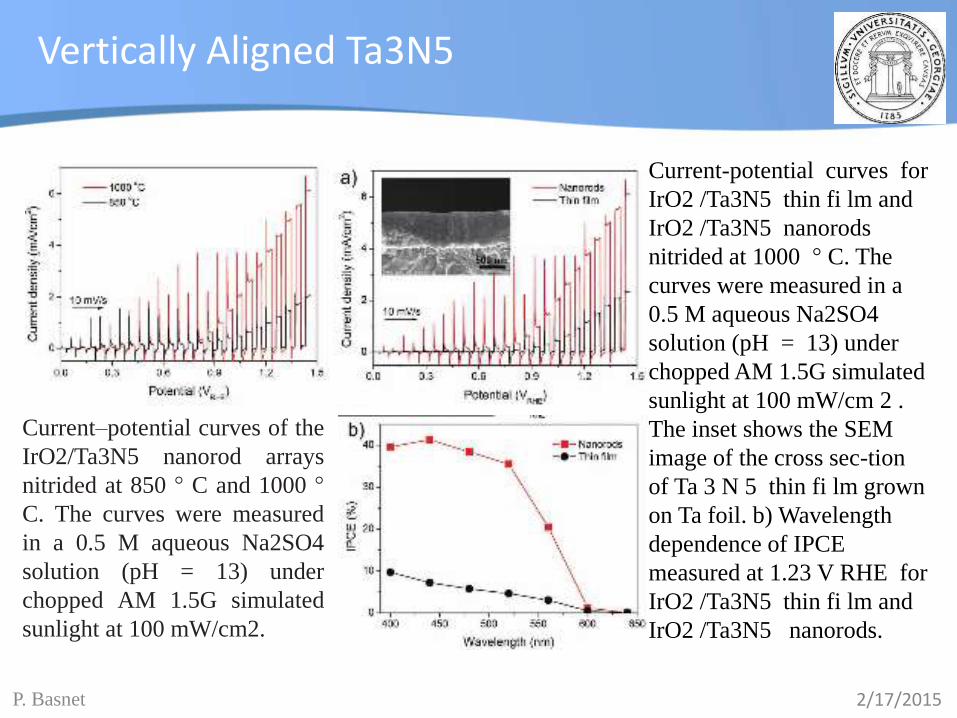
Current–potential curves of the
IrO2/Ta3N5 nanorod arrays
nitrided at 850 ° C and 1000 °
C. The curves were measured
in a 0.5 M aqueous Na2SO4
solution (pH = 13) under
chopped AM 1.5G simulated
sunlight at 100 mW/cm2.
Current-potential curves for
IrO2 /Ta3N5 thin fi lm and
IrO2 /Ta3N5 nanorods
nitrided at 1000 ° C. The
curves were measured in a
0.5 M aqueous Na2SO4
solution (pH = 13) under
chopped AM 1.5G simulated
sunlight at 100 mW/cm 2 .
The inset shows the SEM
image of the cross sec-tion
of Ta 3 N 5 thin fi lm grown
on Ta foil. b) Wavelength
dependence of IPCE
measured at 1.23 V RHE for
IrO2 /Ta3N5 thin fi lm and
IrO2 /Ta3N5 nanorods.
2/17/2015P. Basnet
Self-Catalyzed 1.7. eV GaAsP Core-Shell Nanowire Photocathode on Silicon Substrates
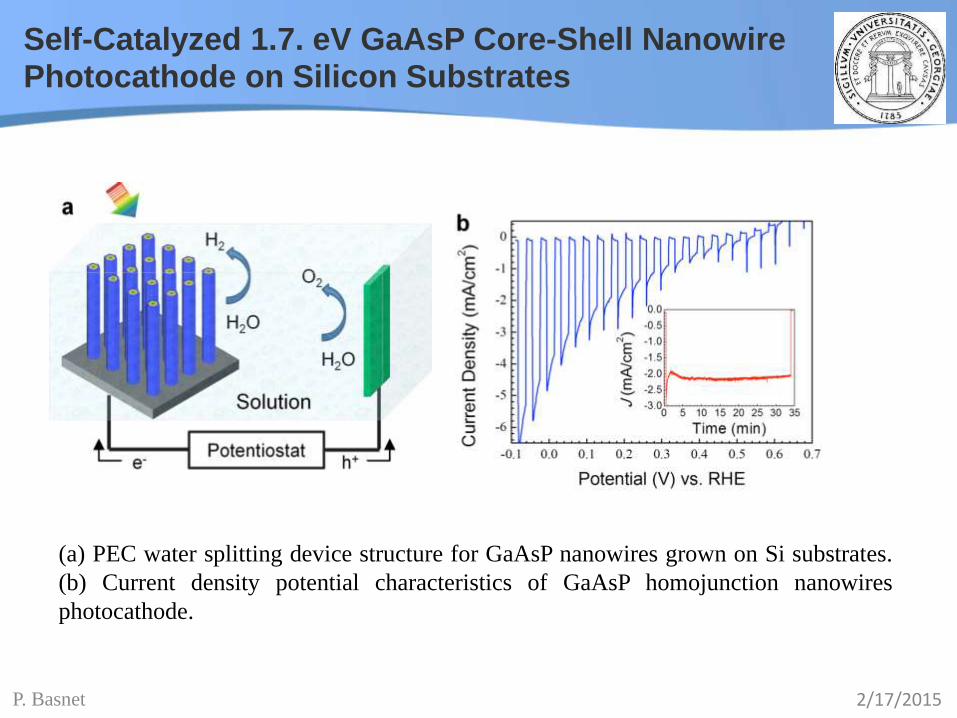
Under AM 1.5G illumination, the GaAsP nanowire photocathode yielded a
photocurrent density of 4.5 mA/cm2 at 0 V versus RHE and a solar-to-
hydrogen conversion efficiency of 0.5%, which are much higher than the
values previously reported for wafer-scale III–V nanowire photocathodes.
Plus, GaAsP reported to be more resistant to photocorrosion than InGaP.
These results open up a new approach to develop efficient tandem PEC
devices via fabricating GaAsP nanowires on a silicon platform.
Wu et. al., Nano Lett., 2014, 14 (4), pp 2013–2018

2/17/2015P. Basnet
Self-Catalyzed 1.7. eV GaAsP Core-Shell Nanowire Photocathode on Silicon Substrates
(a) Low-magnification side-view and top-view and high-magnification top-view SEMimages of vertically orientatedGaAsP p−n homojunctionnanowires grown onto a p+ -Si(111) substrate. (b) Dark fieldTEM images and diffractionpatterns taken in differentpositions of a GaAsP p−nhomojunction nanowire. (c)Line element mapping imageof a GaAsP p−n homojunctionnanowire across the radial axis.The element composition isnormalized to the nanowirethickness
2/17/2015P. Basnet
(a) PEC water splitting device structure for GaAsP nanowires grown on Si substrates.
(b) Current density potential characteristics of GaAsP homojunction nanowires
photocathode.
Self-Catalyzed 1.7. eV GaAsP Core-Shell Nanowire Photocathode on Silicon Substrates

2/17/2015P. Basnet
Self-Catalyzed 1.7. eV GaAsP Core-Shell Nanowire Photocathode on Silicon Substrates
(c) Current density potential characteristics of GaAsP homojunction nanowires photocathode
with an InGaP passivation layer. (d) Comparison of the PEC performance between the GaAsP
nanowire photocathode without InGaP passivation layer (blue line) and the one with
passivation after stability test (red line). The insets in b and c are the steady-state current
density of the photocathodes measured at 0.1 V versus RHE under AM 1.5G illumination.
The current−potential curves were measured in 0.1 M KPi buffer solution (pH 7) at a scan
rate of 10 mV/s under chopped AM 1.5G illumination.

2/17/2015P. Basnet
(a) Current density potential characteristics of GaAsP homojunction nanowires photocathodes with an InGaP passivation layer
illuminated with normal incident light and off-normal incident light. The current−potential curves were measured in 0.1 M Na2SO4
solution (pH 10) at a scan rate of 10 mV/s under chopped AM 1.5G illumination. (b) Illustration of the illumination configuration
during PEC performance characterization. (c) Current density measured 0 V vs RHE and 0.2 V vs RHE as a function of off-normal
incident angle θ. (d) Current density in c normalized to the illumination area.
Self-Catalyzed 1.7. eV GaAsP Core-Shell Nanowire Photocathode on Silicon Substrates

2/17/2015P. Basnet
WO3/BiVO4 Core/Shell Nanowire Photoanode
practical water oxidation photocurrent (JH2O) is much lower due to the limited light
absorption, charge separation, and surface charge transfer efficiencies (ηabs, ηsep and ηtrans,
respectively) of the BiVO4 material, according to
JH2O = Jmax × ηabs × ηsep × ηtrans.
Fig. The WO3/W:BiVO4 core/shell nanowire (NW) photoanode. Structural schematic and
energy band diagram of the core/ shell NWs and type-II staggered heterojunction, in which
charges generated in both the W:BiVO4 shells and WO3 NW cores can contribute to the
water oxidation photocurrent. The band edges and water oxidation and reduction potentials
are plotted on the RHE scale.
Simultaneously Efficient Light Absorption
and Charge Separation for PEC water
Oxidation
Rao et. al., Nano Letters, 2014, 14, 1099-1105.

2/17/2015P. Basnet
Fig. (b,c) Scanning electron
microscope (SEM, left) and
transmission electron
microscope (TEM, right)
images of the bare WO3
NW array (75 nm average
NW diameter) and
WO3/W:BiVO4 core/shell
NWs (60 nm average
W:BiVO4 shell thickness),
respectively. The W:BiVO4
shell consists of a single
layer of densely packed
nanoparticles.
WO3/BiVO4 Core/Shell Nanowire Photoanode

2/17/2015P. Basnet
PEC response of the WO3/W:BiVO4 NW photoanode and control samples in
0.5 M potassium phosphate electrolyte buffered to pH 8. (a) Current−voltage
(J−V) curves (solid lines: simulated AM 1.5G illumination, dotted lines: dark)
and (b) Incident photon-to-current efficiency (IPCE) measured at 1.23 VRHE.
WO3/BiVO4 Core/Shell Nanowire Photoanode

2/17/2015P. Basnet
Efficiencies of subprocesses that comprise the overall photoelectrochemical response of
the WO3/W:BiVO4 NW photoanode and control samples. (a) Light absorption efficiency
(ηabs) and (b) J−V curve under simulated AM 1.5G illumination with H2O2 added to the
potassium phosphate electrolyte as a hole scavenger, which demonstrates the photocurrent
achieved when the surface charge transfer efficiency is nearly 100%. (c) Charge separation
(ηsep) and (d) surface charge transfer efficiency (ηtrans) of the WO3/W:BiVO4 NWs and,
where appropriate, the bare WO3 NWs and same-mass W:BiVO4 film.
WO3/BiVO4 Core/Shell Nanowire Photoanode
2/17/2015P. Basnet
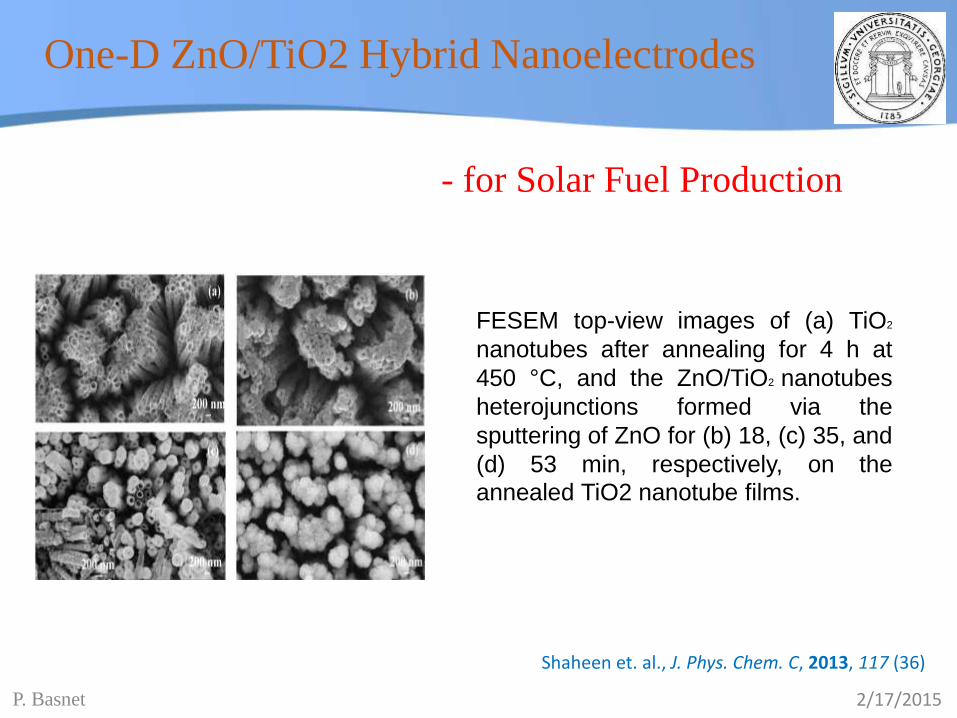
- for Solar Fuel Production
One-D ZnO/TiO2 Hybrid Nanoelectrodes
FESEM top-view images of (a) TiO2
nanotubes after annealing for 4 h at
450 °C, and the ZnO/TiO2 nanotubes
heterojunctions formed via the
sputtering of ZnO for (b) 18, (c) 35, and
(d) 53 min, respectively, on the
annealed TiO2 nanotube films.
Shaheen et. al., J. Phys. Chem. C, 2013, 117 (36)

2/17/2015P. Basnet
(A) Photocurrent density vs potential in 0.5 M Na2SO4 solution under UV (320−400 nm,
100 mW/cm2) illumination for the pure titania nanotubes and the ZnO/TiO2 heterojunction
electrodes, (B) the corresponding photoconversion efficiency and (C) the IPCE of pure
TiO2 nanotubes and the 53-min ZnO/TiO2 electrodes under a constant bias of 0.6 V.
One-D ZnO/TiO2 Hybrid Nanoelectrodes

2/17/2015P. Basnet
Chen et. al., J. Mat. Res., 2010, 25, 3-16.
PEC cell: 3-electrode each component
91
Reference electrode (RE) used to measure applied voltage versus absolute reference.
Counter electrode (CE) used to complete circuit, potential required to pass current at CE usually not measured.
Semiconductor working electrode (WE) control majority carrier Fermi level versus the reference electrode and measure current.
Typically bubble O2 or H2
through solution to maintain well-defined Nernstian potential

2/17/2015P. Basnet
PEC efficiency measurements

2/17/2015P. Basnet
Photocatalysis: A source of energetic electrons
Christoph E. Nebel, Nature Materials 12, 780–781 (2013)
Fig. Valence-band maxima, bandgaps and conduction bands related to the vacuum
energy for a variety of semiconductors shown as function of energy (left) with relation
to EVac and as function of the electrode potential scale (right) relative to the standard
hydrogen electrode.
2/17/2015P. Basnet
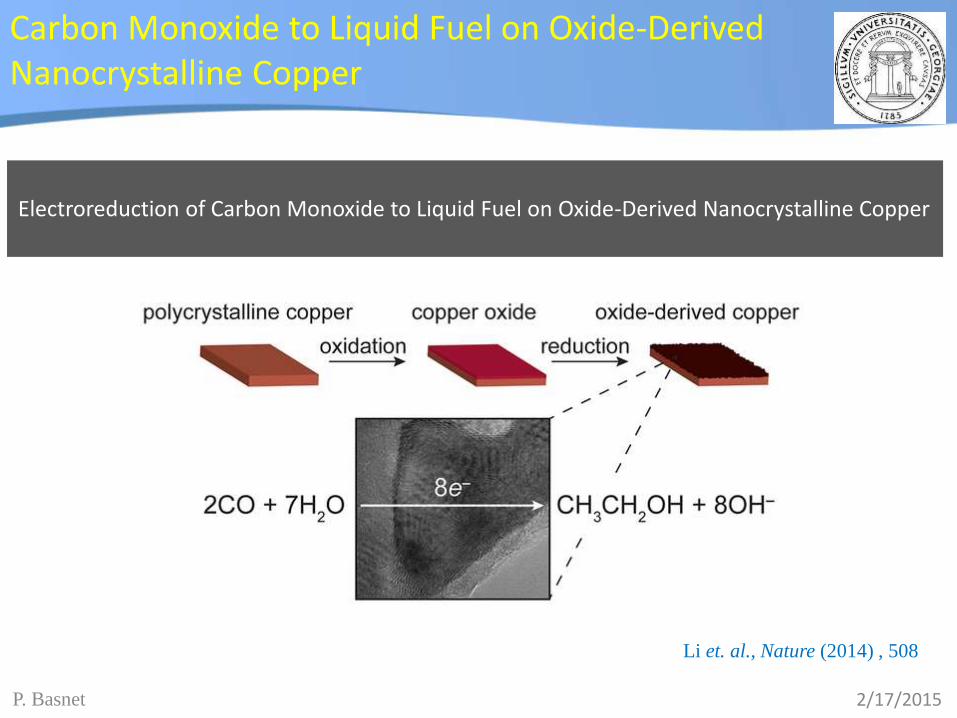
Carbon Monoxide to Liquid Fuel on Oxide-Derived Nanocrystalline Copper
Electroreduction of Carbon Monoxide to Liquid Fuel on Oxide-Derived Nanocrystalline Copper
Li et. al., Nature (2014) , 508

2/17/2015P. Basnet
CO2 Reduction at low overpotential on Cu electrodes resulting from the reduction of thick Cu2O films. Li, C. W.; Kanan, M.W. J. Am. Chem. Soc. 2012, 134, 7231-7234.
CO2 Reduction at low overpotential on Cu electrodes

2/17/2015P. Basnet
Powdered Photocatalysts
Kudo et. al., Chem. Soc. Rev. 2009, 38, 253-278.
Advantage: No support, high surface area, easy to scale-up.
Disadvantage: 1. Single junction cell requires large Eg >2.5 eV to generate
required photopotential; fundamentally inefficient with solar spectrum. 2.
Separation of H2 and O2 flammable mixture difficult. How to prevent reverse
electrochemical reaction?
2/17/2015P. Basnet
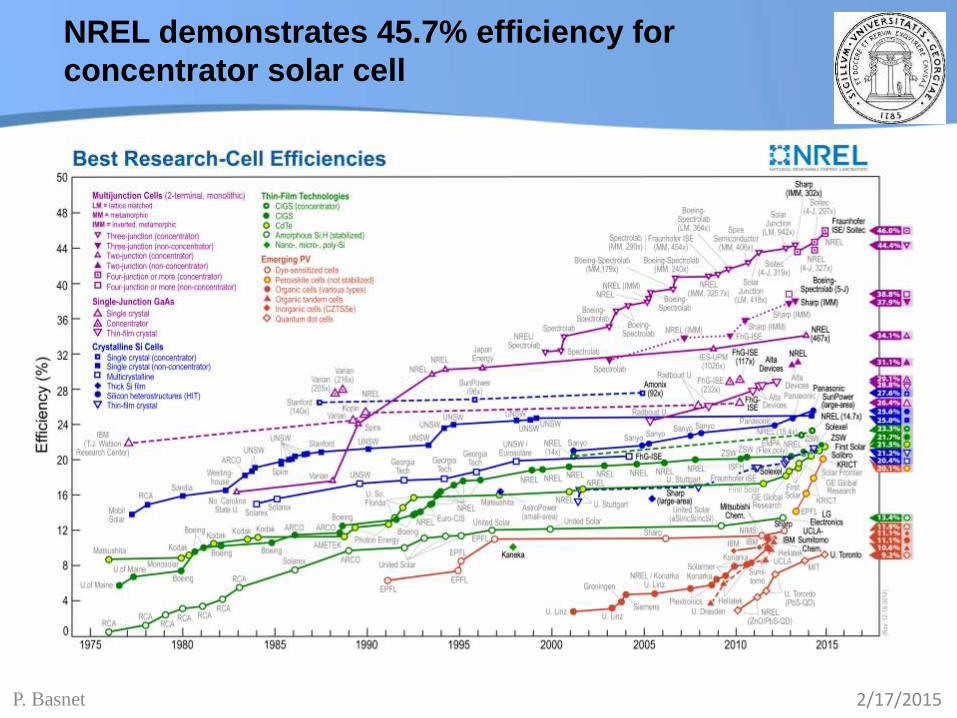
NREL demonstrates 45.7% efficiency for
concentrator solar cell