
A review on COVID-19 forecasting models - Springer
11
S.I. : DEEP NEURO-FUZZY ANALYTICS IN SMART ECOSYSTEMS A review on COVID-19 forecasting models Iman Rahimi 1 • Fang Chen 2 • Amir H. Gandomi 2 Received: 16 September 2020 / Accepted: 11 December 2020 Ó The Author(s), under exclusive licence to Springer-Verlag London Ltd. part of Springer Nature 2021 Abstract The novel coronavirus (COVID-19) has spread to more than 200 countries worldwide, leading to more than 36 million confirmed cases as of October 10, 2020. As such, several machine learning models that can forecast the outbreak globally have been released. This work presents a review and brief analysis of the most important machine learning forecasting models against COVID-19. The work presented in this study possesses two parts. In the first section, a detailed sciento- metric analysis presents an influential tool for bibliometric analyses, which were performed on COVID-19 data from the Scopus and Web of Science databases. For the above-mentioned analysis, keywords and subject areas are addressed, while the classification of machine learning forecasting models, criteria evaluation, and comparison of solution approaches are discussed in the second section of the work. The conclusion and discussion are provided as the final sections of this study. Keywords Forecasting Analysis COVID-19 SIR SEIR Time series 1 Introduction In December 2019, the Chinese government informed the rest of the world that a novel coronavirus, Severe Acute Respiratory Syndrome-Related Coronavirus 2 (COVID- 19), was rapidly spreading throughout China, which quickly infiltrated many other countries. The United States Centers for Disease Control and Prevention (CDC) recog- nized a seafood market in Wuhan as the center of the outbreak. On January 13, 2020, the World Health Organi- zation (WHO) reported a case in Thailand, the first case to be identified outside China. On January 16, Japan con- firmed its first case, and on January 20, South Korea reported its first confirmed case. Nowadays, most countries in the world have been affected by this virus. Putra and Khozin Mu’tamar [1] used the Particle Swarm Optimization (PSO) algorithm to estimate parameters in the Susceptible, Infected, Recovered (SIR) model. The results indicate that the suggested method is precise and has low enough error compared to other analytical meth- ods. Mbuvha and Marwala [2] calibrated the SIR model to South Africa’s reported cases after considering different scenarios of the reproduction number (R0) for reporting infections and healthcare resource estimations. Qi and Xiao [3] proposed that both daily temperature and relative humidity can influence the occurrence of COVID-19 in Hubei and other provinces. Salgotra and Gandomi [4] developed two COVID-19 prediction models based on genetic programming and applied these models in India. Findings from a study by [4] show that genetic evolutionary programming models have proven to be highly reliable for COVID-19 cases in India. The rest of paper is organized into the following sec- tions. Sections 2 and 3 present the search method proce- dure and other reviews, respectively. Section 4 shows the main research fields. Generic illustrations are provided in Sect. 5. Mathematical modeling and criteria evaluation are presented in Sects. 6 and 7. Solution approaches, including autoregressive model, exponential models, deep learning, regression methods, etc., are described in Sect. 8. Section 9 depicts the strengths and weaknesses of the various fore- casting models. Finally, the conclusion, discussion of results, and future directions are presented in Sect. 10. & Amir H. Gandomi [email protected] 1 Department of Mechanical and Manufacturing Engineering, Faculty of Engineering, Universiti Putra Malaysia, Seri Kembangan, Malaysia 2 Data Science Institute, University of Technology Sydney, Ultimo 2007, NSW, Australia 123 Neural Computing and Applications https://doi.org/10.1007/s00521-020-05626-8
Transcript of A review on COVID-19 forecasting models - Springer
S. I . : DEEP NEURO-FUZZY ANALYTICS IN SMART ECOSYSTEMS
A review on COVID-19 forecasting models
Iman Rahimi1 • Fang Chen2 • Amir H. Gandomi2
Received: 16 September 2020 / Accepted: 11 December 2020� The Author(s), under exclusive licence to Springer-Verlag London Ltd. part of Springer Nature 2021
AbstractThe novel coronavirus (COVID-19) has spread to more than 200 countries worldwide, leading to more than 36 million
confirmed cases as of October 10, 2020. As such, several machine learning models that can forecast the outbreak globally
have been released. This work presents a review and brief analysis of the most important machine learning forecasting
models against COVID-19. The work presented in this study possesses two parts. In the first section, a detailed sciento-
metric analysis presents an influential tool for bibliometric analyses, which were performed on COVID-19 data from the
Scopus and Web of Science databases. For the above-mentioned analysis, keywords and subject areas are addressed, while
the classification of machine learning forecasting models, criteria evaluation, and comparison of solution approaches are
discussed in the second section of the work. The conclusion and discussion are provided as the final sections of this study.
Keywords Forecasting � Analysis � COVID-19 � SIR � SEIR � Time series
1 Introduction
In December 2019, the Chinese government informed the
rest of the world that a novel coronavirus, Severe Acute
Respiratory Syndrome-Related Coronavirus 2 (COVID-
19), was rapidly spreading throughout China, which
quickly infiltrated many other countries. The United States
Centers for Disease Control and Prevention (CDC) recog-
nized a seafood market in Wuhan as the center of the
outbreak. On January 13, 2020, the World Health Organi-
zation (WHO) reported a case in Thailand, the first case to
be identified outside China. On January 16, Japan con-
firmed its first case, and on January 20, South Korea
reported its first confirmed case. Nowadays, most countries
in the world have been affected by this virus.
Putra and Khozin Mu’tamar [1] used the Particle Swarm
Optimization (PSO) algorithm to estimate parameters in
the Susceptible, Infected, Recovered (SIR) model. The
results indicate that the suggested method is precise and
has low enough error compared to other analytical meth-
ods. Mbuvha and Marwala [2] calibrated the SIR model to
South Africa’s reported cases after considering different
scenarios of the reproduction number (R0) for reporting
infections and healthcare resource estimations. Qi and Xiao
[3] proposed that both daily temperature and relative
humidity can influence the occurrence of COVID-19 in
Hubei and other provinces.
Salgotra and Gandomi [4] developed two COVID-19
prediction models based on genetic programming and
applied these models in India. Findings from a study by [4]
show that genetic evolutionary programming models have
proven to be highly reliable for COVID-19 cases in India.
The rest of paper is organized into the following sec-
tions. Sections 2 and 3 present the search method proce-
dure and other reviews, respectively. Section 4 shows the
main research fields. Generic illustrations are provided in
Sect. 5. Mathematical modeling and criteria evaluation are
presented in Sects. 6 and 7. Solution approaches, including
autoregressive model, exponential models, deep learning,
regression methods, etc., are described in Sect. 8. Section 9
depicts the strengths and weaknesses of the various fore-
casting models. Finally, the conclusion, discussion of
results, and future directions are presented in Sect. 10.
& Amir H. Gandomi
1 Department of Mechanical and Manufacturing Engineering,
Faculty of Engineering, Universiti Putra Malaysia,
Seri Kembangan, Malaysia
2 Data Science Institute, University of Technology Sydney,
Ultimo 2007, NSW, Australia
123
Neural Computing and Applicationshttps://doi.org/10.1007/s00521-020-05626-8(0123456789().,-volV)(0123456789().,- volV)

2 Search method procedure
The process used to identify the articles for this study’s
review is presented in this section.
2.1 Search method
Web of Science (WOS) and Scopus were used to find
related publications based on the following keywords:
forecasting, prediction, COVID-19, and coronavirus. The
classification of the chosen published works based on the
subject area is displayed in Fig. 1. Updated articles from
the beginning of 2020 to now were filtered from Scopus
using the Boolean operator OR, for both topics and titles.
We selected 920 technical research articles that contain
only algorithmic descriptions, review articles, conference
papers, case studies, and provide managerial insights,
which were published as of October 10, 2020 (Fig. 2). In
addition, this study focuses more on those papers that were
indexed by the Web of Science.
3 Other reviews
Mahalle and Kalamkar [5] categorized forecasting models
as mathematical models and machine learning techniques,
using WHO and social media communications as datasets.
Significant parameters including death count, metrological
parameters, quarantine period, medical resources, and
mobility were also studied [5].
Naude [6] provided a review of the contribution of
artificial intelligence (AI) against COVID-19. Some fields
of AI that have contribution against COVID-19 have been
identified as early warnings and alerts, tracking and pre-
diction, data dashboards, diagnosis and prognosis, treat-
ments and cures, and social control [6].
4 Main research fields
Keywords are critical in identifying the appropriate liter-
ature in a research field [7]. As specified by [8]: ‘‘keywords
represent the core research of a paper.’’ A keywords
Fig. 1 Classification of
scientific papers based on
subject area
Neural Computing and Applications
123

network offers a copy of an information area that provides
insight into the available subjects and how these topics are
related and sorted [9]. Therefore, the VOSviewer 1.6.11
software was applied to provide a keyword co-occurrence
network, and bibliographic data were derived from Scopus.
Author keywords were used to generate a network of
keywords. A sum of 1931 keywords were obtained from
the dataset, regarding the full counting. Table 1 presents
the parameter settings for keyword visualization.
The resulting network contains 500 nodes and 4000
links, as shown in Fig. 3, which also presents the main
fields for forecasting coronavirus. Stronger links in the
network visualization are indicated by thicker lines [10]. It
can be seen in Fig. 3 that Coronavirus, prediction, epi-
demic, human, and forecasting have connection links.
Moreover, Fig. 3 presents a network visualization based on
keywords, where Coronavirus, prediction, epidemic,
human, statistical analysis, quarantine, hospitalization,
mortality, and weather are among the top keywords on
which researchers focused. In Fig. 3, the cluster is indi-
cated by color, and the bigger circle represents the keyword
that is used most.
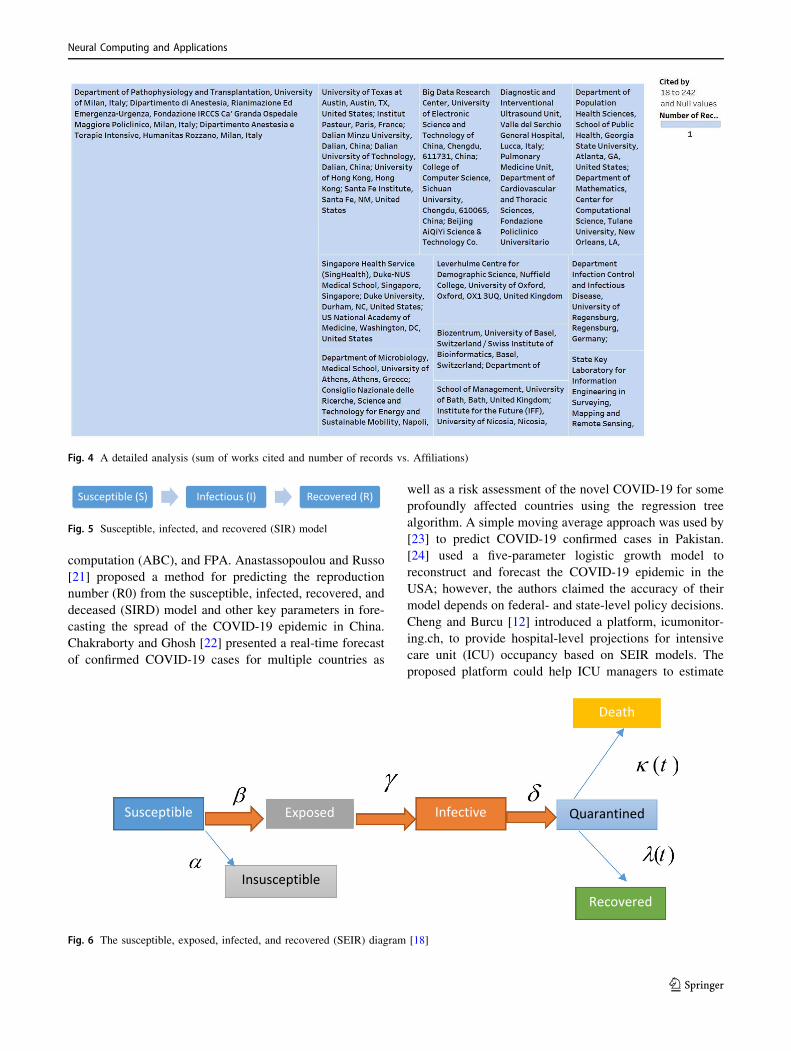
Figure 4 presents the detailed analysis of the sum of
works cited and the number of records versus affiliations.
The filtered numbers of records and works cited include a
minimum of 1 and 18, respectively.
5 Generic illustrations
Several epidemic models have been used by researchers to
estimate the outbreak in the short and long term [11–14].
The most applied epidemic models are the susceptible,
infected, and recovered (SIR) model and susceptible,
exposed, infected, and recovered (SEIR). The SIR model
[15, 16] is described as shown in Fig. 5:
In terms of mathematical modeling, the SIR model is
shown below [17]:
ds
dt¼ �bIS ð1Þ
dI
dt¼ bIS� cI ð2Þ
dR
dt¼ cI ð3Þ
where S is the number of individuals susceptible at time t; I
is the number of infected individuals at time t; R is the
number of recovered individuals at time t; and b and c arethe transmission rate and rate of recovery (removal),
respectively. The SEIR model [18] is similar to the SIR
model except that variable E is added for the fraction of
individuals that have been infected but are asymptomatic.
The SEIR model and the related equations are presented in
Fig. 6.
The equations of the SEIR model are defined below:
dSðtÞdt
¼ �bSðtÞIðtÞ
N� aSðtÞ ð4Þ
dEðtÞdt
¼ bSðtÞIðtÞ
N� cEðtÞ ð5Þ
Fig. 2 Research methodology
used in this paper
Table 1 Parameter settings
Parameter Value
Minimum number of occurrences 1
Criterion met 1931 keywords
Neural Computing and Applications
123

dIðtÞdt
¼ cEðtÞ � dIðtÞ ð6Þ
dQðtÞdt
¼ dIðtÞ � kðtÞQðtÞ � jðtÞQðtÞ ð7Þ
dRðtÞdt
¼ kðtÞQðtÞ ð8Þ
dDðtÞdt
¼ jðtÞQðtÞ ð9Þ
dPðtÞdt
¼ aSðtÞ ð10Þ
where a depicts the protection rate; b is the infection rate; cis the inverse of the average latent time;d represents the
inverse of the average quarantine time; k0 and k1 are
coefficients used in the time-dependent cure rate; and j0and j1 are coefficients used in the time-dependent mor-
tality rate [18].
6 Mathematical modeling
Ahmar and del Val [19] used the SutteARIMA method to
forecast short-term confirmed cases of COVID-19 and
Spain Market Index (IBEX 35). Comparatively, the Sut-
teARIMA method was found to be more suitable for
forecasting daily confirmed cases in Spain than the
AutoRegressive Integrated Moving Average (ARIMA)
based on the mean absolute percentage error (MAPE)
values. Al-qaness [20] suggested an improved version of
the Adaptive Neuro-Fuzzy Inference System (ANFIS)
based on the Flower Pollination Algorithm (FPA) by using
the Salp Swarm Algorithm to forecast the number of
confirmed cases of COVID-19 in China. The idea is to
determine the parameters of the Adaptive Neuro-Fuzzy
Inference System using the hybrid of the Flower Pollina-
tion and Salp Swarm Algorithms. The performance of FPA
was validated by comparing it with the existing modified
ANFIS models, such as Particle Swarm Optimization
(PSO), genetic algorithm (GA), approximate Bayesian
Fig. 3 Networks across the links (keywords analysis)
Neural Computing and Applications
123
computation (ABC), and FPA. Anastassopoulou and Russo
[21] proposed a method for predicting the reproduction
number (R0) from the susceptible, infected, recovered, and
deceased (SIRD) model and other key parameters in fore-
casting the spread of the COVID-19 epidemic in China.
Chakraborty and Ghosh [22] presented a real-time forecast
of confirmed COVID-19 cases for multiple countries as
well as a risk assessment of the novel COVID-19 for some
profoundly affected countries using the regression tree
algorithm. A simple moving average approach was used by
[23] to predict COVID-19 confirmed cases in Pakistan.
[24] used a five-parameter logistic growth model to
reconstruct and forecast the COVID-19 epidemic in the
USA; however, the authors claimed the accuracy of their
model depends on federal- and state-level policy decisions.
Cheng and Burcu [12] introduced a platform, icumonitor-
ing.ch, to provide hospital-level projections for intensive
care unit (ICU) occupancy based on SEIR models. The
proposed platform could help ICU managers to estimate
Fig. 4 A detailed analysis (sum of works cited and number of records vs. Affiliations)
Fig. 5 Susceptible, infected, and recovered (SIR) model
Fig. 6 The susceptible, exposed, infected, and recovered (SEIR) diagram [18]
Neural Computing and Applications
123
the need for additional resources and is updated every
3–4 days. Chimmula and Zhang [25] applied long short-
term memory (LSTM) networks as a deep learning tech-
nique for predicting COVID-19 outbreaks in Canada. Their
approach identified the key features for estimating the
trends of the pandemic in Canada. A simple ARIMA model
was proposed by [26] to estimate registered and recovered
cases after a lockdown in Italy.
Salgotra and Gandomi [4] established two COVID-19
prediction models based on genetic programming in India.
Their results indicate that genetic evolutionary program-
ming models are highly reliable for COVID-19 cases in
India. Dil and Dil [11] used the SIR model to forecast
confirmed COVID-19 cases in the Eastern Mediterranean
region, namely Iran, Iraq, Saudi Arabia, United Arab
Emirates, Lebanon, Egypt, and Pakistan, with a special
focus on Pakistan. A simple SIRD model was proposed by
[14] to predict COVID-19 outbreaks in China, Italy, and
France and estimate healthcare facility necessities, such as
ventilation units.
7 Criteria evaluation
Forecasting confirmed cases, risk assessment, stock mar-
ket, ICU beds, registered and recovered cases are top cri-
teria in which scholars show heightened interest.
8 Solution approaches
Several approaches have been addressed by researchers to
predict the COVID-19 outbreak [27, 28]. Table 2 presents
the solution approaches proposed by researchers for fore-
casting COVID-19, among which SIR, SEIR, SIRD, and
Moving Average are the most popular approaches. Also,
some researchers [29, 30] preferred to use hybrid algo-
rithms to enhance the power of forecasting algorithms.
8.1 Autoregressive model
The autoregressive time-series model is known as a useful
tool to model dependent data and has been applied to
various real-world problems [49–53].
8.1.1 Moving average
In statistics and economics, a moving average is a way to
calculate and analyze data by providing a series of averages
of various subsets of the dataset [54].
8.1.1.1 Simple moving average A simple moving average
(SMA) is defined as the unweighted mean of the previous
data (in finance) or an equal number of data on either side
of a central value (in science or engineering) [54]. An
example of an application of a simple moving average in
COVID-19 could be found in [23].
8.1.1.2 Autoregressive integrated moving average(ARIMA) An autoregressive integrated moving average
model is a generalized form of the autoregressive moving
average model. As it is well known for forecasting, some
researchers have used ARIMA to predict the spread of the
new pandemic [31, 55–58].
8.1.2 Two-piece distributions based on the scale
Maleki M et al. [35] proposed an autoregressive time-series
model based on two-piece scale mixture normal distribu-
tion to predict confirmed and recovered COVID-19 cases.
Compared with the standard autoregressive time-series
model, the proposed algorithm outperforms others in the
forecasting the confirmed and recovered COVID-19 cases
around the world.
8.2 Exponential models
Exponential models are suitable in the modeling of several
phenomena, such as populations, interest rates, and infec-
tious diseases [59].
8.2.1 Logistic functions
One of the famous S-shaped curves is logistic a function
with application in biology, chemistry, linguistics, political
science, and statistics. [24, 37, 38] provide examples of
applications of logistic functions in COVID-19.
8.2.2 Deep learning
Deep learning is a famous branch of machine learning in
which the learning process can be supervised, semi-su-
pervised, unsupervised [60–62]. Application of different
forms of deep learning in forecasting COVID-19 cases
could be found in long short-term memory (LSTM) net-
works [25, 63], polynomial neural network [39], and neural
network [31, 40].
8.2.3 Regression methods
In statistics, regression methods are a set of statistical
modeling to estimate the relationship between a dependent
variable and independent variable(s) [64, 65]. As a pow-
erful tool to forecast the pandemic, various regression
methods have been addressed by researchers against
COVID-19 [42–44, 66, 67].
Neural Computing and Applications
123

8.2.4 Prophet algorithm
The Prophet algorithm is an open-source tool that works
well with time-series data that have seasonal effects. The
main goal of the algorithm, developed by Facebook’s Data
Science team, is business forecasting [68, 69]. The
Prophet algorithm has proven to be robust in dealing with
missing data [70].
8.2.5 Genetic programming
Genetic programming (GP) is a nature-inspired algorithm,
where the keys include program representation (tree
structure), selection, crossover, and mutation [71]. Some
examples of GP in COVID-19 are available in [32–34].
8.2.6 SIR
One of the most applied epidemic models is the suscepti-
ble, infected, and recovered (SIR) model [15, 16]. Vari-
ables S, I, and R are defined in Eqs. 1–3.
8.2.7 SEIR
The SEIR model [18] is an extended version of the SIR
model, which considers an additional parameter, E,
representing the fraction of individuals that have been
infected but are asymptomatic.
8.2.8 SIRD
The SIRD model differentiates between recovered indi-
viduals (those who have survived the disease and are now
immune) and deceased individuals [13, 14].
9 Strengths and weaknesses of forecastingmodels
As discussed earlier, many machine learning algorithms
have been used to forecast the new pandemic in different
places of the world. Figure 7 presents the percentage of
contribution of different solution approaches applied in
forecasting COVID-19 confirmed cases (there are 925
indexed articles in Scopus as of October 10, 2020). As it is
clear from Fig. 7, deep learning, compartmental models,
and other methods have the most contributions, while the
Prophet algorithm, as a new branch of machine learning,
has the least contribution.
Machine learning algorithms exhibit many pros and
cons, which are described in Table 3.
Table 2 Proposed solution approaches for forecasting coronavirus 2019 (COVID-19)
Algorithm
Epidemic models Time-series models Nature-inspired
algorithms
SIR [11] Autoregressive
model
Moving average Autoregressive integrated moving average
[19, 22, 26, 30, 31]
Genetic
programming
[30–34]Simple moving average [23]
Other models [35]
SEIR [12, 36] Exponential models Logistic growth model [24, 37, 38] Flower
pollination
algorithm
[29]
SIRD [13, 14] Deep learning Long short-term memory (LSTM) networks [25] Polynomial
Neural
Network [39]
Neural network [31, 40] Ecological
Niche models
[41]Regression
methods
[42–44]
Prophet algorithm [45]
Phenomenological
model
[46] Other models Adaptive neuro-
fuzzy
inference
system [29]
Regression
tree
algorithm
[22]
Support
vector
machine
[39, 47]
Iteration
method
[48]
Support
vector
Kuhn-
tucker
[47]
Neural Computing and Applications
123

10 Conclusion and discussion
At the time of writing, COVID-19 had spread to more than
200 countries worldwide with more than 36 million con-
firmed cases. Several works have been released in the field
for predicting global outbreaks. This study aimed to review
the most important forecasting models for COVID-19 and
provides a short analysis of published literature. This paper
highlighted the most important subject areas by keywords
analysis. Moreover, several criteria were identified that
could help researchers for future works. Also, this paper
recognized the most useful models that researchers have
applied for predicting this pandemic. Furthermore, this
paper may help researchers to identify important gaps in
the research area and, subsequently, develop new machine
learning models for forecasting the COVID-19 cases. A
detailed scientometric analysis was performed as an influ-
ential tool for use in bibliometric analyses and reviews. For
this aim, keywords and subject areas are discussed, while
0
5
10
15
20
25
30
35
% o
f Con
trib
u�on
Solu�on approaches
Fig. 7 % of contribution of
different solution approaches
applied in the forecasting of
COVID-19 confirmed cases
Table 3 Strengths and weaknesses of proposed machine learning algorithms
Algorithm Strength Weakness
Artificial neural network Could access several training algorithms [72] The nature of being a black box [72], overtraining [73]
Support vector machine Can avoid overfitting and defining a convex
optimization problem [72]
Choice of the kernel as well as speed and size of
training and testing sets [72]
Compartmental models (SIR,
SEIR, SIRD, etc.)
Predict how the disease spreads
Present the effects of public health interventions on
the outcome of the pandemic [74–78]
The proposed models are mostly deterministic and
work with large populations [79]
Nature-inspired algorithms
(genetic programming)
Intelligent search [80]
Can integrate with certain decomposition algorithms
[81]
Several parameters should be set by the decision-
makers
The algorithms are approximate and usually
nondeterministic [82]
Prophet algorithm Are robust in dealing with missing data [70] It is hard to use the algorithm for Multiplicative
models
Predefined format is needed for data before using the
algorithm
ARIMA Works for seasonal and nonseasonal models
Outliers can be handled well
Changes in observations and changes
in model specification make the model unstable [83]
Deep learning Results comparable to human expert performance
[84, 85]
Requires large amounts of data
The training process is expensive
Neural Computing and Applications
123
the classification of forecasting models, criteria evaluation,
and comparison of solution methods are provided in the
second section of the work.
This study describes some key arguments that are wor-
thy of further discussion:
• In terms of the subject area, medicine, biochemistry,
and mathematics are most discussed areas addressed by
scholars.
• In terms of keywords analysis, trends present that
studies on COVID-19 will increase in the next few
months. Moreover, Coronavirus, prediction, epidemic,
human, statistical analysis, quarantine, hospitalization,
mortality, and weather instances are the most interest-
ing keywords for scholars.
• Several other criteria have been used by researchers in
forecasting, including:
– Confirmed cases, risk assessment, stock market,
ventilation units, ICU beds, estimated registered and
recovered cases.
• Several countries, including China, Pakistan, France,
Italy, USA, UK, Brazil, Nigeria, Iran, Germany, and
India, were addressed as case studies.
• Among the epidemic models, deep learning, SIR, and
SEIR are the top models that were used by researchers.
• Hybrid algorithms are used to enhance the power of
forecasting approaches.
• The majority of studies are deterministic approaches,
while there is an urgent need to provide robust
approaches for tackling uncertain situations.
For future research directions, a comprehensive review
in other fields, such as artificial intelligence (AI) and deep
learning, is encouraged. Moreover, more studies addressing
the development of novel and hybrid approaches to fore-
cast the pandemic should be investigated. Furthermore, at
the time of writing this paper, we had access to only a
limited number of published articles by Scopus and WOS.
However, the most important parts of this paper are the
keywords and scientometric analysis that consider the
whole database, from which we chose some examples of
published articles for review. Therefore, a more compre-
hensive review in the research area is suggested.
Funding The authors confirm that there is no source of funding for
this study.
Compliance with ethical standards
Conflict of interest The authors declare that they have no conflict of
interest.
References
1. Putra S, Khozin Mutamar Z (2019) Estimation of parameters in
the SIR epidemic model using particle swarm optimization. Am J
Math Comput Model 4(4):83–93
2. Mbuvha RR, Marwala T (2020) On data-driven management of
the COVID-19 outbreak in South Africa. medRxiv
3. Qi H et al (2020) COVID-19 transmission in Mainland China is
associated with temperature and humidity: a time-series analysis,
p 138778
4. Salgotra R, Gandomi M, Gandomi AH (2020) Time series anal-
ysis and forecast of the COVID-19 pandemic in india using
genetic programming. Chaos Solitons Fractals 138:109945
5. Mahalle P et al (2020) Forecasting models for coronavirus
(covid-19): a survey of the state-of-the-art. TechRxiv. https://doi.
org/10.36227/techrxiv.12101547.v1 (Preprint)6. Naude W (2020) Artificial intelligence against COVID-19: an
early review. IZA Discussion Paper No. 13110. https://ssrn.com/
abstract=3568314
7. Shrivastava R, Mahajan PJS, Libraries T (2016) Artificial intel-
ligence research in India: a scientometric analysis. Sci Technol
Libr 35(2):136–151
8. Su H-N, Lee P-CJS (2010) Mapping knowledge structure by
keyword co-occurrence: a first look at journal papers in tech-
nology foresight. Scientometrics 85(1):65–79
9. Van Eck NJ, Waltman L (2014) Visualizing bibliometric net-
works. In: Ding Y, Rousseau R, Wolfram D (eds) Measuring
scholarly impact. Springer, Berlin, pp 285–320
10. Van Eck NJ, Waltman L (2013) VOSviewer manual, vol 1.
Univeristeit Leiden, Leiden, pp 1–53
11. Dil S, Dil N, Maken ZH (2020) COVID-19 trends and forecast in
the eastern mediterranean region with a particular focus on
Pakistan. Cureus 12(6):8
12. Cheng Z et al (2020) icumonitoring.ch: a platform for short-term
forecasting of intensive care unit occupancy during the COVID-
19 epidemic in Switzerland. Swiss Med Weekly 150:10
13. Anastassopoulou C et al (2020) Data-based analysis, modelling
and forecasting of the COVID-19 outbreak. PLoS ONE 15(3):21
14. Fanelli D, Piazza F (2020) Analysis and forecast of COVID-19
spreading in China, Italy and France. Chaos Solitons Fractals
134:5
15. Kermack WO, McKendrick AG (1932) Contributions to the
mathematical theory of epidemics. II: the problem of endemicity.
Proc R Soc Lond Ser A 138(834):55–83
16. Capasso V, Serio G (1978) A generalization of the Kermack–
McKendrick deterministic epidemic model. Math Biosci
42(1–2):43–61
17. Weiss HH (2013) The SIR model and the foundations of public
health. Mater Mat 2013(3):1–17
18. Peng L et al (2020) Epidemic analysis of COVID-19 in China by
dynamical modeling. arXiv:2002.06563
19. Ahmar AS, del Val EB (2020) SutteARIMA: short-term fore-
casting method, a case—Covid-19 and stock market in Spain. Sci
Total Environ 729:138883
20. Al-qaness MAA et al (2020) Optimization method for forecasting
confirmed cases of COVID-19 in China. J Clin Med 9(3):674
21. Anastassopoulou C et al (2020) Data-based analysis, modelling
and forecasting of the COVID-19 outbreak. PLoS ONE
15(3):e0230405
22. Chakraborty T, Ghosh I (2020) Real-time forecasts and risk
assessment of novel coronavirus (COVID-19) cases: a data-dri-
ven analysis. Chaos Solitons Fractals 135:10
23. Chaudhry RM et al (2020) Coronavirus disease 2019 (COVID-
19): forecast of an emerging urgency in Pakistan. Cureus
12(5):15
Neural Computing and Applications
123
24. Chen DG, Chen XG, Chen JK (2020) Reconstructing and fore-
casting the COVID-19 epidemic in the United States using a
5-parameter logistic growth model. Glob Health Res Policy
5(1):7
25. Chimmula VKR, Zhang L (2020) Time series forecasting of
COVID-19 transmission in Canada using LSTM networks. Chaos
Solitons Fractals 135:6
26. Chintalapudi N, Battineni G, Amenta F (2020) COVID-19 virus
outbreak forecasting of registered and recovered cases after sixty
day lockdown in Italy: a data driven model approach. J Microbiol
Immunol Infect 53(3):396–403
27. Kavadi DP, Patan R, Ramachandran M, Gandomi AH (2020)
Partial derivative nonlinear global pandemic machine learning
prediction of COVID-19. Chaos Solitons Fractals. https://doi.org/
10.1016/j.chaos.2020.110056
28. Mousavi M, Salgotra R, Holloway D, Gandomi AH COVID-19
time series forecast using transmission rate and meteorological
parameters as features. IEEE Comput Intell Mag (in press).
https://doi.org/10.1109/mci.2020.3019895
29. Al-qaness MAA et al (2020) Optimization method for forecasting
confirmed cases of COVID-19 in China. J Clin Med 9(3):15
30. Singh S et al (2020) Development of new hybrid model of dis-
crete wavelet decomposition and autoregressive integrated mov-
ing average (ARIMA) models in application to one month
forecast the casualties cases of COVID-19. Chaos Solitons
Fractals 135:8
31. Moftakhar L, Seif M, Safe MS (2020) Exponentially increasing
trend of infected patients with COVID-19 in Iran: a comparison
of neural network and ARIMA forecasting models. Iran J Public
Health 49:92–100
32. Salgotra R et al (2020) Time series analysis and forecast of the
COVID-19 pandemic in India using genetic programming. Chaos
Solitons Fractals 138:109945
33. Salgotra R, Gandomi M, Gandomi AH (2020) Evolutionary
modelling of the COVID-19 pandemic in fifteen most affected
countries. Chaos Solitons Fractals. https://doi.org/10.1016/j.
chaos.2020.110118
34. Salgotra R, Gandomi AH (in press) Time series analysis of the
COVID-19 pandemic in Australia using genetic programming. In:
Kose U et al (eds) Data science for COVID 19. Elsevier
35. Maleki M et al (2020) Time series modelling to forecast the
confirmed and recovered cases of COVID-19. Travel Med Infect
Dis 37:101742
36. Reno C et al (2020) Forecasting COVID-19-associated hospital-
izations under different levels of social distancing in Lombardy
and Emilia-Romagna, Northern Italy: results from an extended
SEIR compartmental model. J Clin Med 9(5):11
37. Li Q, Feng W, Quan YH (2020) Trend and forecasting of the
COVID-19 outbreak in China. J Infect 80(4):472–474
38. Qeadan F et al (2020) Naive forecast for COVID-19 in Utah
based on the South Korea and Italy models-the fluctuation
between two extremes. Int J Environ Res Public Health 17(8):14
39. Fong SJ et al (2020) Finding an accurate early forecasting model
from small dataset: a case of 2019-nCoV novel coronavirus
outbreak. Int J Interact Multimed Artif Intell 6(1):132–140
40. Tamang SK, Singh PD, Datta B (2020) Forecasting of Covid-19
cases based on prediction using artificial neural network curve
fitting technique. Glob J Environ Sci Manag 6:53–64
41. Ren HY et al (2020) Early forecasting of the potential risk zones
of COVID-19 in China’s megacities. Sci Total Environ 729:8
42. Ji D et al (2020) Prediction for progression risk in patients with
COVID-19 pneumonia: the CALL Score. Clin Infect Dis
71(6):1393–1399. https://doi.org/10.1093/cid/ciaa414
43. Ribeiro MHDM et al (2020) Short-term forecasting COVID-19
cumulative confirmed cases: perspectives for Brazil. Chaos
Solitons Fractals 135:109853
44. Sujath R et al (2020) A machine learning forecasting model for
COVID-19 pandemic in India. Stochast Environ Res Risk Assess
34:959–972
45. Abdulmajeed K, Adeleke M, Popoola LJD (2020) Online fore-
casting of Covid-19 cases in Nigeria using limited data. Data
Brief 30:105683
46. Roosa K et al (2020) Real-time forecasts of the COVID-19 epi-
demic in China from February 5th to February 24th, 2020. Infect
Dis Model 5:256–263
47. Parbat, D.J.C., Solitons and Fractals, A Python based SupportVector Regression Model for prediction of Covid19 cases inIndia. 2020: p. 109942
48. Perc M et al (2020) Forecasting Covid-19. Front Phys 8:127
49. Maleki M, Arellano-Valle RB (2017) Maximum a posteriori
estimation of autoregressive processes based on finite mixtures of
scale-mixtures of skew-normal distributions. J Stat Comput Simul
87(6):1061–1083
50. Maleki M, Nematollahi AJ, Technology TAS (2017) Autore-
gressive models with mixture of scale mixtures of Gaussian
innovations. Iran J Sci Technol Trans A Sci 41(4):1099–1107
51. Zarrin P et al (2019) Time series models based on the unrestricted
skew-normal process. J Stat Comput Simul 89(1):38–51
52. Maleki M et al (2017) A Bayesian approach to robust skewed
autoregressive processes. Calcutta Stat Assoc Bull 69(2):165–182
53. Hajrajabi A, Maleki MJ (2019) Nonlinear semiparametric
autoregressive model with finite mixtures of scale mixtures of
skew normal innovations. J Appl Stat 46(11):2010–2029
54. Sprinthall RC, Fisk ST (1990) Basic statistical analysis. Prentice
Hall, Englewood Cliffs
55. Roy S, Bhunia GS, Shit PK (2020) Spatial prediction of COVID-
19 epidemic using ARIMA techniques in India. Model Earth Syst
Environ. https://doi.org/10.1007/s40808-020-00890-y
56. Alzahrani SI et al (2020) Forecasting the spread of the COVID-19
pandemic in Saudi Arabia using ARIMA prediction model under
current public health interventions. J Infect Public Health
13:914–919
57. Kufel TJ (2020) ARIMA-based forecasting of the dynamics of
confirmed Covid-19 cases for selected European countries.
Equilib Q J Econ Econ Policy 15(2):181–204
58. Singh S et al (2020) Development of new hybrid model of dis-
crete wavelet decomposition and autoregressive integrated mov-
ing average (ARIMA) models in application to one month
forecast the casualties cases of COVID-19. Chaos Solitons
Fractals 135:109866
59. Smith BAJIDM (2020) A novel IDEA: the impact of serial
interval on a modified-incidence decay and exponential adjust-
ment (m-IDEA) model for projections of daily COVID-19 cases.
Infect Dis Model 5:346–356
60. Bengio Y et al (2013) Representation learning: a review and new
perspectives. IEEE Trans Pattern Anal Mach Intell
35(8):1798–1828
61. Schmidhuber JJ (2015) Deep learning in neural networks: an
overview. Neural Netw 61:85–117
62. LeCun Y, Bengio Y, Hinton GJ (2015) Deep learning. Nature
521(7553):436–444
63. Ayyoubzadeh SM et al (2020) Predicting COVID-19 incidence
through analysis of Google trends data in Iran: data mining and
deep learning pilot study. JMIR Public Health Surveill
6(2):e18828
64. Freedman DA (2009) Statistical models: theory and practice.
Cambridge University Press, Cambridge
65. Cook RD, Weisberg SJ (1982) Criticism and influence analysis in
regression. Sociol Methodol 13:313–361
66. Velasquez RMA, Lara JVMJC (2020) Forecast and evaluation of
COVID-19 spreading in USA with reduced-space Gaussian pro-
cess regression. Chaos Solitons Fractals 136:109924
Neural Computing and Applications
123

67. Almeshal AM et al (2020) Forecasting the spread of COVID-19
in Kuwait using compartmental and logistic regression models.
Appl Sci 10(10):3402
68. Taylor SJ, Letham B (2018) Forecasting at scale. Am Stat
72(1):37–45
69. Taylor S, Letham B (2017) Prophet: automatic forecasting pro-
cedure. R package version 0.1. https://CRAN.R-project.org/pack
age=prophet
70. Ndiaye BM, Tendeng L, Seck D (2020) Analysis of the COVID-
19 pandemic by SIR model and machine learning technics for
forecasting. arXiv:2004.01574
71. Banzhaf W et al (1998) Genetic programming. Springer, Berlin
72. Jalalkamali A et al (2015) Application of several artificial intel-
ligence models and ARIMAX model for forecasting drought
using the Standardized Precipitation Index. Int J Environ Sci
Technol 12(4):1201–1210
73. Wilamowski BMJIIEM (2009) Neural network architectures and
learning algorithms. IEEE Ind Electron Mag 3(4):56–63
74. Hethcote HW (1989) Three basic epidemiological models. In:
Levin SA, Hallam TG, Gross LJ (eds) Applied mathematical
ecology. Springer, Berlin, pp 119–144
75. Brauer F, Castillo-Chavez C (2012) Mathematical models in
population biology and epidemiology, vol 2. Springer, Berlin
76. Nunn C, Altizer S, Altizer SM (2006) Infectious diseases in
primates: behavior, ecology and evolution. Oxford University
Press, Oxford
77. Gao S et al (2007) Analysis of an SIR epidemic model with pulse
vaccination and distributed time delay. J Biomed Biotechnol
2007:64870. https://doi.org/10.1155/2007/64870
78. Rahimi I, Gandomi AH, Chen F et al (2020) Analysis and pre-
diction of COVID-19 using SIR, SEIR, and machine learning
models: Australia, Italy, and UK Cases, 13 October 2020, PRE-
PRINT (version 1) available at Research Square. https://doi.org/
10.21203/rs.3.rs-85513/v1
79. Bartlett MS (1957) Measles periodicity and community size. J R
Stat Soc Ser A 120(1):48–70
80. Glover F, Laguna M (1998) Tabu search. Handbook of combi-
natorial optimization. Springer, Boston, MA, pp 2093–2229
81. Poojari CA, Beasley JE (2009) Improving benders decomposition
using a genetic algorithm. Eur J Oper Res 199(1):89–97
82. Blum C, Roli AJ (2003) Metaheuristics in combinatorial opti-
mization: overview and conceptual comparison. ACM Comput
Surv 35(3):268–308
83. Makridakis S, Hibon MJ (1997) ARMA models and the Box-
Jenkins methodology. J Forecast 16(3):147–163
84. Ciregan D, Meier U, Schmidhuber J (2012) Multi-column deep
neural networks for image classification. In: 2012 IEEE confer-
ence on computer vision and pattern recognition. IEEE
85. Krizhevsky A, Sutskever I, Hinton GE (2017) Imagenet classi-
fication with deep convolutional neural networks. Commun ACM
60(6):84–90. https://doi.org/10.1145/3065386
Publisher’s Note Springer Nature remains neutral with regard to
jurisdictional claims in published maps and institutional affiliations.
Neural Computing and Applications
123


