A Review of the World Sheepmeat Market: Volume 3 REVIEW OF THE WORLD SHEEPMEAT MARKET THE EEC (l0)...
119
A REVIEW OF THE WORLD SHEEPMEAT MARKET THE EEC (l0) N. BLYTH Discussion Paper No. 60 Volume 3 Agricultural Economics Research Unit Lincoln College loS.S.N.OI10-7720
Transcript of A Review of the World Sheepmeat Market: Volume 3 REVIEW OF THE WORLD SHEEPMEAT MARKET THE EEC (l0)...

A REVIEW OF THE WORLD
SHEEPMEAT MARKET
THE EEC (l0)
N. BLYTH
Discussion Paper No. 60
Volume 3
Agricultural Economics Research Unit
Lincoln College
loS.S.N.OI10-7720

THE AGRICULTURAL ECONOMICS RESEARCH UNIT Lincoln College, Ca...Lterbury, N.Z.
THE UNIT was established in 1962 at Lincoln CoJ.lege, University of Canterbury. Its major sources of funding have been al1.l1uai grants from the Department of Scientific and Industrial Research and the College. These grants have been supplemented by others from commercial and other organisations for specific research projects within New Zealand and overseas.
The Unit has on hand a programme of research in the fields of agricyltural economics and management, including production, marketing and policy, resource economics, and the economicsoflocation and transportation. The results of these research studies are published as Research Reports as projects are completed. In addition, technical papers, discussion papers and reprints of papers. published or delivered elsewhere are available on request. For list of previous publications see inside back cover.
The Unit and the Department of Agricultura,lEconomics and Marketing and .the Department of Farm Management and . Rural Valuation maintain a dqse working relationship in research and associated matters. The combined academic staff of the Departments is around 25.
The Unit also sponsors periodic conferences and seminars on appropriate topics, sOl;netimes in conjunction with other organis.ations.
The overall policy of the Unit is set by a Policy Committee consisting of the Director, Deputy Director and appropriate Professors.
UNIT POLICY COMMITTEE: 1981 .
Professor J,R. Dent, B.Se., M.Agr.Sc., Ph.D. (Farm Management and Rural Va.luation)
Professor B.J. Ross, M.Agr.Sc. (Agricultural Economics)
P.D. Chudleigh, E.Se., (Hons), Ph.D.
UNIT RESEARCH STAFF: 1981
Director Professor J.B. Dent, B.Se., M.Agr.Sc., Ph.D.
Deputy Director
P.D. Chudleigh, B.Sc. (Hons), Ph.D.
Research Fellow in Agricultural Policy
J.G. Pryde, G.B.E., M.A., F.N.Z.I.M.
Senior Research Economists KL. Leathers, B.S., M.S., Ph.D.
RD. Lough, B.Agr.Sc.
Research Economists CD. Abbott, B.$c.(Ho!J,s), D.B.A.
AC.Beck, B.Sc.Agr., M.Ec. J.D. Gough, B.Se., M.Com.
RL King, ,B.A. P). McCartin, B.Agr.Com.
C.R-McLeod, B.Agr.Sc. RG.Moffitt,·B.Hort.Sc., N.D.H.
M.M. Rich; Dip.V,F.M., B.Agr.Com., M.Ec. RL.Sheppard, B.Agr.Sc. (Hans)
PostGraduate Fellows N. Blyth, B.Sc. (Hons.)
M. Kagatsume. B.A., M.A N.M. Shadbolt,B. Sc .. (Hons.)
Secr~tary JA Rennie

CONTENTS
PREFACE
SUMMARY
1. A REVIEW OF THE SHE EPMEAT MARKET IN THE EEC
1 .1 Introduc Hon
1.2 Production
1.3 Consumption
1.4 Trade
2. UNITED KINGDOM
2.1 Production
2.2 C~nsumption
2.3 Prices
2.4 Trade
2.4.1 Exports
2.4.2 Imports
3. FRANCE
3.1 Production
3.2 Consumption
3.3 Prices
3.4 Trade
4. IRELAND
4.1 Production
4.2 Consumption
4.3 Trade
5. ITALY
5.1 Production
5.2 Consumption
5.3 Trade
Page
(i)
1
3
4
7
10
13
13
16
22
23
23
23
29
29
30
34
34
41
41
44
47
53
53
55
57

6. WEST GERMANY
6.1 Production
6.2 Consumption
6.3 Trade
7. THE NETHERLANDS
7.1 Production
7.2 Consumption
7.3 Trade
8. BELGIUM AND LUXEMBOURG
8.1 Production
8.2 Consumption
8.3 Trade
9. DENMARK
10.
9.1 Production
902 Consumption
9.3 Trade
GREECE
10.1 Production
10.2 Consumption
10.3 Trade
10.4 A Note on Greece and the EEC
REFERENCES
Page
63
63
63
68
73
73
75
75
79
79
79
80
85
85
85
88
89
89
92
95
98
Ib3

PREFACE
This volume is the third in a series of five reviewing the
world sheepmeat market. Other volumes in the series are as
follows: Volume One gives an overview of the world sheepmeat
market. In this respect, Volume One can be considered a summary
for the whole serie s. Volume Two pre se nts a review of sheepmea t
production, consumption, and trade in the major exporting countries
of New Zealand, Australia, and Argentinao Volume Four concentrates
on North America, Japan and the Middle East whilst Volume Five
deals with East European countries.
The present paper (Volume Three) reviews sheepmeat
production, consumption, and trade in the EEC countries.
The five volumes of this discussion paper form part of the
A.E.R.U. 's programme of research in the marketing and inter
national trade area. Other paper s relevant to sheepmea t markets
published recently by the A.E.R.U. include Research Report
No.1 09 by R. L. Sheppard on Changes in U. K. Mea t Demand,
Discussion Paper No's 51 and 59 by N. Blyth on the EEC Sheepmeat
Regime and Discussion Paper No. 52 on Future Directions for
New Zealand Lamb Marketing.
(1)
P. D. Chudleigh,
Director


ACKNOWLEDGEMENT
The author wishes to acknowledge the workshop
on "The EEC Sheep Industry; Perspectives and
Implications for N.Z.", held at Massey University
by the Centre for Agricultural Policy Studies in
October 1981. The workshop provided useful background
material for the author whilst completing this volume.


SUMMARY
Patterns of productions, consmnption and trade in the EEC vary
widely among the ten members.
The U. K. and France are major consumers of sheepmeat, followed
by Ireland, Italy, Germany and Greece. In the other States sheepmeat
consumption is relatively unimportant.
Production and trade are similarly distributed. However, the
trends over the period considered show an increase in production in
most states, and an increase in consumption in France, Greece,
Germany and Italy, but a major decline in the United Kingdom.
As the EEC produces only 60 per cent of its consumption, it is
highly dependent on external sources for supply. Imports were at a.
maximum in 1969 (422 Kt), but have dropped steeply since, to 328 Kt.
This is a result of declining demand in the U.K. and the EEC's imposi
tion of a 20 per cent tariff. A further decline is expected following
the introduction of a Common Polic y for sheepmeatB in 1980. The main
suppliers to the Community are N. Z., Argentina, Australia and the
East European states. In 1980 these countries supplied 80.4 per cent,
30 per cent, 1.9 per cent, and 13.1 per cent of total imports respectively.
The outlook for trade is for a continuation of the current trends,
with a net decrease in imports. Trade with Germany, Italy, France
and Greece should continue to grow, but ma y be offset by a decline in
other states, particularly the U.K. Overall, because of the declining
market, and protectionist import policies, the EEC will offer only
limited opportunities for exporters during the 1980's, though will con
tinue to be the major and probably most stable of world markets.
1.

1. A REVIEW OF THE SHEEPMEAT MARKET IN THE EEC (10)
1.1 Introduction
For many years the ten countries of the EEC have been among
the world's major sheepmeat importers, and together have over one
third of world import trade.
Since the formation of the EEC (in 1968) and its enlargement
(in 1973) imports have declined considerably. The preferential trading
arrangements among the member states have encouraged intra-EEC
trade, and reduced imports through the imposition of an ad valorem
tariff, and several forms of non-tariff barrier. In 1980 more formal
arrangements were made, under a Common Sheeprneat Regime to
support EEC sheep producers, and to harmonise the ten markets.
Voluntary Restraint Agreements (VRA's) were negotiated with third
country exporters, to protect the internal EEC markets from disruption.
The VRA's guarantee exporters access to a large and compari
tively wealthy and stable market for the next few years, and as the
allowances are relatively generous they are unlikely to be filled by
exporters. The main reason for exporters not providing the full quota
is that there has been a natural decline anyway. in the major market
(the U. K.}o The decline has partly been offset by growth of the
Continental EEC markets, though much of the increased demand in
these markets has been supplied by British exporters. These trends
are likely to continue, to the detriment of traditional exporters in the
southern hemisphere, who face a diminishing import market.
Nevertheless, there may be opportunities for expansion of trade
with Community markets other than the U. K., and the trade is likely
to remain of major importance within the w orId sheepmeat market.
The objective of this review is to provide a background to each of the
3.
4.
EEC states in order for exporting countries to assess their position
and potential. In the re st of this section a general overview of the
EEC market is given. In following sections production, consumption
and trade in each of the ten member-states is considered in more
detail. and. on the basis of the market characteristic s and outlook to
1985, implications are drawn for exporter s.
1.2 Production
Sheepmeat production in the EEC is aver y minor income-earner.
representing only 1.3 per cent of agric ultural revenue. Only in the
United Kingdom and Ireland does the sheepmeat sector contribute more
than 3 per cent (4.1 per cent and 3.1 per cent respectively). Much
of the general comment here is not therefore relevant to these two
countries as the structure of their industries is qui.te different from
other countries. Compared to other meats. sheepmeat is of little
importance. being 2.4 per cent of all meat production. The community
flock of 43 million accounts for only 4 per cent of world sheep. but
produces 7i per cent of the world's sheepmeat. The sheep industry
in Europe has a different basic structure from other agricultural
enterprise s. Although there are some semi -industriali sed sheep fatten
ing units. it is essentially a small-holding operation. Breeding flocks
tend to be located in hill and mountain regions. and other less-productive
areas, their size and character being determined more by social and
environmental factors than by relative returns. As a consequence.
neither breeding nor fattening elements of the industr yare partic ularly
responsive to market fluctuations in the short to medium term.
Two-thirds of the community's 43 million sheep are found in
areas defined in the EEC Directive (1975) as less-favoured. In France.
70-75 per cent of the sheep flock is located in such regions. whilst in
Italy the proportion is 80-90 per cent. In general. sheep farming is

5.
declining in lowland regions "Wh ere other types of enterprise compete
with it, whereas it is increasing in upland regions and other less
favoured areas. The physical conditions, size of holding, distance
from markets, communication difficulties and traditionalism asso
ciated with these areas create a complex of problems which cannot
be resolved through manipulation of market mechanisms. Hence,
farm incomes have to be supported according to the Directive, though
the common policy on sheepmeats will give direct market-price support.
Within the regions there are significant differences in sheep
production systems and breed of sheep, depending on the relative
importance of meat, wool and milk production. The majority of sheep
are bred for meat, with milking sheep numbering less than 10 per cent
of the flock and confined to Italy and the south of France. Sheep kept
exclusively for wool are gradually disappearing.
The Community's flock is distributed unevenly between states:
only the U. K. and France have a significant number of sheep, and
between them account for 79 per cent of EEC production of sheepmeat.
Though overall sheep numbers aCld production have been stable, with
a small increase since 1976 (Table 1), these figures obscure marked
regional trends: these are discussed further in the specific country
reviews. However, the overall level of production is important since
the introduction of a common sheepmeat polic y in 1980 unite s the
indi vidual state s into a single market. The Regime doe s still allow
each countr y to pur sue its own polic y though, through a system of
differential prices and support mechanisms (Blyth, 1980).
The outlook for production is for an increase in output to 540 Kt
(CEC, 1977): this is lower than FAO (1979) projections to 1985, which
are for an output of 560- 600 Kt. Self- sufficienc y levels are estimated
to remain similar to the present level of 65 per cent.

TABLE 1 0' .
Production and Consum12tion Statistic s
-Sheep Sheepmeat Consumption of
(million Production Population All meat Sheepmeat Total Sheepmeat head) (Kt) (million) (kg per capita) (kg per capita) Consumption (Kt)
1960 41.56 449 231. 4 60.9 3.6 823 1961 42.01 482 233.6 62.5 3.6 838 1962 42.19 477 236.1 65.2 3.5 836 1963 42.54 457 238.4 65.7 3.4 799 1964 42.32 472 241.1 66.4 3.4 816 1965 42.89 468 243.2 68.0 3.3 805 1966 43.82 503 245.0 69.4 3.4 832 1967 43.04 497 246.5 71.3. 3.4 847 1968 42.74 482 247.9 73.3 3.4 839 1969 42.11 445 249.5 74.2 3.3 816 1970 41.69 469 251.3 76.4 3.3 820 1971 41.06 489 253.3 78.7 3.4 865 1972 41.13 476 254.9 79.3 3.3 832 1973 42.04 562 256.5 79.0 3.1 786 1974 42.84 497 257.6 81.2 2.9 754 1975 43.40 514 758.2 81. 7 3.1 817 1976 43.10 507 259.6 82.7 3.0 793 1977 43.90 486 259.1 84.1 2.9 760 1978 44.80 505 259.7 86.2 3.0 772 1979 46.40 512 260.2 87.4 3.0 781 1980 47.90 537 260.6 88.5 3.1 805
So ur c e: U. S. D • A.

7.
These projections, based on present trends, could be modified
by the common polic yon sheepmeat adopted by the EEC in 1980. A
drop in producer incomes in less favoured areas would bring about a
fall in output: on the other hand, stability or a rise in the market price
would be an incentive to domestic production (Bryant, 1981; Blyth, 1981),
Indeed, a "revival ll is taking place in sheep farming in several member
states in response to rising demand.
Neither do the projections take into account the enlargement of the
EEC to include Greece, which occurred in January 1981, nor Spain and
Portugal who will join at a later date. Separate projections for Greek
production are given in section 11.1.
1.3 Consumption
Meat consumption in the EEC is high, compared to world levels,
at 87 kg per capita. In relation to this, sheepmeat is comparatively
unimportant, and is only 3.4 per cent of all meat (Table I), at 3.1 kg
per capita. Total sheepmeat consumption has varied around 800 Kt
over the period 1973 - 80: thi s masks the trends within state s, with
consumption falling in the U. K., but rising in France and Italy.
Consumer attitudes and consumption patterns are also diverse,
ranging from continuous consumption at relatively high per capita levels
in Ireland and the U. K. (11.2 kg) to sporadic, 0 r insignificant lIfe stive II
consumption at low levels as in Italy and the Netherlands (0.2 kg). In
other parts of the Community, notably France, lamb is eaten more·
regularly, but as a luxury, high-price meat. In Denmark and Germany
there is evidence that lamb is becoming accepted as a substitute for
other meats. Migrant worker s and other ethnic groups throughout the
EEC often have str )ng preferences for sheepmeats and are regular
consumers of mutton and lamb.

8.
This diversit:, of consumption patterns is reflected in wide varia
tions in the relationship between the price s of sheepmeats and other
meats. In France, where lamb is a luxury meat, retail prices are
substantially above those for other meats, including beef, whilst in the
U. K. lamb se11s at about the same price as beef. The price of home
ki11ed lamb in the U.K. is usually less than 60 per cent of that in France,
though since 1976 the gap has narrowed, due to rising U. K. price sand
fa11ing prices in France (Volans, 1981).
The structure of sheepmeat prices in the EEC is essentia11y
determined in two markets:
(i) The U.K. market directly influences prices in the Irish market
(though in 1978-80 the French market has had a greater influence).
(Ii) The French market determine sthe level of price s received by
producers in states exporting to France (Belgium, Germany,
the Netherlands and also Italy).
However, the market price in Germany and Italy is lower than
that in France, as their markets are influenced by the price of imports
which are often considered to be of a lower quality than home-produced
meat. In general though, price difference s are narrowing,. and wi11
continue to do so, as far as the forces of supply and demand are a110wed
to work freely in the market. The Intervention price of the Sheepmeat
Regime, based on the French market price (applied in all states except
the U.K.) should hasten the process of harmonisation.
The outlook is for consumption levels of 830 Kt (CEC, 1977) by
1985, though FAO (1979) projections are somewhat lower at 760 Kt, or
2.9 kg per capita. The latter is probably more realistic, in the light
of current consumption levels. However, under the proposed Common
Sheepmeat Regime, market prices could rise substantia11y, which
would reduce consumption below this level (MLC, 1981). Population
growth is low overa11 (Table 1) and is not likely to have much effect
on future demand.

9.
TABLE 2
Sheepmeat Trade in the EEC
Total Imports 1 Exports (Kt) (Kt)
1961 385.0 14.8
1962 390.1 22.7
1963 377.4 25.8
1964 375.9 26.4
1965 384.3 29.0
1966 355.4 31.6
1967 381.3 29.5
1968 398.2 27.9
1969 424.1 33.1
1970 388.4 33.5
1971 410.3 43.1
1972 422.6 48.2
1973 352.5 51.3
1974 286.1 52.9
1975 343.1 66.1
1976 320.0 74.3
1977 323.0 77.1
1978 339.0 80.3
1979 330.0 71.4
1980 328.0 70.9
1 Includes intra-EEC trade
Source: U.S.D.A
10.
1.4 Trade
Even though the EEC produce s only a small part of the world's
sheepmeat, in terms of trade it plays an important role, as it provides
over a third of world trade in sheepmeat.
Unlike imports from non-member countries, intra-community
trade in sheepmeats is increasing (60 Kt, 1973: 80 Kt,1978). Most of
this trade consists of traditional exports to France (40- 50 Kt) from the
U. K., Netherlands and Ireland; in addition, Germany has started to
export to France since 1975.
Imports from third countries, which were subject to a 20 per cent
ad valorem duty up to 1980 are decreasing slightly (Table 2). Whilst
the community is self- sufficient in pig and poultry meat, and normally
over 90 per cent in beef and veal, substantial imports of sheepmeat
have always been necessary. Self sufficient levels have never exceeded
66 per cent, which gives an import requirement of some 270 Kt.
Apart from a relatively small flow of live animals from East
Europe, and small, sporadic shipments from South America and
Australia, the EEC imports sheepmeat from only one main source:
N. Z. In the 1974- 80 period, N. Z. accounted for 82 per cent of the
Community's third -countr y imports, and supplied one third of total
EEC requirements (I'able 3). This unique situation is not reflected in
the pattern of trade of any other agricultural product (NZMPB, 1977).
Of New Zealand's exports to the EEC, 85 per cent is lamb for
consumption in the U. K. (for details, see Section 2): this proportion
has decreased slightly as the N. Z. Diversification Scheme has
encouraged trade with other countries. Nevertheless N.Z. has main
tained both its market share and volume of shipments to the EEC,
de spite the declining impo rt demand in the U. K. (Table 3).

TABLE 3
EEC lttlIloris of SheeI!Ill!ilat froIll Third Countries (tonnes carcasfi weiljhjJ
1973 1974 1975 1976 1977 1978
Tonnes 0/0 Tonnes % Tonnes 0/0 Tonnes 0/0 Tonnes % Tonnes
N.Z. 251,097 80.1 209,271 85.0 245,429 83.5 222,539 81.4 220,581 82.2 231,766
Argentina 8,406 2.7 6,932 2.8 13,890 4.7 14,467 5.3 16,993 6.3 11,164
Australia 24,418 7.8 7,939 3.2 8,531 3.0 12,713 4.6 5,758 2.1 12,114
Hungary 10,150 3.2 8,530 3.5 8,622 3.0 8,639 3.2 8,043 3.0 6,866
Bulgaria 5,707 1.8 3,596 1.5 4,108 1.5 2,146 0.8 838 0.3 2,488
Czechoslovakia 699 0.3 641
Poland 1,435 0.5 1,939 0.8 3,338 1.2 3,645 1.3 4,232 1.6 4,822
Yugoslavia 2,520 0.8 2,448 1.0 3,123 1.1 3,276 1.2 3,584 1.3 3,824
Iceland 384 0.2 367
Uruguay 334 0.1 2,535 0.9 3,507 1.3 2,450 0.9 2,063
Brazil 1,713 0.6 146
East Germany 1,645 0.6 1,918 0.8 2,274 0.8 2,427 0.8 2,304 0.9 3,625
Rumania 3,082 1.0 1,570 0.6 968 0.3 190 0.1 229 0.1 418
Spain 428 0.2 1,002
TOTAL 313,629 100.0 246,066 100.0 295,937 100.0 273,549 100.0 268,236 100.0 281,306
Source: Agra Europe
1979
0/0 Tonnes 0/0
82.4 218,604 87.0
4.0 10,899 4.3
4.3 8,885 3.5
2.4 1,751 0.6
0.9 2,128 0.8
0.2 650 0.2
1.7 20
1.4 3,040 1.2
0..1 617 0.2
0.7 4,005 1.6
0.1
1.3 6
0.1 130 0.1
0.4 8
100.0 251,088 100.0
1980
Tonnes
195,700
7,300
4,700
1 3,000
3,200
7,200
2,900
1,500
5,000
243,300
0/0
80.4
3.0
1.9
5.5
1.5
2.9
1.2
0.6
2.0
100.0
.... ....
12.
FAO (1979) projects that sheepmeat imports from non-member
countries will decline further by 1985, to 190-210 Kt.
Under the Community's comm'on sheepmeat policy (see Blyth,
1980), third-country suppliers are asked to "voluntarily!' restrict
exports. N. Z. 's quota of 234 Kt (1980) is greater than the volume
exported to the EEC since 1973, and rna y still be greater than the
market demand during the 1980 1 s so it is unlikely that the quota
will be filled.

2. UNITED KINGDOM
2.1 Production
For a highly industrialised densely populated country the U.K.
has a surprisingly large sheep flock of some 20 million head. It is
the largest producer in the EEC, with 50 per cent of the Community's
output. Sheep contribute more to the U. K. IS agricul tural revenue
than in other member states, but this is still only 4 per cent.
Sheep farming systems are very different from the rest of
the EEC. In general they are larger units running an average 380
sheep. Costs tend to be high (Nix, 1979; Brabyn, 1978) though
productivity is higher than the other countries; this results from
specialisation of production which is based on the interdependency
of hill and lowland flocks. Under this system the hill regions
breed hardy sheep which are crossed with larger, upland rams:
the sheep produced from the cros sings a re sent to intermedia te
regions where they are crossed with meat-strain rams, to produce
slaughter lambs. These lambs are fattened on the lowlands prior
to slaughter (Lavercombe. i978).
The specialisation has origins in traditional agriculture,
and has been greatly encouraged by the granting of direct aid per
animal kept in mountain or hill areas (a system which ha s been
replaced with the similar EEC policy on less-favoured regions).
The financial assistance tends to increase the turn-off from the
hills and effectively subsidies the lambs to lowland fatteners;
it also reinforces the specialisation in production of grass-lamb
for slaughter in summer and autumn (Whitby, 1977). Specialisa
tion has been further encouraged by the payment of a Guaranteed
price which eliminates the risk of a drop in income and provides
Ii ttle incentive for out-of- sea son produc tion (HMSO Fa t- Sheep
Guarantee Scheme: Annual). This scheme has been replaced by
Deficiency Payments which are, however, intended to smooth
produc tion in the future (MLC, 1981).
13.
14.
The sheep kept are mainly dual purpose meat and wool breeds.
There has been some regional concentration with a reduction in sheep
numbers in the East, and an increase in numbers in the rough grazing,
mountain areas of Scotland, Wales and north-west England. The shift
occurred as cereal and beef production was expanded in the lowlands
(Philpott and Edwards, 1969; MLC, 1978).
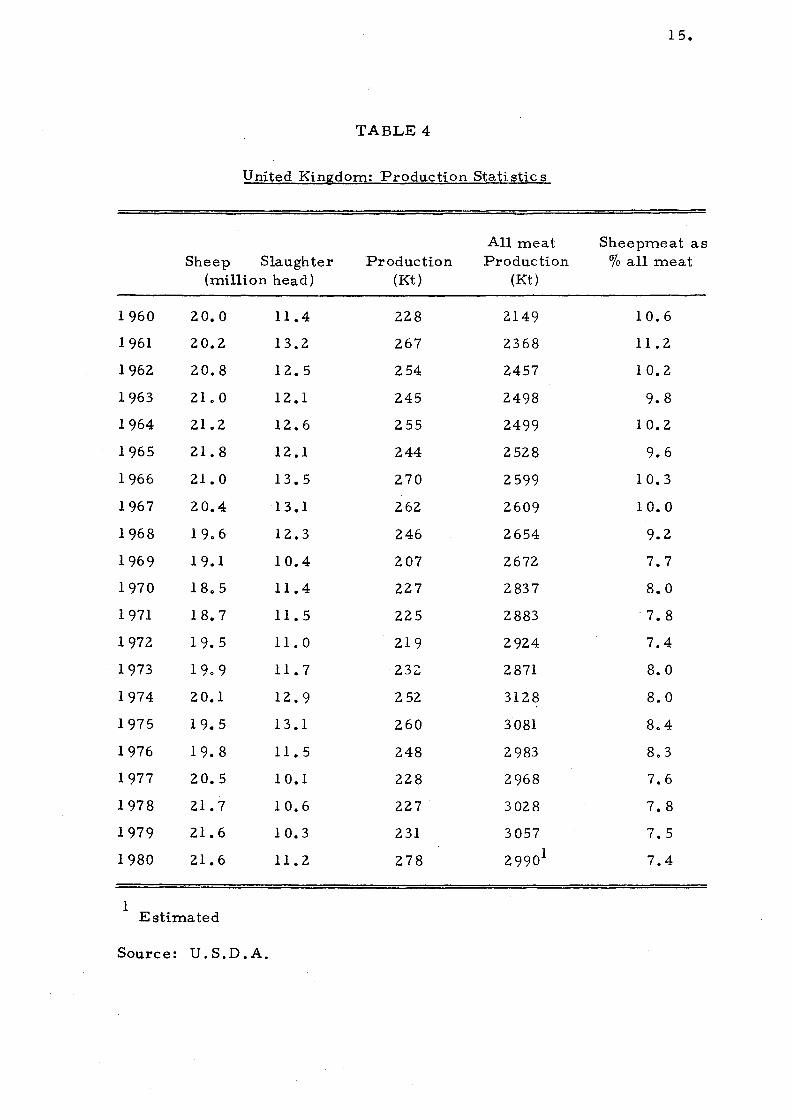
Sheep numbers have fallen from 25 million earlier in the century
to the current level of 20 million, around which they have fluctuated,
but shown no distinct trend (Table 4). Number s have been most stable
in Scotland, which has 7 million head, as the land is only suitable for
sheep grazing (W. of Scot. Ago ColI. 1977,1978).
The largest slaughterings of lamb take place May - October, with
10-11 million slaughtered annually, at an average carcass weight of
20 kg.
Production of sheep meat peaked in 1961 at 267 Kt and again in
1980 at 278 Kt following the introduction of the Sheepmeat Regime.
As with sheep numbers whilst varying from year to year production
has shown no significant trend, despite the increases in guaranteed
price over the same period. The industry therefore appears to be
stable, and until 1980 no significant change was expe cted in either the
size of the breeding flock, or production (Wragg, 1978). However, the
higher prices under the Deficiency Payment scheme are likely to provide
producer s with the incentive to expand (MLC, 1981).
Government policy is not expected to give any greater direct
encouragement to sheepmeat production, though aid to less-favoured
regions could expand output there and allow greater cereal and beef
output elsewhere.
Projections for output to 1985 are for a slight inc rease in pro
duction to 270 Kt (FAO, 1979; MLC, 1979). More recent projections
15.
TABLE 4
United Kingdom: Production Statistics
All meat Sheepmeat as Sheep Slaughter Production Production % all meat
(million head) (Kt) (Kt)
1960 20.0 11.4 228 2149 10.6
1961 20.2 13.2 267 2368 11.2
1962 20.8 12.5 254 2457 10.2
1963 21. 0 12.1 245 2498 9.8
1964 21.2 12.6 255 2499 10.2
1965 21. 8 12.1 244 2528 9.6
1966 21. 0 13.5 270 2599 10.3
1967 20.4 13.1 262 2609 10.0
1968 19.6 12.3 246 2654 9.2
1969 19.1 10.4 207 2672 7.7
1970 18.5 11.4 227 2837 8.0
1971 18.7 11.5 225 2883 7.8
1972 19.5 11. 0 219 2924 7.4
1973 19.9 11.7 232 2871 8.0
1974 20.1 12.9 252 3128 8.0
1975 19.5 13.1 260 3081 8.4
1976 19.8 11.5 248 2983 8.3
1977 20.5 10.1 228 2968 7.6
1978 21. 7 10.6 227 3028 7.8
1979 21. 6 10.3 231 3057 7.5
1980 21. 6 11. 2 278 29901 7.4
1 Estimated
Source: U.S.D.A.
16.
(MLC, 1981) suggest that output c:;:ould be around 5 per cent higher than
this, at 290 Kt, because of the higher support prices.
2.2 Consumption
The main features of consumption of sheepmeats in the U.K. are:
(1) the large quantities (both total and per capita) purchased, com
pared to other EEC countries. The U. K. accounts for 52 per
cent of EEC consumption though thi s share has declined from
74 per cent in 1960.
(ii) the rapid decline in the market through the 1970's.
The U. K. is one of the world's main meat-consuming countries,
with a per capita demand of 75 kg (Table 5). The market is dominated
by beef, which accounts for over a third of consumption. There has
been a dramatic growth in poultry-meat consumption as its price has
fallen relative to other meats. Sheepmeat is eaten as a substantial
and regular part of the diet, though its share of total consumption has
fallen from 16 per cent to 10 per cent since 1960 (Table 5).
The U.K. was one of the world's major sheepmeat eating countries
with a per capita demand of 17 kg in the 1930-50's; by 1960 this had
fallen to 11 kg. Over the period 1960- 80 a further decline of 36 per
cent left consumption at 7 kg in 1980.
Total consumption over the same period declined from 604 Kt to
410 Kt - despite an annual population increase of 0.4 per cent and a
total population of 56 million in 1980.
Thus, there has been a drastic change in the pattern of demand
for sheepmeats. The type of meat demanded has also changed, away
from mutton, to lamb which now accounts for 86 per cent of the sheep
meat eaten. Consumer preference is still for fre sh meat, rather than

17.
TABLE 5
United Kinjidom: Consumption Statistics
Population Sheepmeat Consumption n
Fer Capita cons Sheepmeat as (million) Total (Kt) Per Capita (kg) all meat (kg) o/c all meat
1960 52.3 604 11.5 71. 6 16
1961 52.8 625 11.8 73.1 16
1962 53.2 617 11.6 75.7 15
1963 53. 5 590 11.0 75.4 14
1964 53.8 599 11.1 74.6 15
1965 54.2 581 10.7 74.7 14
1966 54.5 594 10.9 74.2 14
1967 54.8 602 11. 0 74.8 14
1968 55.0 591 10.7 74.9 14
1969 55.2 555 10.0 76.1 13
1970 55.4 547 9.9 76.2 13
1971 55.6 575 10.3 77.4 13
1972 55.7 531 9.5 77.3 12
1973 55.9 472 8.4 72.6 11
1974 55.9 441 7.9 74.5 10
1975 55.9 475 8.5 73.5 11
1976 55.9 438 7.8 71.4 13
1977 55.8 400 7.2 72.2 10
1978 55.8 403 7.3 73.8 10
1979 55.8 404 6.7 75.7 9
1980 55.8 434 6.4 76.3 9
Source: U .S.D.A.
18.
frozen imports, which is reflected in the price differences. Demand
is also seasonal, with most purchases of domestic lamb occuring April -
September, when supplies are greatest (Brown, 1959).
Much has been written on demand for me at in the U. K. Bansbeck
(1976) reviews the published material according to whether it deals with
demand analysis, consumer attitudes to meat, the structural, techno
logical and institutional factors affecting meat demand, or forecasts
and projections of the demand for meat.
The majority of the studies which analyse demand for meat,
determine the main factors affecting consumption or price levels, using
regre ssion-analysi s. There is a wide variation in time periods,
estimation procedures and level of market (i. e. wholesale or retail),
but most use data derived from the annual National Food Survey.
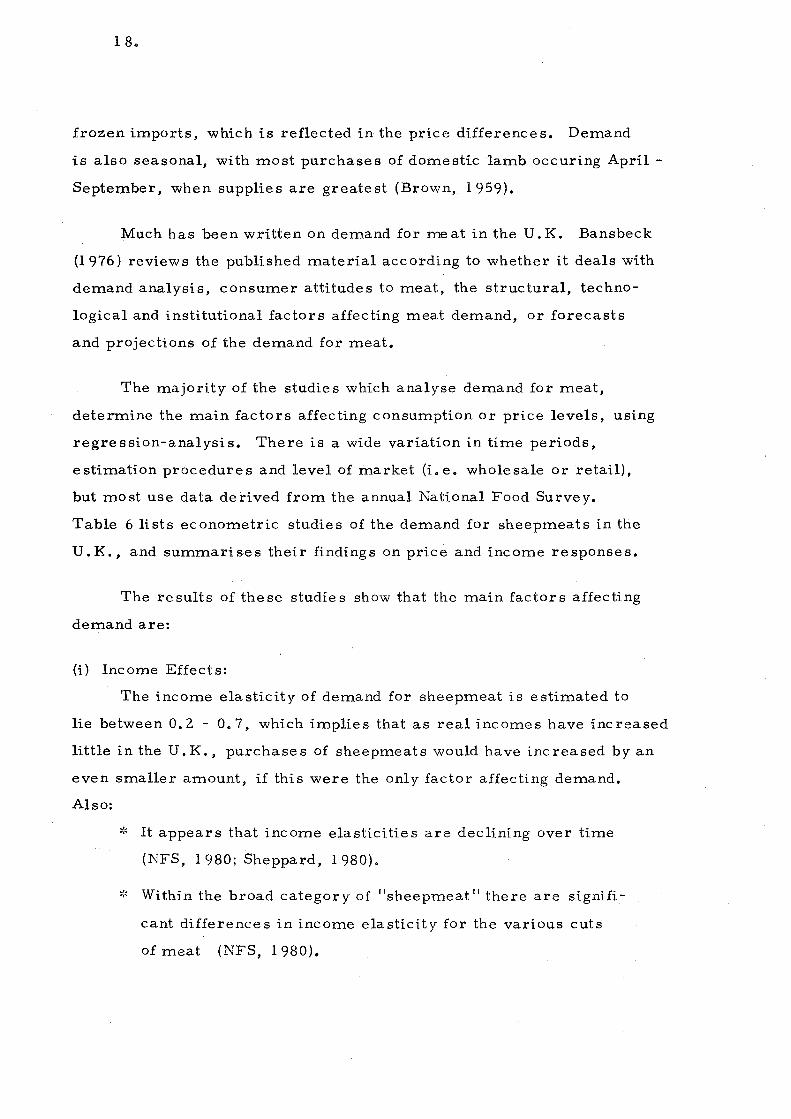
Table 6 lists econometric studies of the demand for sheepmeats in the
U.K., and summarises their findings on price and income responses.
The re suits of the se studie s show that the main factor s affecting
demand are:
(1) Income Effects:
The income elasticity of demand for sheepmeat is estimated to
lie between 0.2 - 0.7, which implies that as real incomes have increased
little in the U. K .• purchase s of sheepmeats would have inc rea sed by an
even smaller amount, if this were the only factor affecting demand.
Also:
':' It appears that income elasticities are declining over time
(NFS, 1980; Sheppard, 1980).
':' Within the broad category of "sheepmeat" there are signifi
cant differences in income elasticity for the various cuts
of meat (NFS, 1980).
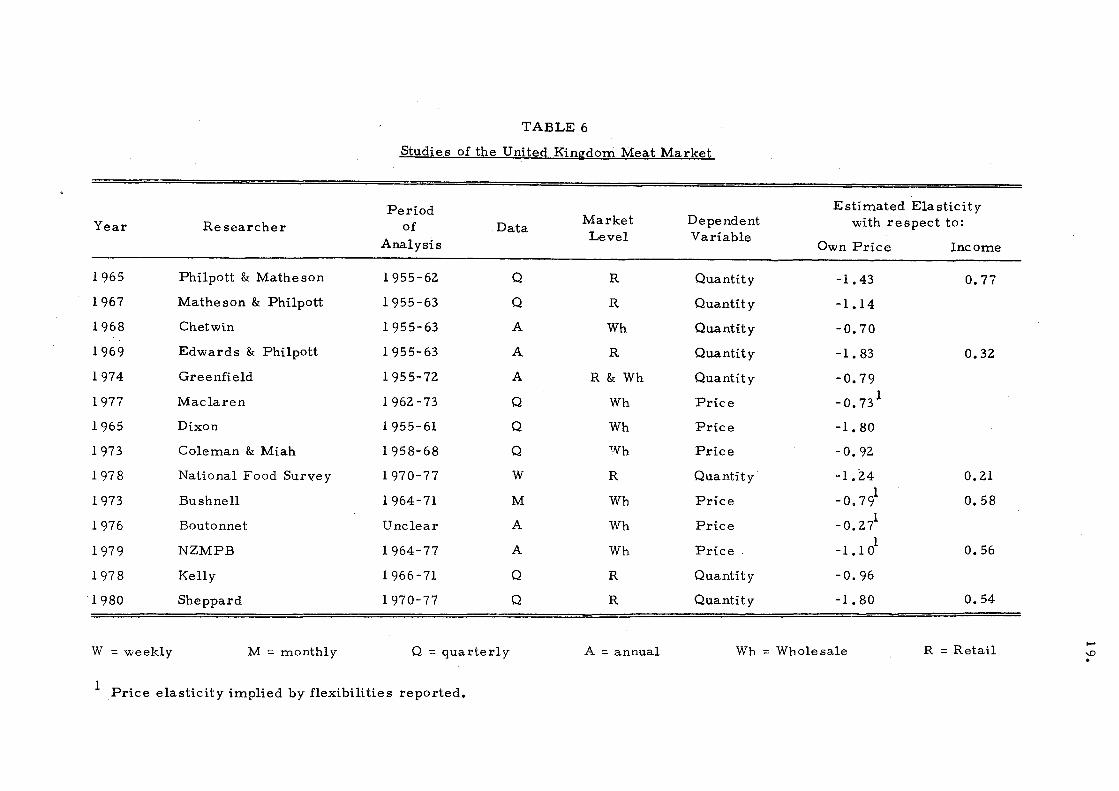
TABLE 6
Studies of the United Kingdom Meat Market
Period Estimated Elasticity
Year Researcher of Data Market Dependent with respect to:
Analysis Level Variable
Own Price Income
1965 Philpott & Mathe son 1955-62 Q R Quantity -1.43 0.77
1967 Mathe son & Philpott 1955-63 Q R Quantity -1.14
1968 Chetwin 1955-63 A Wh Quantity - 0.70
1969 Edwards & Philpott 1955-63 A R Quantity -1.83 0.32
1974 Greenfield 1955-72 A R & Wh Quantity -0.79
1977 Maclaren 1962 -73 Q Wh Price -0.731
1965 Dixon 1955-61 Q Wh Price -1.80
1973 Coleman & Miah 1958-68 Q 1Vh Price - 0.92
1978 National Food Survey 1970-77 W R Quantity -1.24 0.21
1973 Bushnell 1964-71 M Wh Price -0.791
0,58
1976 Boutonnet Unclear A Wh Price -0.271
1979 NZMPB 1964-77 A Wh Price -1 .1 01
0.56
1978 Kelly 1966-71 Q R Quantity -0.96
1980 Sheppard 1970-77 Q R Quantity -1.80 0.54
R = Retail ....
W = weekly M = monthly Q = quarterly A = annual Wh = Wholesale -.D . 1 Price elasticity implied by flexibilities reported.
20.
* There are wide regional differences in income elasticities
(NFS, 1980), with higher elasticities in the North than in
the South of the U. K.
'!< The qualit y component of purchase s increa se s as incomes
rise, hence there is greater demand for lamb than for
mutton (Hamid Miah, 1976).
(ii) Direct-Price Effects:
There has been an increase in interest in the price effects on
purchases in recent years, partly as a result of the sharper price
fluctuations, and partly because the income-effect on consumption is
dec rea si ng.
The studies show little agreement on the effect of lamb and mutton
prices on demand with estimates of own-price elasticities ranging from
-0.2 to -2. O. Estimates were consistently lower for sheepmeats than
for other meats.
Direct price elasticities appeared to be declining according to
studies using pre-1975 data; more recent work suggests that response
to price changes is increasing again (Sheppard, 1980).
(iii) Cross-Price Effects:
Mutton and lamb in the U. K. are thought to be substitute s for the
other meats - beef, pork and poultry. Measures of the extent of sub
stitutability are captured in the cross-price elasticity of demand.
However, there appear s to be no strong competition between sheepmeats
and other meats. All estimates of cross-price elasticities have been
extremely low, and rarely significant, though as with own-price effects
it appears that consumers are becoming more price-cons.cious and
beef and poultr y prices are beginning to affect mutton and lamb demand.

21.
(iv) Population Effects:
As the population growth rate in the U. K. is low, it has little
effect on change s in total consumption though given the large population,
a change in per capita demand has a large effect on total dema~d. Other
population effects (age patterns, urbanisation, employment (MLC, 1981»
are implicitly accounted for in the income-ela sticit y estimate s which are
based on time-series analysis.
(v) Other Factors:
Polic y, institutional and structural factors ar e usually referred to
qualitatively, but rarely quantified in studies. Attempts have been made
to estimate the effects of polic y alternative s on sheepmeat demand, usually
through changes in price (Kelly, 1978; Boutonnet, 1977; Sheppard, 1980).
Other factors such as freezer ownership and changing consumption patterns
are thought to be more important now than in the 1960' s (Bansback, 1977;
Jones, 1979), but are accounted for implicitly, or by including a time-
trend variable.
In conclusion, it appears from the studies that own price and income
effects are the most important in determining sheepmeat demand. It
seems that the retail price elasticity is increasing, and that the income
elasticity is falling. This suggests that mutton and lamb are becoming
inferior goods, and that as prices rise, consumers respond more to price
changes.
The outlook for consumption depends on the above factors, and on
the effects of the EEC Sheepmeat Regime, but it is generally agreed that
sheepmeat consumption will continue to decline. Earlier forecasts (FAO,
1979; Jones, 1977) predicted levels of 380-410 Kt in 1985. More recent
estimates (MLC, 1981) are somewhat lower, at 370-390 Kt.

22.
2.3 Prices
Producer returns in the U. K. were guaranteed by the U . K.
Government up to 1980. Prices rose from £10. 9/cwt in 1960 to £50/
cwt in 1977. The greate st increase was in 1972, and only small defi
cienc y payments have been made since. Since October 1980, producer
price s have been guaranteed by the EEC (FE OGA) at considerably higher
levels (Volans, 1981).
Producer-prices are analysed by Daniels and Savin (1977), Chetwin
(1969), MLC (1978), and show clear seasonal trends. As supplies of
domestic lamb decline, prices rise to peak when the new seasons lamb
arrives on the market. The seasonal pattern appears to be decreasing
(MLC, 1978), as the effect of U. K. I S exports to France evens out price
fluctuations. The peak of domestic production is also coming earlier
in the season, as the EEC price incentives take effect.
Price s for imported sheepmeats ~e specially frozen lamb) are
heavily discounted against fresh domestic supply (NZMPB, 1977). The
seasonal imports offset shortages of domestic supply, so command the
highest prices in December-April, before the new seasons 1 lamb comes
on to the market. Imported lamb and Scotch beef prices tend to move
together, but English beef is generally higher priced than dome sHc lamb.
Further analysis of wholesale prices can be found in Chetwin (1969), Sault
(1964), Taylor (1960), Bushnell (1973), Philpott (1969), and Maclaren
(1977 ).
As in other EEC countries, imports from non-member countries
face a 10 per cent tariff, (reduced from 20 per cent in 1980) which
effectively rai se s the retail price to the consumer (though exporter s
contend that it lowers the returns to the producer). U.K. prices are
c onsi derably lower than those in othe r member - state s, except for
Ireland whose price s tend to move in hne with Smithfield. U. K. price s

23.
were 50 per cent below those in France in 1968, but since 1976, the
gap has narrowed somewhat. Producer prices should be harmonised
by 1984/85, but the gap between U. K. and other EEC market prices
will remain (Blyth, 1981).
2.4.1 Exports
As Table 7 shows, exports from the U. K. have grown considerably,
reaching around 40 Kt by 1980 (which is some 20 per cent of domestic
production). The trade consists mainly of fresh-lamb sales to other
EEC countries, and results from the large, but decreasing price dif
ferentials (Volans, 1975).
Around 4 Kt per year is exported to non-EEC countries, but the
majority of U. K. exports have gone to France, when their import
regulations permitted (see Section 3). Since the advent of the EEC
Sheepmeat Regime in 1980, and the application of a Clawback Tax
(Blyth, 1981), exports to EEC countries have been at reduced levels.
Moreover, the strength of the £ sterling against the French franc,
discouraged exports, resulting in heavier supplies on the domestic
market.
The outlook for U.K. exports is uncertain, depending, among
other things, on the future arrangements of the Sheepmeat Regime, the
strength of the £ sterling and opportunitie s in the U. K. market (MLC,
1981 ).
2.4.2 Imports
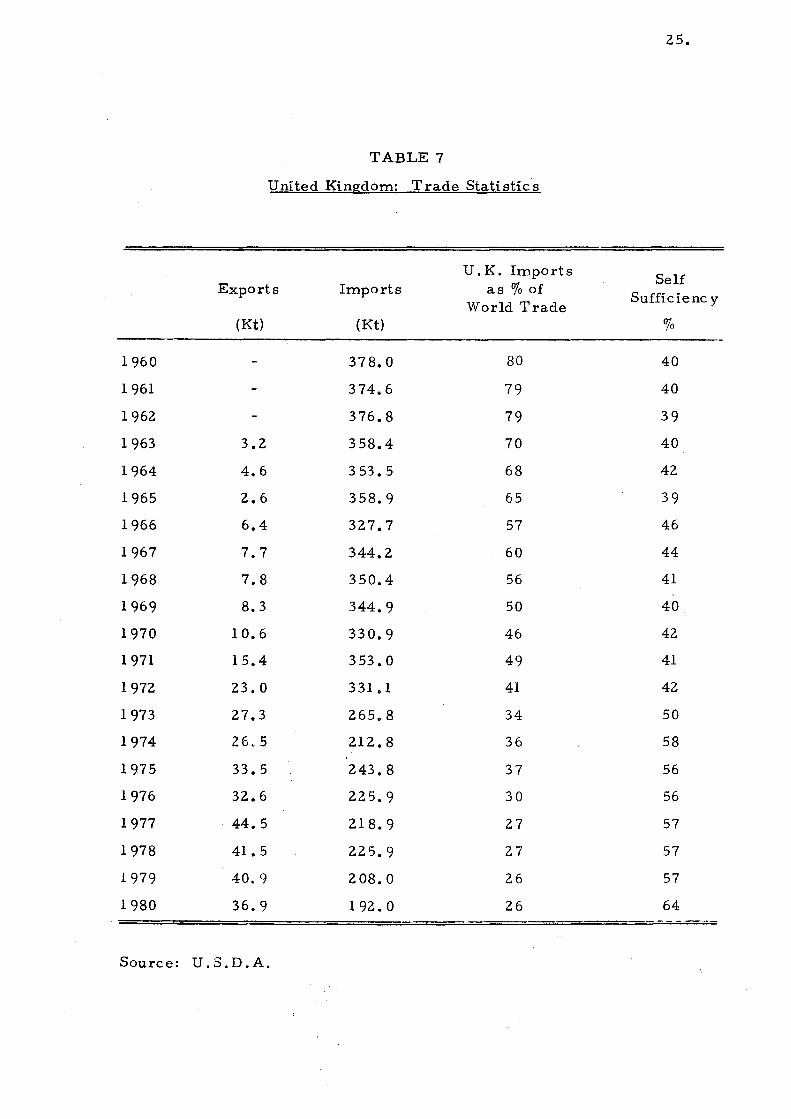
Despite its large domestic production, the U.K. is dE;!pendent on
overseas supply for nearly 50 per cent of consumption (Table 7). This
depe nd enc e is declining as consumption falls (Figure 1) sel£- su££icienc y
rose from 40 per cent in 1960 to 64 per cent in 1980.

24.
The U. K. is still the largest sheepmeat importer in the world;
its imports accounted for 80 per cent of world trade in the 1960's but
only 26 per cent in 1980 (Table 7). The reduction has been caused by
an increase in world trade between other countries, as well as a
decrease in U. K. imports. U. K. imports have declined from 1960-80
by 40 per cent 1. e. from 378 Kt in 1960 to 220 Kt in 1980, a decline
of 2 per cent per annum. As consumption has also fallen, imports
still form a major part of total supply. The U. K; is by far the most
important trader in the EEC, and in 1980 imported 67 per cent of
total EEC sheepmeat imports (thi s has declined, from 75 per cent
in 1975). Imports of fresh and chilled lamb (mainly from Ireland)
coincide closely with production of domestic lamb, and is seen by
the consumer as a similar product: it therefore compete s directly
with domestic supply. This trade has virtually ceased, however,
since 1974.
Frozen imports from the southern hemisphere arrive in the
U. K. when domestic production is low, so act as a complement,
encouraging year - round purc hases. British consumer s gain from
the seasonal production in both regi/0ns and the trade is traditionally
important for producers in both areas. The U. K. still accounts for
40 per cent of the World's lamb trade.
N. Z. is responsible for 95 per cent of imports, which consists
mainly of lamb. and Australia for the other 5 per cent, which is
mainly mutton. Up to 1968 Argentina supplied up to 15 per cent of
imports; this trade has ceased for health reasons - and the small
trade with Ireland has been directed to more profitable EEC markets
(Table 8).
The composition of imports has changed. Frozen mutton was
purchased in the 1960's, from the smaller suppliers. As incomes
have risen, higher quality meat is purchased and the majority of
imports is now lamb (200 Kt), from N.Z.
25.
TABLE 7
United Kingdom: Trade Statistics
U. K. Imports Self
Exports Imports as % of Suffic ienc y
World Trade (Kt) (Kt) %
1960 378.0 80 40
1961 374.6 79 40
1962 376.8 79 39
1963 3.2 358.4 70 40
1964 4.6 353.5 68 42
1965 2.6 358.9 65 39
1966 6.4 327.7 57 46
1967 7.7 344.2 60 44
1968 7.8 350.4 56 41
1969 8.3 344.9 50 40
1970 10.6 330.9 46 42
1971 15.4 353.0 49 41
1972 23.0 331.1 41 42
1973 27.3 265.8 34 50
1974 26.5 212.8 36 58
1975 33.5 243.8 37 56
1976 32.6 225.9 30 56
1977 . 44.5 218.9 27 57
1978 41. 5 225.9 27 57
1979 40.9 208.0 26 57
1980 36.9 192.0 26 64
Source: U .S.D.A.

26.
TABLE 8
U ni ted' Kingdom: Im9orts, by: Source
(Kt)
N.Z. Australia Other 1
Total
Weight % Weight % Weight % Imports
1960 305 81 28 7 45 12 378
1961 294 78 27 7 55 15 375
1962 296 78 19 5 62 17 377
1963 289 81 29 8 38 11 358
1964 297 84 29 8 30 8 353
1965 299 84 30 9 28 7 357
1966 266 85 12 4 35 11 312
1967 315 88 10 3 33 9 358
1968 318 91 18 5 14 4 350
1969 317 89 28 8 10 3 355
1970 294 89 34 10 3 1 331
1971 319 90 25 7 9 3 353
1972 289 87 27 8 15 5 331
1973 244 91 16 6 7 3 267
1974 204 96 8 4 1 213
1975 234 96 8 3 2 1 244
1976 214 95 12 5 226
1977 213 96 5 4 1 219
1978 214 95 12 5 226
1979 200 96 8 4 208
1980 184 96 5 3 3 1 192
Source: ABS, NZMPB
1 Mainly Argentina to 1968: also Ireland.
FIGURE 1
U. K.: Sheepmeat market trends, 1960-80
Kt i 700 j
'I i
600
500
400
300
200 I
100..!
I ---r---r---r--- --.-~--. ,-- ---I
1960 65 1970 75
, Consumption
Production
Imports
1980
N -J

28.
The contraction of the market has been borne by all the
suppliers; N.Z.'s expot"ts fell from 300 Kt in 1960 to 200 Kt in
1980; Australia's exports fell by half, to 12 Kt. The se two have
maintained their market-shares, whilst supplies from others
have virtually ceased (Table 8).
For N. Z., the U.K. is still its major market, despite
attempts to diversify sales of lamb to other markets. Develop
ments in the U.K. in terms of either prices or import volumes
are of great significance, therefore, to N. Z.
There is still a small trade in live sheep from Ireland,
of 0.5 million head per annum mainly for breeding purposes.
As the U. K. is such an important market in terms of world
sheepmeat trade, prices at Smithfield have the effect of determin
ing prices elsewhere in the world (Meat Producer, Vol. 8 (1),
1979), though recently events in other markets (e. g. Russia, Iran)
ha ve had an effect on the U. K. import pric e.
The outlook for imports (FAO, 1979; MLC, 1981) is for a
further slight decline, withan increase in domestic output caused by
rising prices under the EEC Sheepmeat Regime and a further
decline in consumption. Exports may also increase (MLC, 1981)
so net imports will be down to 140-150 Kt by 1985, with the majority
supplied by N. Z.
Despite this decline, the U.K. will continue to be the world's
largest sheepmeat importer, and N. Z. 's main customer for some
time to come.

3. FRANCE
3.1 Production
France is the EEC's second largest sheepmeat producer, produc
ing 25 per cent of the total supply. Even so, sheep farming is not of
great importance in France, contributing 2 per cent of total agricultural
revenue and less than 3 per cent of total meat production.
However, sheep numbers have increased over the period 1960- 80 from
8 to 11 million, and sheepmeat production has increased over 60 per
cent from 114Kt to 175 Kt (Table 9).
Sheep are produced both for meat and milk in France, according
to the regional climate. Meat is the main product for which sheep are
kept, but in the Massif Central, and parts of South East France they are
kept mainly for milk. Charlet (1973) discusses the regional character
istic s and trends in sheep farming. There has been an increase in sheep
numbers in the South West, which was traditionally associated with the
production of beef and dairy products; the various enterprises are now
run as complements (CEC, 1973). Sheep folding systems have developed
on these farms, which are usually small units (MLC, 1977). On the
larger units the "open-air" system predominates, which is similar to
the U . K. lowland systems. Various other management methods are
common; these are discussed in detail by Kelly (1977,1978); SCEES (1975),
IFOCAP (1978); CEC (1973), and OECD (1980).
Sheep farming is becoming concentrated in marginal agricultural
areas: 75 per cent of the flock are in regions covered by the EEC Directive
on less-favoured areas, so though there are already a few specific aids
to sheep farmer s (see CEC, 1977; Le Bihan, 1973; Mini st~re de l'Agriculture,
1970) the y also benefit from regional support measure s. Even if market
prices were to fall substantially under the Common Sheepmeat Regime,
it is unlikely that production would decline, as provision is made for
29.

3 O.
paying a premium to high cost producers, and giving income support.
F AO (1979) projections to 1985 are for an increa se in sheep
numbers to 13 -14 million, but due to lower offtake rates domestic
production is projected to be similar to 1980 levels of 152 -163 Kt
(which excludes the slaughter of live imports). More recent projections
(MLC, 1981; Boutonnet, 1981) take into account the effects of the EEC
Sheepmeat Regime, and predict a higher output of 170 Kt by 1984/85,
but that thi s will decline to 160 Kt by 1990.
3.2 Consumption
Though per capita consumption of all meats is high (104 kg), Table
10 show s that sheepmeat consumption is relatively small at 3.5 kg.
However, consumption of all types of meat, including mutton and lamb,
increased 50 per cent in 1960-80, so sheepmeat is maintaining its mar
ket share. As the population is some 54 million, total consumption
is large, at 210 Kt. With increasing per capita consumption, and a
population growth rate of 0.6 per cent, total sheepmeat consumption
increased 93 per cent in 1960- 80.
The general requirement is for lean meat from young lambs; in
urban areas even lighter carcasses are preferred, as lamb is a luxury
meat and consumption is concentrated in these high-income areas.
However, at traditional festhral times lamb is consumed by a large
proportion of the population. Mutton is consumed on a more regular
basis by some migrant groups, particularly those from North Africa
(MLC, 1977; Farmers Weekly, 7.3.80).
Apart from these traditional attitudes influencing consumption,
regional variations are marked (MLC, 1977; Kelly, 1978), and the
seasonal variation in demand is even greater than in the U. K. Several
econometric studies have attempted to estimate the strength of price
31.
TABLE 9
France: Produc tion Stati stic s
1,2 All meat Sheepmeat as Sheep Slaughter Production Production % all meat
(000 head) (Kt) (Kt)
1960 8,942 6,870 114.0 3,589 3.1
1961 9,063 6,750 112.0 3,760 2.9
1962 8,924 6,570 109.0 3,921 2.7
1963 8,945 5,908 99.4 3,859 2.5
1964 8,626 6,119 104.9 3,850 2.7
1965 8,821 6,567 112.9 4,020 2.8
1966 9,056 6,889 118.5 4,100 2.8
1967 9,186 7,023 121.0 4,339 2.7
1968 9,510 6,788 119.6 4,437 2.6
1969 9,794 6,583 116.5 4,285 2.7
1970 10,037 6,887 120.1 4,428 2.7
1971 10,239 7,564 132.3 4,639 2.8
1972 10,115 7,543 133.6 4,584 2.9
1973 10, 1 91 7,516 133.3 4,663 2.8
1974 10,104 7,713 137.6 5,11 0 2.6
1975 10, 509 7,611 138.5 5,102 2.7
1976 10,803 8,465 154.9 5,245 2.9
1977 11,046 8,273 133.5 5,151 2.9
1978 11 ,415 8,522 156.5 5,309 3.2
1979 11,640 9,194 171.0 5, 581 3.0
1980 11 , 739 9,500 1 75.0 5,750 3.0
Source: U. S. D. A.
1 Includes slaughter of live i.mports of approximately 8 Kt carcass equivalent.
2 Average dressed carcass weight of 18 kg.

32.
TABLE 10
France: Consumption Stati stic s
Population Sheepmeat Consumption
Per Capita cons' n
Sheepmeatas (tnillion) Total(Kt) Per Capita (kg) all meat (kg) % all meat
1960 45.6 118.0 2.6 76.9 3.3
1961 46.1 115.3 2.5 78.9 3.1
1962 46.9 115.5 2.4 80.3 3.0
1963 47.9 111. 0 2.3 80.9 2.8
1964 48.2 11 7.6 2.4 82.3 2.9
1965 48.7 126.9 2.6 84.4 3.0
1966 49.1 134.0 2.7 86.0 3.1
1967 49.5 138.0 2.8 88.7 3.1
1968 49.9 139.4 2.8 90.6 3.0
1969 50.3 144.2 2.9 90.7 3.1
1970 50.7 151.0 3.0 91. 9 3.2
1971 51.2 163.4 3.2 93.3 3.4
1972 51.7 172.6 3.3 94.4 3.5
1973 52.1 180.0 3.5 95.0 3.6
1974 52.5 181.1 3.5 97.5 3.5
1975 52.7 189.8 3. '6 99.3 3.6
1976 52.9 195.8 3.7 101.6 3.6
1977 53.1 199.2 3.7 104.3 3.5
1978 53.3 202.3 3.8 106.5 3.5
1979 53.5 207.5 3.9 108.9 3.6
1980 53.7 216.0 4.1 111. 0 3.7
Source: U.S.D.A.; U.N.
and income effects on sheepmeat demand (Kelly, 1978; Fouquet, 1970,
1973; Laloux, 1968; Faure, 1967; Boutonnet, 1976). All the studies
conclude that the main factor causing changes in per capita .demand for
mutton and lamb is level of incomes. The strong income effect shows
the luxury nature of the product; the income elasticity of demand is
estimated to be 0.6 for mutton (F AO, 1971), 0.9 - 1.15 for mutton and
lamb (CEC, 1977; Kelly, 1978) and 1.35 for lamb (Laloux, 1968).
33.
The studies suggest that price is not so important in determining
consumption, though estimates of the own-price elastici ty of demand all
lie between -0.57 and -0.87. Cross price elasticities were generally
extremely low, implying that prices of other meats have little effect on
sheepmeat consumption.
However, given an own-price elasticity of demand of -0.6, there
could be a marked increase in consumption after 1980 under the common
EEC sheepmeat p0lic y if market price s were harmoriised wi th other EEC
market prices. In theory this should happen by 1984/85 as other EEC
countries are given greater access to the market, and the increased
supplie s cause prices to fall substantially. In practice this is unlikely
to occur, as the mechanisms of the Regime protect the French market
from such declines in market price (Blyth, 1980).
Thus, any price changes will be minimal as the Intervention
system sets a base price in the market. Change s in income too, are
likely to have little effect during the 1980's, as real per capita incomes
are tending to stagnate, or even decline. FAO (1979) predict that sheep
meat consumption will therefore not change up to 1985, with a per capita
consumption of 3.7 - 3.8 kg, giving a t'::>tal demand of 200-210 Kt. Boutonnet,
1981 predicts, however, that imports will rise slightly and consumption
will be between 205-225 Kt in 1984/85, and rise to 230 Kt by 1990. The
MLC (1981) predict a much higher level of consumption, of 265 Kt in
1985 because of higher levels of French production.

34.
3.3 Prices
French lamb prices which are among the highest in the EEC, follow
their own seasonal pattern (NZMPB, 1978), with spring lamb fetching a
premium due to the special Easter demand when supplies are lowest; prices
then fall as supply becomes more plentiful. Lamb prices are not greatly
affected by the price of other meats, but tend to be higher than beef, and
even veal prices (MLC, Vol. 3, 1979).
Imports of fresh and chilled lamb command the same price as the
domestic prod.uct at retail and wholesale levels. It is difficult to estimate
the relationship between the price of frozen imports and fresh lamb, due
to import restrictions which allow only small quantities of frozen meat
to be sold in France. It appears though (NZMPB, 1978) to be discounted
heavily, especially at the wholesale level, against the fresh product.
Though consumer prices have in the past been about 65 per cent
higher than U. K. and Iri sh prices, the differenc e is narrowing gradually,
as greater trade takes place between them. However, whilst it is intended
that producer prices in the EEC will be harmonised by 1984/85, consumer
prices will continue to vary. French market prices cannot fall below a
base level set by the Intervention system, whereas U. K. market prices
are free to fluctuate above or below this level according to the market
si tuation.
3.4 Trade
Self- sufficienc y levels fell through the 1970 I s, as imports increased
from 4 Kt in 1960 to 46 Kt in 1978 (Table 11, Figure 2).
Only a small volume of imports are from non-EEC countries (6 Kt);
the main trade (90 per cent) comes from within the community, at 40-50 Kt
(Table 12). This trade consists of traditional exports from U.K., Ireland
and the Netherlands, and unexpectedly, since 1975 exports from Germany

35.
which is now France IS third largest supplier. Much of the German
lamb consists of re-exports from Ireland and the U.K., which avoids
French import controls on these countrie s I lamb. Sinc e the introduc
tion of the EEC Sheepmeat Regime, and the removal of controls, direct
trade with the U.K. has resumed, albeit at reduced levels, and the
indirect trade, through West Germany has virtually ceased.
Because of the lower seasonal variation in production, imported
lamb holds a different complementary relation to that in the U. K. Of
the three categories of trade, imported fresh and chilled lamb, and
animals imported live for fattening and slaughter, both tend to compete
directly with domestic production. But imported frozen lamb tends to
complement other sources of supply by appealing to the lower-income
consumer and supplying the catering and institutional market.
Most of the trade from EEC countries is in fresh and chilled meat;
third country trade is mainly frozen meat from Argentina, N. Z. and
Australia, though the U.K. appears to be taking over this market too
(Table 12). Live imports account for about a quarter of sheepmeat
imports and come from the Netherlands, West Germany and East
Europe (Boutonnet, 1981).
Despite the relationship between frozen imports and domestic
supply, imports of frozen sheepmeats have been severely limited by
quantitative re strictions since 1931 (HMSO, 1935). All third -country
imports up to 1980 faced the 20 per cent ad valorem tariff and a vari
able import-licence fee was payable, based on the difference between
the world price and the French Ilthreshoid II price for fresh and chilled
lamb (MLC, 1977).
In 1978, a trading agreement was made with Ireland to regulate
trade between them as a preliminary move towards free trade under
the CAP (Kelly, 1978; Wood, 1979). To regulate trade with N. Z. a
36.
TABLE 11
France: Trade in Sheepmeats
Total Imports Sel£- sufficienc y Kt 0/0
1960 4 97
1961 5 97
1962 7 95
1963 12 89
1964 13 88
1965 1 5 89
1966 16 87
1967 17 86
1968 20 84
1969 28 77
1970 31 77
1971 31 80
1972 39 75
1973 47 71
1974 44 73
1975 52 69
1976 42 75
1977 47 77
1978 46 77
1979 42 81
1980 38 83
Source: U.S.D..A.

TABLE 12
France: Trade in She!i:lilroeats
lm:!;lorts l!~ So~rce (Kt: Per cent)
Year U.K. Netherlands W. Germany Ireland Argentina N.Z. Australia Belgium 1
Other'
9.0 Volume
1970 9.2 2.3 4.1 2.9 3.5
1971 11.6 9.9 2.6 2.5 2.1 0.2 1.1 0.01 2.3
1972 16.8 9.2 2.1 4.6 1.9 1.2 1.2 0.06 2.2
1973 25.1 8.3 1.8 4.8 2.3 1.1 0.3 0.01 2.4
1974 23.1 12.7 1.9 2.8 1.7 0.4 0.1 0.02 0.2
1975 25.3 14.2 5.4 2.6 2.1 0.7 0.04 0.06 0.1
1976 15.8 13.9 8.4 1.2 1.1 0.5 0.4 0.01 0.1
1977 19.3 14.0 7.9 1.8 1.1 1.3 0.4 0.4
1978 8.7 12.4 8.6 14.2 0.2 1.6 0.3
1979 4.4 12.9 8.9 12.9 0.2 2.5 0.2
1980 4.1 14.0 6.2 13.8 0.1
Year ~o Qf TQta.1 1970 30 30 13 11
1971 37 32
1972 43 23 12
1973 53 17 10
1974 52 29
1975 48 27 10
1976 37 33 19
1977 40 30 17
1978 19 26 18 31
1979 10 32 22 32
1980 11 44 16 42 ..., -.J
Source: EUROSTAT 1 Other = Italy, Spain, Hungary, Morrocco, China ( - ) =Jmports less than 10%, Or negligible volume
Kt ~
200 1 I
I 75 ~
150 1 12 5 ~
100
75
50
25
1960
FIGURE 2
France: Sheepmeat market trends, 1960-80
65 1970 75
Consumption
Imports
1980
\.>l 00 •

39.
partnership was set up between French and N. Z. producers, who formed
a company, FRANZIM', to act as the sole agent for N. Z. lamb and
mutton imports into France, under the global quota system (for details,
see MLC, 1977).
Following the introduction of the EEC Sheepmeat Regime, re stric
tions on imports from other EEC states were removed, and third-country
imports are controlled by the Voluntary Re straint Agreements and a
10 per cent import tariff.
However, imports have not increased rapidly, as the Clawback
Tax, and the strength of the £ sterling against the French franc have
discouraged EEC exporters.
The future of the import demand for sheepmeat relies largely on
the effects of the Sheepmeat Regime, and the effect that resulting price
changes have on supply and demand.
Various scenarios for the future have been presented by several
researchers (Brabyn, 1975; Boutonnet, 1976, 1981; IFOCAP, 1978;
Kelly, 1977, 1978; MLC, 1981), based on possible future market and
producer prices, changes in the mechanisms of the Regime and probable
values of the £ sterling. These studies conclude that trade will be
between 45- 55 Kt, by 1985, and ri se to 90 Kt by 1990.
F AO (1979) also estimate that the import demand in 1985 will be
50 Kt, which accounts for price-effects under a free (EEC) market.
The amount of this which non-EEC countries can expect to supply is
small. Increasing trade will take place with other EEC states, the
majori ty coming from the U. K., though the mechani sms of the CAP
prevent excessive imports from the U. K. being sold on French markets.
The main effect on third country suppliers, therefore, is the indirect
effects on the U. K. market. In general, the greater the volume of U. K.

40.
exports, the stronger is the U.K. domestic market, and the greater
is its ability to absorb third-country imports at reasonable prices.
There may, however, be opportunity for direct expansion of sales
in France, given adequate promotion and advertising, and the availa
bility of meat of a quality required by the French housewife.
4. IRELAND
4.1 Production
The sheep flock in Ireland has alwa ys been a small, but important
feature of agriculture, providing around £27 million a year (1980) or
3 percent of agriculture revenue.
Production is generally treated as a secondary enterprise on low
land farm.s; so there are many farmers who have sheep, but relatively
few specialise in sheep farming. The majority of the 2.5 million sheep
a:re in the counties Galway, Mayo, Roscommon and Wicklow - all areas
covered by the EEC Directive on less-favoured areas. This could have
important long-term effects, as production incentives are given to
farmers, to raise and support their incomes at common-market standards.
Sheepmeat production is not an important enterprise compared to other
meats (Table 13). The proportion has declined from 10 per cent to 4 per
cent over the period, as both beef and pork output rose substantially.
Since 1960 there have been considerable changes in the Irish sheep
flock (Riordan, 1981). Sheep number s have fallen from 3.5 million in
1960, to 2.5 million in 1980 (Table 13), though in anticipation of member
ship of the EEC, and subsequent acces s to larger markets, farmers
expanded sheep numbers after 1970 with Government assistance. However,
in the first year of Community membership (1974), slaughtering increased
in response to higher meat prices, and sheep numbers again fell, at 4 per
cent per annum up to 1980.
At the same time there were significant changes in both the location
and composition of the national flock. Lowland flock numbers fell, and
hill-flocks expanded - they virtually equalised by 1980. The breed com
position has changed in favour of the hill breeds such as Scottish Blackface,
Cheviots, and Leitrim. How much of this change can be attributed to the
41.
42.
impact of the Mountain Sheep Subsidy Scheme (1966) and later, the
EEC Livestock Headage Schemes is assessed elsewhere (Fingleton,
1978). Another factor determining the change has been the relatively
low and fluctuating returns from sheep farming: farmers have continued
to invest in other enterprises in the lowlands with more secure markets
covered by the CAP.
In the longer term, output could be doubled from the mountain
regions (IAI, 1977), whilst further expansion in the lowlands would be
at the expense of cattle or crops (Mosse, 1978). Currently the efficienc y
of production is lower in Ireland than in the U. K., but simil ar to France
(according to calculations made by Kelly, 1978). The move to hill-breeds
coupled with other regional problems, is causing a decline in productivity
(Fingleton, 1978).
However, sheepmeat production has not fallen greatly since 1960.
Slaughterings have been high, at around 1.6 million. There was a sharp
rise of 27.4 per cent in 1977/78 in response to demand from France,
but a fall in 1979. Production also rose in 1977/78 in response to higher
price s, then fell back to previous levels of 40 Kt, in 1979. Production
has fluctuated around this level since 1960, with a slight down-trend
(Table 13, Fig. 3).
Average carcass weights, at 27 kg, tend to be heavier than most
sheep producing countries; this is the type of meat required by the Irish
consumer, and is well-suited to the production systems prevailing in
mountain regions.
Changes in producer prices could have a considerable effect on
production: a study by Kelly (1978) looks at the long-term effects of
increasing prices resulting from the EEC. After 1977 sheepmeat should
have been freely-tradeable within the Community, but barriers still
existed up to 1980. To prevent unacceptably large changes in the system

43.
TABLE 13
Ireland: Production Statistic s
Sheep Slaughter Av. carcass Production of Sheepmeat as % ('000 head) weight (kg) Sheepmeat (Kt) all meat
1960 3,225 1,513 25 39.9 9.1
1961 3,107 1,398 26 37.2 7.2
1962 3,376 1,856 26 47.0 7.7
1963 3,333 1,911 26 47.9 9.3
1964 3,386 1,849 25 46.8 8.7
1965 3,456 1, 752 26 44.7 8.7
1966 3,464 1,943 25 48.5 8.8
1967 3,059 1,755 26 45.4 7.5
1968 2,852 1,697 26 44.1 7.7
1969 2,788 1,655 26 43.7 7.4
1970 2,836 1,484 27 39.7 6.8
1971 2,862 1,820 26 47.3 7.0
1972 2,835 1, 761 26 45.0 7.0
1973 2,845 1,690 26 43.3 7.3
1974 2, 711 1, 739 26 45.0 6.1
1975 2,633 1,832 25 46.3 5.3
1976 2,582 I, 504 26 39.7 5.8
1977 2,526 1,457 27 39.2 4.6
1978· 2,418 1,855 25 45.6 5.7
1979 2,359 1,602 24 39.1 4.6
1980 2,343 1,705 24 40.5 4.5
Source: U. S. D. A.

44.
an Agreement for trade with France was negotiated. This led to
higher prices in Ireland and increased export demand which stimulated
expansion in the short-term. Given this continuing financial incen
tive, and .structural re~adjustment, former output levels
could be ac hieved. As past production and stocking levels indicate
the potential for expansion exists and not necessarily at the expense
of other meat production, as it would be in hill areas which are only
suited to sheep farming (MLC, 1981). Under the EEC Sheepmeat
Regime a differential support-price mechanism operates which is
designed partially to give this incentive to Irish producers. This
Intervention system guarantees producers' returns at a relatively
high and increasing level (80 per cent of the French price in 1980/81),
and producer prices will be aligned with the considerably higher EEC
prices by 1984/85.
Projections for output in 1985 made by FAO (1979) estimate an
increase to 50 Kt. This implies a rather high growth rate of 5.8 per
cent per annum, though this is confirmed by Fingleton (1978). A
more recent projection made in the light of the prices set by the EEC
(Riordan, 1981) is somewhat lower than this, with estimated produc
tion of 32-38 Kt, in 1985 which is also below production levels in
1980.
4.2 Consumption
Trends in food consumption in Ireland for many years have been
towards a higher quality diet, rather than one providing a higher cal
orie intake. The trend has been towards animal products and away
from the staples of potatoes and vegetables.
Sheepmeats have always been an important part of the diet, and
per capita consumption is high at 11 kg, the highe st in the EEC
(Table 14). The population of Ireland is small (3 million) and growing
45.
at a rate of only. 02 per cent per annum. Hence, total consumption
of sheepmeats is relatively stable at around 32 Kt (Table 14).
Since Ireland joined the EEC in 1974, however, with rising
incomes consumption had started to rise slightly, peaking at 35 Kt
in 1975/76. Rising prices, though, have had a strong effect and in
the opposite direction, causing a steep drop in consumption after
1977. Levels in 1980 are virtuall y the same a s in 1960. An own
price elasticity of demand of -1.96 has been estimated (Riordan, 1981).
Compared to consumption of all meats, sheepmeat was important
(17 per cent in 1960), but as more beef and pork has been consumed,
the proportion has fallen to 10 pel cent in 1980 (Table 14). No estimates
of cross-price elasticities are available.
As mentioned above, demand for sheepmeat tends to incre;ase
as incomes rise; expenditure on mutton and lamb is greatest amongst
the upper income groups, though mutton is sti1l an inferior good.
Kelly (1978) cites income elasticities of demand which have
been calculated by several authors. The estimates showed that
the income elasticity of demand for sheepmeat is fairly constant
over time, and lies between 1.14 and 1.63. The studies which
differentiate between mutton and lamb show that the income elasti
city for mutton is well below unity, ranging from 0.4 to 0.65, whereas
that for lamb is greater than unity. This is evidence of the 'luxury'
nature of lamb as opposed to mutton, as increasing incomes lead
to more than proportionate increases in expenditure on lamb"
The outlook for sheepmea t consumption in Ireland is fairly
stable; current levels of total demand are likely to continue as the
effects of rising incomes and small increases in popula tion will
be off- set by rising price effects.

46.
TABLE 14
Ireland: Consumption Statistics
Population Sheepmeat Consumption
Sheepmeat as 0/0 (million) Per Capita (kg) 'I' otal (K t) all meat consumed
1960 2.84 10.6 29.8 17.0
1961 2.81 11.2 31. 7 16.9
1962 2.82 11.4 32.2 16.8
1963 2.84 11.1 31. 8 15.9
19"64 2.86 11.2 32.0 16.6
1965 2.87 10.8 30.5 15.0
1966 2.88 10.7 31.1 14.6
1967 2.90 11.0 32.0 14.6
1968 2.91 10. Q 31.4 14.0
1969 2.92 10.9 32.4 13.5
1970 2.95 10.8 32.8 13.0
1971 2.97 11.1 33.2 12.9
1972 3.01 10.9 33.2 12.7
1973 3.05 10.5 31. 6 12.3
1974 3.08 11.0 33.9 11. 9
1975 3.12 11.2 34.6 11.1
1976 3.16 10.5 32.4 10.8
1977 3.23 10.3 32.8 11.2
1978 3.27 9.5 30.4 10.1
1979 3.31 8.3 30.0 10.0
1980 3.37 7.8 26.0 10.3
Source: U. S. D. A., U. N.

47.
FAO (1979) project consumption to be 13-15 kg per head by
1985, given an income elasticity of 0.4. However, as the population
growth rate is actually Ie ss than the FAO figure of 1.2 per cent per
annum and because demand appears to be quite responsive to price
changes, per capita consumption is, and is likely to continue to be,
much lower than projected. A more recent study confirms this (Riordan,
1981 ): his prediction is for a 5 per cent decline in consumption from
1980, giving a per capita consumption of 7.4 kg by 1985, and a total
c 0nsumption of 18 Kt.
4.3 Trade
As self- sufficienc y has ranged from 112 per cent to 150 per cent
over the period (Table 15) a large proportion of production has been
available fo r export. Ireland is therefore the second large st exporter
in the EEC, although in terms of world trade, its share has declined
from 3 per cent to 1 per cent.
With consumption levels which are relatively stable, exports
fluctuate in line with production (Table 15, Fig. 3), and have varied
from 7 to 1 7 Kt ove r the period.
Prior to EEC entry, the most important measure to benefit Irish
agricultural exports was the Anglo-Irish Free Trade Area Agreement
made in 1966, which guaranteed unrestricted access to the U.K. market
for Irish store cattle and sheep. At the time, trade in live sheep with
the U.K. was important (details are given byMosse, 1978). It is not
likely to be SO in the future, as carcass exports have increased at the
expense of live sheep exports; for example, there was a 56 per cent
fall in live sheep trade in 1978, as carcass exports increased sharply.
During the 1960's exports were high, but steadily decreasing, as
production fell and consumption rose; exports fell even further in the
early 1970's and after Ireland joined the EEC.

48.
However, as EEC prices rose, a trading agreement between
France and Ireland was introduced in 1978 to prevent Irish sheepmeat
disrupting the French market. As a result of the bilateral deal, prices
to the producer rose and the difference between French and Irish
prices was only 12 per cent in 1980 compared to 45 per cent in 1976,
when Irish prices were roughly equal to U. K. prices.
France has always been cine of the main buyers; purchases by
Belgium/ Luxembourg, and Germany were important in the early 1970 I s
but have declined markedly (Table 16). Italy buys small quantities,
and Libya makes irregular, but often large, purchases.
Table 17 show s the importance of Iri sh expo-rts to each of the se
markets. Supplies were significant in Belgium/ Luxembourg, but they
now import from other suppliers. Imports into France have varied
widely: any change in their total imports is related to a change in imports
from Ireland. Libya, it seems, imports sheepmeat regularly, but only
buys from Ireland if the price is low. Irish supplies in other markets
are minimal, and possibly too small to affect trade flows or prices.
From the above scenario of production and consumption it appears
that Ireland has the potential to increase exports to the higher levels of
the mid 1960 I s (FAO, 1979; Riordan, 1981). Much of the trade (10-15 Kt)
is likely to be absorbed into other EEC states rather than be sold on the
lower-priced world markets.

TABLE 15
Ireland: Summary of the Sheepmeat Market
Production Consumption Carcass meat As % of production
Self-(Kt) (Kt)
trade Consumption Trade Sufficienc y
{Ktl .
% % % 1960 41 30 11 73 27 136 1961 37 31 6 84 16 119 1962 47 32 5 68 32 146 1963 48 31 17 64 36 154 1964 46 32 14 70 30 143
1965 44 31 13 71 29 142 1966 48 31 17 65 35 154
1967 45 32 13 72 28 140
1968 44 31 13 71 29 141
1969 43 32 11 75 25 134
1970 40 32 8 80 20 125
1971 47 33 14 71 29 142
1972 45 33 12 74 26 136
1973 43 32 11 75 25 134
1974 45 34 11 76 24 132
1975 46 35 11 77 23 138
1976 39 32 7 82 18 122
1977 37 32 5 87 13 112
1978 45 30 15 66 34 150
1979 39 30 13 81 19 123
1980 40 26 16 81 19 123
Sourc e: U. S • D . A. ~ -.0 .
FIGURE 3
Ireland: Sheepmeai Market Trc nds, 1960- 80
50
Kti I I
40
30 "--- Consumption
\ /
20
Exports
I
o ~ I
1960 65 1970 75 1980
U1 o •
51.
TABLE 16
Ireland: Shee12meat EX120rts (b~ de stination)
(1974-80){fonnes)
1974 1975 1976 1977 1978 1979 1980
Belgium/Lux. 5,084 4,769 2,548 1,884 86 777
France 3,555 3,139 1.163 1,971 14,600 12,800 13,908
Germany 1,057 1,018 377 412 239
Italy 10 323 309 137 569
U .. K. 1,120 1,847 508 978 365 200 62
Libya 634 2,024 756 3
Total 11,116 11 , 658 7,273 6,396 15,190 13,000 15, 555
Source: CSO
TABLE 17
Irish SUP121~ as Percentage of Countr~ls Imports
1974 1975 1976 1977 1978 1979 1980
% % 0/0 % % % %
Belgium/Lux. 63.0 50.0 21. 0 3.0
France 8.0 6.0 3.0 4.0 31.2 30.2
Germany 8.0 5.0 1.2 1.4
Italy 2.1 2.4 1.1 1.0
U.K. 0.5 0.6 0.1
Libya 48.0 100.0 58.0
Algeria 51. 0
Source: Table 16, and U.S.D.A.


5. ITALY
5.1 Production
Sheep farming is not an important enterprise in Italy, even though
it is the third largest producer in the EEC, producing 7 per cent of the
Community's sheepmeat.
In the 1920's Italy had a stock of over 12 million sheep, with a
large export trade in live sheep; sheep numbers have now fallen to
8 million, and have been stable over the period 1960- 80 (Table 18).
Most of the sheep are in the southern part of the country and the trend
is towards further concentration in these areas,.(Ferrara, 1972;
Kelly, 1977; Cupo, 1979). However, over-concentration has led to an
inflexible supply response, due to the absence of alternative enter
prises in these marginal farming regions. Unless sheepfarming
becomes more profitable, relative to othe r activities, it is unlikely
to expand into the main areas of cultivation in the North.
The southern regions, Sardinia, Sicily and the Peninsula, con
tain 90 per cent of the stock, but are all covered by the EEC Directive
on less-favoured regions; hence, any policies directed towards the
improvement of farm incomes include sheep farms. Otherwise, there
have been nO specific EEC aid towards sheep up to 1980, when the
CAP on sheepmeat was introduced. The Italian Government initiated
the Special Meat Project in 1975; designed for the sheep industry in
the Mezzogiorno region, it is intended to improve farm incomes, and
effect import saving (see Kelly, 1977; and Lancker, 1980, for further
details).
Several other measures have been proposed by IRVAM (a
market research organisation - see Agra Europe No, 868, 1980),
to improve productivity. In general there is room for improvement
53.

54.
TABLE 18
Ital~: Production Statistic s
She'ep Slaughter Sheepmeat 1
All meat Sheepmeat as % of ( 'OOO'h~ad} Production Production all meat
(Kt) {Kt} %
1960 8,343 4,816 40.0 1,300 3.0
1961 8,231 4,870 40.0 1,486 2.6
1962 8,065 5,079 42.0 1,573 2.6
1963 7,857 4,810 40.0 1,432 2.6
1964 7,762 5,009 41. 0 1,621 2.5
1965 7,866 4,622 38.0 1,765 2.1
1966 8,000 5,102 42.0 1,885 2.2
1967 8,212 5,398 44.0 1,928 2.2
1968 8,285 5,604 46.0 2,092 2.1
1969 8,206 6,014 50.0 2,185 2.2
1970 8,138 6,588 55.0 2,290 2.4
1971 7,948 6,678 54.0 2,314 2.3
1972 7,846 6,672 52.0 2,290 2.2
1973 7,770 6,280 50.0 2,514 1.9
1974 7,809 5,775 45.9 2,681 1.7
1975 7,995 5,935 49.3 2,669 1.8
1976 8,152 5,920 49.6 2,747 1.7
1977 8,445 5,825 50.3 2,9791 1.6
1978 8,694 5,765 49.9 3,128 1.6
1979 8,973 5,820 50.6 3,236 1.6
1980 8,400 5,915 51.5 3,2042
1.6
Source: U .S.D.A.
1 Production: includes slaughter of imported, live sheep, of 10-15 Kt {meat equivalent}.
2 Estimated
55.
in farm structure, education and training, and flock and grazing manage
ment, all of which are poor, compared to other EEC states. Unlike
the other state s though, the Italian sheep industr y isba sed on milk
production, with meat and wool as by-products (CEC, 1973). The
lambs are slaughtered before being weaned (at around 8 kg) as the
poor quality land is unable to support more grazing animals. Detailed
descriptions of sheep production systems are given by Bruno 1970;
Casu, 1971; Cianferoni, 1969; Cupo, 1979; and Kelly, 1977.
Production of other meats has increased at a faster rate than
sheepmeat production (Table 18): hence mutton, lamb and goat meat
comprise only 1. 5per cent of output. Nevertheless, sheepmeat pro
duction is rising 1.3 per cent per annum.
F AO (1979) projections to 1985 are for an increase in sheep
numbers to 10.5 - 11 million, heavier average carcass weights
of 9-10 kg, and increased production, at 50-60 Kt. In the light of
current trends, an output of 60 Kt of sheepmeat by 1985 would seem
reasonable but is not likely to increase further unless returns become
more attractive.
5.2 Consumption
Like other Mediterranean countries, meat consumption in Italy
is not high, but is increasing rapidly towards European levels, at
5 per cent per annum (Table 19). Over the period 1960-80, per capita
consumption rose from 31 kg to 6$· kg.
Per capita consumption of sheepmeats has also risen, but not
as quickly (2.4 per cent per annum), so is a declining proportion of
meat purchases, at around 2 per cent. Lamb and mutton per capita
consumption is only 1.2 kg. Reasons given for this low level are
that demand traditionally centre s around Easter and Chri stmas, when
prices are high (mutton and lamb are estimated to have an own-price

56.
TABLE 19
Ital~: Consum12tion Stati stic s
Population Sheepmeat Cons n
Consumption of Sheepmeat as (million) Total Per Capita all meat % all meat
(Kt) (kg) (kg per capita)
1960 49.6 40.0 0.8 31.6 2.5
1961 49.9 42.1 0.8 32.8 2.4
1962 50.2 44.6 0.9 35.7 2.5
1963 50.6 42.4 0.8 38.3 2.0
1964 51.1 44.3 0.8 40.4 1.9
1965 51. 5 42.3 0.8 42.4 1.8
1966 51. 9 46.8 0.8 45.9 1.7
1967 52.3 48.2 0.9 48.9 1.8
1968 52.9 51.3 1.0 50.0 2.0
1969 53.2 56.9 1.0 52.3 1.9
1970 53.6 62.1 1.1 56.6 1.9
1971 54.1 62.0 1.1 59.6 1.8
1972 54.4 62.0 1.1 61.2 1.7
1973 54.9 61.3 1.1 66.2 1.6
1974 55.4 52.1 0.9 65.3 1.3
1975 55.8 61.1 1.1 59.2 1.8
1976 56.2 63.6 1.1 60.2 1.8
1977 56.4 62.9 1.1 61. 6 1.7
1978 56.7 67.2 1.2 62.4 1.6
1979 56.9 70.4 1.2 62.9 1.9
1980 57.4 71.3 1.3 64.9 2.0
Source: UN; U.S.D.A.

57.
elasticity of -1.3 (Greenfield, 1974). Also, the taste of sheepmeat,
especially of imports which come from older sheep rather than the domestic
milk-fed lambs, is not what the Italians are used to, or prefer.
However, even with low per capita consumption, the population
level of 57 million (rising at 0.7 per cent per annum) give s a total
demand of 70 Kt, which domestic production is unable to supply.
Further increases in demand are likely as incomes rise, given that
the income elasticity of demand is 0.5 (F AO, 1976). Rising prices
could contain demand though, and projections to 1985 are for little
change in total consumption (FAO, 1979).
The pattern of meat retailing in Italy is different from that in
other EEC states: fresh meat, frozen meat, pork and horsemeat are
all sold in different shops (McClean and Pickard, 1978). Also, the
V. A. T. rate varies, according to the type of meat. Kelly '(1977)
concludes that any changes in the structure of retail trade to comply
with EEC standards would effect mutton and lamb sales more than
other meats. Sales of fresh and chilled sheepmeats would probably
increase, but sales of frozen meat would not.
This implie s that sale s from countrie s whic h export fre sh
carcasses to Italy could increase (e. g. Yugoslavia) at the expense
of frozen imports (e. g. from South America).
5.3 Trade
During the 1960's when Italy's sheep flock was stable, domestic
supply was sufficient to satisfy demand. Despite the steady expansion
in the national flock since 1972. self- sufficiency levels have dropped
to 71 per cent (Table 20) as consumption levels rose. The import
demand, with some fluctuations, rose to 20 Kt in 1980 (Table 20,
Fig. 4). The increase in imports has been wholly in sheepmeats
58.
not in live animals. If imports of live- sheep are taken into account
self- sufficienc yin 1979 slumped to 52 per cent (Agra Europe No. 863,
1980 ).
Imports (Table 21) have traditionally been from Eastern European
countries (especially Yugoslavia and Bulgaria) and these countries
have maintained regular sales to Italy. The increase in imports has
been supplied mainly from N.Z. who supplied 30 per cent of the import
market in 1978, with small quantities coming from Argentina, Urguguay
and the U. K.
For none of these countries is Italy a major market: however, in
its position as the EEC's second largest importer, long term develop
ments in the Common Sheepmeat Regime could alter the trade balance
with non-member countries, according to agreements made between
these countries and the EEC as a whole.
The outlook for the Italian market for sheepmeats is that it will
continue to be very small. Sheepmeat accounts for only 2 per cent of
the meat supply, whilst per capita consumption, at 1.2 kg, is low
compared to other countries. Domestic production falls short of
meeting even this low level of demand, and the deficit is growing.
As incomes rise, therefore, import demand is likely to increase
further, and imports are projected to be 25 Kt by 1985 (MLC, 1981).

59.
TABLE 20
ltal~: Shee~meat Imports
Imports of 1
Self-Sheepmeat sufficienc y
(Kt) %
1960 100
1961 2.1 95
1962 2.6 94
1963 2.4 94
1964 3.3 92
1965 4.3 89
1966 4.8 81
1967 4.3 91
1968 5.3 89
1969 7.3 87
1970 7.2 88
1971 8.6 87
1972 10.4 87
1973 11.5 81
1974 6.3 88
1975 12.1 86
1976 14.0 77
1977 12.4 79
1978 17.6 74
1979 20.0 71
1980 20.0 71
1 Excludes imports of live sheep
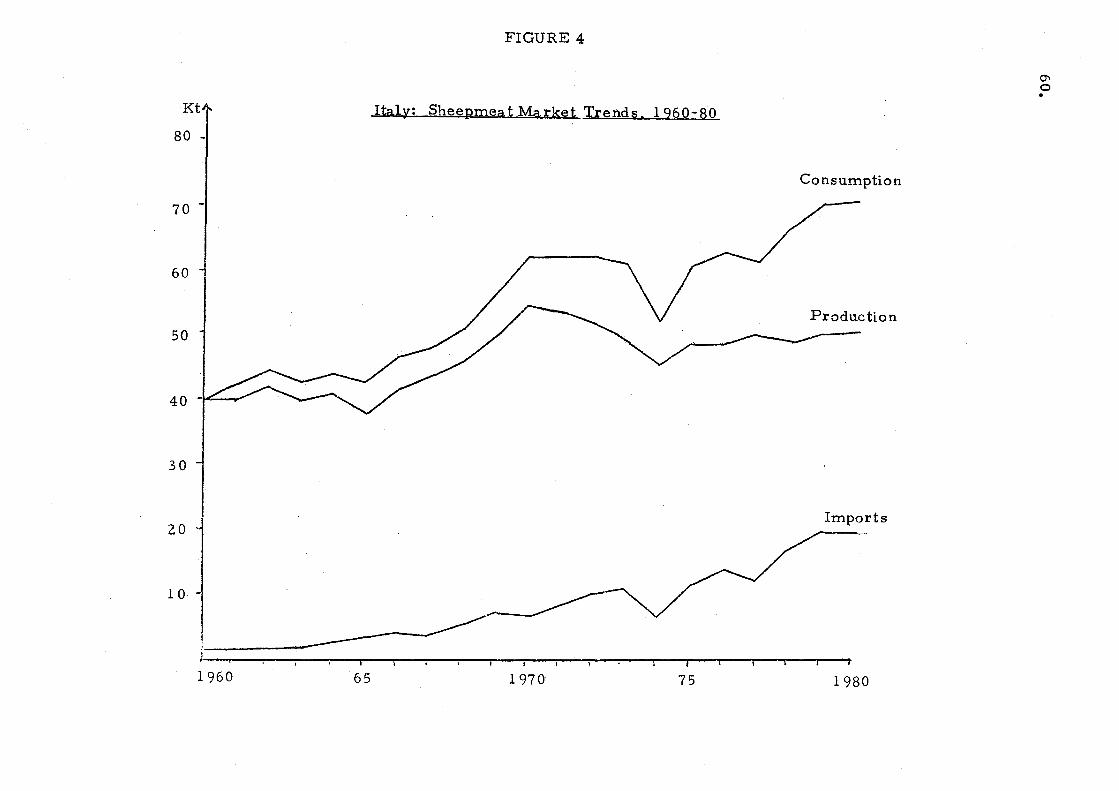
Kt
80 -
70 -
60
50
40 -~
30 -
20
1 o· -
1960 65
FIGURE 4
Italy: Sheepmea t Ma.rket Trends, 1960-80
1970 75
Consumption
Production
Imports
1980
0"1 o •
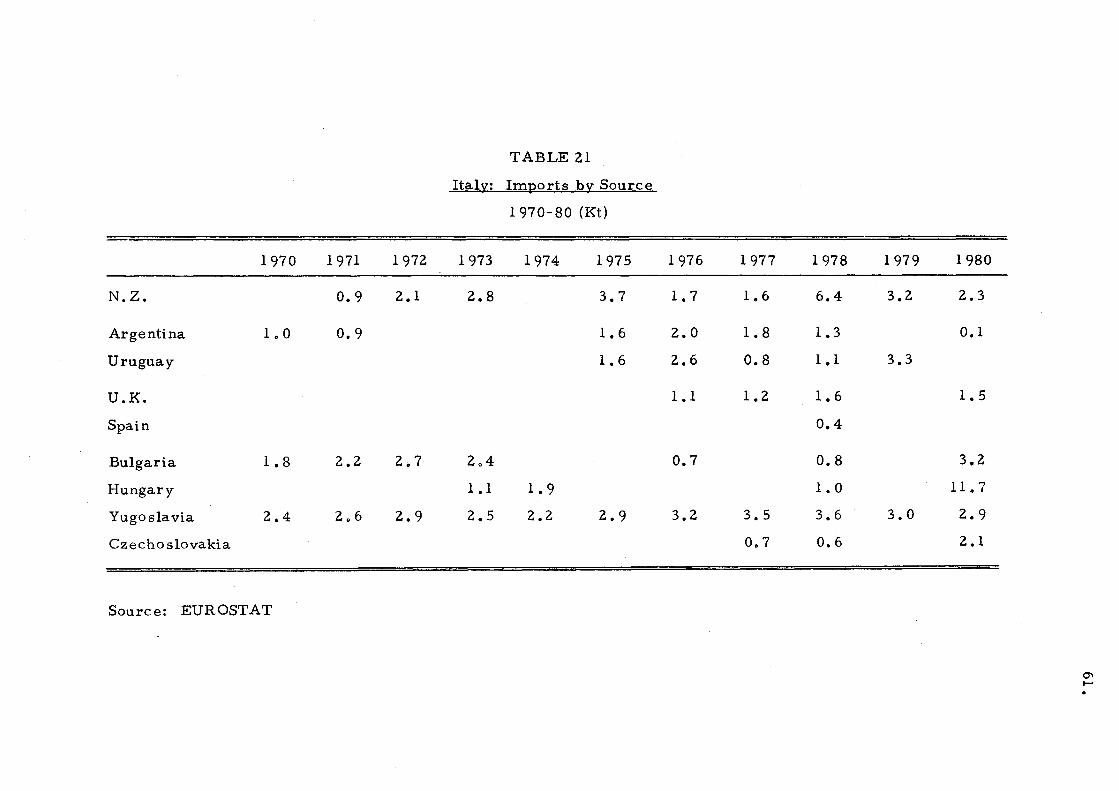
TABLE 21
Italy: Imports by Source
1970- 80 (Kt)
1970 1971 1972 1973 1974 1975
N.Z. 0.9 2.1 2.8 3.7
Argentina 1.0 0.9 1.6
Uruguay 1.6
U.K.
Spain
Bulgaria 1.8 2.2 2.7 204
Hungary 1.1 1.9
Yugoslavia 2.4 2 0 6 2.9 2.5 2.2 2.9
Czechoslovakia
Source: EUROSTAT
1976 1977 1978
1.7 1.6 6.4
2.0 1.8 1.3
2.6 0.8 1.1
1.1 1.2 1.6
0.4
0.7 0.8
1.0
3.2 3.5 3.6
0.7 0.6
1979
3.2
3.3
3.0
1980
2.3
0.1
1.5
3.2
11.7
2.9
2.1
0'1 ......


6. WEST GERMANY
6.1 Production
West Germany produces only 4 per cent of the EEC's sheep
meat, and at 25 Kt. this is less than 0.5 per cent of all meat produced
in Germany (Table 22). There was a persistent decline in sheep
numbers up to the early 1970's: from over 10 million at the beginning -,
of the century, numbers declined to under one million head. Since
1972, there appears to have been a revival of sheep farming, especially
in the regions covered by the EEC Directive on less-favoured areas
(Schleswig - Holstein, Hesse, Lower Saxony and Bavaria).
The principal cause of the earlier decrease in numbers was
the increase in sheep-raising overseas, where production costs are
much lower. Land formerly used for sheep has been turned over to
dairying and grain, and other livestock enterprises. Table 22 shows
the increase in production of all meat, which, until 1974 was growing
at a faster rate than sheepmeat production. Low consumption levels
of mutton and lamb gave little incentive to inc rease output. Growing
demand since 1972 caused output to more than double during the 1970's,
from 10 Kt to 28 Kt in 1980 (Table 22). Average carcass weights
increased from 17 to 25 kg, unlike most countries where the trend , is towards lighter-weight lambso Slaughter numbers also rose rapidly,
which, whilst increasing production, has restricted the ability to
re-build flocks, and will be the main factor preventing expansion of
output over the next few years. FAO (1979) estimates that output
of sheepmeat will ri se only slightly by 1985, to 30 Kt.
6.2 Consumption
Meat consumption in West Germany is high, at 94 kg per capita
and this consists almost entirely of beef, veal and pork. Mutton,
lamb and goat meat are consumed in insignificant quantities, being
63.

TABLE 22
West Germanv: Production Statistic s
1 0'1 ('000 head) 1 Average carcass Sheepmeat All meat Sheepmeat as ~
• Sheep Slaughter weight (kg) Production Production % all meat
(Kt) (kt) % 1960 1,086 654 16.1 3,129 0.5 1961 1,037 609 15.4 3,269 0.4 1962 1,011 538 13.3 3,522 0.3 1963 981 532 13.5 3,596 0.3 1964 898 541 17 13.4 3,688 0.3 1965 841 474 21 11.7 3,635 0.3 1966 797 446 22 11.1 3,758 0.3 1967 812 440 21 10.7 3,946 0.2 1968 810 444 21 10.6 4,208 0.2 1969 830 419 20 9.9 4,262 0.2 1970 841 478 20 10.9 4,443 0.2 1971 843 507 20 11.9 4,670 0.2 1972 847 478 24 11.4 4,439 0.2 1973 908 461 25 11.2 4,408 0.2 1974 1,016 650 24 16.0 4,678 0.3 1975 1.040 916 24 21. 0 4,688 0.4 1976 1,087 1,007 23 26.0 4,830 0.5 1977 1,091 1,090 23 25.0 4,886 0.5
1978 1,135 1,171 23 26.0 4,742 0.5
1979 1,136 1,2552
23 26. O2 4,9222
0.42
1980 1,179 1,179 23 28.0 4,981 0.5
Source: U.S.D.A.
1 Includes live imports
2 Estimated
65.
less than 1 per cent of total consumption (Table 23). Per capita
consumption of sheepmeats, at 0.7 kg is much lower than it was
earlier in the century (HMSO, 1936), but after being stable at
around 0.3 kg in the 1960's, consumption more than doubled during
the 1970's. This was due to increasing incomes, rising prices of
competing meats, and increased availability of cheap, imported
sheepmea ts.
Sheepmeat consumption rose faster than consumption of other
meats which increased only 50 per cent. Total sheepmeat consump
tion trebled over the period 1960-80, to 48 Kt, as a result of increas
ing per capita consumption, and the growth in population from 55 to
61 million.
FAO (1976) suggest that the income elasticity of demand for
mutton and lamb in West Germany is low, at 0.2; however, this
relationship Was estimated on pre-1974 data, and the rapid increase
in consumption only started in that year. Real incomes have risen
through the 1970's and the income elasticity has increased but
become negative. Greenfield (1974) gives an estimate of -1.67
from 1955-72 •. Both Greenfield and FAD also estimate the own-price
elasticity of demand for mutton and lamb to be -2.11; this suggests
that demand is far more sensitive to price in West Germany than in
other EEC states. Given the nature of demand it seems reasonable:
consumption peaks at Ea ster, which is the only time when lamb is
regularly eaten - and the small market at other times is highly
sensitive to price levels of other meats. (Greenfield gives a cross
price elasticity at 1.74 for veal). There is still prejudice against
sheepmeats, especially frozen lamb much of which is imported from
South America, boned-out, to avoid the risk of infection.
A further restriction on demand is the German preference
for sausage and edible-fat products: mutton is not as easy to utilise
in these as beef and pork. The increase in demand, though, has tended
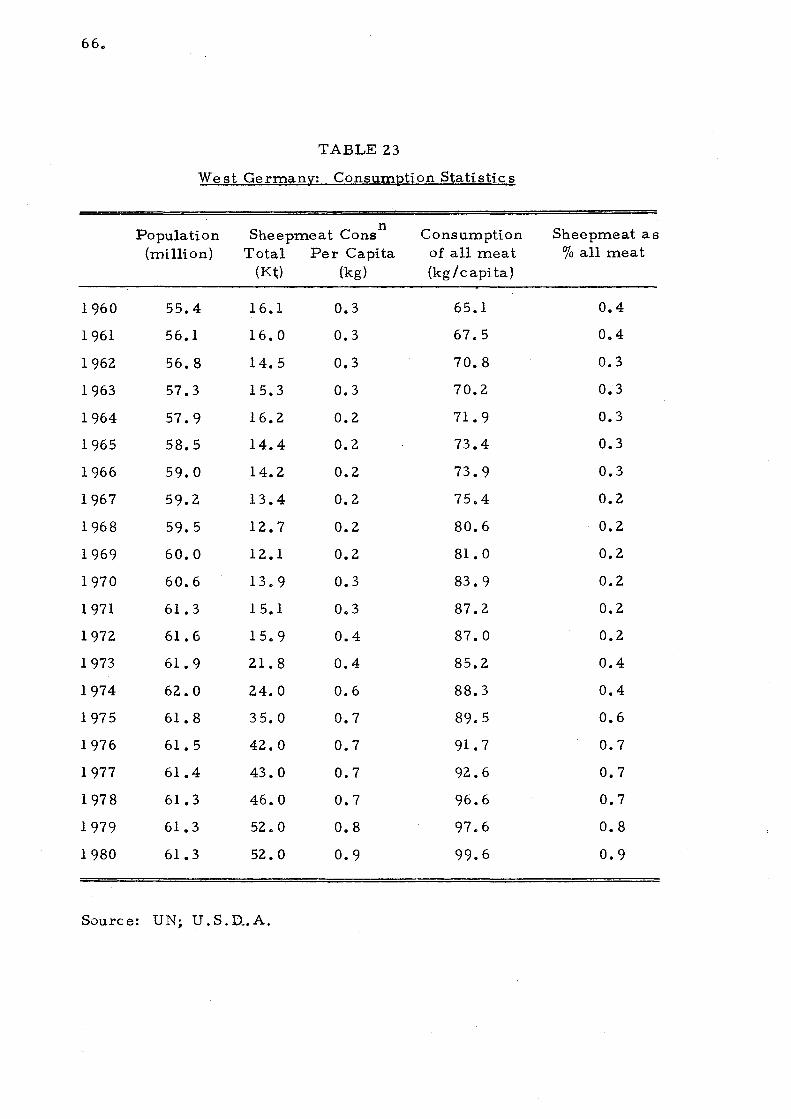
66.
TABLE 23
West German~: Consum12tion Statistic s,
Population Sheepmeat Cons n
Consumption Sheepmeat as (million) Total Per Capita of all meat % all meat
(Kt) (kg) (kg / capi ta)
1960 55.4 16.1 0.3 65.1 0.4
1961 56.1 16.0 0.3 67.5 0.4
1962 56.8 14.5 0.3 70.8 0.3
1963 57.3 15.3 0.3 70.2 0.3
1964 57.9 16.2 0.2 71. 9 0.3
1965 58.5 14.4 0.2 73.4 0.3
1966 59.0 14.2 0.2 73.9 0.3
1967 59.2 13.4 0.2 75.4 0.2
1968 59.5 12.7 0.2 80.6 0.2
1969 60.0 12.1 0.2 81. 0 0.2
1970 60.6 13.9 0.3 83.9 0.2
1971 61. 3 15.1 0.3 87.2 0.2
1972 61. 6 15.9 0.4 87.0 0.2
1973 61. 9 21. 8 0.4 85.2 0.4
1974 62.0 24.0 0.6 88.3 0.4
1975 61. 8 35.0 0.7 89.5 0.6
1976 61. 5 42.0 0.7 91. 7 0.7
1977 61.4 43.0 0.7 92.6 0.7
1978 61.3 46.0 0.7 96.6 0.7
1979 61.3 52.0 0.8 97.6 0.8
1980 61.3 52.0 0.9 99.6 0.9
Source: UN; U.S.D..A.
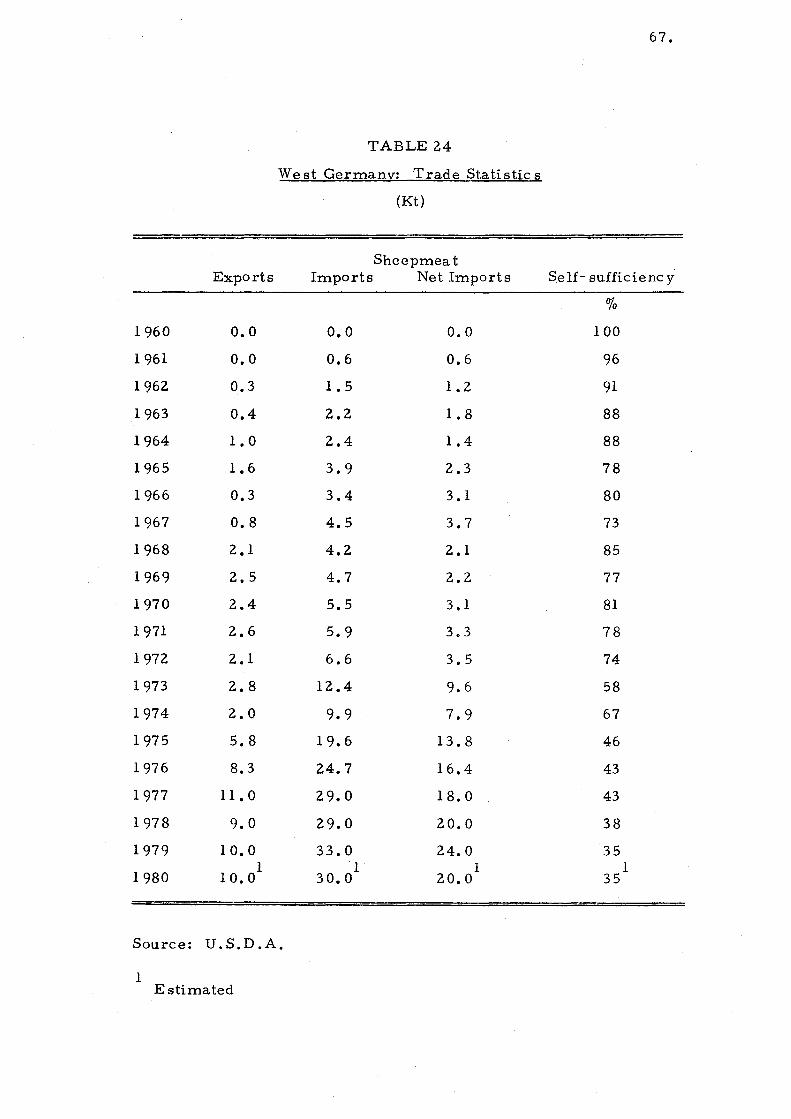
67.
TABLE 24
West Germany: Trade Statistics
(Kt)
Sheepmeat Exports Imports Net Imports Sel£- sufficienc y
%
1960 0.0 0.0 0.0 100
1961 0.0 0.6 0.6 96
1962 0.3 1.5 1.2 91
1963 0.4 2.2 1.8 88
1964 1.0 2.4 1.4 88
1965 1.6 3.9 2.3 78
1966 0.3 3.4 3.1 80
1967 0.8 4.5 3.7 73
1968 2.1 4.2 2.1 85
1969 2.5 4.7 2.2 77
1970 2.4 5.5 3.1 81
1971 2.6 5.9 3.3 78
1972 2.1 6.6 3.5 74
1973 2.8 12.4 9.6 58
1974 2.0 9.9 7.9 67
1975 5.8 19.6 13.8 46
1976 8.3 24.7 16.4 43
1977 11.0 29.0 18.0 43
1978 9.0 29.0 20.0 38
1979 10.0 33.0 24.0 35 1 1 1 1
1980 10.0 30.0 20.0 35
Source: U. S. D. A.
1 Estimated

68.
to be for both high quality lamb, and boned-out mutton for manufactur
ing and direct consumption. A major factor in increasing demand is
the growing migrant population, largely of North African origin, who
have a strong preference for sheepmeats.
6.3 Trade
Up to 1972 West Germany relied on imports for only a small
proportion of its sheepmeat supply. In the 1920's when meat was
scarce, frozen meat was readily accepted and the import trade became
established. It persisted when domestic supplies of all meats grew
until the Government re stricted trade by quota and stringent veterinary
regulations. This made it virtually impossible to import frozen meat:
even now high standards are demanded (e. g. no meat from South
America can be sold bone-in).
Since 1972, self- sufficienc y in sheepmeat has dropped to 35 per
cent (Table 24, Fig. 5). However, because of exports of domestically
produced meat dome sHc produce rs supply only II per cent, and a
declining share of the dome stic market. The decline in self- sufficienc y
results from differences in prices between EEC states, and barriers
to trade within the Community. For example, domestically produced
lamb, in 1979, cost 191 p/kg, which was uncompetitive in the face of
fre sh or frozen lamb imports at 134 p/kg, and 98 p/kg, re specti vely.
Hence imports have risen from nothing in 1960 to 33 Kt. German
imports are now 10 per cent of total EEC imports.
Exports have also increased to 10 Kt (Table 24), though the
figures are misleading as meat is being trans-shipped from the U.K.
and Ireland, via West Germany, to France. West Germany is now
France's third large st supplie r. Hence net imports are around 20 Kt
per annum, for reasons given in Section 3.
69.
Imports have been regulated by law since 1957; import licence s
are granted for sheepmeat products and may be suspended if the mar
ket situation makes it necessary (this has not been done since 1972).
In supplying the German market, Argentina has traditionally
played an important part, often accounting for 90 per cent of imports.
Since 1970 (Table 25) the market has been shared mainly between
Argentina and N. Z., but with Argentina still dominating the market.
Since 1974, the U. K. has shipped increasing quantities, but much
of this is re-exported to France. Other supplies are small, at under
4 Kt, coming from Uruguay and East European countries.
The ban of imports of bone-in lamb from South America proved
of little advantage to others: South American exporters adapted to
the constraint - and the bonelss product found favour with German
purchasers, its price being low compared to other imports.
Nevertheless, Germany is N. Z. 's second largest market in
the EEC, and quantities sold there have increased to 7.5 Kt (Table
25). Up to 1980 the NZMPB approved a limited number of exporter s
and their agents to trade in Germany, as it was designated a develop
ment market.· Due to the potential that the market offers for develop
ment, however, these re strictions on exporter s have been lifted.
With a population of 61 million, a higher per capita income
than the U. S., and a limit to dome stic production growth, the future
market could be sizeable.
Access to the market was secured up to 1984 in trade arrange
ments made with non-member states under the EEC Sheepmeat Regime.
This was important for both parties as some 70 per cent of West
Germany's trade is with third countries.

TABLE 25
West German~: Im~orts b~ Source ...J 0 .
Argentina N.Z. U.K. Other
Kt % Kt % Kt % Kt % 1970 1.8 33 1.8 33 1.9 34
1971 1.7 29 3.4 58 0.8 13
1972 1.4 21 3.9 59 1.3 20
1973 4.7 38 6.0 48 2.7 14
1974 5.2 52 2.8 25 1.5 15 0.4 8
1975 8.8 45 4.4 24 2.7 14 3.7 17
1976 13.5 55 3.7 15 5.5 22 2.0 8
1977 12.5 43 3.7 13 9.2 32 3.6 12
1978 9.5 33 6.1 20 11.5 39 1.9 8
1979 9.9 30 7.5 25 13.6 40 2.8 5
1980 7.1 17 5.8 14 16.7 41 5.8 14
Source: EUROST AT

Kt 60
50
40
30
20
10
1960
FIGURE 5
West Germany: Sheepmeat Market Trends. 1960-80
65 1970 75
Consumption ----
Production ~
__ Imports
-.J -1980

7. THE NETHERLANDS
7.1 Production
In a country so intensively cultivated as the Netherlands, con
ditions are not well suited to sheep farming, and sheep number s
have never been large. However, since 1960 sheep number shave
shown a marked increase and almost doubled over the 21 year period
to reach 840,000 head - similar to levels earlier in the century.
I.t is unlikely that much further expansion of sheep numbers
will occur, as the trend is to more intensive use of the land -
especially pig and cattle production.
Only 0.7 per cent of agricultural revenue is from sheepmeat,
which shows the lack of importance of the enterprise. Table 26
shows that sheepmeat production accounts for less than 1 per cent
of all meat production, and this share is constant as production of
all types of meat has increased at the same rate. Sheepmeat pro
duction has, in fact, doubled over the period from 7.3 Kt in 1961 to
15.8 Kt in 1980. Output has fluctuated widely (Table 26) but the
general trend has been upwards. The Netherlands still only pro
duce 3 per cent of total EEC sheepmeat, though output increased
sharply after the EEC enlargement in 1973, as export opportunities
improved.
The main areas of sheep farming in the Netherlands - Friesland,
Zealand and Groningan - are all covered by the EEC Directive on
less-favoured areas, and such aid, given to support producer-incomes
could tend to encourage sheep production. More direct support is
now given to sheep producer s under the EEC Sheepmeat Regime, which
guarantee s producers a minimum price for their animals.
FAO (1979) projections for output in 1985 are for some further
expansion to 20 Kt, which is consistent with the trend up to 1980.
73.

Sheep number s ('000 head)
1960 456 1961 438 1962. 482. 1963 468 1964 443 1965 484 1966 558 1967 52. 9 1968 552. 1969 554 1970 575 1971 572. 1972. 592. 1973 657 1974 749 1975 760 1976 780 1977 800 1978 841 1979 845 1980 840
Source: UN; U.S.D.A.
1 Estimated
Netherlands:
Production
(Kt) 9.3 7.3 8.4 7.7 5.9
11.0 8.9 8.5 8.4 8.1
10.8 11. 3 10.7
9.7 15.0 13.4 15.9 1 5.1 15.4 16.0 15.8
TABLE 2.6
Production amd Consumption Stati stic s
-J
Consumption of: ~ . Production All meat Sheepmeat Sheepmeat all meat Per Capita Per Capita Total
(Kt) (kg) (kg) (Kt) 82.8 50.8 0.3 4.0 777 50 0 3 0.2. 2..0 853 54.7 0.3 3.0 817 55.1 0.2. 2..0 884 52..0 0.2. 2..0
IP16 56.9 0.2. 3.0 IP65 59.7 0.2. 3.0 IJ 45 61. 2. 0.2. 3.0 1251 63.1 0.2. 3.0 1.,2. 72. 61. 2. 0.2. 4.0 1.,474 63.8 0.2. 3.0 1.,601 66.9 0.2. 3·.0 1.,568 67.1 0.2. 3.0 1.,613 65.3 0.2. 3.0 1., 793 71. 5 0.2. 3.0 1,81 7 72..5 0.2. 3.0 1.,874 73.1 0.2. 3.3 1,931 73.6 0.2. 2..6 1,873 75.3 0.3 4.7 1, 9851 77.1 0.4 5.3 1.,990 77.6 0.4 5.3

75.
7.2 Consumption
Consumption of sheepmeat in the Nethe rlands is extremely
small at 0.2 kg per capita (Table 26). This consumer indifference
to mutton and lamb is unlikely to change as there are few other ethnic
groups to encourage new taste s; as cattle and pig rai ser s look to the
domestic market as an outlet for production, sheepmeats will meet
with increased competition from these other, preferred meats. Per
capita consumption of all meats is not as high (73 kg) as other EEC
states. It is likely to expand further, so there will be increased
demand for all meats as incomes rise. Mutton tends to be an inferior
good in the Netherlands, whereas lamb demand is highly elastic with
respect to incomes.
Projections to 1985 suggest that per capita consumption of
sheepmeat will increase rapidly to 0.8 kg, which will give a total
consumption of sheepmeat of 10 Kt. Part of this will re sult from
population growth, which is 0.9 per cent per annum, with a total
population of 14 million. It would need a sudden change in consump
tion patterns to achieve thi s level in only five year s, but a similar
change occurred in Belgium - Luxembourg in 1960--69 and in Denmark
during the 1970 I s. Total sheepmeat consumption in the se countries
increased as a re sult of the shift in demand from mutton to lamb and
increasing incomes. Market prices in the Netherlands tend to be
above the Community average, and close to those in France, which,
as Section 7.3 shows, is the main market for exports (CEC, 1977).
7.3 Trade
As consumption accounts for only 30 per cent of sheepmeat
production (Table 27), exports have always been relatively important,
with an export trade of around 5 Kt for most of the century. In the
past there has been an important trade in live sheep too, though this
76.
has virtually ceased. Therefore, since 1960 exports of carcass
meat have almost trebled, to nearly 15 Kt in the late 1970's (Table 27).
Previously the majority of trade was with the U. K., but when
this market was closed to imports of fre~h meat, the Netherlands
developed other markets such as France, Belgium, Germany, and
Denmark. Trade with Belgium and Germany has fluctuated and is
now minimal, as a result of import restrictions and prices which
are lower than those in France; only trade with the latter has expanded
and almost all the Netherlands own sheepmeat is exported to them.
Around 2 Kt of frozen meat is imported annually from N. Z.
If the projected supply and demand levels for 1985 hold, then
export availability is likely to stabilise at its 1980 level of 12 Kt,
with the majority continuing to be sold in France.
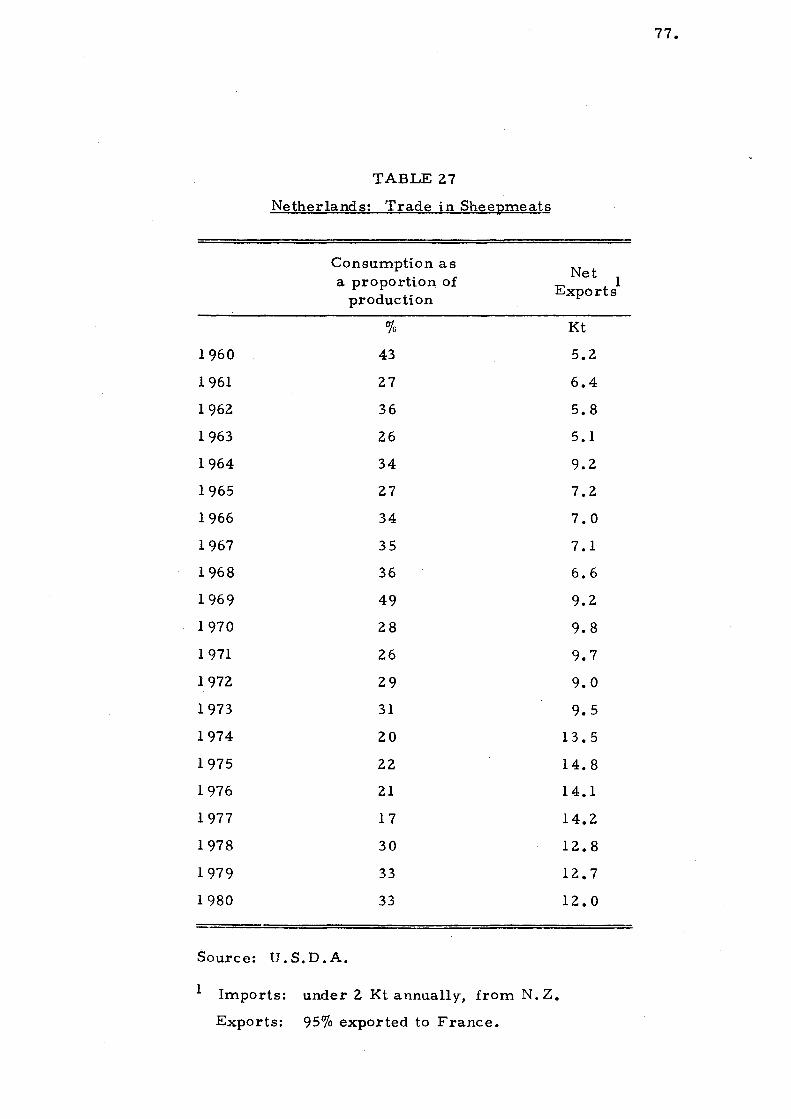
77.
TABLE 27
Netherlands: Trade in Sheepmeats
Consumption as Net 1 a proportion, of
production Exports
% Kt
1960 43 5.2
1961 27 6.4
1962 36 5.8
1963 26 5.1
1964 34 9.2
1965 27 7.2
1966 34 7.0
1967 35 7.1
1968 36 6.6
1969 49 9.2
1970 28 9.8
1971 26 9.7
1972 29 9.0
1973 31 9.5
1974 20 13.5
1975 22 14.8
1976 21 14.1
1977 17 14.2
1978 30 12.8
1979 33 12.7
1980 33 12.0
Source: U.S.D.A.
1 Imports: under 2 Kt annually, from N. Z.
Exports: 95% exported to France.


8. BELGIUM AND LUXEMBOURG
8.1 Production
Belgium is a small, highly industrialised country which has
nevertheless continued to maintain a vigorousranimal industry. But
the land is used intensively and consequently little place can be found
for sheep, which are outnumbered by cattle and pigs.
The situation in Luxembourg is similar, with the whole of
the state being covered by the EEC Directive on less favoured areas.
In both countrie s only 0.2 per cent of agricultural revenue is from
sheepmeat.
The number of sheep, at 100,000 head, has increased 25 per
cent since 1960, and production of sheepmeat doubled by 1980 to
4 Kt, as a result of heavier slaughter weights, increasing efficiency,
and higher slaughter numbers (Table 28).
Production of all meats has risen by a similar amount but
sheepmeat is only 0.3 per cent of the total. Market prices tend to
be set by the price of imports, according to the French and Dutch
price-levels: prices in Belgium and Luxembourg are close to these,
but have been slightly higher in the late 1970' s.
8.2 Consumption
As in many other continental countries, consumers are indiffer
ent to mutton and lamb and they account for only 1 per cent of all
meat consumed.
Consumption of all meats in the region is very high at over 90 kg,
and has ri sen rapidly since 1960. In this period, however, there was
a marked change in sheepmeat consumption, which rose from 0.4 kg
79.

80.
in 1960 to 2 kg in 1980. With a population of 10 million, this gave
an increase in total consumption from 4 Kt to 20 Kt (Table 28, Fig. 6).
The increase was accompanied by a move away from mutton consump
tion, towards higher quality lamb.
Sheepmeat is unlikely ever to become an important part of the
diet, and it is evident from the small size of the population that
Belgium and Luxembourg will never offer a substantial market.
8.3 Trade
Until 1960 imports were negligible as both states were almost
self- sufficient in sheepmeatso Since, then, production has increased
slightly, but consumption has grown at a much higher rate, so self
sufficiency has fallen to less than 20 per cent (Table 29, Fig. 6).
Imports are now around 16 Kt per annum. This level of imports
should continue for some years to come as production is unlikely
to inc rease substantially to sati sfy dome stic demand.
In the past, imports have been in the form of live sheep from
the Netherlands, and frozen mutton from Australia or Argentina.
In the 1970 t s meat imports have come from three source s - mainly
the U. K., but also Ireland and N. Z. For none of the se countries
does Belgium and Luxembourg comprise a significant part of their
export trade but it provides them with a stable and lucrative small
market.

TABLE 28
Belgium - Luxembour g: Production and Consum12tiQnStatistic s
Sheep Production Production Consumption of Consumption of Total Consumption ('ODD head) of sheepmeat of all meat all meat sheepmeat of sheepmeat
(Kt) (Kt) per capita per capita (Kt) (kg) (kg)
1960 73 2.0 599 64.1 0.4 4 1961 59 1.8 601 65.4 0.4 4 1962 64 2.0 651 68.4 0.4 4 1963 60 2.4 662 68.2 0.5 5 1964 58 2.5 596 68.2 0.6 6 1965 64 3.7 642 69.9 0.6 6 1966 67 2.0 696 71. 9 0.6 6 1967 68 2.7 762 74,,6 0.7 7 1968 65 3.5 822 77.0 0.7 7
1969 84 7.1 854- 78.6 0.9 9 1970 85 3.8 1,005 82.0 1.0 10
1971 66 1.5 1,055 83.8 1 .1 11
1972 66 2.8 1,050 84.8 1.0 10
1973 69 2.8 1,094 88.1 1.1 11
1974 74 2.9 1,200 93.1 1.2 12
1975 81 3.0 1,128 85.5 1.3 13
1976 88 3.1 1,116 85.5 1.6 16
1977 87 3.1 1,125 85.4 1.8 18
1978 89 4.1 1,153 85.5 1.9 20
1979 96 4.1 1,2141
86.1 2.0 21
1980 92 4.3 1,286 85.8 2.0 22
00
Source: U.S.D.A. ......
1 Estimated
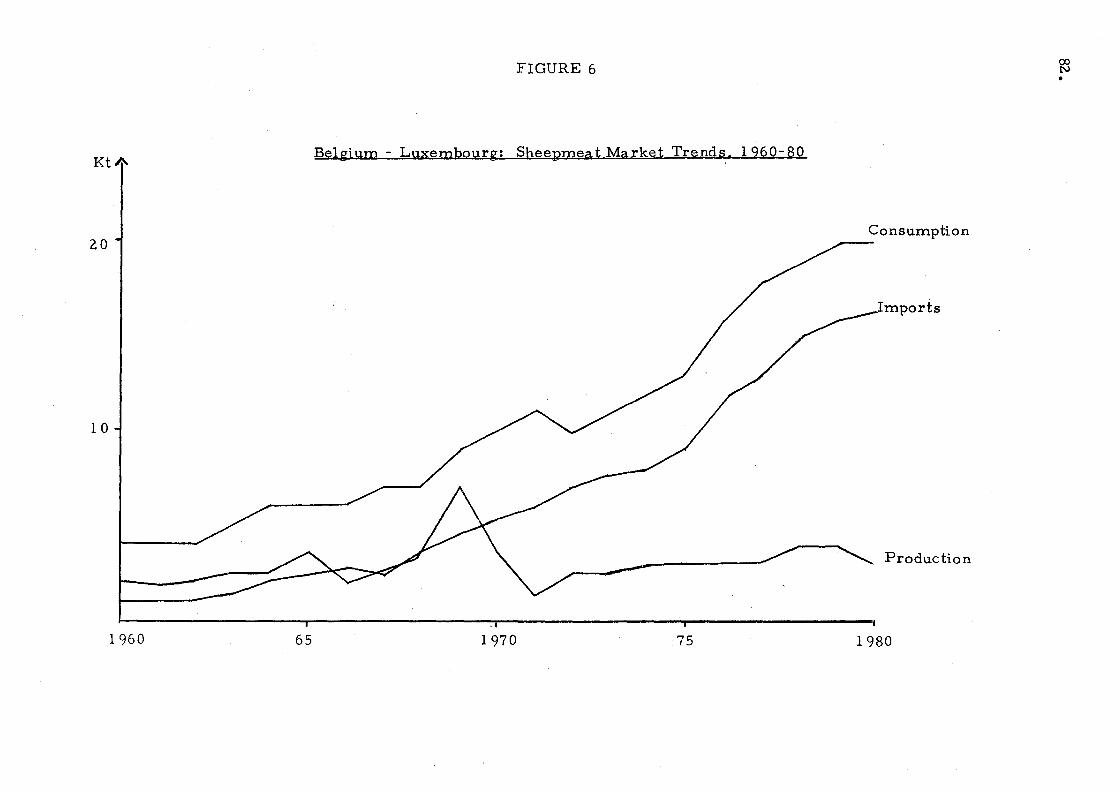
FIGURE 6
Kth-Belgium - Luxembourg: Sheepmeat Market Trends. 1960-80
20
10
1960 65 1970 75
Consumption
Imports
Production
1980
00 N •

83.
TABLE 29
Beli:ium - L~embo!.lr~: Trade
Per cent Total By Source: 1
Self Sheepmeat Suificienc y Imports U.K. Ireland N.Z. Other
(Kt) (Kt)
1970 38 5.6 2.0 1.4 2.2
1971 14 6.1 2~5 1.7 1.9
1972 28 7.3 1.7 2.9 1.3 2.4
1973 25 7.9 2.1 3.5 1.2 1.1
1974 24 8.0 2.2 4.4 0.7 0.9
1975 23 9.4 3.1 4.9 1.1 0.3
1976 19 12.0 6.7 2.5 1.5 1.3
1977 17 13.5 10.2 1.8 1.0 0.5
1978 21 15.5 13.7 0.1 1.1 0.6
1979 20 16.0 14.1 0.1 1.4 0.4
1980 15 16.5 13.7 0.7 1.3 0.8
Source: EUROS TA T
1 Not available 1960-69


9. DENMARK
9.1 Production
Domestic production of meat has traditionally been mainly pork,
with some beef and veal. Sheepmeat is of minor significance, from
a national economic point of v''lew, but of some regional importance,
particularly in Jutland. Production is highly seasonal, marketing
being concentrated in the three-month period from August-October:
import arrangements are designed to afford some protection to
producers over this period (McClaren & Pickard, 1976).
Sheep numbers have declined markedly from over 0.5 million
in the 1920' s to the current level of 50,000. There was a slight
recovery in the late 1960's, but stocks were again reduced, due to
competition from other enterprises (Table 30).
Slaughter numbers in the 1960's were high, compared to stock
numbers, but the offtake rate in Ure 1970's was much lower. Hence,
despite slightly higher stocks in 1980 than 1960, production is lower,
at 0.5 Kt. Average carcass weights are heavier than most countries,
at 35 kg.
In relation to total meats, sheepmeat production is declining
(Table 30) and has fallen from 0.1 per cent to 0.03 per cent of all
meat produced. Because sheepmeat is a minor part of the meat
industry, abattoirs are not geared to slaughter the small numbers
of sheep: thus, the price offered to producer s tends to be set by the
extent to which sheep can be fitted into regular throughput. Partly
for this reason, and partly becuase slaughter costs are lower in
West Germany, exports of live sheep for slaughter have grown from
29 in 1974 to over 9,000 in 1976. Prices tend to be similar to those
in Germany, below those in France, and above those in the U. K.
85.

86.
At wholesale, lamb prices tend to be below those for beef,
but pork prices are usually below lamb prices, except in the peak of
the lamb marketing season. Retail prices tend to be static through
out the year (Blyth, 1981); and the price of imported, frozen lamb
is also reported to be particularly stable, but is discounted with
re spec t to fre sh lamb.
9.2 Consumption
Like other Nordic countries, Demnark now has a relatively
low level of per capita sheepmeat production, despite it having
figured more prominently in the diet in the past. Per capita con
sumption of all meats at 74 kg is luwer than many EEC countries,
and consists mainly of pork and some beef and poultry meat. The
Danish sheepmeat market is the smallest in the EEC in terms of
total and per capita consumption, and production. Per capita con
sumption has risen slightly to 0.4 kg (Table 30) since 1960; ri sing
population has also given a small increase in total consumption to
3 Kt. FAO (1968) estimated the income elasticity of demand for
mutton and lamb to be 0.5, which may partly account for the increase
during the 1960' s and the upturn in demand since 1977, as real dis
posable incomes rose. Another factor behind the expansion has been
the relative price of sheepmeat which has risen more slowly than
other meat prices, as outlined in Section 9.1.
Since World War II consumption has been regulated by supply,
supply has been limited by dome stic production, and until recently,
restrictive quotas on imports. Nevertheless, there are indications
that the Danish market is starting to view lamb as an acceptable
red -meat alter nati ve to beef and pork, particularly at the upper end
of the market (Mc Claren & Pickard, 1976). Progre s sive liberalisa
tion of imports has facilitated the expansion of sales in both retail
and catering sectors (NZMPB,1978).
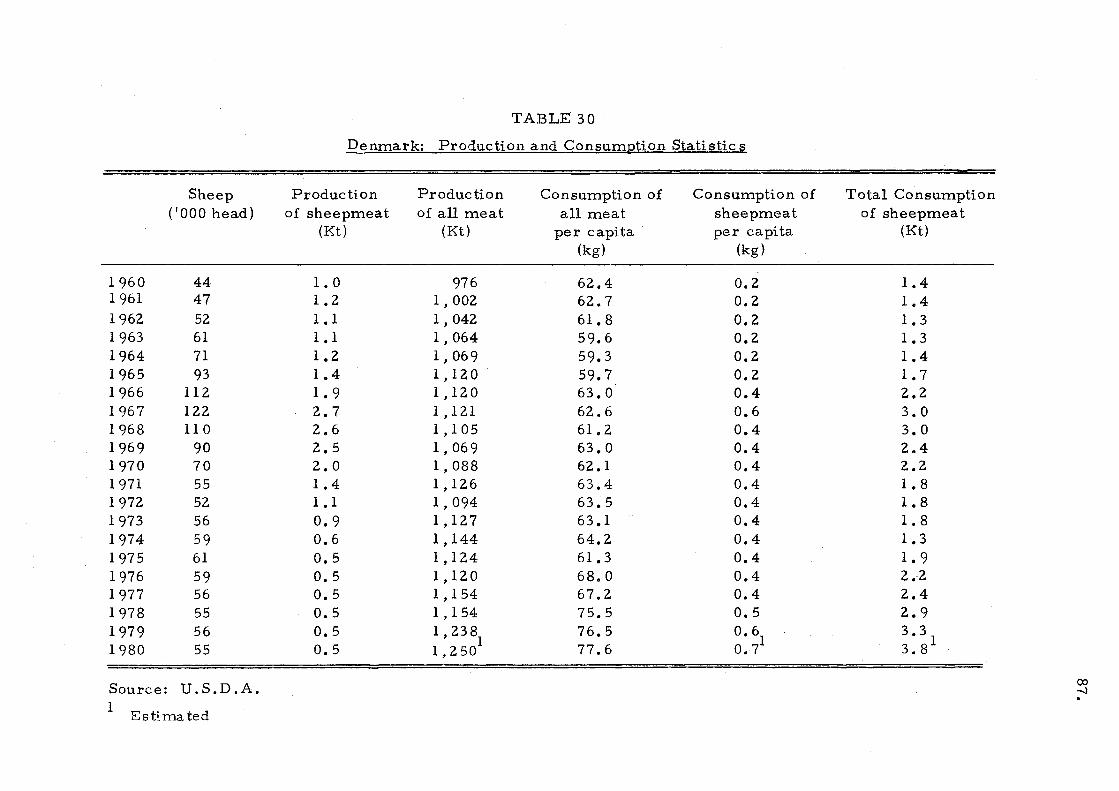
TABLE 30
Denmark: Production and Consumption Statistic s
Sheep Production Production Consumption of Consumption of Total Consumption ('000 head) of sheepmeat of all meat all meat sheepmeat of sheepmeat
(Kt) (Kt) per capita per capita (Kt) (kg) (kg)
1960 44 1.0 976 62.4 0.2 1.4 1961 47 1.2 1,002 62.7 0.2 1.4 1962 52 1.1 1,042 61. 8 0.2 1.3 1963 61 1.1 1,064 59.6 0.2 1.3 1964 71 1.2 1,069 59.3 0.2 1.4 1965 93 1.4 1,120 59.7 0.2 1.7 1966 112 1.9 1,120 63.0 0.4 2.2 1967 122 2.7 1,121 62.6 0.6 3.0 1968 110 2.6 1,105 61. 2 0.4 3.0 1969 90 2.5 1,069 63.0 0.4 2.4 1970 70 2.0 1,088 62.1 0.4 2.2 1971 55 1.4 1,126 63.4 0.4 1.8 1972 52 1.1 1,094 63.5 0.4 1.8 1973 56 0.9 1,127 63.1 0.4 1.8 1974 59 0.6 1,144 64.2 0.4 1.3 1975 61 0.5 1,124 61.3 0.4 1.9 1976 59 0.5 1,120 68.0 0.4 2.2 1977 56 0.5 1,154 67.2 0.4 2.4 1978 55 0.5 1,154 75.5 0.5 2.9 1979 56 0.5 1,238 76.5 0.6 3.3 1980 55 0.5 1,250
1 77.6 0.71 3.8
1
Source: U.S.D.A. 00 -J .
1 Estimated

88.
9.3 Trade
De spite the low consumption level of sheepmeat in Denmark,
as production is even smaller substantial imports are necessary"
Self-sufficiency has fallen from 95 per cent in the 1960's to 15 per
cent in 1979, as import demand has increased to 3 Kt per annum.
In 1980 virtually all (95 per cent) of sheepmeat availability was
imported, of which the majority (70 per cent) came from N. Z. The
remainder came from the U. K. and Iceland; since their supply is
stable, N. Z. is supplying the increasing demand (N. Z. exports to
Denmark rose from 0.7 Kt in 1974 to 2.1 Kt in 1978) (Table 31).
Imports from non-EEC countries are authorised only within
a quota, which is open from November-June: of the quota, approx
imately one-third is reserved for Iceland.
It appears unlikely that production of sheepmeat in Denmark
will increase, whereas consumption is rising rapidly. The shortfall
in availability (3 Kt) will therefore continue to be met by imports;
on the basis of pre sent trade, the se are likely to come from N. Z. ,
who should also corner any increase in import demand.
TABLE 31
Denma rk: Trade Stati sHc s
Per cent Total By Source: 1
Self- Sheepmeat Sufiicienc y Imports N.Z. Iceland Other
(Kt) 1974 46 0.9 0.7 0.2 0.0
1975 26 1.5 1.1 0.4 0.0
1976 23 1.8 1.3 0.5 0.0
1977 20 2.1 1.6 0.4 0.1
1978 17 2.7 2.1 0.3 0.3
1979 1 5 3.0 1.3 0.3 1.4
1980 13 3.5 1.5 0.3 1.7
Source: EUROSTAT 1
Not available 1960-73

10. GREECE
10.1 Produc tion
Although Greece is not particularly well endowed with resources,
the role of agriculture in the economy is more important than in most
othe r European c ountrie s. Agric ulture I s contribution to GD P ha s
declined slowly, but still amounts to 17 per cent; 30 per cent of the
working population is employed in agriculture although migration
from poorer regions has led to structural problems in the more fer
tile areas, and urban di stricts.
Much of Greece is mountainous, with a climate marked by long
periods of drought. These regions, suitable only for rough pastures
and scrub-forest are grazed by a large number of nomadic sheep and
goat flocks. The land now suffers from erosion and poor watershed
control as a re sult of many year s of similar grazing methods.
The small, fragmented farms tend to have low incomes: in the
remote mountain districts where sheep are produced the re is little
opportunity for supplementing income. Income and employment figures
do not fully reflect the large numbers of under-employed, or unpaid
family labour.
The gross value of agricultural production is made up of two-thirds
crops, one third livestock: of the latter sheep and goats contribute 6.3
per cent. Sheep number s have declined from 14.4 million in 1960, to
12.4 million in 1980, falling as low as 11.6 million in 1970. The propor
tion of goats in the flock has fallen over this period from 40 per cent to
25 per cent; sheep numbers have been more stable at around 8 million
head (Table 32).
An improvement in flock productivity and heavier carcass weights,
as well as a run-down of breeding stock, have contributed to an increase
89.

90.
in sheepmeat production. Output has grown 54 per cent over the
period, from 78 Kt in 1960 to 120 Kt in 1980, an increase of 2 per
cent per annum. Sheepmeat is an important part of meat production
in Greece, accounting for 47 per cent of total meat output in 1960,
though as meat output has increased 9 per cent per annum over the
period sheepmeat now accounts for only 24 per cent (Table 32).
The traditional pattern of husbandry in all parts of Greece is
free-range grazing of small flocks of goats and sheep. This type of
management constrains expansion of production: as a result, numbers
remain static or decline as farmers respond to competitive pressures
(Regan, 1980). Both sheep and goats are multi-purpose animals: the
gross output of the sheep flock is 66 per cent from milk, 25 per cent
from meat, and 5 per cent from wool, by value.
Meat production from sheep and goats tends to emphasise the
younger animal: some two-thirds of animals slaughtered are milk
lambs and kids of only 7 kg. Thus, the young and immature animals
play an important role suited to the climatic and geographic conditions
in Greece (which favour s production of animals with low nutritional
requirements). Tastes and demand correspond to the type of meat
available. However, if consumers want the quantity of meat consis
tent with rising living standards, they must inevitably develop a
taste for meat from mature animals (bearing in mind the limitations
on husbandry), or increase imports. To increase productivity a
special programme has been initiated which grants subsidies for
lambs slaughtered over 25 kg, and as a result, average carcass
weights have risen to 10 kg (FAO, 1976). Other programmes encour
age breeding of small, but high - yielding stock, suitable to the terrain;
and cross-breeding to increase meat production without increasing
milk-output (Boutonnet, 1978).
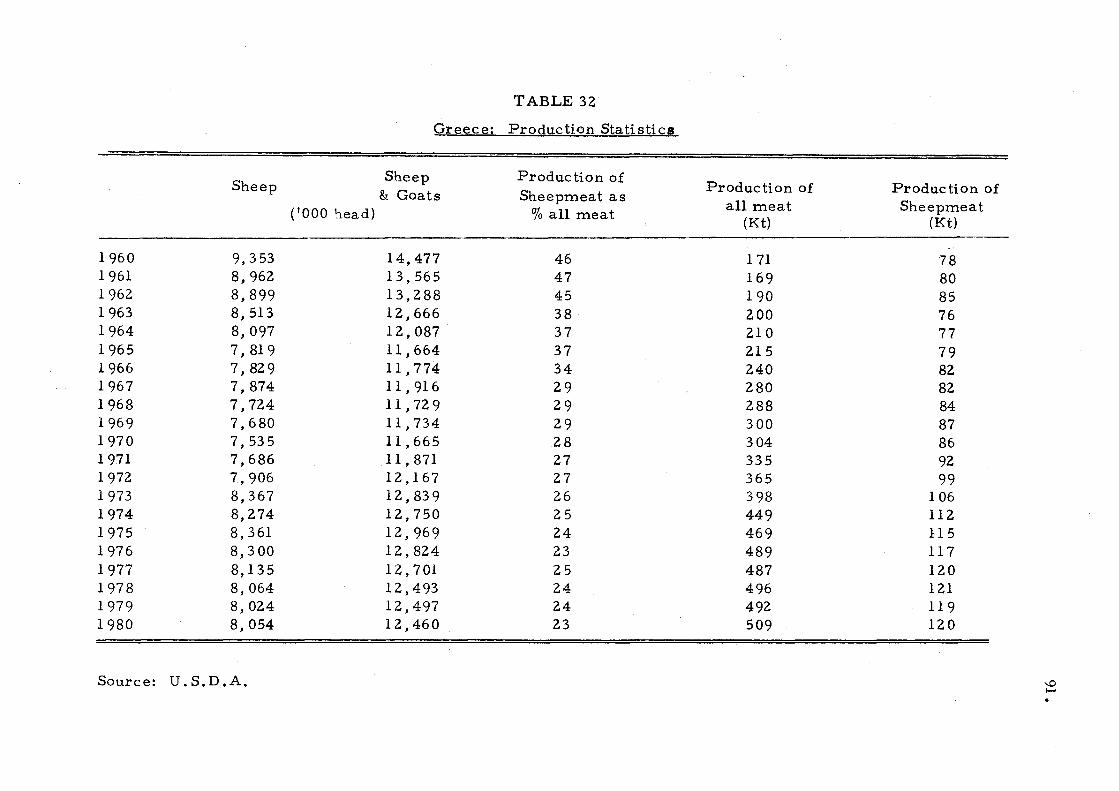
Greece:
Sheep Sbeep
& Goats ('000 head)
1960 9,353 14,477 1961 8,962 13,565 1962 8,899 13,288 1963 8,513 12,666 1964 8,097 12,087 1965 7,819 11,664 1966 7,829 11,774 1967 7,874 11 , 916 1968 7,724 11 ,729 1969 7,680 11 , 734 1970 7,535 11 ,665 1971 7,686 11,871 1972 7,906 12,167 1973 8,367 12,839 1974 8,274 12,750 1975 8,361 12,969 1976 8,300 12,824 1977 8,135 12, 701 1978 8,064 12,493 1979 8,024 .12,497 1980 8,054 12,460
Source: U.S.D.A.
TABLE 32
Production Statistics
Production of Production of
Sbeepmeat as % all meat
all meat (Kt)
46 171 47 169 45 190 38 200 37 210 37 215 34 240 29 280 29 288 29 300 28 304 27 335 27 365 26 398 25 449 24 469 23 489 25 487 24 496 24 492 23 509
Production of Sheepmeat
(Kt)
78 80 85 76 77 79 82 82 84 87 86 92 99
106 112 115 117 120 121 119 120
~ .....

92.
In the past price levels for mutton and lamb did little to bring
about change; since price controls were abolished in 1975 however,
producer prices have risen appreciably, leading to increased slaughter
and production. Generally, though, farm prices have been depressed
due to official concern with rising consumer-price levels.
Under the Medium Term Development Plan (1978-82) sheep
meat production is projected to rise to 130 Kt by 1982. This level
will be difficult to achieve, though there is pressure from increas
ing consumption and the need to replace imports. Under the live
stock improvement scheme, cattle have priority over sheep on
grazing land, which, with the lack of market price incentives, will
discourage expansion of the sheep flock, but may increase sheepmeat
production in the short term if sheep numbers are further reduced.
FAO (1979) predict that the industry will change little, with 11.1-12.5
million head of sheep, and output of 11 0-120 Kt in 1985.
10.2 Consumption
Per capita consumption of all meat, as in other European
countries, has risen rapidly over the past two decades (Table 33)
to over 70 kg.
Over the same period, consumption of sheepmeat has remained
at around 14 kg per annum, and is falling as a proportion of all meat
consumed. Both this proportion and per capita consumption of sheep
meat though, are still higher than in most European countries.
Consumer preference is for a small, young lamb or kid, bought
fresh. Hence, local lamb and kid fetch a premium in the market,
and frozen imports are heavily discounted by 30-70 per cent depend
ing on the season.
Although the population has risen by 1 million to 9.5 million
in 1980 (growth rate of 0.5 per cent per annum) and total consumption
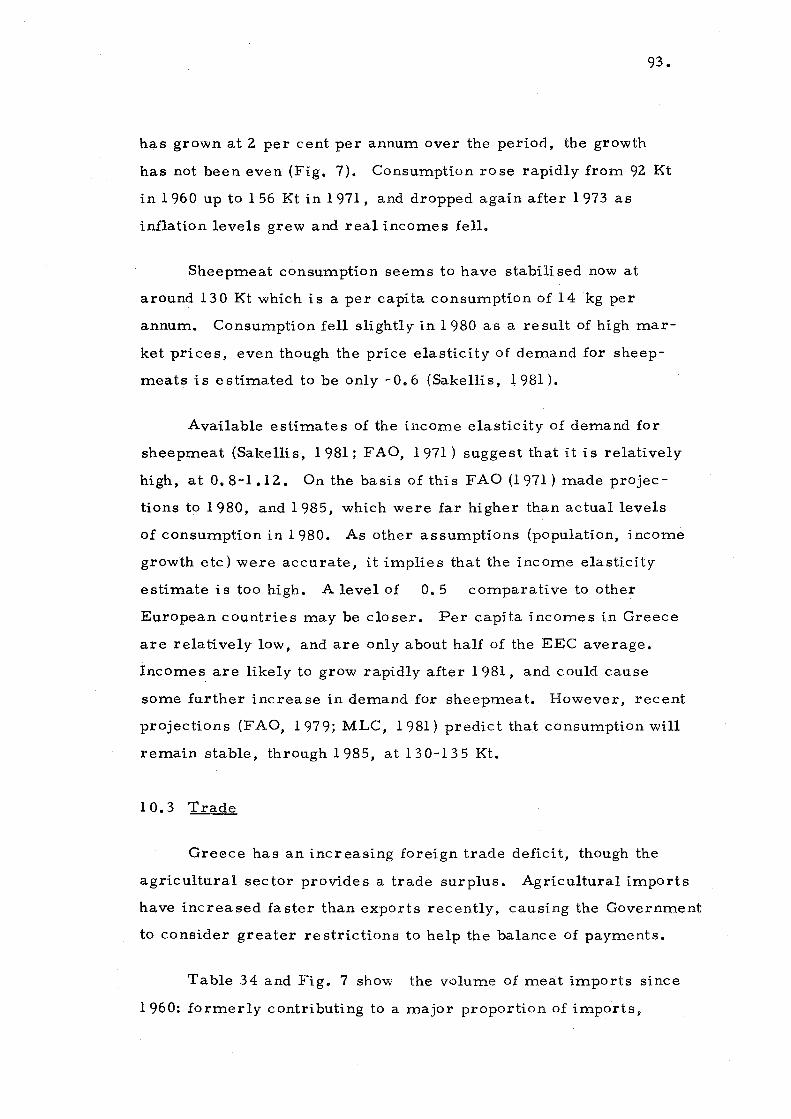
93.
has grown at 2 per cent per annum over the period, the growth
has not been even (Fig. 7). Consumption rose rapidly from 92 Kt
in 1960 up to 156 Kt in 1971, and dropped again after 1973 as
inflation levels grew and real incomes fell.
Sheepmeat consumption seems to have stabilised now at
around 130 Kt which is a per capita consumption of 14 kg per
annum. Consumption fell slightly in 1980 as a re sult of high mar
ket prices, even though the price elasticity of demand for sheep
meats is estimated to be only -0.6 (Sakellis, 1981).
Available estimates of the income elasticity of demand for
sheepmeat (Sakellis, 1981; FAO, 1971) suggest that it is relatively
high, at 0.8-1.12. On the basis of this FAO (1971) made projec
tions to 1980, and 1985, which were far higher than actual levels
of consumption in 1980. As other assumptions (population, income
growth etc) were accurate, it implies that the income elasticity
estimate is too high. A level of 0.5 comparative to other
European countries may be closer. Per capita incomes in Greece
are relatively low, and are only about half of the EEC average.
Incomes are likely to grow rapidly after 1981, and could cause
some further increase in demand for sheepmeat. However, recent
projections (F AO, 1979; MLC, 1981) predic t that consumption will
remain stable, through 1985, at 130-135 Kt.
10.3 Trade
Greece has an increasing foreign trade deficit, though the
agricultural sector provides a trade surplus. Agricultural imports
have increased faster than exports recently, causing the Government
to consider greater restrictions to help the balance of payments.
Table 34 and Fig. 7 show the vI:>lume of meat imports since
1960: formerly contributing to a major proportion of imports,

TABLE 33
Greece: Consum12tion Statistic s
-.0
*'" Consumption . Population Total Sheepmeat All meat Sheepmeat as
(million) Sheepmeat Per Capita Per Capita % all meat (.Kt) (kg) (kg)
1960 8.35 92 11.0 21. 0 52 1961 8.38 93 11.2 23.8 47 1962 8.44 95 11. 3 27.3 41 1963 8.47 96 11.4 27.7 41 1964 8.51 97 11.4 31. 3 36 1965 8.55 111 13.0 37.1 35 1966 8.61 116 13.5 40.2 33 1967 8.71 119 13.7 42.1 32 1968 8.74 117 13.4 42.7 31 1969 8.77 123 14.0 46.4 30 1970 8.79 131 14.9 51.1 29 1971 8.83 156 17.7 54.0 32 1972 8.88 146 16.4 54.8 30 1973 8.92 147 16.5 61. 3 27 1974 8.96 120 13.4 57.8 23 1975 9.04 127 14.1 53.5 22 1976 9.17 133 14.3 56.9 21 1977 9.26 128 13.8 62.4 19 1978 9.36 129 14.1 63.9 19 1979 9.45 131 14.2
1 64.4 1 19 1
1980 9.51 124 13.0 64.9 19
Source: UN; U.S.D.A.
1 Estimated

95.
sheepmeat is now relatively unimportant. Increasing quantities
were purchased up to 1973, with a sharp decrease following: conse
quently the self- sufficiency ratio has risen from 59 per cent in 1971
to over 90 per cent in 1980.
Imports of live sheep have been reduced to virtually zero - a
significant change from the levels in 1969 (Table 34)0
In relation to world trade in sheepmeat, Greek imports have
fallen from 8 per cent to I per cent in volume terms. In the past,
imports of sheepmeat have been discouraged, with no granting of
general preference s: in addition, all imports have been subject to
licensing and payment of advance deposits, exceeding 100 per cent
of the value. The declared objective was to ensure that prices
reasonably in line with international prices were paid. For sheep
meat, invoices could only be approved for 8.5-13 kg lambs; prices
set for the market prevailed for an entire year.
This procedure was abandoned when Greece became a full
member of the EEC in 1981, and the Common Sheepmeat Regime
adopted instead (Sections 1.3 and 10.4).
Greece is now only a small trader in the world market: for
N. Z. and Australia it has always been a minor market. Even in
times of high imports Greece took only 1 -4 per cent of N. Z. 's
exports, and less than 10 per cent of Australia's (Table 35).
For Argentina, however, exports to Greece have been more
important, taking over one-third of their exports at times, but the
volume has fallen sharply as import demand fell.
Table 36 shows that these three countries are the major
suppliers. N. Z. is growing in importance as a supplier (shown by
the per centage of the market held), whilst Australia's trade has
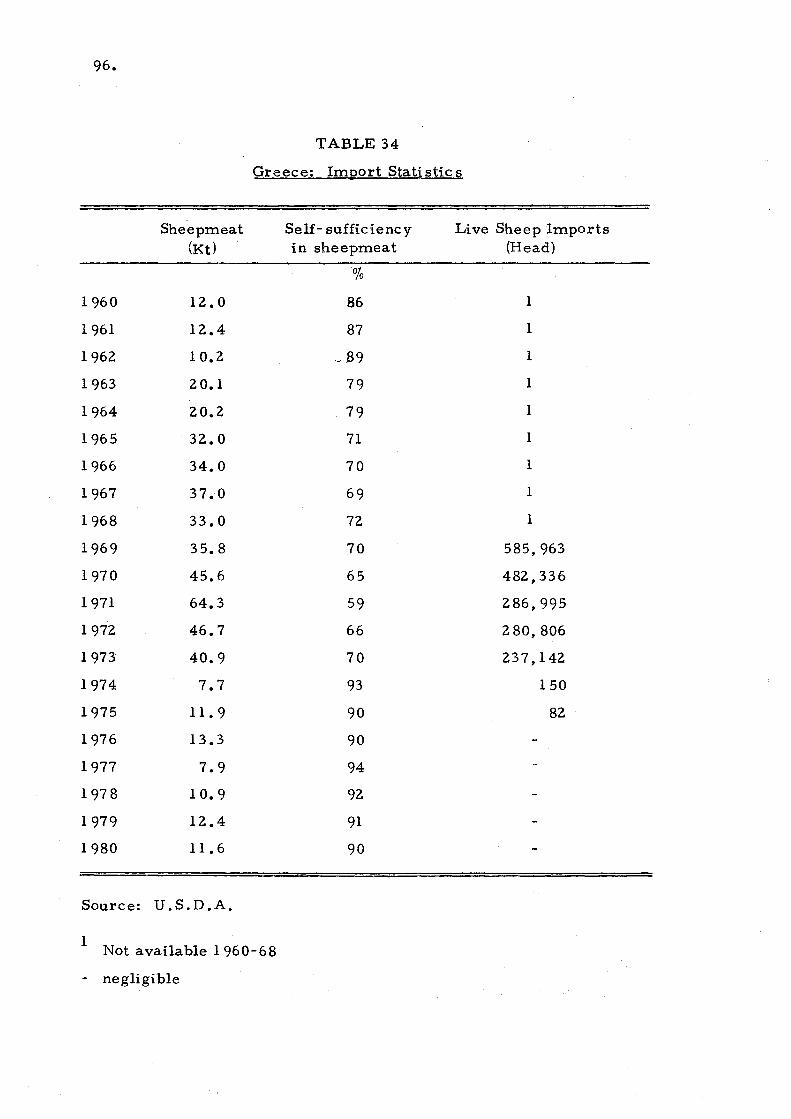
96.
TABLE 34
Greece: Import Stati sHc s
Sheepmeat Self- sufficiency Live Sheep Imports (Kt) in sheepmeat (Head)
0/0
1960 12.0 86 1
1961 12.4 87 1
1962 10.2 '- 89 1
1963 20.1 79 1
1964 20.2 79 1
1965 32.0 71 1
1966 34.0 70 1
1967 37.0 69 1
1968 33.0 72 1
1969 35.8 70 585,963
1970 45.6 65 482,336
1971 64.3 59 286,995
1972 46.7 66 280,806
1973 40.9 70 237,142
1974 7.7 93 150
1975 11. 9 90 82
1976 13.3 90
1977 7.9 94
1978 10.9 92
1979 12.4 91
1980 11.6 90
Source: U .S.D.A.
1 Not available 1960-68
- negligible
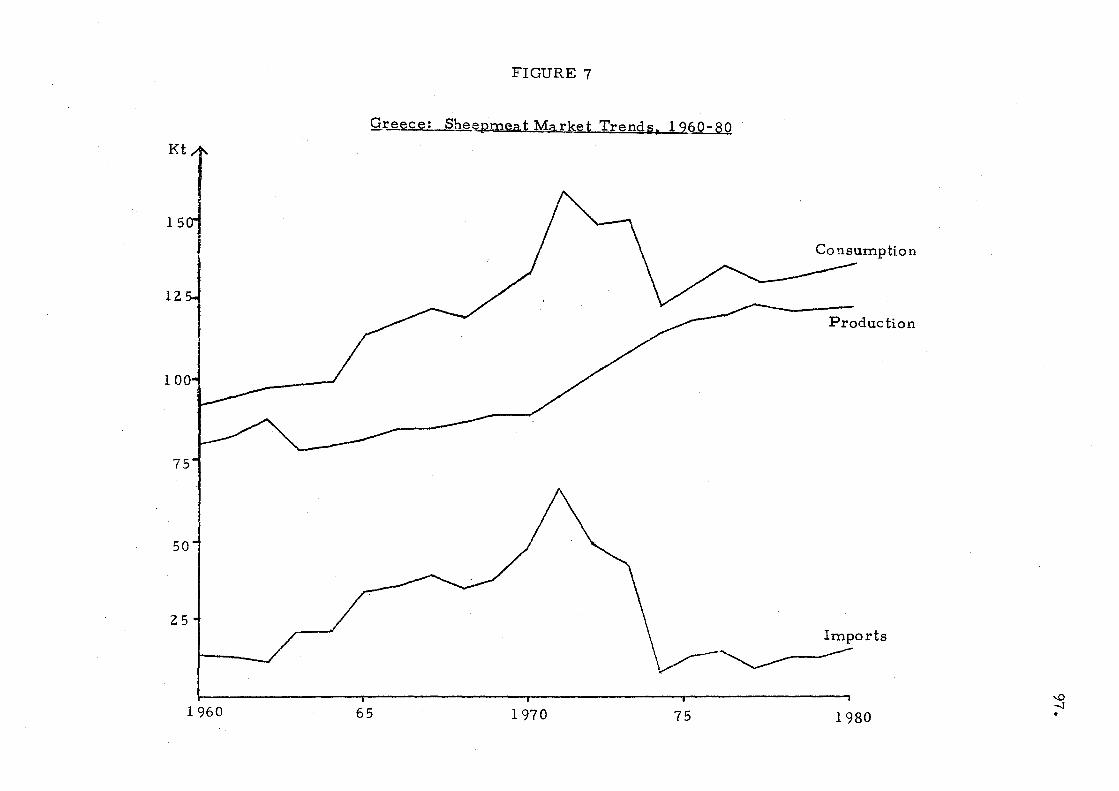
KtT 151 12
100
75
50
25
1960
FIGURE 7
Greece: Sheepmeat Market Trends, 1960-80
Co nsumptio n
Production
v-~orts
65 1970 75 1980
'-!) -..]

98.
diminished considerably, and supplies from Argentina are small
but regular. Hence the problem for N. Z. is that any fluctuations
in import demand are transmitted directly to N. Z. sales - disturb
ing the equilibrium of the market in an irregular, but relatively '.
small way.
More recently trade with East European countries has grown,
and though no details are available, imports from these countries
could be of a similar size to tho se from N. Z.
Prices quoted for imports (Karabas, 1980) shows that although
Argentinian lamb undercuts N. Z. lamb in the Greek market, Bulgarian
lamb tends to be slightly more expensive than both. It may be, then,
that the East Europeans are supplying the type of carcass most suited
to the market. They undoubtedly have the advantage over N. Z. of
proximity to the market.
A compari son of prices of locally produced meat (NZMPB,l 977)
shows that prices in Greece are close to the EEC average, though sub
stantially higher than the U.K. (1.3 to 2.4 times higher, according
to the season). This is true at both retail and farm- gate level
(Greek Press, 6).
On the basi s of the scenarios of projected supply and demand
(Sections 10.1 and 10.2) the outlook for trade is for an increase in
the import demand by 1985 to levels similar to tho se in the early
1970's, of around 20 Kt. It is likely, too, that there will be growing
competition amongst the existing traders (Argentina, N. Z., Eastern
Europe and Australia) and possibly other EEC member states, to
capture this small, but profitable market.
10.4 A Note :on Greece and the EEC
Greece was an Associate member of the Community from
1962 -1980: the relationship was de signed to ensure Greece's
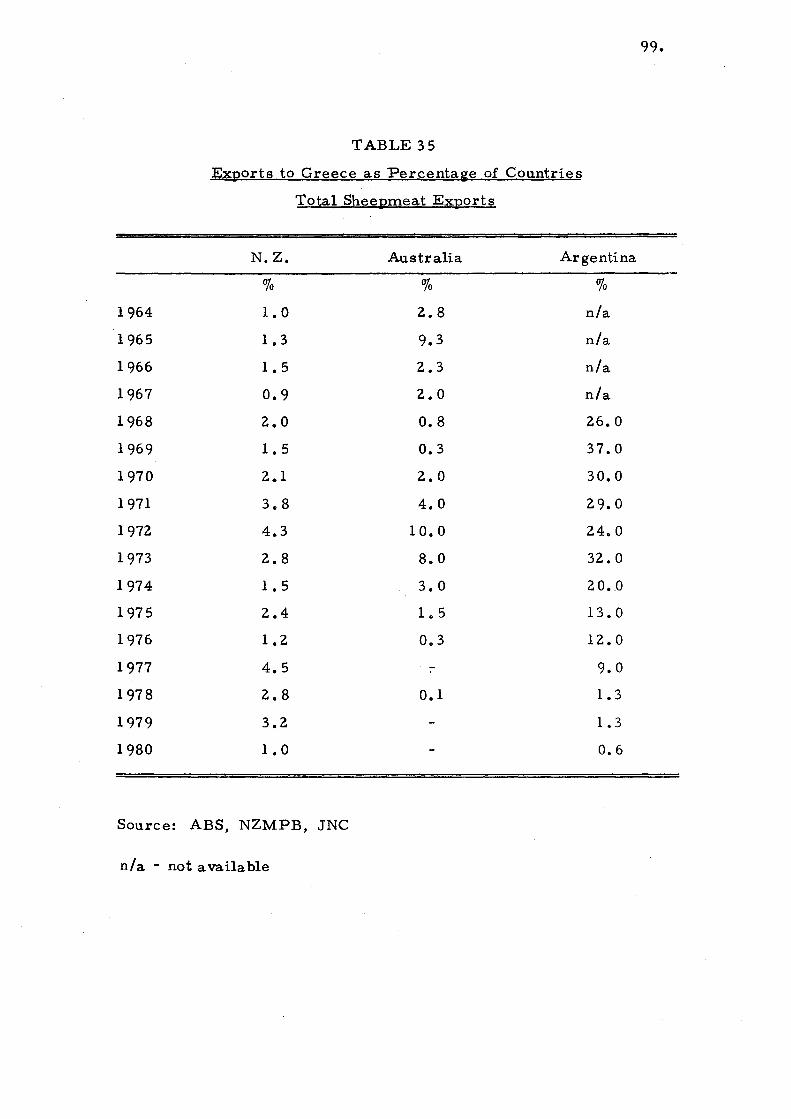
TABLE 35
Exports to Greece as Percenta~e of Countries
Total Sheepmeat Exports
N. Z. Australia Argentina
% % %
1964 1.0 2.8 n/a
1965 1.3 9.3 n/a
1966 1.5 2.3 n/a
1967 0.9 2.0 n/a
1968 2.0 0.8 26.0
1969 1.5 0.3 37.0
1970 2.1 2.0 30.0
1971 3.8 4.0 29.0
1972 4.3 10.0 24.0
1973 2.8 8.0 32.0
1974 1.5 3.0 20.0
1975 2.4 1.5 13.0
1976 1.2 0.3 12.0
1977 4.5 - 9.0
1978 2.8 0.1 1.3
1979 3.2 1.3
1980 1.0 0.6
Source: ABS, NZMPB, JNC
n/a - not available
99.
100.
TABLE 36
Greece: ImJ20rts from the Three Main Sut!t!liers
(Kt}
N.Z. Australia Argentina Total 1
1964 n/a 4.4 n/a 20.2
1965 1.7 15.1 n/a 32.0
1966 3.7 4.3 n/a 34.0
1967 3.9 3.6 n/a 37.0
1968 4.6 1.7 15.9 33.0
1969 9.6 0.7 21.7 36.0
1970 9.2 5.8 13.2 46.0
1971 11.3 16.3 6.4 64.0
1972 22.8 31.7 4.2 47.0
1973 26.1 15.3 8.2 41. 0
1974 8.7 3.4 5.0 8.0
1975 9.0 3.1 3.6 12.0
1976 14.8 0.8 4.5 13.0
1977 3.4 4.0 8.0
1978 13.9 0.3 0.5 11. 0
1979 14.3 0.4 12.0
1980 4.6 0.1 5.0
Source: NZMPB, ABS, JNC
1 Table based on exporting country trade data and is not therefore consistent with Greek total import figures, due to re-exports.
n/a - not available

101.
progre ssive integration into the EEC, as well as to cover trade policy
. in the interim. Full membership was achieved in 1981, but there will
be a period of transmission before complete harmonisation of policies
take s place.
Greece's entry into the EEC raise s the Community's level of
self-sufficiency in sheepmeats to 70 per cent (Table 37).
Sheep production is more important than in the present member
states, and increases total EEC production by about 23 per cent.
Total consumption however, only increases by 16 per cent, and imports
therefore, by only 3 per cent (on 1979 levels). Intra-EEC marketing
arrangements are not likely to be greatly affected, and as sheepmeat
prices are close to the EEC average (see 10.3) at all levels , there
are unlikely to be any direct effects on the sheepmeat market from
membership.
Indirect gains for Greek sheep farmers come from grants paid
under the Community Directive on less-favoured areas. They also
have the benefit of a supported market, under the common sheepmeat
policy.
Indirect effects on consumption levels may result from rising
income levels, but may be offset by changes in taste, and the relative
prices of other meats.
As a result of EEC member ship Greece adopted the Common
Agricultural Folic y (CAP), and the prevailing 10 per cent tariff levels.
This also implies the adoption of preferential agreements existing
within the Community. Hence the Voluntary Re straint Agreements
negotiated with third country importers have been adopted by Greece
but as the VRA's have not so far been binding on importers they should
provide little constraint to future expansion of trade with Greece.

1 02~
(The total EEC (10) VRA, up to 1984/85 allows for imports of 320 Kt,
whilst EEC (10) imports in 1980 were only 236 Kt).
The outlook for trade with the EEC (10) suggests that the trends
towards increasing sel£- sufficiency (Table 38) will continue. Estimates
of total EEC (10) demand by 1985 are for consumption levels of 976 Kt,
of which 270 Kt are likely to be imported (MLC, 1981).
TABLE 37
Greece and the EEC
Quantity (Kt) Degree of Self- Sufficiency %
Greece EEC (9) Greece EEC (9) EEC (10)
Av. 1976-79 1976-79 1976-79 1976-79 1976 -79
Production 120 529
92 57 70
Consumption 131 788
Source: MLC, 1980
TABLE 38
Trends in Sel£- Sufficiency
1972 1973 1974197519761977197819791980 --------------------------------% % % % % % % % %
EEC (9) 54 59
Greece 67 72
Source: MLC, 1980
66
93
63
90
64
88
64
93
65
91
67
92
68
90
REFERENCES
GENERAL EEC
Blyth, N. (1980), liThe EEC Sheepmeat Regime: Arrangements and Implications", AERU Discussion Paper No. 51.
Blyth, N. (1981), "The EEC Sheepmeat Regime: One Year On", AERU Discussion Paper No. 59.
Brabyn, P. (1978), "N.Z.'s Sheepmeat Sector and World Trade with Particular Reference to the EEC", Unpublished M.Sc. Thesis, Reading University.
Bryant, L. (1981), "The Common Sheepmeat Policy of the EEC: Operating Experience to Date", NZMPB, 1981.
CEC (1975), "Directive on Mountain and Hill Farming in Certain Less Favoured Areas", Official Journal of the EEC, No. 268.
CEC (1977), "Sheepmeat: Situation in this Sector in the European Community and in the World", Newsletter on the CAP, No.6, June 1977.
CEC (1978), "Proposal for a Council Regulation on the Common Organisation of the Market in Sheepmeat", Background Report 1978, Brussels.
EUROSTAT (Annual), "Yearbook of Agricultural Statistics", Statistical Office of the European Communities (SOEC) •
FAO (1979), "Meat Supply, Demand and Trade Projections to 1985", Rome, 1979.
Kelly, P. (1978), "Trends and Prospects in the EEC Sheep Sector", Paper at Agric. Economics Society Conference, 24.1.78, Ireland.
Kelly, P. (1978), "Production, Marketing and Trade in Sheep and Sheepmeat in the Expanded European Communities", Unpublished Ph.D. Thesis, University of Reading, U.K.
MLC (1981), "CAP - Sheepmeat: An Explanation of the EEC Sheepmeat Regime", European Booklet, MLC, No. 81/1.
MLC Symposium (1981), "The EEC Sheepmeat Market in the mid-1980's", October 1981.
103.

104.
NZMPB (1977), "A Common Sense Approach to the EEC Sheepmeat Market".
NZMPB (1978), "A Cause for Concern: The Draft EEC Sheepmeat Regulation".
Regan, E. (1980~ "The Sheep Market: Problems and Prospects", OECD, Paris, 1980.
United Nations (1980), "Demographic Yearbook".
USDA (monthly), "Foreign Agricultural Circular: Livestock and Meat", Various Issues.
Volans, K. (1981), "EEC Sheepmeat Regime - The Agreed Proposal", East of Scotland Agricultural College, Technical Note.
UNITED KINGDOM
Bansback, R. (1976), "Meat Demand: A brief Review of Published Material" in MLC, 1976, U.K.
Boutonnet, J. (1976), "Expansion of the EEC: What Prospects for Sheepmeat", Ministere de Agriculture, Institut National de la Recherche Agronomique.
Brown, J. (1959), "Demand for Food in the U.K. Since Derationing: Elasticity and Seasonality", JAE, Vol. 13(3).
Bushnell, P. (1973), "The Effects of U.K. Policy Options on N.Z. Lamb Receipts", Unpublished M.Sc. Thesis, Lincoln College, N.Z.
Chetwin, J. (1968), "An Econometric Study of Meat Prices in the U.K.", Unpublished M.Sc. Thesis, Lincoln College, N.Z.
Edwards, D.R. and Philpott, B.P. (1969), "Supply and Demand Projections of the U.K. Meat Market in 1975", AERU Research Report No. 57.
Hamid Miah, M. (1976), "A Cross Section Analysis of the Demand for Meat" In Thomas, W.J. (ed.) "The Demand for Food", Manchester University Press.

105.
HMSO (1964), "Report of the Committee of Inquiry into Fatstock and Carcase Meat Marketing and Distribution", Great Britain Parliamentary Report, Cmnd 2282, London.
Jones, G.T. (1979), "Projection of Demand for Food, Using the National Food Survey", Oxford Agrarian Studies, Vol. 8, 1979.
Lavercombe, A. (1978), "An Approach to Supply Response in the Sheep Industry", University of Manchester, Dept of Economics Bulletin 174.
Maclaren, D. (1977), "Forecasts of Wholesale Prices for Five Categories of Meat", JAE, VoL 28 (2), 1977.
Ministry of Agriculture, Fisheries and Food (MAFF), "The Fatstock Guarantee Scheme", HMSO, U.K. (Annual).
Ministry of Agriculture, Fisheries and Food (MAFF), "Household Food, Consumption and Expenditure", Annual Report of the National Food Survey Committee, HMSO, London.
MLC (1976), "Proceedings of a Symposium on the Demand for Meat", Held 12.1.76.
MLC (1977), "Proceedings of a Symposium on Meat Demand and Price Forecasting", Held 14.4.77, CES, Wye College, U.K.
MLC (l978), "Meat Demand Seminar", Proceedings of a Seminar, Held 12.6.78, EIS, U.K.
MLC (1978), "Sheep Facts: U.K. Manual of Economic Standards", Bletchely, U.K.
MLC (1979), "U.K. and International Demand for Meat", Proceedings of a Symposium held 24.9.79, EIS, U.K.
NZMPB (monthly), "The Meat Producer", Various Issues.
Sault, J.L. (1965), "The ~elationship Between Prices for Lamb in Australia and the U.K.", QRAE, Vol. 18 (4).
Sheppard, R.L. (1980), "Changes in United Kingdom Meat Demand", AERU Research Report No. 109.
Taylor, W.B. (1960), "Short-term Factors Influencing New Zealand Lamb Prices in the U.K.", Economic Record, pp. 568-80.

106.
Vo1ans, K. (1976), "The Export of Mutton and Lamb from the U.K.", East of Scotland Agricultural College.
West of Scotland Agricultural College (1977), "Influences on the Scottish Sheep Industry", Ag. Economics Division, Report No. 155.
West of Scotland Agricultural College (1978), "Production and Marketing of Store Sheep and Cattle in Scotland", Report No.4.
FRANCE
Boutonnet, J.P. (1978), "Structure of Wholesale Trade in Sheepmeat: A Summary", CTGREF No. 38, Paris.
Boutonnet, J.P., and Martinand, P. (1979), "Intensification of Production and World Trade in Sheepmeat: Contradictions Affecting France", Serie Etudes et Recherches; Institut National de la Recherche Agronomique Economie et Sociologie Rurales, No. 47.
Boutonnet, J.P. (1981), IIMutton and Lamb Outlook 1984-90: France and the CEE", INRA, France.
CEC (1973), "The Sheep Situation", Internal Information on Agriculture, No. 90, Brussels.
Faune, (1967), "An Econometric Study of the Demand for Meat in France", Consommation, Vol. 4 (1), 1967.
IFOCAP (1978), "Sheep Production in France and Europe", Federation Nationale Ovine, Paris.
Laloux (1968), "Consumption of Mutton and Lamb in France", INRA: Economie et sociologie Rurales, Unite de Recherches Economiques de l'ENSIA, Paris.
MLC (1977), "The French Market for Meat and Livestock", Bletchley, U.K.
MLC (U.K.), (1979), "EEC Statistics", Vol. 1; "EEC Livestock Holdings and Structures", Vol. 2; "EEC and World Livestock and Meat Prices", Vol. 3.
MLC (1979), "A Report of a Study of the Retail Market for Meat in France", U.K.
McClean, A. and Pickard, D. (1976), "Livestock-Marketing Systems in the EEC", Occasional Paper No.6 (France), Centre for European Agriculture Studies, Wye College, U.K.

107.
Ministere de l' Agriculture (1980), "Economic Assessment of Farms Specializing in Sheep, and Mixed Sheep and Beef Farms", Centre Technique du Genie Rural des Eaux et des Forets, No. 53.
SCEES (1975), "Sheep in France: Regional Data", Production Animale, No.1, December 1975.
Woods, N. (1978), "Sheepmeat in the EEC", N.Z. Quarterly, February 1978.
IRELAND
Department of Agriculture (1977), "An Economic Analysis of Ewe Flock Performance in Northern Ireland 1975 and 1976", Northern Ireland, November 1977.
Fingleton, W.A. (1978), "Performance and Prospects in Irish Sheep Production", Paper in Conference, Dublin, 19.1.78: The Cattle and Sheep Industry.
Irish Agricultural Institute (1978), "The Potential of Irish Land for Livestock Production".
Kelly, P. (1978), "Is There a Place for an Irish Sheep Industry in the European Communities?", Paper at Conference, Dublin, 29.11.78: The Cattle and Sheep Industry.
Mosse, R. (1978), "Irish Lamb's Unlimited Entry into France", U.S. Foreign Agriculture, 31.7.78.
NZMPB (1979), "Ireland Versus N.Z.", The Meat Producer, Vol. 6, No.4.
Riordan, E.B. (1981), "Ireland's Sheep Production and Trade", ERWRC, Agricultural Institute, Dublin.
ITALY
Agra Europe (1980), "Italy and Sheep Farming", No. 868, 14.3.80, various other isssues.
Cupo, C. (1979), "Sheep Farming and the Development of the Central Abruzzo" (I), Rassegna Economica Vol. 43, No.1, pp.155-64.

108.
Ferrara (1972), "Stabi1iazione Permanente Deg1i Ovini", u.s. Feed Grains Council, Rome.
Greenfield, J.N. (1974), "Effect of Price Changes on the Demand for Meat", Monthly Bulletin of Agricultural Economics and Statistics, Vol. 23 (12), 1974.
Instituto Centrale Di Statistica (1977), "Sheepmeat, 1965-1976", IRVAM, August 1977.
Lancker, A. van (1980), "Italian Sheep Production in the EEC", Revue de l'Agricu1ture 33(6), pp.1199-1214.
McClean, A. and Pickard, D. (1978), "Livestock-Marketing Systems in theEEC", Occasional Paper No.3, Italy, Centre for European Agricultural Studies, Wye College, U.K.
GREECE
Agra Europe (1979), "The Agricultural Implication of EEC Enlargement", Special Report No.3, Greece, CECa
Boutonnet, J.P. (1978), "Developments of Sheep Production and of the Market for Sheep Products (Milk, Meat) in the Mediterranean Basin - Greece", Serie Notes et Documents; Institut National de 1a Recherche Agronomique, No. 25, Paris.
Christou, K.D. and Sarris, A.H. (1980), "The Impact on Greek Agriculture from Membership of the EC", European Economic Review.
Commission of the European Communities (1978), Bulletin of the European Communities Supplement, Greece.
Kitsopanidis, G., Martka, M. and Manos, B. (1980), "Economics of Production and Marketing of Sheep Farming", Dept of Ag. Econ. Research, University of Thessa1oniki, Greece.
Sake11is, M. (1981), "Demand Functions for Selected Agricultural Products", Forthcoming.
Wallace, B. (1973), "Athens: Portrait of a Booming N.Z. Meat Market" In The National Business Review, 14.5.73.
109.
OTHER
McClean, A. and Pickard, D. (l975), "Livestock-Marketing Systems in the EEC", Occasional Paper No.2, Belgium, Centre for European Agricultural Studies, Wye College, U.K.
McClean, A and Pickard, D. (l976), "Livestock-Marketing Systems in the EEC", Occasional Paper No.4, Denmark, CEAS, Wye College, U.K.
McClean, A. and Pickard, D. (l977), "Livestock-Marketing Systems in the EEC", Occasional Paper No.5, The Netherlands, CEAS, Wye College, U.K.

RECENT PUBLICATIONS.
RESEARCH REPORTS
85. Shipping New Zealand's Agricultural Exports: Backgrou/1d and issues,P.D. Chudleigh, 1978.
86. Cu}rerJt'Cost Depreciation .Methods and the Valuation of Farm Tractrm and l{eaders, L:E. Davey, 1978. .'
87: Optimum~seekingDeJigndQrSim~lationE~perimentswith Model.f of Agricul~ur{J' Systems, S.RHarrison, 1978. .
88. Pfoducti6ltantiSupplyReltitio.n.rhipiin the New ZealandBeeJ and SbeePI,!4us~r;esi K.B, Woodford and L.D. Woods, 1978.
89.C~~Pt!t~r'S~~u'ationMiJdels~J Pd.ture Production in C(mierbury:' ]JesMjdio;,jzizdUser'sMiznila!; G. W: Fick; ,1978. '
90.. ),1";I/;,o;t Sll,rvex~jSoflth Is/andFarmers;S.L. Young, T.!. AIll~lef;;~q: fUan,J979. .
91. 1J.r~a4.:4" ¢.qlJ.$umei;~$iI~eYo.f ChristChurch Bouseho14s, RJ. Brodie"a#d~. ].Mellon, .197.~. . ....
92; .. A'nEf.olt;~~t{~~~eYof:N~~ Ze;laild Whei.;lrowers.Stirvey No.2 1917~7cY,J?;~~~y~y, RD. Lough, l),ALines,.RM. Maclean,
93.
94.
96.
97.
'RG:MQffiW+97~L ........ ' ....... . ...•...... .Anllco,'lQiTjl,c $~d!eY(!f~ew Zealaizd TOlfn MilkPrrHlucets, 1976~
Mdri;inf~:;E';r?~~Q;!:;(.l:··Jr~;t~~:~t:9I~7b/71. to 1975{1Ji;',f!. D.Chqtll~ig~,¥.~etn~s,'LD:W oo.ds, '1978 .
• ~I~~11~i~f~/1s:IP:J4'!~fe~t!kM~t~etl~g}/11aPqn,. G. W.
~!'rvexof;.'New .. ~eala~'tlfar:l7Jerl ntel1iion~.Expectations, and .• QPi"iqn;~Jilit~AlIgti~t1978,JG :J?fyde;:1978. Peak> w:~;tFkw:i>iQ,.ouihihe Marketing Syjtem, S.K. Martin, 1979>"'> <'i"'" .,. - .... . .
98. .tI,r~~?~l!it1i~~~i'ferbrfilewi~qland TOll!n Milk Producers, 1977-7I!j:Ro;:~,¥~ffi~t;'J~7Q .. ' . ,.... . "
99. Th~~lfeK!in,i,izr:1;o/Pa;cts djJrrigation Development i~ the Lower Wa#a~~l;,J,.·ltuhb~tdi WiA.N. Brown, 1979.
'100. R~cen/'Tre~ds.?';:the';'r~;nt;~ian WoollndliftrY,·· s.k: . Martin, 1979. .
101. An.§~O}I:omic:Surv..eyofNew Zealand Wheatgrowers; Enterprise AnalY1iS, §:il.rv.ey..N.o.j, 1978,79, RoD. Lough; RoM, MacLean, P.].McC:llr.tfn,M,M: Rich; .1979.
102. ~he~se.:A"Cq/1Jul11e,.:Surv.e)lof: Christchurch-Households, RJ. Brilal~,MJ .. M~ll.0n, 1979.' .
103. A.~tlJd;ofExCeSJ Pv~stdckTranSf1PrtCosts intheSouth Island of .New Zealand;RD: Inness, A.C2.wart; 1979.
104.Al1 ,Econom/c. SII;vey of NewZealtt"nd/Wbeatgrowers: Financial ;t.11alysis,.1977 ~ 7~, RD. Lough,. R'M:Ma,c{.ieaiI,I?j,McCartin, M:.M.:Rich;;197.9,' . '. ..
105, potijt~s: .i!Consu/TIef SUnjeyo! Ci}riStchlJrch'imdAucklandlfouse-.. ho!ds/M:M, Rich; MT Mellon; 19~O.·· .
1 06.,Sur';ej ~j MiwZialandFariner Intentllilts 'tind' QPinions: jUly-Septeml>er, 19;t9, ].G.Pryd~;i980. .'
107. 4S1trtlBy of Pes" and pestidde. U;~i~'Canterhilry arid Southland; J.P. M~fI1(ord, .1980. ' .
lOll· AITEco/10~~C .s~;vey o/NewZetilaizd TOlfn MilkPtoducers, 1978-79,RG: Moffitt; 1.980. '.' • '.' ....: ..
1 09. Cpa;;~es. iil U'rJitMKfngdomMC'atDmlan'd,RL. Sheppard, 19.80. . ...... , ... :>,/. . ','
110.' . J3ruc.e/lbsisBra4icqli,on.,: odesc'rifiJ,~;,oIa pl(l/1lzing model, A. C' ~e<;l<; 1'5189: . . ." . , . .-
111. . Jiish:A . ClJl1jf'j,zefSuri;eypjC~;'ist~hlirch House6p/ds, R J. Brodie, 1'980 '.'- " ..•. ' '.'< .... '.. '. ". '. '. .' An~,~alysi~~fA!t~f~(1ii,v.~.w.£e~tPricbigSchemei;·' M. M~ 'Rich," . p.,Foulds; 1989> ..•.•..... ....•..•.•........... '. , .
113., 1d'E:conomic Sur.veyOj Nqiqzia/aIJ4Wbeo,tgrowers; BnterpriJe • .' A/1a:lyjis,§4rvey /IlQ.AI97iJ:.8(j,l{,:P;L6ugh;R. ~LMacLean,
P,J,M(;Cartin, M.M .. Rich. i9~Q .• " 114 .. AReview of theRurarcrei/it,Syst~fI1i~New.Zea!and. 1964 to
1.979.J,G.Pryde, S~K.Ma:rdh;198.0;·, 115. iI .. Socia-Economic Strjdy. of Fa,rm' Workersimt! FarlJl. Mailagers;'
G.T. Harris, 1980. .' '. . '.' .' ' .
116. An Economic Survey of New Zealand Wheatgrowers: Financial Analysis, 1978~79, RD. Lough,RM, MaCLean, P.). McCartin, ,M.M. Rich, 1980.
117 Meuitiplierr from Regioilal Non~Survey I nput- Output· Tables for New Zealand;L.). Hubbard, W,A.N, Brown. 1981.
118 . Survey of the Health of New Zealand Farmers: October-November 1980, ).G.Pryde, 1981. '
119 H.ortic~'t/Jrein Akatoa County, ' . RL. Sheppard, 198,1. .' .
120. .A~ Economic Survey of /IlewZea/flTldTown MllkProdl(cerr, 1979-' 80, RG; Moffitt,198L.· . ' .. .
121. An EconQmicSurvey o/N ewZetiland Whealcrowers: Enterprise Analjsis; Survey No:5,19§O~81;R. D. LOllgh, P.]. M<:Cartin, M.M.Ri<:h, 1981. .
122. Anf,conomic Survey .0fNe.w ZealandWheatgrowerr:Fifiancial Analysis 1979~80, RD. Lough,P.].McCartin, M:M.Rkh, 1981. . , . '". . . -
123. Seasonality in the New Zealand Meat. Processing Industry, R.L. Sheppard, 1982. ,.' .
DlSClJSSION PAPERS
40. New ZeakindAgric~/tur~ izndOil!'.,-,ce Incre~ses, P.D. Chudleigh, Si.L. Young; W.A.N:Browri;1979.
41, Pl'.bCeet!il1gJol~ S~mi~ar lm .. Th~D.~ve/~pment of Ration,!' Policies for 'Agricultural Tra4ebttfWfel11<!ew Zedland and japan,A.C. Zwart, L.J. Wilson.(~d~);1979' .
42. A' Rev~ewofikJl,Jei!l;iealanJGoatlndustry; R.L. Sheppa(o" O.k. Q'Ddrmdl;i979.·
4 3.Goats:ABibliogr~pbY:D.K.()~Don,nell, R L.Sheppaf/;I, 1979 ..
44. Profeedingr of a SeminarlWorkshpponthe Ntw Zealand Go(Jt .' lildl(stry, R.]. Brodie, RL Sheppard,P.D. Chudleigh( eds),
1979. ....,...
45. An. evaluation of theSollthlandFloo4RelieJ TemNrary Employment Programme, G.T, Hartis, T.W. Stevenson, 1979.
46. Economic Factors A/fectil/gWb{!atAreas .Withfn New Zealand; M:M::Rich,A.C: Zwart, .1979.
47.
48.
49.
japanese Food Policydnd,Sei{ SljffiClency~AnAna'ysis with Reference to Meat, R:LSheppard; N.]. Beun, 1.979. ' Corporate Strul.iure.f,j a Beet~J3/hiil1ol Industry. W.A.N. Brown, J:K 1)eI:lt,1980, . . . TljeCost o[Over,etisShipju'hg:Who PayS? P.p: Chudleigh, 1980: . ,
50 Marke!EIJall(tlfion: aSy!telJl(iti.tApproarh' Frozen Gmn SprouijngBroCl:olJ> R.L.Sheppaid,- J 980.
51 . !h(fi:fi, CSh¢.epmeat- R.eg(1J1~: Arra/1gimients and Implications, N>Blyth, 1980, '. . .' .
52 Pri/i:~ed/nts. of a Seminarpn"Future Directions for New ?ealand Lamb.Jj1(ir/geNng". edIted 'hy KL. Sheppard, RJ:. Brodie; , 1980." .' . . .. ..
53 The 'E1Jajuatlij~ ';[}06 Cr~(liii)nPfqg~omn;n with particular Releren~( to the fann. Emplo)lmeilt"Pro~rnJizme. G.T. Ha,rris, 1981. .' ',' . . .
54. The NewZ,ca!a/TI! Pa.ftoraLLit;e!t(J(k Secto.i: aprelimintiry ~c(Jn01J1eifi( mq,dei,M:LLaing,A.Q, Zwart;.198L
55. nl! Sche44e Price Systeirj"aniiheN ew Zen/ani Lan;b Produc~r, N:RShadbQtt, 1981: . .
56. ·he,j;Rr;h~rPr(J?,essfl1gofMetit;K.M.SilcQck,R.L.Sheppard; 1981., . .'. .' .. . .
'57: Jap~~!:si!Agrri:lIftl(raIPolic.~pi:velop"fent: implicatiolTS for New. Zenland, A.c..Zwart; 198h . .
·58; '1)ltei~I/I?t!feS:FactJai;:JFa;iaci'is;K;B:Woodf6rd, 198 L
59. tk~gE:CSh~epme~{Regif11~: On~ Y¢ar O~, . N.Blyth, 1981.
C?O. A l{Cjjiewo/thf World.Sqeepme4 Market:: Vol .. t' ~Overvietl!of ]nNT:n.atioflql Tr(de, VO{.:?cA.ustralia~New?ealiJ/1d& Argeilti/1(J, Vo!.··j ~ The EEt (10), 'Vo~;4 " North. Ameriea, Japan & The' Midi:lle~ast, Vol 5 ~EdJterilBioc,u.S.S.R.& Mongolia, N;Blytli; 1.?81. .. .
61. 'An evaluatioil of . Farm Ownership Savings Accounts, K.B: Woodford, 1981:'
Additional copies of Research Reports, apart from complimentary copies, are avail;blellt $6.00 each. Discussion Papers are usually $4.00 but copies of Conference Proceedings (which are usually published as Discilssion Papers) are $6.00. DiscussionPaper No. 60is available at $4:00 per volume ($20 for the set). Remittance should accompany orders addressed to: Bookshop, Lincoln College, CaJ?terbury, New Zealand. Please add $0.90 per copy to cover postage.