In vitro culture for production of quality banana and plantain planting material
J. Agric. Res. & Dev. 9(2) Copy @ 2010, Faculty of Agriculture, University of Ilorin
A review of the uses and methods of processing banana and
plantain (Musa spp.) into storable food products.
A.O. ABIODUN-SOLANKE and K.O. FALADE
Department of Food Technology,
University of Ibadan, Ibadan. Nigeria
ABSTRACT
Plantain belongs to the genus Musa of the family musaceae. Nearly all edible plantain
cultivar are derived from two wild species, M. acuminate and M. balbisiana (Robinson, 1996).
These wild species are classified on the basis of the proportion of the genetic constitution
contributed by each parental source (Robinson, 1996). Plantain (Musa spp.) is an important
dietary source of carbohydrate in the humid tropical zones of Africa, Asia and South America.
(Robinson, 1996). Plantain is rich in vitamins A, C and B group as well as minerals such as
calcium and iron (Marriott & Lancaster, 1983). Musa spp. are useful as food to be consumed
by human either as flour to be used in confectionaries or as jams and jellies; in chips etc. It’s
peel can be used as animal feed. All parts of the banana plant have medicinal applications:
the flower in bronchitis and dysentery and on ulcers, cooked flowers are given to diabetics
etc. It’s leaves are also useful for lining cooking pots and for wrapping. Improved processes
have also made it possible to utilize banana fibre for ropes, table mats and handbag
(Chandler, 1995). Despite these many uses of Musa spp.and the huge tonnages harvested
each year, there are certain problems such as inaccessibility to production areas, far
distances between production areas and customers, inadequate infrastructures for
harvesting, carelessness on the part of harvesters and handlers among others which are all
factors that lead to high rate of post harvest losses, hence the need for processing of these
important crops. Different processing methods of Musa spp. into new food products which
include production of flour, preparation of jams and jellies and the quality attributes of the
products obtained from processed Musa spp.. were reviewed. It can therefore be concluded
that subjecting Musa spp. to processing methods will help enhance and improve the value of
the fruit and make it available all year round for better utilization.
Keywords: Drying, flour, banana, powder, jams, jellies.
INTRODUCTION
Banana is the common name used for the herbaceous plants of the genus
Musa which is cultivated in more than 100 countries throughout the tropics
and subtropics, with an annual world production of about 98million tonnes,
of which around a third is produced in each of the African, Asia-Pacific, and
Latin American and Caribbean regions (Frison & Sharrock, 1999).
Banana plants are monocotyledonous perennial and important crop in the
tropical and Sub tropical world regions (Valmayor et al., 2000), including
86 ABIODUN-SOLANKE and FALADE
dessert banana, plantain and cooking bananas. Traded plantain (Musa
paradisiaca AAB) and other cooking bananas (Musa ABB) are almost entirely
derived from the AA-BB hybridization of M. acuminate (AA) and M.
bulbisiana (BB) (Robinson, 1996). Plantain and cooking bananas are very
similar to unripe dessert bananas (M. cavendish AAA) in exterior appearance,
although often larger; the main differences in the former being that their
flesh is starchy rather than sweet, they are used unripe and require cooking
(Valmayor et al., 2006). Dessert bananas are consumed usually as ripe fruits;
whereas ripe and unripe plantain fruits are usually consumed boiled or fried
(Adeniji et al., 2006).
Plantain belongs to the genus Musa of the family musaceae. Nearly all edible
plantain cultivar are derived from two wild species, M. acuminate and M.
balbisiana (Robinson, 1996). These wild species are classified on the basis of
the proportion of the genetic constitution contributed by each parental
source (Robinson, 1996). Plantain is a staple crop and an important dietary
source of carbohydrate in Nigeria and in the humid tropical zones of Africa,
Asia and South America (Robinson, 1996). Plantain is rich in vitamins A, C
and B group as well as minerals such as calcium and iron (Marriott and
Lancaster, 1983; Robinson, 1996). Plantain provides between 9% and 35% of
the total calories in the diets of more than 14 million people in Sub sahara
Africa (Robinson, 1996). The contributions of this staple starch crop to the
food chains of this region cannot be overemphasized (Robinson, 1996).
Plantains are typical climacteric fruits in that they exhibit a well defined pre-
climateric phase after harvesting during which the fruit remains unripe, the
basal respiration rate is low and ethylene production is almost undetectable.
The respiratory climacteric commences spontaneously and there is a rapid
and well-defined rise in respiratory rate which is closely synchronized with
evolution of ethylene, with chlorophyll breakdown in the peel and with
starch to sugar conversion and tissue softening in the pulp (Marriot and
Lancaster, 1983; Ogazi, 1996). The fruit usually harvested at it’s mature but
unripe stage, ripens within two to seven days, thus making plantain a highly
perishable crop, particularly in the overripe stage (Robinson, 1996). An
unripened banana and the plantain have high starch and low sugar levels plus
copious amounts of bitter-tasting latex. Starch is converted to sugar as the
fruit ripens, so that bananas can eventually contain about 25% of total
sugars. As the banana ripens, the latex is also decomposed. Plantain has the
stinging, bitter latex, so the peel is removed with a knife and the pulp is
soaked in salt water for 5–10 min prior to cooking. Bananas are harvested
unripe and green, because they can ripen and spoil very rapidly (Daniells et
al., 2001)
FAO (2004) data sources put the world production of plantains at about 60
million tons (FAO, 2004). In West Africa, plantain production increased at an
average annual rate of between 2.3% to 2.6% (FAO, 2004). The level of
Processing Banana and Plantain (Musa spp.) into Storable Food Products 87
production of plantains in Africa is comparable with other fruits like grapes
(57 million tons); citrus (50 million tons) but much greater than most other
important fruits like apples (21 million tons) and mangoes (13 million tons)
(FAO, 2004). The higher production figures for plantains has been attributed to the cheaper methods of growing that require few labor inputs, little soil
preparation and little weeding are needed once the plant has established
vegetative cover. (FAO, 2004).
MATURITY INDICES OF MUSA spp
Plantain require about three months from the beginning of flowering until
harvest. Multiple fruits are produced on a large bunch, weighing between
50-200kg (Ogazi, 1996). Within the bunch are clusters of double rows of fruit
called “hands” and individual fruit called “fingers”. (Ogazi, 1996).
Maturity standards for plantains are less precise than they are for bananas.
Several different external and internal fruit characteristics can be used to
determine plantain maturity. These include fruit diameter, age of the bunch,
angularity of the fruit, length of the fruit, and peel color (Johnson et al.,
1998). The stage of maturity for harvest depends on the intended market
destination (Johnson et al., 1998). Locally marketed plantains can be
harvested at a more advanced maturity stage compared to export market
fruit. Export market destined fruit should be harvested the day before or the
same day of shipment (Ogazi, 1996). Plantain maturity is related to the
diameter of the fingers. This is determined by measuring the diameter of the
fruit at its mid point with a pair of calipers (Ogazi, 1996).
Another method for estimating plantain maturity is to record the age of the
bunch. The time from when the fruit bunch first becomes visible (Shooting)
is recorded. Bunches can be tagged with different colored ribbons at the
time of shooting, and subsequently harvested after the appropriate time for
the particular cultivar, based on the season of the year and experience
(Johnson et al., 1998). The colour of the ribbons is changed weekly to
coincide with the time of shooting and subsequently the age of the bunch
(Johnson et al., 1998).
A third method used to determine harvest maturity is to observe the shape
(fullness) and angularity of the fruit. Immature fruit is angular in cross-
sectional shape and has distinct ridges (Ogazi, 1996). As the fruit matures, it
becomes less angular and more rounded or full. The degree of roundness
differs between cultivars and location of the hand on the bunch. Typically,
the fullness of the fruit on the middle hand is measured. The appropriate
shape to harvest the fruit depends on the market destination. Fruit intended
for the domestic market should be harvested when the fruit shape is nearly
round (Johnson et al., 1998).
88 ABIODUN-SOLANKE and FALADE
A fourth way of estimating plantain bunch maturity is to measure the length
of the edible pulp portion of the fruit from the fingers in the middle hand.
The length should be a minimum of 15cm for the domestic market and 18cm
for the export market (Johnson et al., 1998). Finally, peel colour is another
frequently used method of assessing fruit maturity. The peel remains green
throughout growth and development of the fruit until it reaches physiological
maturity. It then changes to a yellow colour during ripening. (Ogazi, 1996).
However, plantain fruit should be harvested when the peel is green in colour
to withstand the rigors of handling and distribution (Johnson et al.,1998).
Internal fruit composition changes dramatically during plantain fruit ripening.
At physiological maturity, the fruit is fully developed in size, green in peel
colour, and at its highest level of starch (Ogazi, 1996). The starch will
progressively be converted to sugar as ripening progresses.
The stage of harvest maturity of plantains will depend on the target market.
Plantains for local market are harvested at a more advanced stage of
maturity than those for exportation (Ogazi, 1996). However, if the fruit is too
mature at harvest, particularly following irrigation or rainfall, fruit splitting
can occur during handling. Also, mature fruit may ripen prematurely during
transport or storage (Ogazi, 1996).
PROCESSING QUALITY
The bulk of the banana, cooking banana and plantain are eaten either as raw,
in the ripe state, or as a cooked vegetable, and only a very small proportion
are processed in order to obtain a storable product. Generally, preserved
products do not contribute significantly to the diet of the millions of people
who eat banana, cooking banana and plantain, however in some countries or
areas, the processed or preserved products are important in periods when
food is scarce. Processing is recognized as a way of preserving the fruit. Yet
the proportion of fruits processed and the suitability of the various Musa
groups to processing is relatively unknown. New Musa hybrids should
therefore be screened for their processing quality or suitability for processing
(Thompson, 1995).
The ripe banana is utilized in a multitude of ways in the human diet, from
simply being peeled and eaten out of hand to being sliced and served in fruit
cups and salads, sandwiches, custards and gelatins, being mashed and
incorporated into ice cream, bread, muffins and cream pies (Adeniji et al.,
2006). Ripe plantains are often sliced lengthwise, baked or boiled, and
served (perhaps with a garnish of brown sugar or chopped peanuts) as an
accompaniment for ham or other meats. Ripe plantain may be thinly sliced
and cooked with lemon juice and sugar to make jam or sauce, stirring
frequently during 20 or 30 minutes until the mixture jells. Whole, peeled
plantain can be spiced by adding them to a mixture of vinegar, sugar, cloves
Processing Banana and Plantain (Musa spp.) into Storable Food Products 89
and cinnamon which has boiled long enough to become thick and then
letting them cook for 2 minutes (Chandler, 1995).
Banana puree is important as infant food and can be successfully canned by
the addition of ascorbic acid to prevent discoloration. The puree is produces
on a commercial scale in factories close to banana fields and packed in
plastic-lined 10 cans and 55-gallon metal drums for use in baby foods, cake,
pie, ice cream, cheesecake, doughnuts, milk shakes and many other products
(Ogazi, 1996).
In Polynesia, there is a traditional method of preserving large quantities of
bananas for years as emergency food in case of famine (Ogazi, 1996). A pit is
dug in the ground and lined with banana and Heliconza leaves. The peeled
bananas are wrapped in Heliconza leaves, arranged in layer after layer, then
banana leaves are placed on top and soil and rocks heaped over all. The pits
remain unopened until the fermented food, called “masi”, is needed.
In Costa Rica, ripe bananas from as entire bunch are peeled and boiled slowly
for hours to make thick syrup which is called “honey” (Ogazi, 1996).
Through experimental work with a view to freezing peeled, blanched, sliced
green plantain, it has been found that, with a pulp-to-peel ratio of less than
1:3 the fruits turn gray on exposure to air after processing and this
discoloration is believed to be caused by the high iron content (4.28p/m) of
the surface layer of the flesh. Its reaction to the tannin normally present in
green bananas and plantains. At pulp to peel ratio of 1.0, the tannin level in
green bananas is 241.4mg; at 1.3, 151.0mg, and at 1.5, 112.6mg, per 100g
(Ogazi, 1996). Therefore, it is recommended that for freezing, green bananas
should be harvested at a stage of maturity evidenced by 1.5 pulp-to-peel
ratio. Such fruits have a slightly yellowish flesh, higher carotene content, and
are free of off-flavors. The slices are cooked by the consumer without
thawing (Ogazi, 1996).
Completely green plantains are 50% flesh and 50% peel (Ogazi, 1996).
Plantain for freezing should have a pulp content of at least 60% for maximum
quality in the ultimate food product, but a range of 55 to 65% is considered
commercially acceptable (Ogazi, 1996).
In Ghana, plantains are consumed at 5 different stages of ripeness (Chandler,
1995). Fully ripe plantains are often deep fried or cooked in various dishes.
A Ghanian pancake called “fatale” is made of nearly full ripe plantains and
fermented whole meal dough of maize, seasoned with onions, ginger, pepper
and salt, and fried in palm oil. “Kaklo” is the same mix but thicker and rolled
into balls which are deep-fried. Because home preparation is laborious, a
commercial dehydrated mix has been developed. In Ghana, green plantains
are boiled and eaten in stew or mashed, together with boiled cassava, into a
90 ABIODUN-SOLANKE and FALADE
popular plastic product called “fufu” which is eaten with soup. Because of
the great surplus of plantains in summer, technologists have developed
methods for drying and storing of strips and cubes of plantain for house use
in making “fufu” out of season. The cubes can also be ground into plantain
flour. Use of infra red, microwave, and extrusion systems have resulted in
high-quality finished products. Processing has the added advantage of
keeping the peels at factories where they may be converted into useful by-
products instead of being added to the bulk of household garbage (Chandler,
1995).
Banana or plantain flour, or powder, is made domestically by sun drying slices
of unripe fruits and pulverizing (Anon, 1999). Commercially, it is produced
by spray-drying, or drum-drying, the mashed fruits (Anon, 1999). The flour
can be mixed 50-50 with wheat flour for making cupcakes. Two popular
Puerto Rican foods are “pasteless” and “alcapurais” both are pastry stuffed
with meat, the first is wrapped in plantain leaves and boiled the latter is
fried. The pastry is made of plantain flour or a mixture of plantain with
cassava or cocoyam.
Commercial production and marketing of fried green plantain and banana
chips has been increasing in various parts of the world over the past 25 years
and these products are commonly found in retail groceries alongside potato
chips and other snack foods.
In Africa, ripe bananas and plantains are also processed into beer and wine.
The Tropical Products Institute in London has established a simple procedure
for preparing acceptable vinegar from fermented banana rejects (Anon,
1999)
Flour and Powder
Flour can be made from green unripe banana, cooking banana or plantain.
Fruits are hand-peeled and sliced or chopped into pieces about 5-10 mm
thick. The slices will be dried in the sun by spreading out the slices on mats,
on bamboo framework, on cement floors, or on a roof or sheets of
corrugated iron or simply on a sweptbare ground. Various designs of solar
dryers can also be used, or they may be dried in ovens, over fires, in a cabinet
dryer or tunnel dryer (Thompson, 1995). The fruits are either sun-dried which
is the former, oven-dried, the latter or foam-mat dried which will be
described now. Sun and oven-drying methods have been used for drying of
plantain and banana (Bowrey et al., 1980; Johnson et al., 1998; Demirel &
Turhan, 2003) with some success, the introduction of foam-mat drying
brought much more (Falade and Olugbuyi, 2009). Musa spp. especially
cooking banana is cheaper relatively when compared with wheat and other
cereals for the production of flours therefore processing of cooking banana
should be encouraged.
Processing Banana and Plantain (Musa spp.) into Storable Food Products 91
In foam-mat drying plantain puree was prepared by blending steam
blanched plantain and distilled water for 2 mins in a Waring blender to
produce a 30 ± 0.4% total solids (TS) paste. A 20% (w ⁄ w) glyceryl
monostearate (GMS) suspension is prepared by dissolving a known weight of
GMS in hot water at 100oC. The 20% suspension is added to obtain a 0.02%
GMS in the plantain paste. The mixture of plantain paste (30% TS) and GMS
suspension are then transferred into a Kenwood Chef mixer and whipped at
maximum speed for 4 mins until homogenous foam is obtained. The whipped
foam could be extruded using a manual Euroline icing syringe (Model 5
Nozzles stainless steel 19 cm, Euroline, Essex, UK) with an outlet orifice of 4
mm diameter on a stainless steel wire mesh and dried in a cross-flow
Gallenkamp Oven at 60oC for 45–90 mins. The dried plantain is scraped off
and packaged in low density polyethylene (100 μm) to prevent moisture
absorption (Falade and Olugbuyi, 2009). After drying, the chopped pieces
have a moisture content of about 5-10%. The dried pieces were ground and
usually sieved to produce the flour. The flour is packaged in moisture proof
bags. The dried slices are stored and only converted to flour when needed
since the flour tends to lose its flavour rapidly or may absorb moisture
(hygroscopic) and become mouldy.
Powder could be prepared from fully ripe banana, cooking banana or
plantain. Fruits are washed, hand-peeled and chopped fairly coarsely. The
material is converted into a paste by passing through a mill to reduce the
particle to a colloidal size (below about 10 μm). A 1-2% Sodium
metabisulphite solution is added at this stage to improve the colour of the
final product or to prevent discolouration. The material is then dried. Drying
can be achieved, either in a spray dryer (at 30 to 32°C and less than 30%
Relative Humidity under vacuum) or a drum dryer (product temperature
should not exceed 94°C). After drum drying it might be necessary to further
dry the product in a cabinet dryer. The final moisture content of the powder
should be about 2% and should be stored in moisture proof bags (Thompson,
1995).
Banana, plantain and cooking banana (Musa spp) may be processed into
many products at different stages of physiological maturity; unripe, ripe,
overripe or in a number of ways such as frying, grilling, boiling and drying.
According to Demirel & Turhan (2003), drying adds value to banana in
addition to preservation. Moisture removal from plantain seems to be an
appropriate and economical means of preserving Musa spp, resulting in shelf
stable and convenience products. Currently, unripe plantain flour is being
processed into a thick paste product known as ‘amala’ in the western part of
Nigeria, which is medically recommended for diabetic patient (Adeniji et al.,
2006). Ripe banana powder is used in bakery and confectionery industries, in
infant diets and the treatment of intestinal disorders (Adeniji et al., 2006).
92 ABIODUN-SOLANKE and FALADE
Improved cultivars of plantain and banana may provide high quality whole
flour from the entire fruit for livestock feed, which may eventually provide
protein in human diet from consumption of meat and other products of
livestock (Thompson, 1995.). Such flour may be employed in traditional
dishes for human consumption based on their nutritional profiles. Although,
there is need to investigate the application of whole Musa flour in baking and
confectioneries from the point of view of their pasting properties but that
notwithstanding it has recorded success when used in addition to the
conventional wheat flour. The use of entire fingers of plantain and banana
could be a rapid approach in flour production with improved levels of
nutrients, especially minerals, which are concentrated in the peel (Izonfuo
and Omuaru, 1988).
Canned slices
Several methods for canning banana slices in syrup have been described
(Thompson, 1995). Best quality slices are obtainable from fruit at an early
stage of ripeness. The slices are processed in syrup of 25° Brix with pH of
about 4.2 and in some processes calcium chloride (0.2%) or calcium lactate
(0.5%) are added as firming agent (Marriot and Lancaster, 1983). Canning
plantain slices in syrup are considered to be unsatisfactory (Sanchez-Nieva
and Hernandez, 1967). However, ripe slices may be cooked in 40° Brix syrup
until the concentration of the syrup reach 54-60° Brix and cinnamon and
lemon juice is added to improve the colour. The product may be packed in
boilable plastic pouches and quick frozen at -23°C. It is served by boiling the
pouches in water for 15 mins.
Chips (Crisps)
Various methods of preparing banana or plantain chips have been described
in the literature. Typically, unripe banana or plantain may be thinly sliced
vertically or transversely (1.2-0.8 mm thick) (Berg et al., 1971) The slices are
immersed in a sodium or potassium metabisulphate solution (to improve the
colour of the final product or to prevent discolouration) and fried in
hydrogenated oil at 180-200°C. The fried slices are dusted with salt and
antioxidant (e.g. butylatedhydroxytoluene to delay rancidity); (Marriot and
Lancaster, 1983). Alternatively slices may be dried before frying and the
antioxidant and salt are added with the oil. Fried chips should have moisture
content of about 1.5 to 2.0%. The temperature at which the chips are fried
and the frying time affects their oil content, appearance, texture and flavour
(Thompson, 1995). The chips must be packed in moisture proof bags to
prevent them absorbing moisture and losing their crispness.
Processing Banana and Plantain (Musa spp.) into Storable Food Products 93
Jam and Jelly
The various methods of preparing jam and jelly have been described in
several literatures. In one method for the preparation of jelly, fully ripe or
over-ripe fruits are used. Fruits are hand-peeled and cut into 2 cm pieces or
slices. The slices are boiled for 1 hr in 60° Brix sugar syrup at the rate of 1 lb
of banana to 1 pint of syrup (454 g to 0.5681). This is then strained and the
clear solution is boiled until it sets. The pH should be adjusted to 3.5. Pectin
may be added to improve the set (Thompson, 1995). A commercial formula
for producing banana jam is as follows (Thompson, 1995): 200 lbs of sugar,
10 gallons of water and 12 ounces of cream of tartar.
These are heated to 110°C and then 2.5 gallons of lemon juice (lime juice or
citric acid can be used to replace the lemon juice to reduce the pH of the jam
to 3.5) are added. The mixture is heated to 107°C until the correct
consistency is obtained.
MEDICAL USES
All parts of the banana plant have medicinal applications: the flowers in
bronchitis and dysentery and on ulcers; cooked flowers are given to
diabetics; the astringent plant sap in cases of hysteria, epilepsy, leprosy,
fevers, hemorrhages, acute dysentery and diarrhea, and it is applied on
hemorrhoids, insect and other stings and bites, young leaves are placed as
poultices on burns and other skin afflictions, the astringent ashes of the
unripe peel and of the leaves are taken in dysentery and diarrhea and used
for treating malignant ulcers, the roots are administered in digestive
disorders, dysentery and other ailments; banana seed mucilage is given in
cases of catarrh and diarrhea in India (Anon, 1999).
Antifungal and antibiotic principles are found in the peel and pulp of fully ripe
bananas. The antibiotic acts against Mycobacteria. A fungicide in the peel
and pulp of green fruits is active against a fungus disease of tomato plants.
Norepinephrine, dopamine and serotonin are also present in the ripe peel
and pulp. The first two elevate blood pressure; serotonin inhibits gastric
secretion and stimulates the smooth muscle of the intestines (Anon, 1999).
OTHER USES
Banana and plantain leaves are widely used as plates and for lining cooking
pits and for wrapping food for cooking or storage. A section of leaf often
serves as an eye-shade (Anon, 1999). In Latin America, it is a common
practice during rains to hold plantain leaf by the petiole, upside-down, over
one’s back as an “umbrella” or “raincoat” (Anon, 1999). The leaves of the
‘Fehi” banana are used for thatching, packing and cigarette wrappers. The
pseudomonas has been fastened together as rafts. Seat ads for benches are
94 ABIODUN-SOLANKE and FALADE
made of strips of dried banana pseudostems in Ecuador. In West Africa, fiber
from the pseudostem is values for fishing lines. In the Philippines, it is woven
into a thin, transparent fabric called “agna” which is the principal material in
some regions for women’s blouses and men’s shirts. It is also used for
making handkerchiefs. In Ceylon, it is fashioned into soles for inexpensive
shoes and used for floor coverings (Thompson, 1995).
Plantain fibre is said to be superior to that from bananas. In the mid-19th
Century, there was quite an active banana fiber industry in Jamaica.
Improved processes have made it possible to utilize banana fiber for many
purposes such as rope, table mats and handbags. A good quality paper is
made by combining banana fiber with that of the betel nut husk (Chandler,
1995).
Dried banana peel, because of its 30 to 40% tannin content is used to blacken
leather. The ash from the dried peel of bananas and plantains is rich in
potash and used for making soap. That of the burned peel of unripe fruits of
certain varieties is used for dyeing (Ogazi, 1996).
ANIMAL FEED
Rejected ripe bananas, supplemented with protein, vitamins and minerals,
and are commonly fed to swine. Green bananas are also used for fattening
hogs but, because of the dryness and astringency and bitter taste due to the
tannin content, these animals do not care for them unless they are cooked,
which makes the feeling costs too high for most growers. Therefore,
dehydrated green banana meal has been developed and, though not equal to
grain, can constitute up to 75% of the normal hog diet, 40% of the diet of
gestating sows. It is not recommended for lactating sows, nor is ripe bananas
even with a 40% protein supplement (Anon, 1999).
Beef cattle are very fond of green bananas whether they are whole, chopped
or sliced. Because of the fruit’s deficiency in protein, urea is used at the rate
of 8.8 lbs (4 kg) per ton, with a little molasses mixed in to mask the flavor. But transportation is expensive unless the cattle ranch is located near the
banana fields. A minor disadvantage is that the bananas are somewhat
laxative and the cattle need to be washed down daily. With dairy cattle, it is
recommended that bananas constitute no more than 20% of the feed
(Chandler, 1995).
In the Philippines, it has been found that meal made from dehydrated reject
bananas can form 14% of total broiler rations without adverse effects. Meal
made from green and ripe plantain peels has been experimentally fed to
chicks in Nigeria. Flour from unpeeled plantains, developed for human
consumption, was fed to chicks in a mixture of 2/3 flour and 1/3 commercial
chick feed and the birds were maintained until they reached the size of
Processing Banana and Plantain (Musa spp.) into Storable Food Products 95
fryers. They were found thinner and lighter than those on 100% chick feed
and the gizzard lining peeled in shreds. It was assumed that these effects
were the result of protein deficiency in the plantains, but they were more
likely the result of the tannin content of the flour which interferes with the
utilization of protein (Anon, 1999).
Leaves, pseudostems, fruit stalks and peels after chopping, fermentation and
drying, yield a meal somewhat more nutritious than alfalfa press cake. This
waste material has been considered for use as organic fertilizer in Somalia. In
Malaya, pigs fed the pseudostems are less prone to liver and kidney parasites
than those on other diets.
Banana peel contains beta sitosterol, stigmasterol, campesterol,
cyclocucalenol, cycloartanol and 24-methylene cycloartanol (Anon, 1999).
The major constituents of banana peel are 24-methylene cuycloartanol
palmitate and an unidentified triterpene ketone (Anon, 1999)
REFERENCES
Adeniji, T.A., Barimalaa, I.S. & Achinewhu, S.C. (2006). Evaluation of bunch
characteristics and flour yield potential in black Sigatoka resistant plantain and
banana hybrids. Global Journal of Pure and Applied Science, 12, 41–43.
Anon. 1999. Two is enough – really. Sweet tidings on treating high blood pressure.
Asiaweek. March 19, 1999.
Berg, J. R., Berg, R. C. Sarna, E. J. & Bates, B. 1971. Banana and plantain products and
process for preparing same. British Patent 1:232, 773.
Bowrey, R.G., Buckle, K.A., Hamey, I. & Pavenayotin, P. (1980). Use of solar energy for
banana drying. Food Technology in Australia, 32, 290–291.
Chandler S. 1995. The nutritional value of bananas. Pp; 486-480 in Bananas and
Plantains (S. Gowen, ed.). Chapman & Hall, UK.
Daniells, J., Jenny, C., Karamura, D., and Tomekpe, K. 2001. Musalogue: a catalogue
of Musa germplasm. Diversity in the genus Musa (E. Arnaud and S. Sharrock,
compil.). International Network for the Improvement of Banana and Plantain
(INIBAP), Montpellier, France. <www.inibap. org/publications/musalogue.pdf>.3-336.
Demirel, D. & Turhan, M. (2003). Air drying behaviour of dwarf Cavendish and Gros
Michel Banana slices. Journal of Food Engineering, 59, 1–11.
Falade K.O. & Olugbuyi A.O. (2009). Effects of maturity and drying methods on the
physico-chemical and reconstitution properties of plantain flour. International
Journal of Food Science and Technology 2010, 45, 170–178.
96 ABIODUN-SOLANKE and FALADE
FAO (2004) FAO. http://www.faostat.fao.org (02 ⁄ 2008).
Frison, E.A. & Sharrock, S.L. (1999). Introduction: the economic, social and nutritional
importance of banana in the world. In: Bananas and Food Security (edited by C. Picq,
E. Foure´ & E.A. Frison). Pp. 21–35. International Symposium, Douala, Cameroon, 10–
14 November, 1998. France: INIBAP.
Izonfuo W-A.L. and V.O.T. Omuaru (1988). Effect of Ripening on the Chemical
Composition of Plantain Peels and Pulps (Musa paradisiaca). Journal of the Science of
Food and Agriculture. 45, 33.
Johnson, P.N.T., Brennan, J.G. & Addo-Yobo, F.Y. (1998). Airdrying characteristics of
plantain (Musa AAB). Journal of Food Engineering, 31, 233–242.
Marriott, J. & Lancaster, P. A. (1983). Bananas and plantains. Pp. 85-143 in Handbook
of Tropical Foods (H. T. Chan Jr, ed.) Marcel Dekker Inc., New York and Basel.
Ogazi P.O. (1996). Plantain: production, processing and utilisation. Paman Associates
Ltd., Imo State, Nigeria, 305pp.
Robinson J.C. (1996). Bananas and Plantains. Crop Production Science in Horticulture.
(5). CAB International, Wallingford, U.K.
Sanchez-Nieva, F. & Hernandez, I. (1967). Preparation and preservation for freezing
of ripe plantains in syrup. Misc. Pub. 7. Food Tech. Lab., Agric. Expt. Stat., Univ. of
Puerto Rico. (in. Spanish).
Thompson, A. K. (1995). Banana processing. Pp. 481-492 in Bananas and Plantains (S.
Gowen, ed.). Chapman & Hall, London, UK.
Valmayor, R.V., Jamaluddin, S.H., Silayoi, B. et al. (2000). Banana cultivar names and
synonyms in Southeast Asia. In: Proceedings of International Network for the
Improvement of Banana and Plantain – Asia and the Pacific Office, pp. 24.
Philippines: Los Ban˜ os, Laguna.
J. Agric. Res. & Dev.9(2). Copy@2010. Faculty of Agriculture, University of Ilorin
Implications of structural policies on the wheat market – comparative static
and dynamic analysis for the EU and US
JADWIGA ZIOLKOWSKA
Humboldt University of Berlin
Chair for Agricultural Policy
Germany
ABSTRACT
Structural policy instruments can directly influence agricultural production, productivity, and
other market variables. Using a Cobb-Douglas market model, we quantitatively assess national
and global implications of structural policies on the wheat market, determined by technical
progress and other structural policy measures in 2005-2020. With a comparative-static and
comparative-dynamic analysis for the European Union (EU-27) and the United States of
America (US) (as leading wheat exporting countries), we show that structural policies (e.g.
technical progress) on the wheat market in the analyzed countries brings about an increase of
the producer surplus; however, it has negative impact on national budgets in the EU-27 and
the US, regardless of the implemented price policies. Moreover, structural policies
implemented over time contribute to an increase of welfare, producer surplus, and budget
expenditures in the analyzed countries. A global effect of national structural policies in the EU-
27 and the US is a continuously decreasing world market price of wheat. Structural policies in
the analyzed countries bring about global positive effects for the economies of other countries
in the world, e.g., growing welfare and consumer surplus, while negative effects for producers
in the rest of the world.
Keywords: Structural policy, technical progress, dynamic market effects, wheat market
INTRODUCTION AND RESEARCH QUESTION
Wheat is the most important cereal crop in the world. In 2007, the world
wheat production amounted to 607 million tons (FAO, 2008), and the biggest
wheat exporters were United States, Russia, the European Union (EU-27),
Canada, and Argentina (OECD, 2007). In the European Union (EU), internal
prices of wheat and other cereals are, on the average, higher than world
market prices. In order to support national producers, the export of the
European cereal crops is subsidized. A different price policy is implemented
in the United States of America (US), where the wheat production is not
directly subsidized, but free trade on the wheat market is allowed (see:
Ziolkowska et al., 2009). Price policies determine directly wheat market
prices and the wheat production.
98 J. ZIOLKOWSKA
However, wheat supply can be influenced also by other instruments, such as
structural policies.
The term ‘structural policy’ used in this paper refers to national policies on
the wheat market in the European Union and the United States. Structural
policy refers to a bundle of measures and activities (undertaken by the
national governments and followed by farmers) which influence economic
structures or else economic conditions on markets. With a structural policy,
changes in an economy, caused by technical progress, globalization, or
structural change, should be weakened, in order to reach overall economic
equilibrium.
In the analyzed case of the wheat market, we define structural policies as
measures and activities that directly influence suppliers (wheat producers),
thus leading to shifts of the supply curve and finally to changes of market
variables, such as welfare, producer surplus, and consumer surplus.
Several studies have been undertaken in recent years on the subject of
wheat production from the background of food price policies to improve
food production efficiency. Amid (2007) analyzed self-sufficiency of wheat
production in Iran and addresses political difficulties in introducing reforms
which could reduce the need for import. Da Silva and Grennes (1999)
investigated the change of market policy from protectionist to free trade
policy on the wheat market in Brazil and emphasized implications for the
national food economy. Studies referring to effects of price policies on the
wheat market have been conducted also in 1990s and before this time,
especially in developing countries. Azzam (1991) for example, presented a
three-sector model for analyzing effects of subsidy policies on the Moroccan
soft wheat market. The price intervention policy has also been addressed by
Muchnik and Allue (1991) who analyzed price bounds and objectives of the
price policies on the wheat market in Chile. Morris (1989) provided an
operational method for measuring comparative advantage for the wheat
market policy in Zimbabwe.
Most of the recent studies on wheat and wheat market analyze the question
of price policies and their implications for national economies. However, the
questions of the influence of different productivities in the leading wheat
exporting countries and structural policy implications, both on the world
market of wheat and on third countries , have not yet been analyzed
explicitly. This paper contributes to current discussions on structural policies
on the wheat market in the EU-27 and the US and implications for the rest of
the world.
Implications of structural policies on the wheat market in EU and US 99
In the paper, two cases of structural policies are visualized by the shift of the
supply curve to the right: a) structural policy determined by technical
progress, and b) structural policy determined by other political instruments.
We analyze the global wheat production and do not investigate different
internal and external factors influencing the wheat production.
In order to investigate the impacts of changing structural policies, we
quantitatively estimate dimensions of market changes by analyzing market
variables. The paper has an explorative character, as little research has been
done on the question of changing productivity and structural policies on the
wheat market. Using a simple market model, we make an attempt to
quantitatively assess potential developments and trends on the wheat
market by different scenarios of structural policies in the European Union
and the US. Particularly, we focus our analysis on changes of producer
surplus, budget expenditures, and welfare as a result of increasing technical
progress and of implementing structural policy instruments over time.
THEORETICAL FRAMEWORK
Structural policies are usually financed by national budgets; however, also
structural policies without financial contributions from the state budgets are
common, as a result of changing legal rules and production conditions.
For the analyzed case of the EU-27 and the US, we define structural policy as
a policy addressing economic conditions of political economies. Apart from
inter-provincial and international trade, training, regulations (such as rules
governing the financial sector), and tax policies, structural policies include
also support for technical research and development (compare: Department
of Finance Canada, 2008). We explicitly undertake one of the structural
policy issues – technical progress and define it as changes and technical
innovations that can result from new applications of knowledge, improved or
new methods, work processes and proceedings, and finally new products
(BZfPB, 2004). Technical progress brings about changes in the relations of
applied production factors, changes in the production, and subsequently, an
increase of productivity. As a result of technical progress, the input-output
relation can be improved, while a certain production amount (output) is
produced by means of a possibly low input of production factors or else a
possibly high production is achieved by means of a certain input of
production factors. Technical progress makes possible to reduce production
costs and to increase the productivity. This development brings
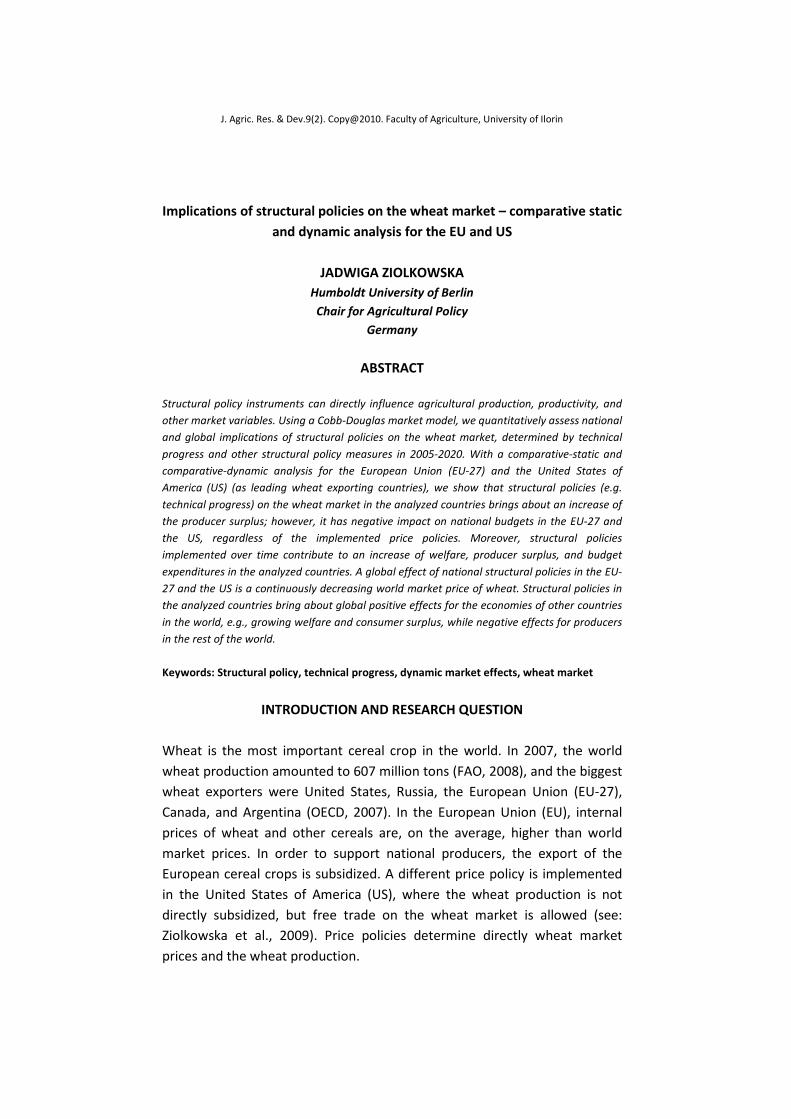
100 J. ZIOLKOWSKA
about the shift of the supply curve (S) to the right (S’), which influences again
other variables on the wheat market (figure 1).
The change of a structural policy in a closed economy (and the shift of the
supply curve to the right) brings about a change of the market equilibrium:
the equilibrium quantity is growing (change from q to q’) while the
equilibrium price is decreasing (change from p to p’). As a result, in the
equilibrium, the consumers can purchase higher amount of a product for a
lower price (consumer surplus is growing), while producers have to produce
for a lower price (producer surplus is decreasing). However, at the same
time, producers are benefiting just from the structural policy and the shift of
the supply curve. These distribution effects will directly influence welfare
changes that are defined in the case of a closed economy as a change of
consumer surplus and a change of producer surplus. As an effects of
structural policy, welfare is growing (shaded area between S and S’ curves in
figure 1).
Figure. 1. Distributional effects of structural policies in a closed economy.
Source: Jechlitschka et al. (2007): 103
p
q q , qs d
p , ps d
p
q
D
Loss of producer surplus Gain in
consumer surplus
Welfare gain
Gain in producer surplus
S
(+)
(-)
S
Implications of structural policies on the wheat market in EU and US 101
METHODOLOGY AND DATA
We analyze the implications of technical progress and of other policy
instruments on the wheat market in the EU and the US by means of the
Cobb-Douglas market model, following the theoretical concept of Kirschke
and Jechlitschka (2002). In the model, the supply and demand functions
include the following variables: world market price, national demand and
supply prices, demand and supply quantities, and demand and supply price
elasticities for the respective countries (Ziolkowska et al., 2009). We adopt
the world market price for wheat as reported at the US Gulf Ports in 2006
and 2007 (142.8 €/t), and we abstract simultaneously from additional
transport costs. We estimate the national supply and demand prices of
wheat using Nominal Protection Coefficient (NPC) Indicators developed by
the Organization for Economic Co-operation and Development (OECD); both
Producers NPC (for estimation of supply prices) and Consumers NPC (for
estimation of demand prices). The producer NPC measures the ratio
between the average price received by producers (at farm gate), including
payments based on output, and the border price (at the farm gate). The
consumer NPC measures the ratio between the domestic price paid by
consumer (at the farm gate) and the border price (at the farm gate) (OECD,
n.d.). Thus, these indicators reflect a ratio between national and border
prices and allow estimating producer and consumer prices. This estimation is
necessary, as demand prices are not available in any official database.
According to these estimations, two different price policies were identified
for the analyzed countries on the wheat market: free trade in the US and
export subsidy of 7% in the EU-27.
We use the statistical database from the OECD to identify the demand and
supply quantities, as well as the Food and Agricultural Policy Institute (FAPRI)
and United States Department of Agriculture (USDA) databases for
estimation of demand and supply price elasticities (FAPRI, 2007; USDA,
2007). The demand and supply price elasticities were derived from external
databases due to missing quantitative and qualitative data that was
necessary for statistical estimations. Using the above data, we define the
supply (production) and demand (consumption) functions (formula 1 and 2)
in the situation without any
102 J. ZIOLKOWSKA
structural policy changes (basis scenario).
(1) )(s s
s p*c)p(q ε=
(2) )(dd d
p*d)p(q ε=
with:
ps – supply price pd – demand price
qs – supply quantity qd – demand quantity
c – supply constant d – demand constant
sε – supply elasticity dε – demand elasticity.
In order to analyse changes of the production function resulting from an
increasing productivity (technical progress or other structural policy
instruments over time), we integrate a shift parameter ‘f’ into the supply
function (formula 3).
(3) )(s ss p)f1(c)p(q ε×+×= ;
sε > 0
with:
f – shift parameter.
Following, we calibrate the model on the basis of the supply and demand
constants.
The demand function does not change its form, as technical progress or
other structural instruments do not influence the demand for wheat. As
technical progress also influences production costs, we integrate the shift
parameter in the cost function (1+f) (formula 4). Additionally, the change of
the supply curve implies changes of price elasticities (ɛs + 1) which results
from the calculation way of the cost function (ps × qs refers to the change of
economy equilibrium, while the second part of the formula and its
calculation are related to the change of the slope of the supply curve).
(4) )1()1(
)1(
fpcqpC s
s
sss +××−×= ++
εε
with:
C – production costs.
Implications of structural policies on the wheat market in EU and US 103
The shift parameter ‘f’ (reflecting an average annual increase of wheat
yields) was estimated with discrete estimation as a slope parameter (ln yt =
ln y0 + wt), basing on the wheat yields in the time 1995-2004. Hence,
following parameters were included in the analysis:
f (EU-27) = 0.61%
f (USA) = 1.35%
The shift parameter f = 0.0061 indicates that, in the analyzed time period,
the wheat yield in each following year was growing by 0.61% on average as
compared to each previous year. The supply and demand functions were
estimated using the formulas 3 and 2, respectively. The calibration of the
model was conducted on the basis of the supply and demand constants. For
this purpose, the supply and demand constants (‘c’ and ‘d’) were set initially
to 1. In this way, the supply and demand calibration parameters have been
estimated, assuming a case that the constants are equal. Further, calibration
parameters have been used to estimate the exact constants of the demand
and supply curves in the situation of export subsidy in the EU and free trade
in the US. The constants have been estimated as follows: c = qs/supply
calibration parameter and d = qd/demand calibration parameter. The Cobb-
Douglas market model in the basis scenario for the EU and the US is
presented in figure 2.
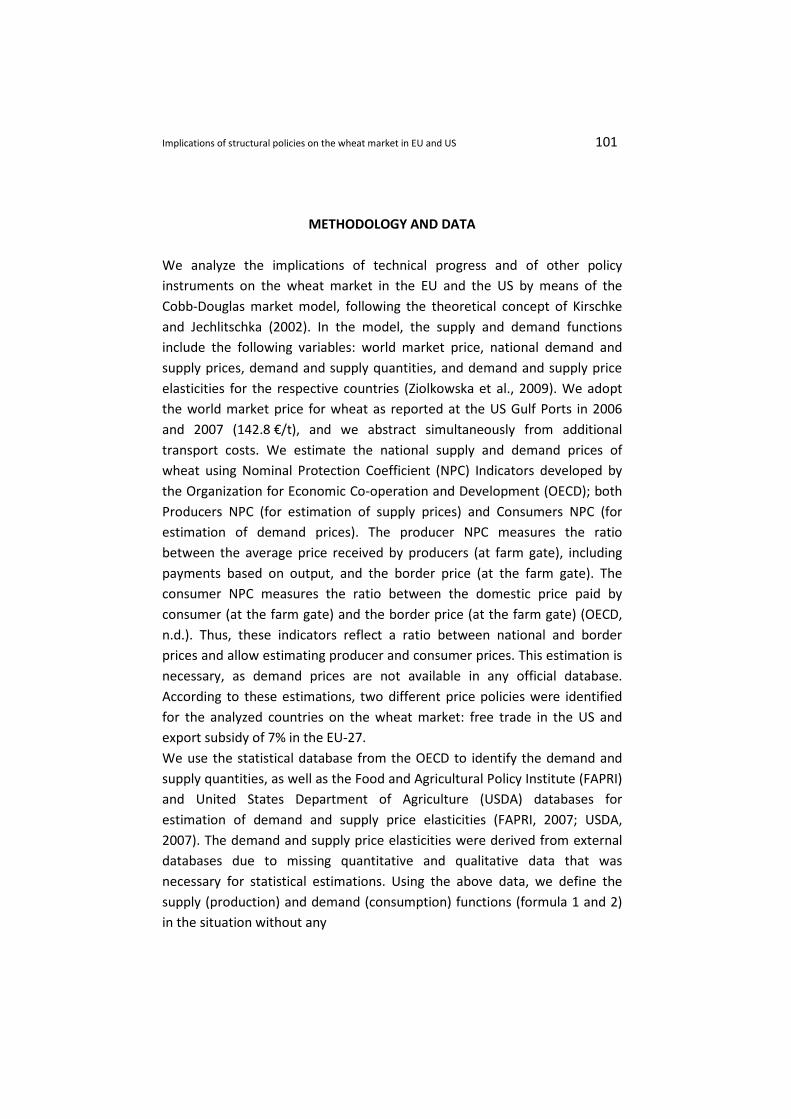
Figure. 2. Cobb-Douglas market model for the EU-27 and the US in basis
scenario.
Source: Author’s calculation
Cobb-Douglas market model - EU-27
ps pd pw Supply Demand152.80 152.80 142.80 133.35 125.63
4.52 0.22
Constants: Price elasticities Shift parameterc d of supply of demand f
29.3 568.0 0.3 -0.3 0.0061
Calibration parameter
Cobb-Douglas market model - US
ps pd pw Supply Demand142.80 142.80 142.80 58.06 31.19
5.68 0.07
Constants: Price elasticities Shift parameterc d of supply of demand f
10.1 454.6 0.35 -0.54 0.0135
Calibration parameter
104 J. ZIOLKOWSKA
Technical progress can influence the production quantity and production
costs, thus, the supply is influenced not only by the supply price, supply price
elasticity, or supply amount. In the paper, we quantitatively assess the
impact of technical progress on the wheat markets in the EU-27 and the US,
and focus our research on welfare, producer surplus, and budget
expenditures. We calculate the named market variables as follows:
Welfare = benefits – costs + foreign exchange,
Producer surplus = revenue – costs,
Budget expenditures = supply*(pw – ps) – demand*(pw – pd).
The basis (reference) situation on the wheat market is presented with the
shift parameter f = 0 (without technical progress and without any other
structural instruments influencing the wheat supply). In order to estimate
the impact of structural policies as a result of technical progress, we analyze
a second situation with the shift parameter f = 0.61% for the European Union
and 1.35% for the US. Further, we estimate welfare, producer surplus, and
budget expenditures for both scenarios.
In the basis scenario, current price policies in the EU-27 and in the US are
displayed: export subsidy in the EU and free trade in the US, respectively.
For the analyzed research question, we first abstract from the time-
referenced perspective and investigate a comparative-static market system
in which productivity changes at a given point of time determine changes of
other market variables at the same point of time. In this model, a “small
country” presumption applies, which means that the price policies of the
analyzed countries have no impact on the world market price. Thus, the
assumed world market prices are constant.
In a next step, we extend the analysis on implications of time-referenced
changes on the wheat market by other structural policy instruments with a
comparative-dynamic system by including the time parameter (n) and
calculating the shift parameter fn for the respective years 2005-2020
(formula 5):
(5) )1(1 −+= nn ff
with:
n – time parameter for the respective years (2005-2020), n = 0, …, 15
fn - shift parameter for the respective years n
Implications of structural policies on the wheat market in EU and US 105
f - shift parameter estimated for the analysis in the basis scenario (f (EU-27) =
0.61%, f (USA) = 1.35%).
Following, we investigate budget expenditures, producer surplus, and
welfare in the analyzed years for the calculated shift parameters over time.
RESULTS AND DISCUSSION
Implications of technical progress on the wheat market in the EU-27
By increasing productivity resulting from technical progress, the supply curve
moves to the right. This structural policy in the EU-27 would induce an
increase of welfare by 86.9 million €, which simultaneously superposes
welfare losses resulting from the protectionist price policy. Hence, compared
to the free trade situation without technical progress, welfare is still positive,
apart from negative welfare effects of the protectionist price policy.
Technical progress also brings about an increase of producer surplus, which
is caused by growing supply quantity under the condition of unchanged
national wheat prices. The results show that when implementing
protectionist price policy in the EU-27, growing productivity would
contribute to an increase of producer surplus by 95 million € as compared to
the basis situation without any structural policy instruments. On the
contrary, growing productivity negatively influences budget expenditures.
When implementing structural policies in the EU-27 the expenditures
induced by the protectionist price policy would increase by 8.1 million €.
Similar implications of technical progress were found for the free trade
situation on the wheat market in the US. The shift of the supply curve to the
right, resulting from technical progress, brings about an increase of producer
surplus and welfare. Thereby, the increase of both variables is similar (81.1
million €), which indicated an increase of producer surplus by 1.33% and of
welfare by 1.05%, as compared to the situation without structural policies.
The budget expenditures under free trade amount to zero.
The analysis proves that regardless of the price policy instrument
implemented on the wheat market (protectionist policy in the EU-27, free
trade in the US) the tendencies in implications of structural policies on the
market variables in the analyzed countries are similar. Indeed, structural
policy in the free trade situation has no negative effects for the national
budget, which is to expect when implementing protectionist price policy.
106 J. ZIOLKOWSKA
Implications of structural policy on the wheat market in the EU-27 over
time
Shifts of the supply curve can be evoked by growing productivity (effected by
technical progress, private and public expenditures) or by other structural
policy instruments that, however, do not require financial support from the
national budgets. The effects of structural policies can be comparably
measured in the course of time for several years. In order to estimate these
effects quantitatively, we adjust and rebuild the comparative-static model to
the comparative-dynamic one, and estimate changes of market variables
over the time period of 15 years (2006-2020) in the EU-27. With this
comparative-dynamic model, we estimate market variables for each year and
compare them over the analyzed time period. In order to differentiate
between technical progress and other structural policy measures (e.g., in
situations without budget expenditures for productivity increase), we
investigate two situations of structural policies:
1) Structural policy effected only by technical progress (the shift parameter f
= 0.61%), and
2) Structural policy effected by other political measures that can influence
the shift of the supply curve apart from technical progress (the shift
parameter f = 0.91%).
The shift parameter for the second analyzed situation was assumed as 50%
of the structural policy effected by technical progress. This assumption is
necessary as no empirical data and estimations on effects of structural policy
measures over time are available. Thereby, the analyzed market system has
an exemplary character and aims at showing potential changes and
implications of different policy scenarios.
For the analyzed situation, we assume constant national and world prices on
the wheat market. The analysis has a prognosis character; and statements
about the future development on the wheat market are made basing on
results of time series analysis. Therefore, we investigate differences between
the analyzed two situations as net effects of structural policies. The net
effects are defined as changes of budget expenditures, producer surplus, and
welfare (in the second analysed situation) compared to the first situation
reflecting structural policy determined only by technical progress.
The analysis shows that in the analyzed time period, welfare, producer
surplus, and budget expenditures in the EU-27 grow continuously.
Implications of structural policies on the wheat market in EU and US 107
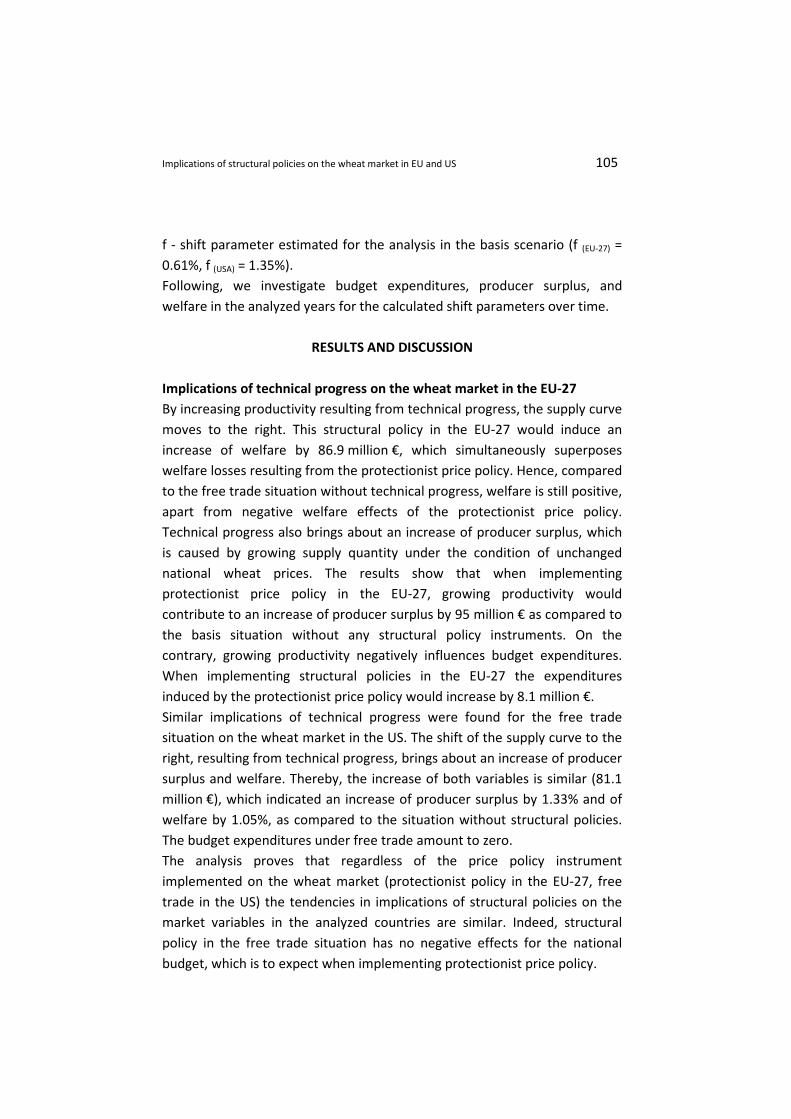
Figure 3 shows that in the scenario of structural policy determined by
technical progress, the welfare would increase by 1,361.4 million € in 2020,
which is 6.4% more than in 2005. Thus, the welfare change is relatively small
over the analyzed time period. Other structural policy measures would
contribute to a welfare increase of 2,074.5 million €, which is 9.8% as
compared to the welfare level in 2005. Thus, apart from the triggers of the
structural policy (technical progress or other structural policy instruments),
the welfare changes are not very significant in the analyzed time period.
Figure. 3. Changes of welfare as result of technical progress and other
structural policy instruments by protectionist price policy in the EU-27 in
2005-2020.
Source: Authors’ calculation
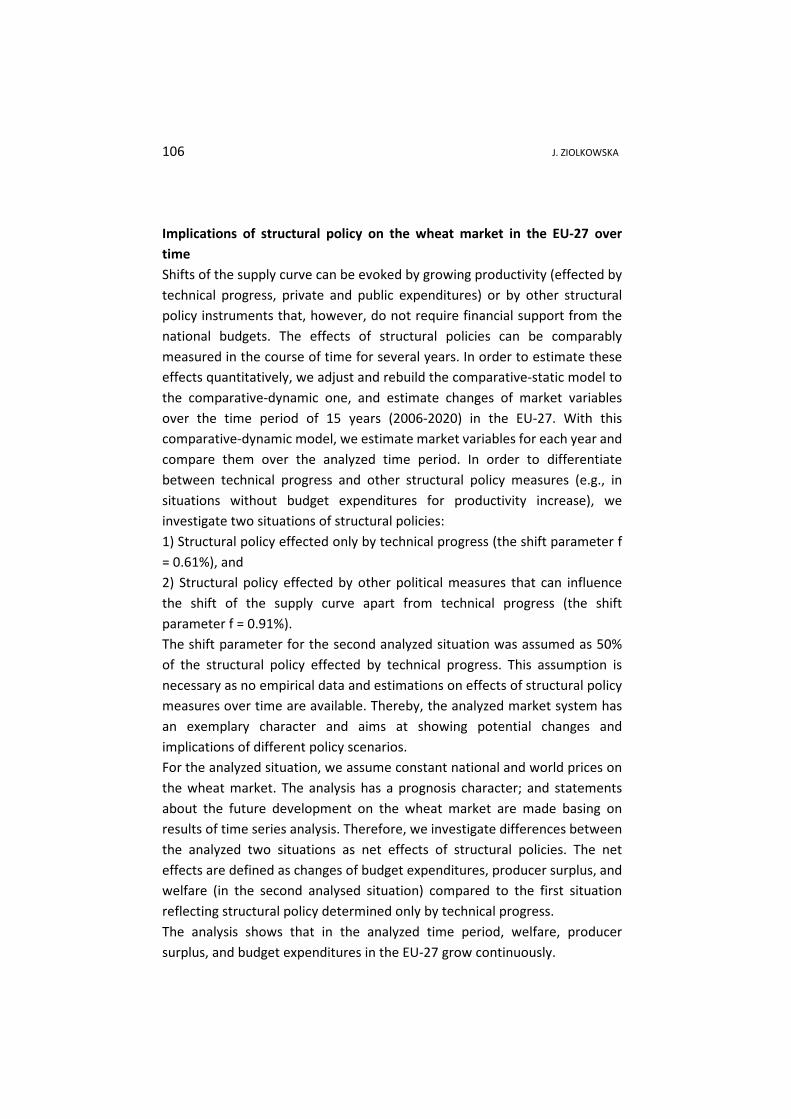
More significant changes were found for producer surplus and budget
expenditures. According to the analysis, technical progress would bring
about an increase of producer surplus by 1,488 million € (9.6%) in 2020,
while other structural policy instruments by 2,267.4 million € (14.6%), as
compared to the basis scenario in 2005 (figure 4).
Simultaneously, technical progress would positively influence budget
expenditures which are in 2020 almost three times as high as in 2005 (an
increase of 126.6 million €). Other structural policy instruments would bring
about almost four times higher budget expenditures than in 2005 (an
increase of 192.9 million €).
21000
22000
23000
24000
2005 2006 2007 2008 2009 2010 2011 2012 2013 2014 2015 2016 2017 2018 2019 2020
years
in m
illion
€
Welfare - f = 0.61% Welfare - f = 0.91%
108 J. ZIOLKOWSKA
The analysis shows also that the increase of the analyzed variables in the
scenario with structural policy measures is considerably higher. The
difference between the values of the variable in the first situation (technical
progress) and in the second situation (other structural policy instruments)
indicates net effects of structural policies on the wheat market in the EU-27.
As absolute changes of welfare, producer surplus and budget expenditures
have a growing tendency, the net effects of structural policies are also
positive and growing.
Figure. 4. Changes of producer surplus as result of technical progress and
other structural policy instruments by protectionist price policy in the EU-27
in 2005-2020.
Source: Authors’ calculation
World market effects of growing productivity in the EU-27 and US
Structural policies in the leading wheat exporting countries influence also
third countries (rest of the world). In a next step, we expand the analysis and
investigate, how far structural policies on the EU wheat market (in the
situation of protectionist price policy) and on the US wheat market (in the
free trade situation) would influence the world market price of wheat and
market variables in third countries in 2005-2020. This investigation can be
seen as a prognosis analysis. We assume constant national prices for wheat
and estimate structural policy as an effect of technical progress, thus
assuming the shift parameters f = 0.61% (for the EU-27) and 1.35% (for the
US). For the analysis of
15000
16000
17000
18000
2005 2006 2007 2008 2009 2010 2011 2012 2013 2014 2015 2016 2017 2018 2019 2020
years
in m
illion
€
Producer surplus - f = 0.61%Producer surplus - f = 0.91%
Implications of structural policies on the wheat market in EU and US 109
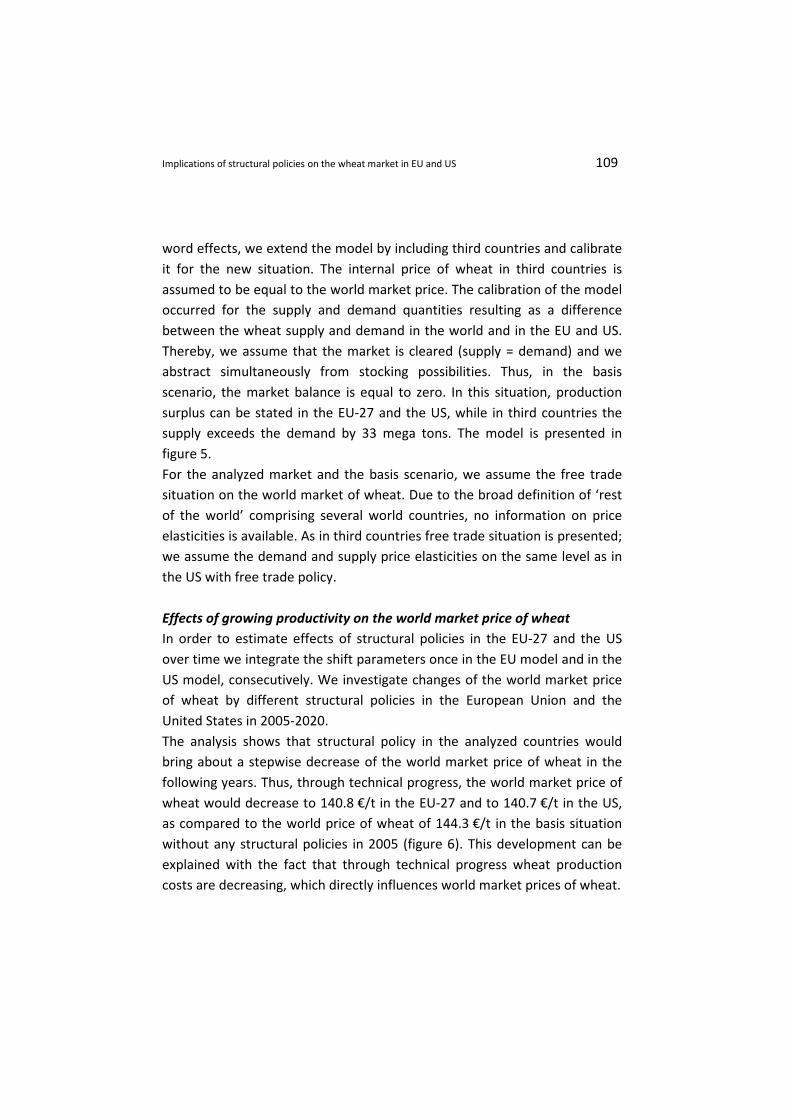
word effects, we extend the model by including third countries and calibrate
it for the new situation. The internal price of wheat in third countries is
assumed to be equal to the world market price. The calibration of the model
occurred for the supply and demand quantities resulting as a difference
between the wheat supply and demand in the world and in the EU and US.
Thereby, we assume that the market is cleared (supply = demand) and we
abstract simultaneously from stocking possibilities. Thus, in the basis
scenario, the market balance is equal to zero. In this situation, production
surplus can be stated in the EU-27 and the US, while in third countries the
supply exceeds the demand by 33 mega tons. The model is presented in
figure 5.
For the analyzed market and the basis scenario, we assume the free trade
situation on the world market of wheat. Due to the broad definition of ‘rest
of the world’ comprising several world countries, no information on price
elasticities is available. As in third countries free trade situation is presented;
we assume the demand and supply price elasticities on the same level as in
the US with free trade policy.
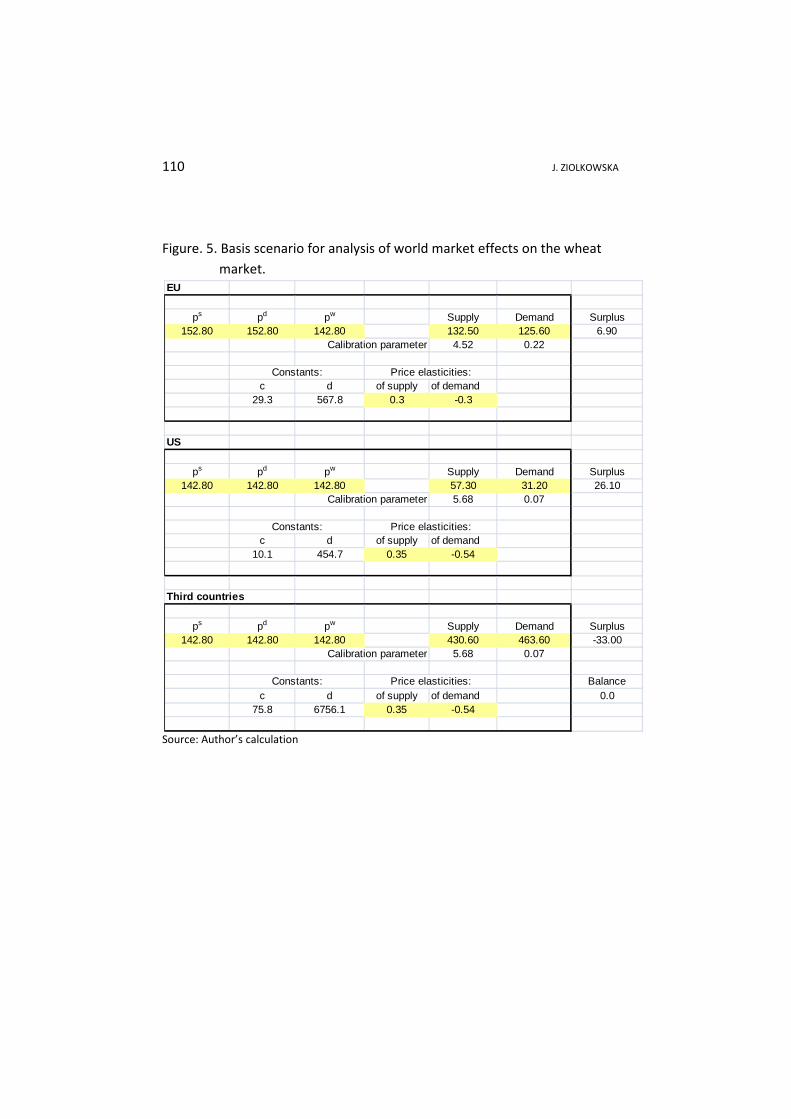
Effects of growing productivity on the world market price of wheat
In order to estimate effects of structural policies in the EU-27 and the US
over time we integrate the shift parameters once in the EU model and in the
US model, consecutively. We investigate changes of the world market price
of wheat by different structural policies in the European Union and the
United States in 2005-2020.
The analysis shows that structural policy in the analyzed countries would
bring about a stepwise decrease of the world market price of wheat in the
following years. Thus, through technical progress, the world market price of
wheat would decrease to 140.8 €/t in the EU-27 and to 140.7 €/t in the US,
as compared to the world price of wheat of 144.3 €/t in the basis situation
without any structural policies in 2005 (figure 6). This development can be
explained with the fact that through technical progress wheat production
costs are decreasing, which directly influences world market prices of wheat.
110 J. ZIOLKOWSKA
Figure. 5. Basis scenario for analysis of world market effects on the wheat
market.
Source: Author’s calculation
EU
ps pd pw Supply Demand Surplus152.80 152.80 142.80 132.50 125.60 6.90
4.52 0.22
Constants: Price elasticities:c d of supply of demand
29.3 567.8 0.3 -0.3
US
ps pd pw Supply Demand Surplus142.80 142.80 142.80 57.30 31.20 26.10
5.68 0.07
Constants: Price elasticities:c d of supply of demand
10.1 454.7 0.35 -0.54
Third countries
ps pd pw Supply Demand Surplus142.80 142.80 142.80 430.60 463.60 -33.00
5.68 0.07
Constants: Price elasticities: Balancec d of supply of demand 0.0
75.8 6756.1 0.35 -0.54
Calibration parameter
Calibration parameter
Calibration parameter
Implications of structural policies on the wheat market in EU and US 111
Figure. 6. World market price of wheat by growing productivity in the EU-27
and US in 2005-2020.
Source: Author’s calculation
Figure 6 shows that a similar tendency was found for the world market prices
of wheat, determined by technical progress in the US. Therefore, the
estimated prices are almost on the same line regardless of different price
policies implemented in the analyzed countries. The analysis shows that
technical progress indeed determines the world market price of wheat;
however, the impact of structural policies on the wheat market is quite
similar for big wheat exporting countries.
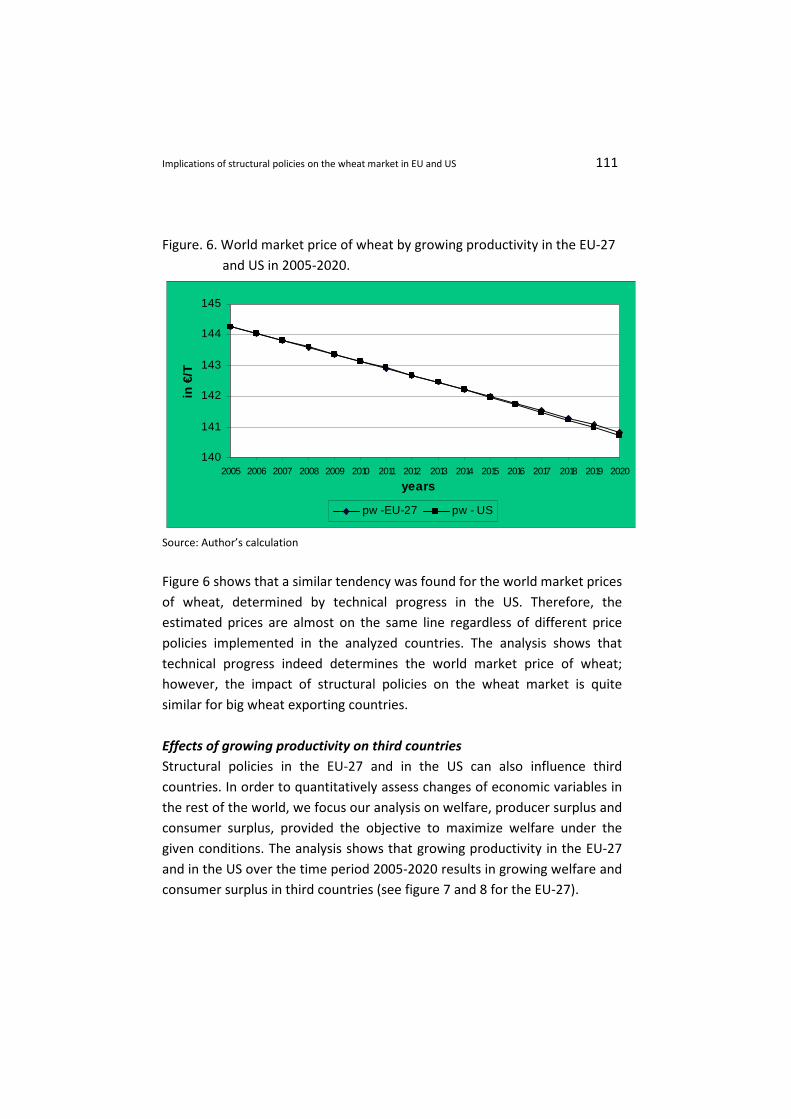
Effects of growing productivity on third countries
Structural policies in the EU-27 and in the US can also influence third
countries. In order to quantitatively assess changes of economic variables in
the rest of the world, we focus our analysis on welfare, producer surplus and
consumer surplus, provided the objective to maximize welfare under the
given conditions. The analysis shows that growing productivity in the EU-27
and in the US over the time period 2005-2020 results in growing welfare and
consumer surplus in third countries (see figure 7 and 8 for the EU-27).
140
141
142
143
144
145
2005 2006 2007 2008 2009 2010 2011 2012 2013 2014 2015 2016 2017 2018 2019 2020
years
in €
/T
pw -EU-27 pw - US
112 J. ZIOLKOWSKA
Figure. 7. Influence of growing productivity in the EU-27 in 2005-2020 on
welfare in third countries.
Source: Author’s calculation
Figure. 8. Influence of growing productivity in the EU-27 in 2005-2020 on
consumer surplus in third countries.
Source: Author’s calculation
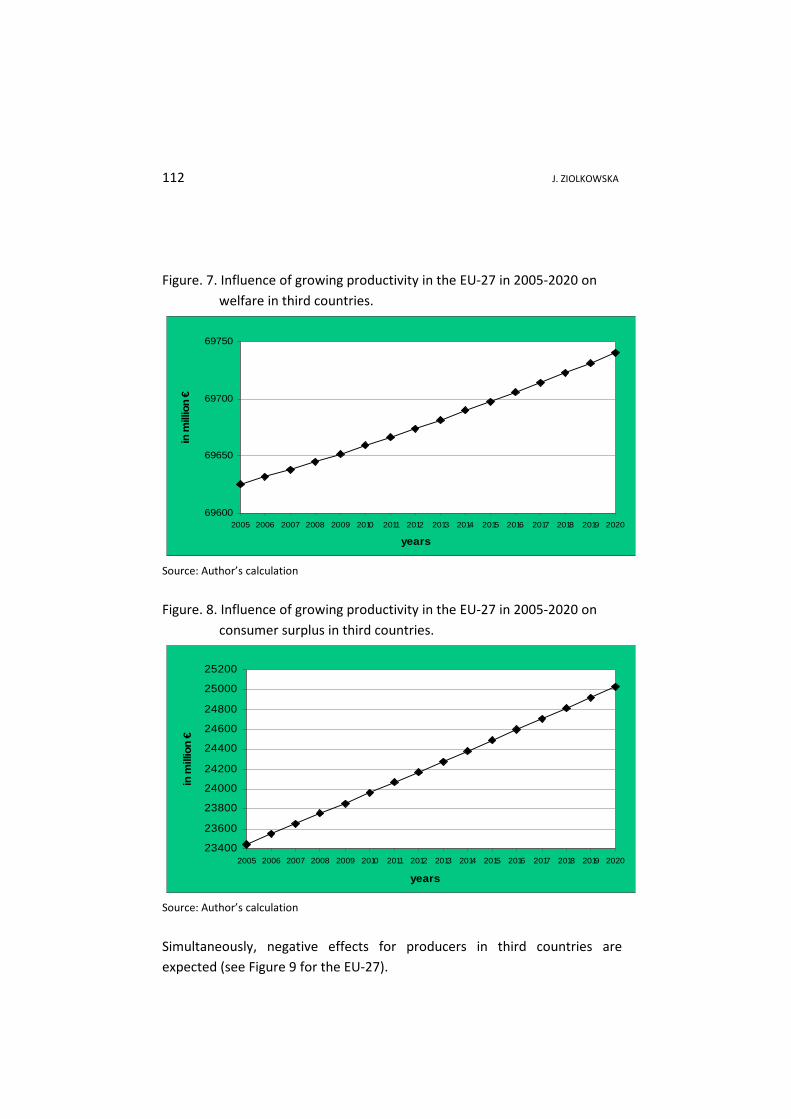
Simultaneously, negative effects for producers in third countries are
expected (see Figure 9 for the EU-27).
69600
69650
69700
69750
2005 2006 2007 2008 2009 2010 2011 2012 2013 2014 2015 2016 2017 2018 2019 2020
years
in m
illion
€
23400
23600
23800
24000
24200
24400
24600
24800
25000
25200
2005 2006 2007 2008 2009 2010 2011 2012 2013 2014 2015 2016 2017 2018 2019 2020
years
in m
illion
€
Implications of structural policies on the wheat market in EU and US 113
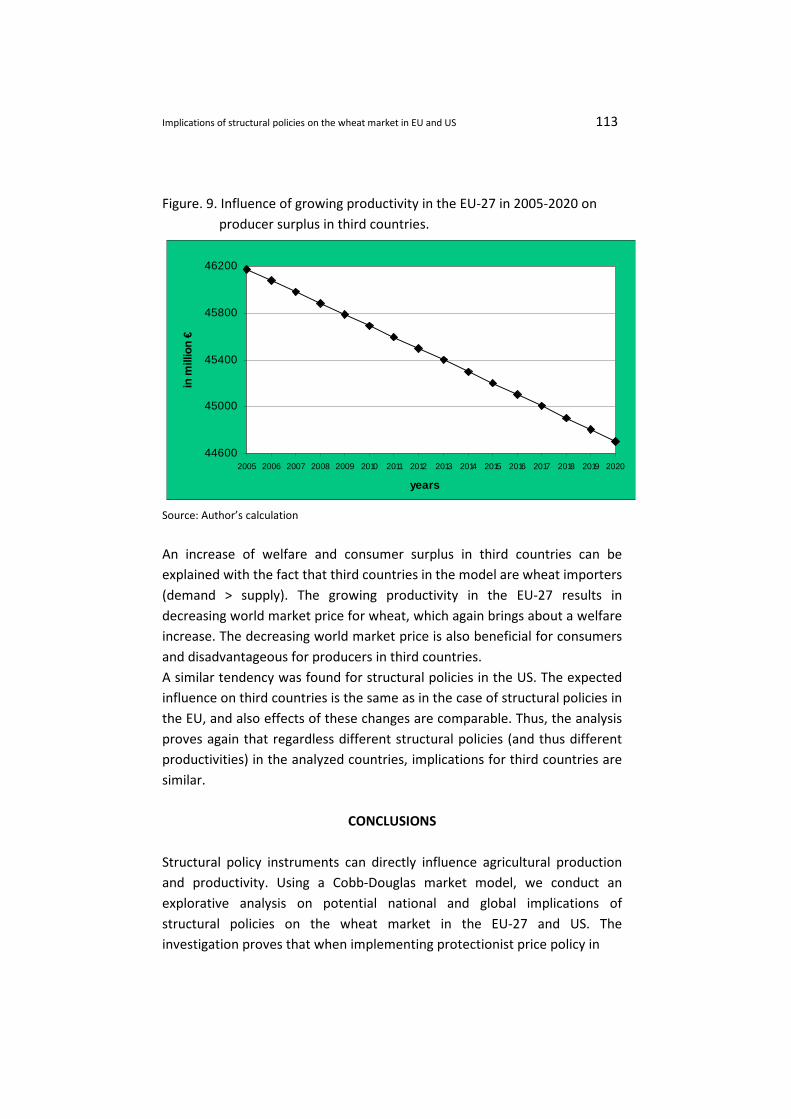
Figure. 9. Influence of growing productivity in the EU-27 in 2005-2020 on
producer surplus in third countries.
Source: Author’s calculation
An increase of welfare and consumer surplus in third countries can be
explained with the fact that third countries in the model are wheat importers
(demand > supply). The growing productivity in the EU-27 results in
decreasing world market price for wheat, which again brings about a welfare
increase. The decreasing world market price is also beneficial for consumers
and disadvantageous for producers in third countries.
A similar tendency was found for structural policies in the US. The expected
influence on third countries is the same as in the case of structural policies in
the EU, and also effects of these changes are comparable. Thus, the analysis
proves again that regardless different structural policies (and thus different
productivities) in the analyzed countries, implications for third countries are
similar.
CONCLUSIONS
Structural policy instruments can directly influence agricultural production
and productivity. Using a Cobb-Douglas market model, we conduct an
explorative analysis on potential national and global implications of
structural policies on the wheat market in the EU-27 and US. The
investigation proves that when implementing protectionist price policy in
44600
45000
45400
45800
46200
2005 2006 2007 2008 2009 2010 2011 2012 2013 2014 2015 2016 2017 2018 2019 2020
years
in m
illion
€
114 J. ZIOLKOWSKA
the EU-27, technical progress can contribute to an increase of producer
surplus by 95 million € and of welfare by 86.9 million €; as compared to the
basis situation without any structural policy instruments. However, it has a
negative impact on budget expenditures which can increase by 8.1 million €.
Similar implications of structural policies were found for the wheat market in
the US and the free trade situation. Thus, apart from price policies
implemented on the wheat market, the implications of structural policies on
the market variables in the analyzed countries are similar. However,
structural policy in the free trade situation has no negative effects for the
national budget, which is the case in the situation of protectionist price
policy in the EU-27. Hence, provided limited budget funds, growing
productivity on the wheat market is more beneficial in case of free trade
policy.
Dynamic effects of structural policies can be effected by different
instruments (technical progress or other structural policy instruments), and
measured in the course of time. In the paper, implications and effects of
different structural policy instruments were investigated. In the analyzed
time period 2006-2015, in the scenario of structural policy determined by
technical progress in the EU-27, the welfare can increase up to 1,361.4
million € in 2020, which is 6.4% more than in 2005. Other structural policy
measures can contribute to a welfare increase by 2,074.5 million €, which is
9.8% more than in 2005. In both cases, the welfare changes do not exceed
the level of 10%. More significant changes were found for producer surplus
and budget expenditures. As a result of technical progress, producer surplus
can increase by 9.6% till 2020, while other structural policy instruments can
lead to an increase of producer surplus by 14.6%, as compared to the basis
scenario in 2005. Technical progress can positively influence budget
expenditures, which are almost three times as high as in the basis scenario in
2005, while other structural policy instruments can bring about four times
higher budget expenditures than in 2005.
In this paper, also the impact of structural policies in the leading wheat
exporting countries on third countries (rest of the world) was analyzed. As a
result of structural policies, a continuous decrease of the world market price
of wheat to 140.8 €/t in the EU-27 and 140.7 €/t in the US was estimated, as
compared to the world price for wheat of 144.3 €/t in the basis situation in
2005, without any structural policies. Thus, leading wheat exporting
countries can influence the situation on the world market; however, changes
of structural policies in these countries are not significant and can lead to a
decrease of the
Implications of structural policies on the wheat market in EU and US 115
world price of wheat by approximately 4 €/t. Growing productivity in the EU-
27 can contribute to an increase of consumer surplus by 6.8%, welfare by
0.2%, and to a decrease of producer surplus by 3.2% in 2020, as compared to
2005 without any structural policies implemented.
Additionally, the analysis proves that apart from different productivities in
the leading wheat exporting countries, implications for the world market of
wheat and for third countries are similar.
REFERENCES
Amid, J. (2007). The dilemma of cheap food and self-sufficiency: The case of wheat in Iran.
Food Policy, 32: 537-552.
Azzam, A.M. (1991). Food subsidies and market interdependence: the case of the Moroccan
soft wheat subsidy. Agricultural Economics, 5: 325-339.
BZfPB (Bundeszentrale für Politische Bildung). (2004). Das Lexikon der Wirtschaft.
Grundlegendes Wissen von A bis Z. 2. Aufl. Bibliographisches Institut & F.A.
Brockhaus, Mannheim.
da Silvaa, O., Grennesb, T. (1999). Wheat policy and economy-wide reform in Brazil.
Agricultural Economics, 20: 143-157.
Department of Finance Canada (2008). Structural policy. Available on the Internet:
http://www.fin.gc.ca/gloss/gloss-s_e.html#struct-pol (06.12.2008).
FAO. (2008). Wheat production. Available on the Internet:
http://faostat.fao.org/site/567/DesktopDefault.aspx?PageID=567 (12.03.2008).
FAPRI. (2007). Elasticities. Available on the Internet:
http://www.fapri.iastate.edu/tools/elasticity.aspx (01.12.2007).
Jechlitschka, K., Kirschke, D., Schwarz, G. (2007). Microeconomics using Excel. Integrating
economic theory, policy analysis and spreadsheet modelling. Routledge, Oxford, New
York.
Kirschke, D., Jechlitschka, K. 2002. Angewandte Mikroökonomie und Wirtschaftspolitik mit
Excel. München, Verlag Franz Vahlen.
Morris, M.L. (1989). Wheat Policy Options in Sub-Saharan Africa: The Case of Zimbabwe.
Agricultural Economics, 3: 115-129.
Muchnik, E., Allue, M. (1991). The Chilean experience with agricultural price bands. The case
of wheat. Food Policy, 16(1): 67-73.
OECD. (2007). OECD-Statistics. Available on the Internet:
http://stats.oecd.org/wbos/default.aspx (20.11.2007).
OECD. (n.d.) Producer and Consumer Support Estimates – OECD Database 1986-2004. User’s
Guide. Available on the Internet: http://stats.oecd.org (20.11.2007).
USDA (United States Department of Agriculture). (2007). Commodity and Food Elasticities.
Available on the Internet: http://www.ers.usda.gov/Data/Elasticities/ (06.12.2007).
Ziolkowska, J., Jechlitschka, K., Kirschke, D. (2009). Global implications of national price
policies on the wheat market – quantitative assessment of world market effects.
Agricultural Economics – Czech (Zemìdìlská ekonomika), 55(10): 475-480.

J. Agric. Res. & Dev. 9(2). Copy@2010. Faculty of Agriculture, University of Ilorin
Maize Response to a Synthetic Organic Nitrogen Fertilizer, Poultry
Manure and Time of Application in the Guinea Savannah of Nigeria
1
J. A. OLOFINTOYE, 2M. O. SUNNIE-ODODO and
1V. MAKINDE
1Department of Agronomy, University of
Ilorin, P.M.B.1515, Ilorin, Nigeria. 2
National Museum, Ilorin.
e-mail: [email protected]
ABSTRACT
Two field experiments were conducted at the Teaching and Research Farm of the University of
Ilorin, located in the Guinea savannah agro-ecological zone of Nigeria, to study the effects of a
synthetic organic nitrogen fertilizer (Urea) and poultry manure (Pm-a natural organic nitrogen
source) and their time of application on growth and yield of maize (Zea mays L.). The response
of maize to the two sources of nitrogen varied significantly with time of application. Urea
applied at 4 and 6 weeks after planting (wap) gave the best crop performance while poultry
manure applied between planting and 4 wap recorded better crop performance than the other
times of application. Maize growth and grain yield were consistently better in poultry manure
and urea-treated plants than in the no-fertilizer control treatment at p<0.05. Poultry manure
compared favorably with urea in promoting crop growth and yield when applied between
planting and 4 wap. This suggested that Pm could be used to raise crops of maize on marginal
soils that would not normally support maize production without nitrogen fertilizers.
Keywords: Natural, Synthetic-Organic-Nitrogen-Fertilizer, Maize.
INTRODUCTION
Maize (Zea mays L.) is used extensively as the main source of calories in animal feeds
and it constitutes the staple item of the diets for more human beings over a longer
period of time than any other cereal ( Okoruwa, 1995 ). The increasing global
demand for grains, to feed the growing human population and the ever-expanding
livestock industries have made the need to increase maize production necessary.
The Guinea savannah agro-ecological zone of Nigeria (the food basket of the nation)
has the greatest potential for maize production (Kassam and Kowal, 1973). Ironically,
however, the average maize yield in farmers’ fields, where the bulk of the maize is
produced in this zone is estimated at about 1.5 t ha-1
. This yield level is much lower
than the potential yields of improved maize varieties (estimated at about 3 to 4 t ha-
1) developed for high grain yield in the country. The factors which have been
responsible for the low maize yield in Nigeria include: low levels of soil organic
matter (Jones, 1973) and native nitrogen and phosphorus (Bache and Rogers, 1970).
The low soil fertility has long been recognized as one of the major biophysical
constraints affecting food production in sub-Saharan Africa. Soil fertility depletion in
small holder farms in the region has been identified as the fundamental cause of
declining per capita food production (Sanchez et al., 1990). The depletion has been
attributed mainly to intensive and continuous cropping with little or no fertilizer
application and thus culminating into imbalance between nutrients supply and
extraction from the soil (Sanchez et al., 1990).
118 J. A. OLOFINTOYE et al
The declining productivity of many tropical soils has been one of the major
constraints limiting the realization of the genetic potentials of available improved
crop varieties (Dudal and Deckers, 1993).The need to take appropriate steps to
check the declining soil productivity by improving the physico-chemical properties of
the soil including its fertility in order to increase maize yield is urgent, because the
rate of deterioration is increasing and it is bound to have serious implications on
future food security in the region. Adequate inputs of nutrients as fertilizers as well
as soil amendments to improve physico-chemical properties are required to
overcome the constraints. Maize for example, has high demand for nitrogen, thus
nitrogen becomes the first limiting nutrient as land use intensifies. This explains why
it is almost impossible to grow maize successfully on some soils in the Guinea
savannah of Nigeria without nitrogen fertilizers. For example, FAO (1988) reported
that the role of nitrogen in maize production in the Guinea savannah of Nigeria is not
easily substituted. The scarcity and the increasing cost of inorganic fertilizers in
Nigeria presently have limited their use for maize production (Willrich et al.,1974).
There is therefore the need to look inwards for alternative sources of nutrients for
maize production. An increasing dependence on natural organic wastes, such as
farmyard manures, compost, crop residues and poultry manure as sources of
nutrients for crop production is inevitable in the nearest future, in the light of the
present predicaments in sourcing for inorganic fertilizers.
Poultry manure is abundantly available in many parts of Nigeria, wasting and
sometimes constituting a nuisance where it is generated as a bye-product of
poultry farms. It has been established that poultry manure (Pm), contains
sizeable levels of nitrogen and that 60-80% of its nitrogen is in organic form,
while the remaining 20-40% is in inorganic fractions, and that approximately
50% of the organic nitrogen is mineralizeable within 90 days under
laboratory conditions ( Sims,1986; 1987; Tanimu et al., 2007 ). It is therefore
necessary to provide more information on the management of Pm as source
of nitrogen for maize production. This work was therefore designed to
evaluate the response of an improved maize variety to poultry manure and
urea (a synthetic organic nitrogen fertilizer).
MATERIALS AND METHODS
Two field experiments were conducted during the 2004 and 2005 cropping
seasons at the Teaching and Research Farm of the Faculty of Agriculture,
University of Ilorin (8°,20’N and 4° 35’E), in the Guinea savannah agro-
ecological zone of Nigeria. The experiments were designed to evaluate the
response of maize to two organic sources of nitrogen and their time of
application on a sandy-loam soil. Initial soil samples were taken from the
experimental site and analyzed for physico-chemical properties. The results
of the soil analysis was as presented: sand, 81.5%; silt, 10.5%; clay, 8.0%; pH
(H2O), 5.79; organic matter,20 g kg-1; available P, 5.5 ppm; Calcium, 1.5 cmol
kg-1; Potassium,
Fertilizer Type and Time of Application on Maize Response 119
0.2 cmol kg-1; Magnesium, 1.1 cmol kg-1; Sodium, 1.2 cmol kg-1; total
nitrogen, 4.22 g kg-1.
The site was cropped to maize during the previous season. The land was
ploughed once, harrowed twice and maize was planted on the flat. Two
organic nitrogen fertilizers (urea and Pm), a no-fertilizer control and five
times of application [2 weeks before planting (wbp), at planting (atp) 2, 4 and
6 weeks after planting (wap)], were tested on an improved maize variety
(SWAN-1-SR), maturing in about 100days. The treatments were arranged as a
3×5 factorial in randomized complete block design (RCBD), in 2004. Each of
the 15 treatment combinations was replicated three times. In 2005 the two
organic nitrogen sources and the no-fertilizer control and four times of
application ( atp, 2, 4, and 6wap) were evaluated using 3×4 factorial
arrangement in RCBD, with three replications. The synthetic organic nitrogen
fertilizer used was urea (CONH2)2 containing 46% N and the rate of nitrogen
from this source was 100 kg N ha-1. In estimating the quantity of Pm needed
to supply 100 kg N ha-1, 1.29 % N was used as the percentage of N in Pm
instead of the 4.3 % total N obtained in a laboratory analysis as the
percentage of total N in the Pm. The 1.29% N represented the mineralizable
N in the Pm, based on literature that 60 – 80 % of nitrogen in poultry manure
is in organic fraction and that approximately 50 % of the organic fraction was
mineralized within 90 days under laboratory conditions (Sims, 1986; 1987
Tanimu et al., 2007). The poultry manure was therefore applied at the rate of
5.8 t ha-1. Wet and well disintegrated Pm was used. Phosphorus and
potassium were applied at the rates of 50 kg P2O5 and 30 kg K2O ha-1,
respectively, to all plots using single supper phosphate and muriate of
potash, respectively. The spacing was 90 cm between and 60 cm within rows
and three plants were maintained per stand. Data on grain yield and yield
components were collected in 2004 while growth parameters were included
in 2005. All plots were weeded two times during the growing season. All the
data collected were subjected to statistical analysis and the significant means
were separated by using the new Duncan’s multiple range test (DMRT).
RESULT
Table 1 shows the mean square of ANOVA of treatments on yield
components and grain yield of maize in 2004. Time of application of the
nitrogen sources had no significant effects on cob length and diameter but it
significantly influenced the weight of 1000 seeds and grain yield. Heavier
grains were recorded for the 6 wap treatment than in all other times of
application (Table 2). The superiority of the 6 wap treatment over other
times of application as recorded in the weight of 1000 grains, was however,
not reflected in the grain yield, which was not statistically different for all
times of application except for the 2 wbp treatment,
120 J. A. OLOFINTOYE et al
which produced the lowest grain yield. The influence of nitrogen sources on
yield and yield components was highly significant. Cob length and weight of
1000 seeds in urea and Pm treated plants were comparable and they were
significantly better than that obtained in the no- fertilizer treatment. Urea
however, produced higher grain yield than the poultry manure (pm) and the
no-fertilizer control while Pm was also superior to the no-fertilizer control.
Cob diameter was not affected by nitrogen sources (Table 2).
Interaction between nitrogen sources and time of application was significant
for grain yield in 2004 (Table 1) and for plant height, stem girth and grain
yield in 2005 (Table 3). The main effects of nitrogen sources and time of
application on plant height, stem girth, grain yield and yield components in
2005 are presented in Table 4.Time of application had no significant effects
on weight of 1000 grains while nitrogen sources had marked influence. Urea
and Pm were comparable and consistently better than the no-fertilizer
treatment in their effects on weight of 1000 seeds.
The interactive effects between nitrogen sources and time of application on
grain yield in 2004, 2005, stem girth and plant height in 2005 are presented
in figures 1,2,3 and 4, respectively .The figures, (interactive bar charts)
showed that time of application was a determining factor in the responses of
maize to the nitrogen sources. In other words, how well the crop responded
to the nitrogen sources in terms of growth and yield was dependent on the
time during the life duration of the crop that the fertilizer was applied. In
figures 1 and 2, the highest grain yields were recorded for urea applied at 4
wap (3.8 t ha-1, in 2004 and 2.80 t ha-1, in 2005), followed by urea applied at
6 wap (3.60 t ha-1 in 2004 and 2.20 t ha-1 in 2005). The two treatments were
comparable and they produced yields which were statistically higher than
yields obtained from the same source of N applied at 2 wbp, atp and 2 wap.
Urea at all its time of application was superior to the no- fertilizer control.
Application of urea at 2 wbp in 2004 produced the lowest yield (2.1 t ha-1) for
urea (fig. 1) while in 2005 the lowest grain yield (1.08 t ha-1) was recorded in
urea applied at planting. Urea was only superior to Pm at all times of
application when applied at 4 and 6 wap; at other times of application urea
and Pm were comparable. Poultry manure produced significantly higher
grain yield than the no- fertilizer control at all times of application except 2
wbp in 2004 and at planting in 2005. The highest grain yield for Pm was
recorded at application made 4 wap (2.5 t ha-1) and 6 wap (2.45 t ha-1).
Poultry manure applied 2 wbp produced the least and significantly lower
yield (1.84 t ha-1) than yield in other times of application. On the contrary,
Pm applied 2 wap produced the highest grain yield (1.81 t ha-1) in 2005,
which was significantly better than yields recorded for Pm at other times of
Fertilizer Type and Time of Application on Maize Response 121
application. Yield from Pm applied at 2 wap compared favorable with yield
from urea applied 2 wap (1.90 t ha-1) and it was better than the yield from
urea applied at planting (1.63 t ha-1). Application of Pm at planting was not
better than the no-fertilizer control in 2005, but in 2004 it was significantly
better.
The interactive effects of the nitrogen sources and time of application on
stem girth and plant height are presented in figures 3 and 4. The no-fertilizer
treatment recorded significantly lower plant height and stem girth than urea
and Pm at all the times of application. Urea-treated plants were significantly
taller and thicker in diameter than Pm-treated plants, at all the times of
application. The highest height (177.9 cm) and and thickest stem girth (2.70
cm) were obtained in applications made at 2 wap. Responses of maize to the
nitrogen sources in terms plant growth, varied significantly with time of
application, as shown in the figures 3 and 4.
DISCUSSION
The results show that, when applied at the right time, urea and Pm had
significant positive impacts on maize performance as compared with the no-
fertilizer control treatment. Applied between planting and 4 wap, Pm
compared favorably with urea in its influence on the growth and yield of
maize. This result was corroborated by other reports that higher soyabean
grain yield was obtained with poultry manure applied at 10-20 t ha-1 as
compared with mineral fertilizers in the Guinea savannah of Nigeria (Alofe et
al., 1995). Other works have also demonstrated the efficiency and
effectiveness of farmyard manure and other organic nutrient sources in
maintaining soil fertility, increasing maize and other crops’ yields and
sustaining soil productivity (Asfaw et al., 1997; Grant, 1981; Heluf
Gebrekidan et al., 1999). These results therefore suggested that Pm could be
used to successfully raise crops of maize in the absence of mineral fertilizers,
on exhausted soils that would not have been able to support maize
cultivation without mineral nitrogen fertilizers in the Guinea savannah of
Nigeria. The reality of such marginal soils in the Guinea savannah of Nigeria
would explain why it is almost impossible to grow maize without mineral
fertilizers on some soils in the region. The statement credited to FAO (1988),
that the role of nitrogen in maize production in the Guinea savannah of
Nigeria is not easily substituted, confirms the reality of the presence of such
marginal soils in the region.
122 J. A. OLOFINTOYE et al
The results also indicated that the response of maize to the nitrogen sources
varied significantly with time of application. In other words, timely
application of the organic nitrogen sources was an important factor
determining how well the maize responded to them. For urea, applications
made at 4 and 6 wap gave the best results while Pm applied between
planting and 4 wap recorded the best crop performance.
The apparent poor response of maize to the fertilizers applied 2 wbp could
be due to the absence of crop roots to receive the nutrients from the
fertilizers when applied. Most of the nitrogen in the fertilizers, particularly
urea, could have been lost before crop establishment, owing to the mobility
of nitrogen in the soil. This inference sounds convincing, considering the
porous nature of the soil used in these trials.
The application of urea at 4-6 wap resulted in good grain yield, because the
applications coincided with the period of flower initiation in the maize
cultivar used, which matures in 90 - 100 days; its flower initiation was
expected at 4-7 wap. The application of Pm at planting to 4 wap also ensured
that nitrogen was made available to maize during the period of flower
initiation to taselling, through mineralization and slow release. It has been
established that the period between flower initiation and anthesis is the time
cereals most need nitrogen for grain formation and development (Tanaka et
al., 1966 ). Works on rice at the International Rice Research Institute (IRRI)
also revealed that 75% of the carbohydrates in cereal grains come from
photosynthesis after flowering (Tanaka et al., 1966).
REFERENCES
Alofe, C. O., Olowe, V. I. O. and Banmeke, I. O. 1995. Response
of soybean cultivar “Doko” to poultry manure, NPK
fertilizer and row spacing in a humid tropical location.
Tropical Oilseed Journal 2 : 144 – 147.
Asfaw Bolay, Heluf Gebrekidan, Yohannes Uloro and Eylachew
Zewdie. 1997. Effects of crop residues on grain yield of
sorghum (Sorghum bicolor L.) to application of NP
fertilizers. Nutrient Cycling Agronomy. 48: 191- 196.
Bache, B. W. and Rogers, N. E. 1970. Soil phosphate values in
relation to phosphate supply to plants from some Nigerian
soils. Journal of Agricultural Science, Cambridge. 74: 282
– 290.
Fertilizer Type and Time of Application on Maize Response 123
Dudal, R. and Deckers, J. 1993. Soil organic matter in relation to
soil productivity. In Soil organic matter dynamics and
sustainability of tropical agriculture, Eds. Mulongoy, K. and
Merck, R., John Wiley and Sons Ltd., pp 377 – 380.
Food and Agricultural Organization (FAO). 1988. Fertilizer and
plant nutrition. Bulletin No. 3. Rome, Italy. 15 p.
Grant, P. M. 1981. The fertility of sandveld soils in peasant
agriculture. Zimbabwe Agricultural Journal. 78: 169 – 175.
Heluf Gebrekidan, Asfaw Belay, Yohannes Uloro and Eylachew
Zewdie. 1999. Yield response of maize (Zea mays L.) to crop
residue management on two major soil types of Alemaya,
eastern Ethiopia: I. Effects of varying rates of applied and
residual NP fertilizers. Nutrient Cycling Agronomy. 54: 65 –
71.
Jones, M. J. 1973. The organic matter content of the savannah
soils of West Africa. Journal of Soil Science. 24: 42- 43.
Kassam, A.H. and kowal, J.M. 1973. Productivity of crops in the
savannah and rain forest zones in Nigeria. Savannah
2(1):39-49.
Okoruwa, A.E. 1995. Utilization and processing of maize.
International Institute for Tropical Agriculture (IITA), Ibadan,
Nigeria. Research guide 35. 20p.
Sanchez P.A. Izac, A.M. Valencia, I. and Pieri, C. 1996. Soil fertility
replenishment in Africa. A concept note in Breth (eds.)
proceedings of workshop on achieving greater impact from
research investments in Africa, 26-30th
September, 1996,
Addis Ababa, Ethiopia.
Sims, J.T. 1986. Nitrogen transformation in a poultry manure
amended soil. Temperature and moisture effects. Journal
Environ. Qual.15:59-63.
Sims, J.T. 1987. Agronomic evaluation of poultry manure as
nitrogen source for conventional and no tillage corn. Agron.
Journal 79: 563-570.
Tanaka, A. Kawano, K. and Yamaguchi, J. 1966. Photosynthesis,
respiration and plant type of tropical rice plant. The
International Rice Research Institute. Technical Bulletin 7.
1966 46pp. (third printing, Dec. 1974)
Tanimu, J.E. Iwuafor, N.O. Odunze, A.C. and Tian, G. 2007. Effect
of incorporation of leguminous cover crops on yield and
yield components of maize. World Journal Agricultural
Science. 3(2):243-349.
Willrich, T.L. Turnen, D.O. and Volks V.V. 1974. Manure
application guidelines for Pacific Northwest. American
Society of Agricultural Engineering, St. Joseph, M. ASAE
paper no 74-4601.

J. Agric. Res. & Dev. 9(2) Copy@2010. Faculty of Agriculture, University of Ilorin
Constraint to Women’s Participation in Agricultural Production
in Rural Areas of Kaduna State, Nigeria
R .O. YUSUF, Y.A. ARIGBEDE and O. KOLADE
Department of Geography,
Ahmadu Bello University, Zaria,
Nigeria
ABSTRACT
Despite the increasing advocate for women empowerment through equitable policy
framework , many women in rural areas still face serious obstacles that frustrate their attempt
to secure qualitative livelihood from farming activities. The major aim of this paper is to
examine the constraints faced by rural women farmers towards actualizing their aim for
household food security and improved income from farming enterprises. To achieve the aim
and objectives, questionnaire survey of 280 women systematically drawn from four rural
districts of Sabon-Gari and Giwa Local Government Areas (LGAs) of Kaduna state was
employed .Descriptive statistics such as frequency table, and percentages were employed to
analyse the data collected while Student’s t-test was used to validate the hypothesis. From the
results, about 70% of sampled women farmers practice farming on a subsistence basis. Also,
96% claim that their productive potential is not maximized while 83.64% encounter several
socio-economic constraints among which were financial and socially-embedded constraints
with 33.18% and 87.27% responses respectively. The result of the Student’s t test reveals that
the critical t value of 2.179 with 12 degrees of freedom is significant at 0.05 level
.Consequently, the hypothesis that similar financial and socio-cultural constraints face women
farmer’s agricultural activities is rejected. The results revealed that constraints faced by
women farmers tend to reduce with increasing urbanization though further study is needed in
this direction. Conclusion was based on the recommendations that there should be formulation
and implementation of women-biased landholding and titling policies through modification of
the present land tenure system, creating a financial credit pool for women using the Welfare
Departments of local government councils, and organizing women farmers into functional
women cooperatives for easy access to loans and farm input.
Key words: Constraints, women farmers, rural area, Giwa LGA, Sabon-Gari LGA.
INTRODUCTION
Several policy related efforts such as Back to land scheme, Green
Revolution, Operation feed the nation, Agricultural Development
Programmes geared at intensifying the drive to a food-secured Nigeria has
not achieved the targeted aim because of several lapses. A major area of
concern is the inadequate integration of women into the agricultural sector.
Women encounter different agricultural-related bottlenecks which have
continued to drawback their striving for food self-sufficiency and improved
income at the household and community levels. As Mamman (1995) rightly
observed, there is a monumental loss in any developing country's economic
productivity that is negligent of the role of women in agricultural production.
126 R. O. YUSUF et al
In the 1970s most of the researches carried out on the agricultural activities
of women particularly in northern Nigeria showed that women involvement
were low. For example, Salihu and Ohwona (1995) found out that in Giwa
and Makarfi Local Government Areas (LGAs) of Kaduna state, women’s
agricultural productivity was grossly inadequate. Even during colonialism
several factors combined to restrict women’s productive participation in
farming (Trenchard, 1987). Lately, however and due to economic realities,
the role of women as food producers has increased substantially to between
60% - 80% even though few data exist on the agricultural and economic
activities of rural women (Odugbesan, 2008). The idea that men are the real
or supposed to be the breadwinners of their households is deeply
entrenched in the society (Mamman, 1995; Ubogu and Ata, 2010) .Hinged on
this premise; male farmers were the target beneficiaries of agricultural
extension programmes and services.
Yet as more men migrate to urban areas from rural areas, more women are
left as household heads carrying on with the agricultural activities that
provide basic needs for their families. It is documented that over 80% of all
rural women in sub-saharan Africa including Nigeria are economically active
in one agricultural activity or the other (Onyenechere, 2008). Studies from
different parts of the world have demonstrated the unrivalled role of rural
women in agricultural production. They produce 70% of food crops for
domestic consumption and sales, and make up over 70% of the agricultural
labour force (Emeghara and Njoku, 2008; Ayoola, 2001).
Women no doubt constitute the largest rural population especially
where male-focused rural out-migration is well established. Also they work
long hard hours as wives, mothers and bread winners (Djaji, 1998).
Ipingbemi, and Aloba (2005), discovered that women perform close to 90%
of works associated with processing of food crops; 80% of hoeing and
weeding; 80% of efforts relating to food storage and transportation from
farm to village, as well as 60% of the harvesting and marketing work. Also, as
documented by Lyam and Jeiyol (2008) the agricultural activities of women
do not lead to serious environmental degradation when compared to men
Unfortunately, agricultural development programmes are in most cases
designed and planned for men especially in rural societies where socio-
religious patriarchy is well entrenched. Worse still, men displace women
when new innovations are introduced (Olayiwole, 1984).
In eastern Nigeria, farming is the important economic activity of the rural
women (Akande, 1984). Studies in former Anambra and lmo states, revealed
that over 90% of the rural women were engaged in farming and post-harvest
operation, as they perform such tasks as land clearing and preparation,
planting, weeding and harvesting work on their own small plots as well as on
their husband plots. The women grow food crops such as rice, maize,
cassava,
Women’s Participation in Agricultural Production 127
vegetable etc while men on the other hand grow tree crops and tuber crops
especially yams. Although depending on the socio-cultural flexibility of
different Nigerian ethnic groups, a large number of women were involved in
decision making concerning farm operations (Mamman, 1995) and animal
husbandry (Makun, et. al. 2005,). Indeed, Lyam and Jeiyol (2008)’s study in
Benue state,Nigeria, reveals that there is no glaring difference in the
agricultural operations of both male and female farmers .
It is clear from the foregoing that the position of the rural women in
developing countries has not changed significantly since the 1970s. Rather,
their socio-economic conditions have continued to deteriorate. This situation
is even more worrisome considering the fairly higher level of economic
prosperity achieved by these countries during the same period and the
vigorous campaign for gender equality in access to economic opportunities
and women empowerment. In fact this partly is one of the issues
emphasized after the 1995 Beijin Conference 35% affirmative action on
women representation. According to an IFAD (1992) survey, the number of
women in poverty in developing countries increased by 50% in the last two
decade while that of the overall population grew by only 40%.Also in Nigeria,
available data indicates that incidence of poverty among women is higher
(FOS, 1997& 1998). Also, the poverty profile in Nigeria (FOS, 1999) cited in
Yusuf (2008) shows that with a poverty incidence of 67.7%, Kaduna state
ranked among the tenth poorest states in Nigeria.
Implication of this is that rural poverty is increasing at a faster rate amongst
women whereas regrettably though, the number of women assuming house-
hold headship is increasing. The rural female-headed households are poorer
than the others; they have less access to both tangible and non tangible
resources of production (Emeghara and Njoku, 2008). Thus, if these women
continue to face constraints it will increase not only the poverty level of the
households but will also contribute to child and maternal mortality with the
attendant consequences on the nation's development. Constraints as used
here are limitations, problems, tightly controlled restrictions and other
processes that stifle or hinder progress. The aim of this paper is therefore to
analyze these constraints in rural settlements from a section of northern
Nigeria where poverty incidence is high and socio-cultural rigidities are also
well entrenched. This is what the paper addresses with a two-pronged
objectives: (1) to find out the area of agricultural production in which women
participation are relevant , and (2) to examine some of the major challenges
hindering women from effectively benefiting from progress in agricultural
development and contributing their quota to boosting their income and
food security.
128 R. O. YUSUF et al
The Study Area
Giwa LGA lies approximately within latitudes 11°- 11° 30` N and longitude
7°15`- 7° 30` E while Sabon-Gari LGA lies approximately between latitudes
11°- 11° 30` and 7° 30` and 8° E. The vegetation type is Savannah wood land
(Statistical year book of Kaduna state 2001) with a relatively low
precipitation. The average annual rainfall is about 127mm. The soil in the
study area fade from the less fertile laterite soil into ferruginous types
derived from the basement complex rocks. This enables the predominance of
farming as the main occupation of the people living in the area grown crop
include maize, vegetable, guinea com, millet etc.
The study area falls within the northern Kaduna region. Giwa was carved out
of Igabi LGA of Kaduna state. It has 11 rural districts serving as administrative
headquarters for the villages. The area is bounded in the west by Birnin-
Gwari LGA, 1gabi LGA in the south; Sabon-gari and Zaria LGAs are to the east
while Katsina state is to north. Sabon Gari LGA on the other hand was
created out of Zaria LGA. It has six districts out of which two are rural while
the remaining four are urban The LGA is surrounded by Zaria LGA, Kudan LGA
and Giwa LGA to the south, north-west and east respectively.
According to 2006 National Population Census, Giwa LGA has a population of
286,427 while that of Sabon-Gari is 137,867. Majority of the people in this
area are involved in farming activities. Other primary production activities in
this area include livestock rearing, carving etc. The secondary activities
include bakery and other local food processing activities. The tertiary
activities in this area are basically transportation and marketing of
agricultural products .However, quite a handful population work in the local
government secretariats, educational institutions and other government-
owned parastatals.
The study LGAs are dominated by the Hausas. Fulanis are also
common. Other ethnic groups include the Yorubas, Igbos, Igala, Nupes,
Ebiras etc. Two major religions in the area are Islam and Christianity.
Generally, socio-cultural patriarchy is well established in these rural
settlements. Despite that, there is the need to examine if spatial variation
exists in the constraints faced by the women given the similarity of the agro-
ecological and socio-cultural conditions.
Theoretical framework of constraints to women in agriculture and
development
Since the end of colonialism in many African countries, increasing
research attentions have examined the roles of and limitations to women in
agriculture. In fact, prior to this time, it was said that African women have
suffered under ‘two colonialisms’; that of Europe and that of men (Stock,
2004). Although a variety of theoretical postulations have been used to
understand these feminist issues (Peet, 1998), two preferred in this study are
those of Boserup (1970) and Miller (1990).
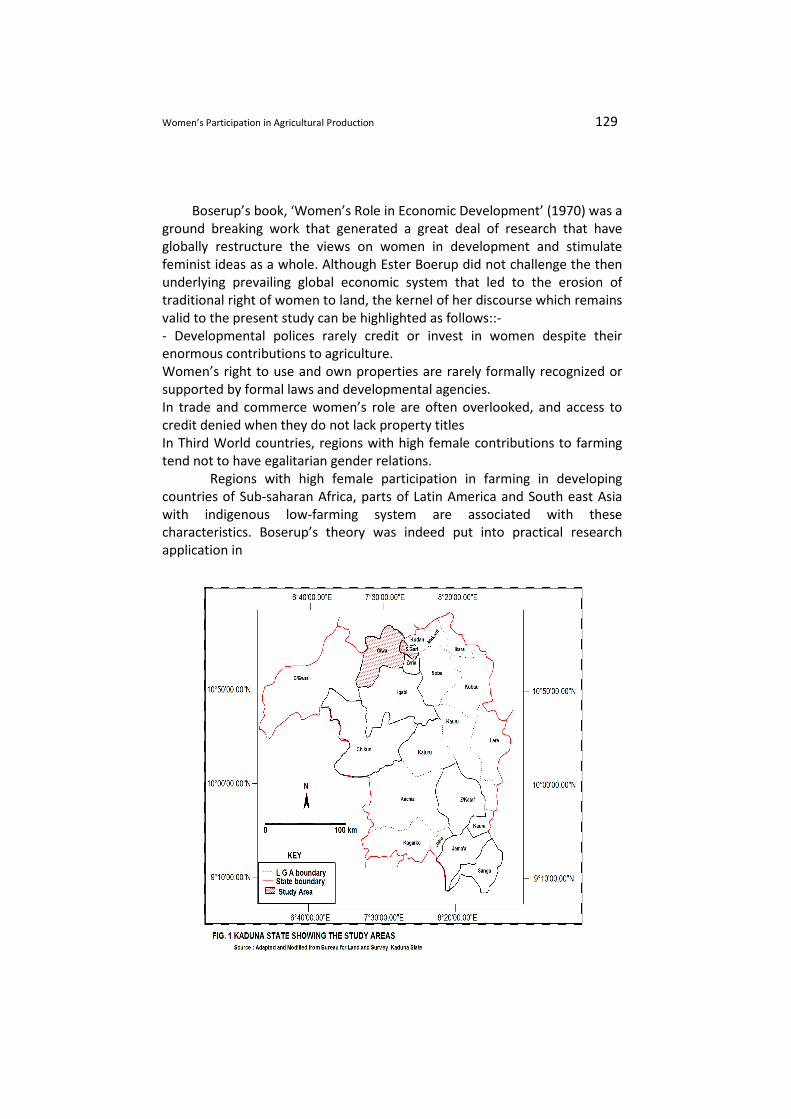
Women’s Participation in Agricultural Production 129
Boserup’s book, ‘Women’s Role in Economic Development’ (1970) was a
ground breaking work that generated a great deal of research that have
globally restructure the views on women in development and stimulate
feminist ideas as a whole. Although Ester Boerup did not challenge the then
underlying prevailing global economic system that led to the erosion of
traditional right of women to land, the kernel of her discourse which remains
valid to the present study can be highlighted as follows::-
- Developmental polices rarely credit or invest in women despite their
enormous contributions to agriculture.
Women’s right to use and own properties are rarely formally recognized or
supported by formal laws and developmental agencies.
In trade and commerce women’s role are often overlooked, and access to
credit denied when they do not lack property titles
In Third World countries, regions with high female contributions to farming
tend not to have egalitarian gender relations.
Regions with high female participation in farming in developing
countries of Sub-saharan Africa, parts of Latin America and South east Asia
with indigenous low-farming system are associated with these
characteristics. Boserup’s theory was indeed put into practical research
application in
130 R. O. YUSUF et al
Guatemala where four different communities were examined in order to
understand the impact of various changes of the economic participation and
social condition of women. All these studies confirmed Boserup’s assertion.
Indeed, feminist studies globally focus on explaining the denigration
suffered by women indifferent socio-cultural setting. For example, Bronstein,
1982 cited in Peet (1998) synthesized from the International Labour
Organization’s publication that women comprises 50% of the world’s
population, do two-thirds of the world’s work hours, receive 10% of the
world’s income and own less than 1% of the world property. Analyses like
these are the building blocks for terms like ‘feminization of poverty’.
Miller (1990) in her analysis started with the study of unequal sex
ratio. Sex ratio is the number of males per hundred females. In Miller’s
theory as summarised by Bossen (2005), the participation of women in
economic activities outside the home was a major explanation for the
different values placed on girls and women in the Northern and Southern
region of India.
In the northern region of India, sex ratio was very high because of
the practice of female infanticide. due to this practice, daughters generally
suffered higher malnutrition and mortality in childhood than boys, leading to
a disproportionate number of males in the population. In the southern part
of India however, fatal discrimination against daughters is not common and
such birth and child sex ratio are closer to the expected ratio of around 106%
boys per 100girls.
Miller (1990) considered the general difference in agriculture as a
possible foundation of some difference in sex ratio. In northern India, where
wheat was grown and plough agriculture was practice, there was little need
for female farm labour, women made few contributions to food production,
they were confined to purdah and were seen to have little value beyond
reproduction. See also Mamman (1995).In the southern part of India
conversely, where intensive irrigated rice farming required much more hand
labour, women made publicly recognized contribution to farming, their
families did not practice purdah and daughters were married to equals with
little dowry and did not marry very far away from their natal families. The
foregoing reflects differences in women’s role based on societal accepted
norms.
Boserup’s theory helps to understand that women own lesser
properties and have lesser income but they play vital role in agriculture. In
both of these approaches, gender inequality and the work of social
conditions of women are measured. These are problems of gender inequality
that stalk women empowerment and development in many regions of the
world (Bossen, 2005), particularly in developing countries (Stock,
2004).Intervention in the plight of women has led to proliferation of
governmental, non-governmental and multilateral organizations such as
Kabissa (Niger Delta Women for Justice),
Women’s Participation in Agricultural Production 131
Women in Agriculture in Nigeria, Women in Development Network, The
African Women’s Development and Communication Network, and, United
Nations Development Fund for Women among others. Against this backdrop,
this paper examines the constraints to rural women’s participation in
agriculture using systematically collected data from Kaduna state.
MATERIALS AND METHOD
In order to achieve the aim and objectives of this research a reconnaissance
survey was conducted and this afforded the opportunity of knowing the
villages in the districts prior to sampling. It also informed the sampling frame
and technique appropriate for the study. As such data were generated from
primary sources such as field observation, questionnaire administration and
interview schedules. Supportive evidences were also systematically extracted
from textbooks, journals, periodicals and abstracts of statistics.
In order to select settlements, the two rural districts in Sabon-Gari
LGA and another two districts from Giwa LGA, having considered the spatial
extent, were purposively selected so as to eliminate bias from the sample
size. Using this approach, Bomo and Basawa districts (Sabon-Gari LGA) and
Yakawada and Gangara (Giwa LGA) were selected. To select respondents
therefore, in the absence of a predetermined definite population sample,
280 copies of questionnaires were administered on the basis of 70 per
district through a systematic sampling technique at interval of 4. In each
household, the wife of the house hold head was the respondent.
Where the head of the house hold is woman, then she was selected and
there after adjusted to every 4th house .Information obtained was analyzed
through descriptive statistic such as table, percentages, pie chart and
histograms. Student’s t test was used to test hypothesis. It was hypothesized
that there is no difference in the constraints faced by women farmers in the
two LGAs. Student’s t test was preferred because of the need to find the
differences in the two sample means of the LGAs.
PRESENTATION AND DISCUSSION OF RESULT
The information obtained is discussed under socio-economic characteristics
of the respondents, constraining factors to enhanced agricultural
productivity of rural women and particularly the variation in the sampled
settlements. At the end, remedial measures were recommended. These are
discussed below.
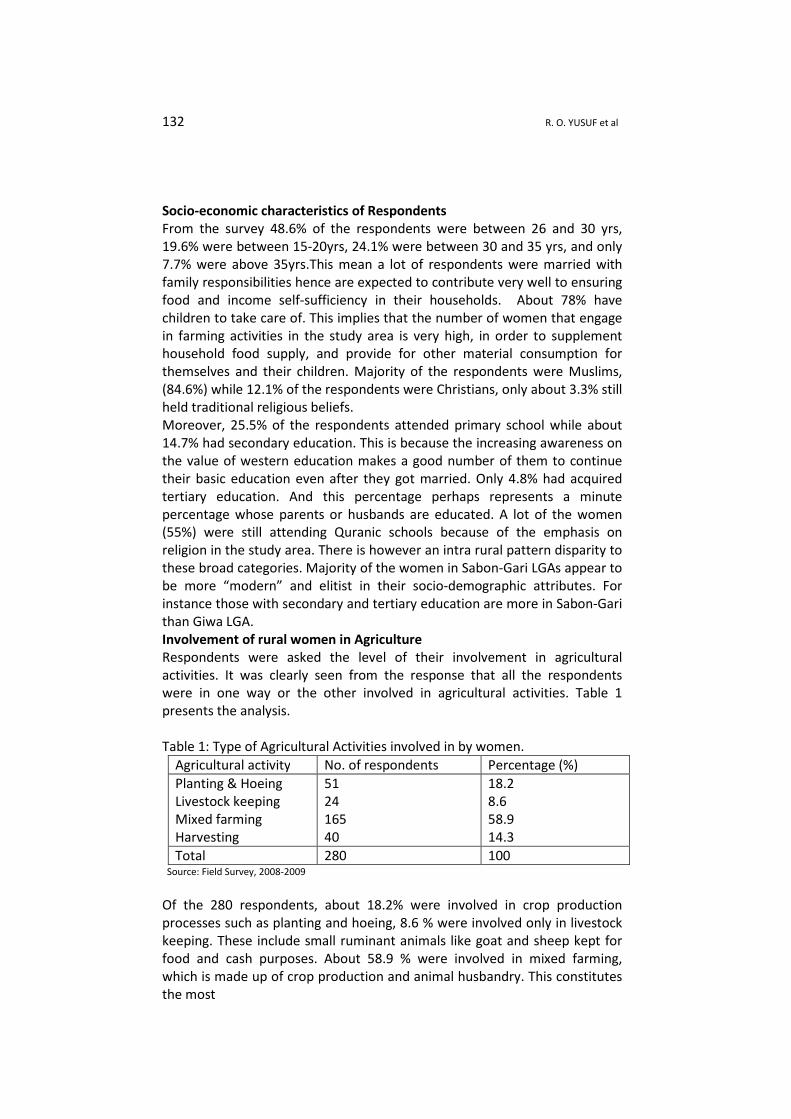
132 R. O. YUSUF et al
Socio-economic characteristics of Respondents
From the survey 48.6% of the respondents were between 26 and 30 yrs,
19.6% were between 15-20yrs, 24.1% were between 30 and 35 yrs, and only
7.7% were above 35yrs.This mean a lot of respondents were married with
family responsibilities hence are expected to contribute very well to ensuring
food and income self-sufficiency in their households. About 78% have
children to take care of. This implies that the number of women that engage
in farming activities in the study area is very high, in order to supplement
household food supply, and provide for other material consumption for
themselves and their children. Majority of the respondents were Muslims,
(84.6%) while 12.1% of the respondents were Christians, only about 3.3% still
held traditional religious beliefs.
Moreover, 25.5% of the respondents attended primary school while about
14.7% had secondary education. This is because the increasing awareness on
the value of western education makes a good number of them to continue
their basic education even after they got married. Only 4.8% had acquired
tertiary education. And this percentage perhaps represents a minute
percentage whose parents or husbands are educated. A lot of the women
(55%) were still attending Quranic schools because of the emphasis on
religion in the study area. There is however an intra rural pattern disparity to
these broad categories. Majority of the women in Sabon-Gari LGAs appear to
be more “modern” and elitist in their socio-demographic attributes. For
instance those with secondary and tertiary education are more in Sabon-Gari
than Giwa LGA.
Involvement of rural women in Agriculture
Respondents were asked the level of their involvement in agricultural
activities. It was clearly seen from the response that all the respondents
were in one way or the other involved in agricultural activities. Table 1
presents the analysis.
Table 1: Type of Agricultural Activities involved in by women.
Agricultural activity No. of respondents Percentage (%)
Planting & Hoeing
Livestock keeping
Mixed farming
Harvesting
51
24
165
40
18.2
8.6
58.9
14.3
Total 280 100 Source: Field Survey, 2008-2009
Of the 280 respondents, about 18.2% were involved in crop production
processes such as planting and hoeing, 8.6 % were involved only in livestock
keeping. These include small ruminant animals like goat and sheep kept for
food and cash purposes. About 58.9 % were involved in mixed farming,
which is made up of crop production and animal husbandry. This constitutes
the most
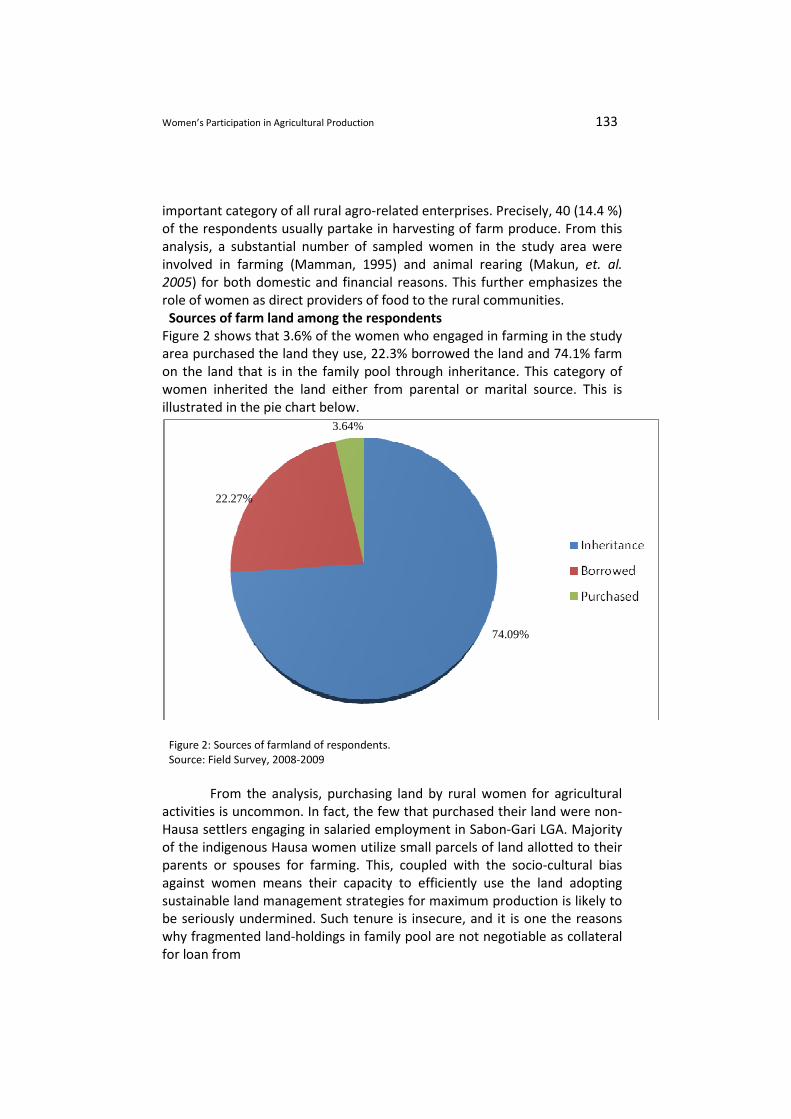
Women’s Participation in Agricultural Production 133
important category of all rural agro-related enterprises. Precisely, 40 (14.4 %)
of the respondents usually partake in harvesting of farm produce. From this
analysis, a substantial number of sampled women in the study area were
involved in farming (Mamman, 1995) and animal rearing (Makun, et. al.
2005) for both domestic and financial reasons. This further emphasizes the
role of women as direct providers of food to the rural communities.
Sources of farm land among the respondents
Figure 2 shows that 3.6% of the women who engaged in farming in the study
area purchased the land they use, 22.3% borrowed the land and 74.1% farm
on the land that is in the family pool through inheritance. This category of
women inherited the land either from parental or marital source. This is
illustrated in the pie chart below.
Figure 2: Sources of farmland of respondents. Source: Field Survey, 2008-2009
From the analysis, purchasing land by rural women for agricultural
activities is uncommon. In fact, the few that purchased their land were non-
Hausa settlers engaging in salaried employment in Sabon-Gari LGA. Majority
of the indigenous Hausa women utilize small parcels of land allotted to their
parents or spouses for farming. This, coupled with the socio-cultural bias
against women means their capacity to efficiently use the land adopting
sustainable land management strategies for maximum production is likely to
be seriously undermined. Such tenure is insecure, and it is one the reasons
why fragmented land-holdings in family pool are not negotiable as collateral
for loan from
74.09%
22.27%
3.64%
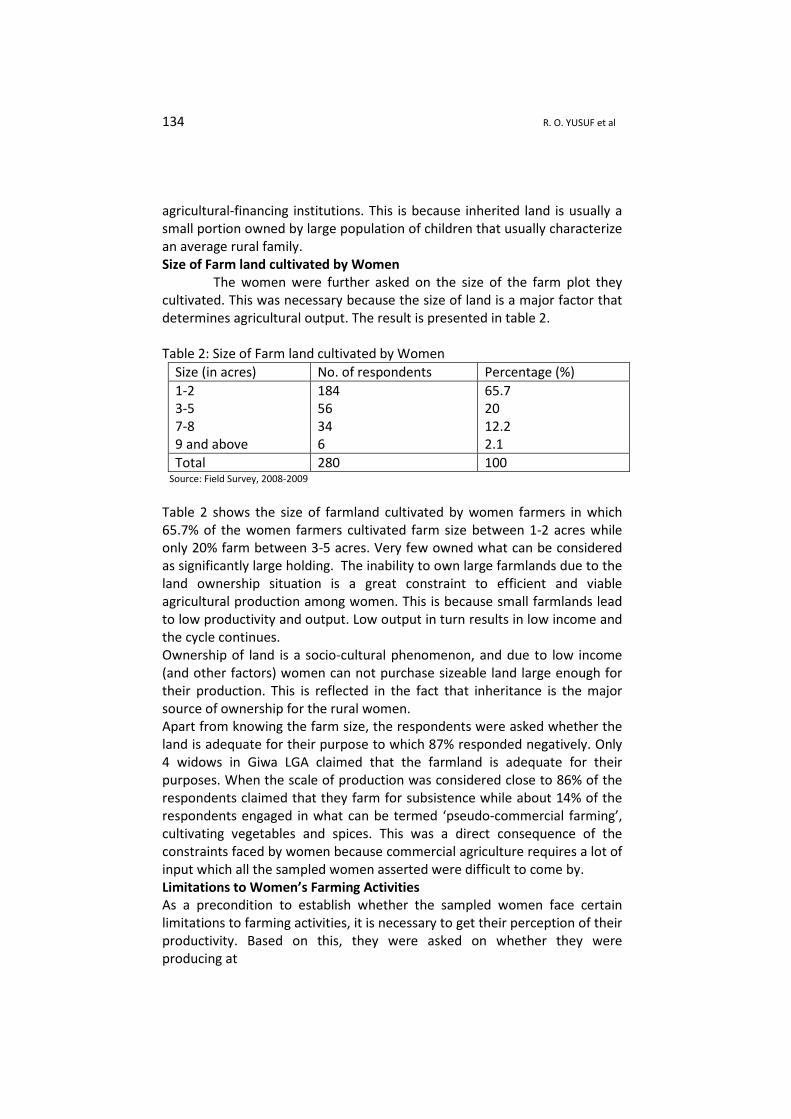
134 R. O. YUSUF et al
agricultural-financing institutions. This is because inherited land is usually a
small portion owned by large population of children that usually characterize
an average rural family.
Size of Farm land cultivated by Women
The women were further asked on the size of the farm plot they
cultivated. This was necessary because the size of land is a major factor that
determines agricultural output. The result is presented in table 2.
Table 2: Size of Farm land cultivated by Women
Size (in acres) No. of respondents Percentage (%)
1-2
3-5
7-8
9 and above
184
56
34
6
65.7
20
12.2
2.1
Total 280 100 Source: Field Survey, 2008-2009
Table 2 shows the size of farmland cultivated by women farmers in which
65.7% of the women farmers cultivated farm size between 1-2 acres while
only 20% farm between 3-5 acres. Very few owned what can be considered
as significantly large holding. The inability to own large farmlands due to the
land ownership situation is a great constraint to efficient and viable
agricultural production among women. This is because small farmlands lead
to low productivity and output. Low output in turn results in low income and
the cycle continues.
Ownership of land is a socio-cultural phenomenon, and due to low income
(and other factors) women can not purchase sizeable land large enough for
their production. This is reflected in the fact that inheritance is the major
source of ownership for the rural women.
Apart from knowing the farm size, the respondents were asked whether the
land is adequate for their purpose to which 87% responded negatively. Only
4 widows in Giwa LGA claimed that the farmland is adequate for their
purposes. When the scale of production was considered close to 86% of the
respondents claimed that they farm for subsistence while about 14% of the
respondents engaged in what can be termed ‘pseudo-commercial farming’,
cultivating vegetables and spices. This was a direct consequence of the
constraints faced by women because commercial agriculture requires a lot of
input which all the sampled women asserted were difficult to come by.
Limitations to Women’s Farming Activities
As a precondition to establish whether the sampled women face certain
limitations to farming activities, it is necessary to get their perception of their
productivity. Based on this, they were asked on whether they were
producing at
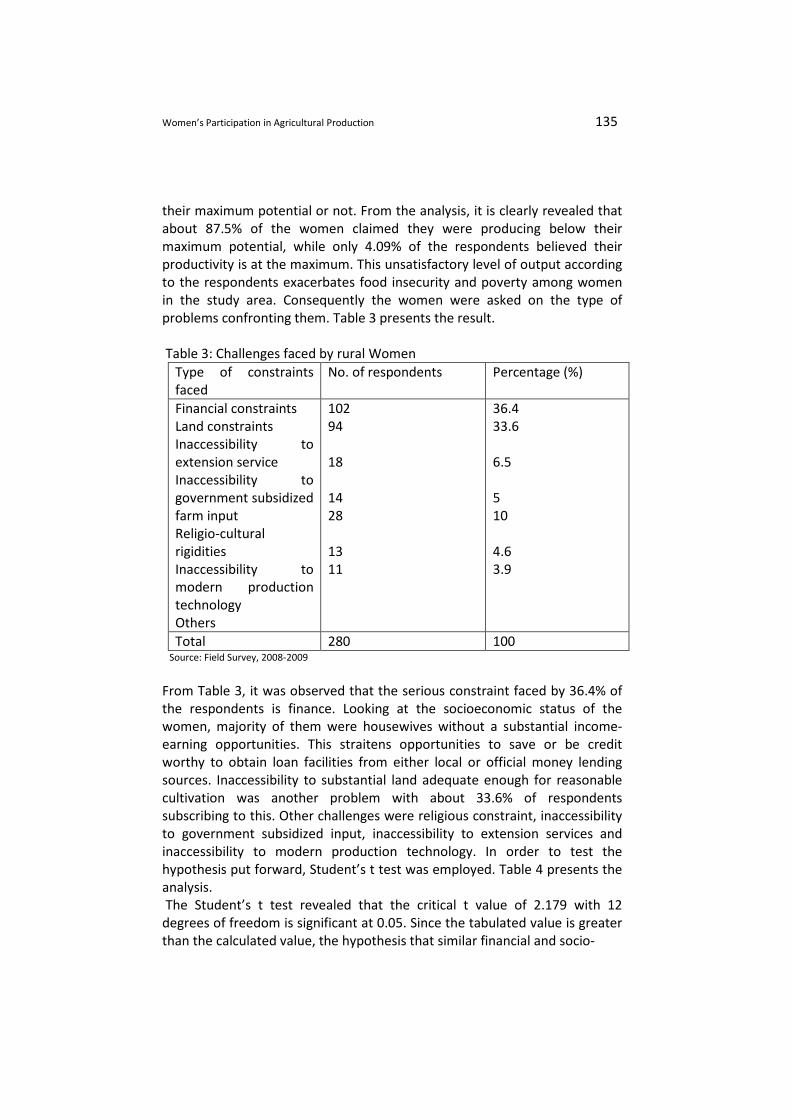
Women’s Participation in Agricultural Production 135
their maximum potential or not. From the analysis, it is clearly revealed that
about 87.5% of the women claimed they were producing below their
maximum potential, while only 4.09% of the respondents believed their
productivity is at the maximum. This unsatisfactory level of output according
to the respondents exacerbates food insecurity and poverty among women
in the study area. Consequently the women were asked on the type of
problems confronting them. Table 3 presents the result.
Table 3: Challenges faced by rural Women
Type of constraints
faced
No. of respondents Percentage (%)
Financial constraints
Land constraints
Inaccessibility to
extension service
Inaccessibility to
government subsidized
farm input
Religio-cultural
rigidities
Inaccessibility to
modern production
technology
Others
102
94
18
14
28
13
11
36.4
33.6
6.5
5
10
4.6
3.9
Total 280 100 Source: Field Survey, 2008-2009
From Table 3, it was observed that the serious constraint faced by 36.4% of
the respondents is finance. Looking at the socioeconomic status of the
women, majority of them were housewives without a substantial income-
earning opportunities. This straitens opportunities to save or be credit
worthy to obtain loan facilities from either local or official money lending
sources. Inaccessibility to substantial land adequate enough for reasonable
cultivation was another problem with about 33.6% of respondents
subscribing to this. Other challenges were religious constraint, inaccessibility
to government subsidized input, inaccessibility to extension services and
inaccessibility to modern production technology. In order to test the
hypothesis put forward, Student’s t test was employed. Table 4 presents the
analysis.
The Student’s t test revealed that the critical t value of 2.179 with 12
degrees of freedom is significant at 0.05. Since the tabulated value is greater
than the calculated value, the hypothesis that similar financial and socio-
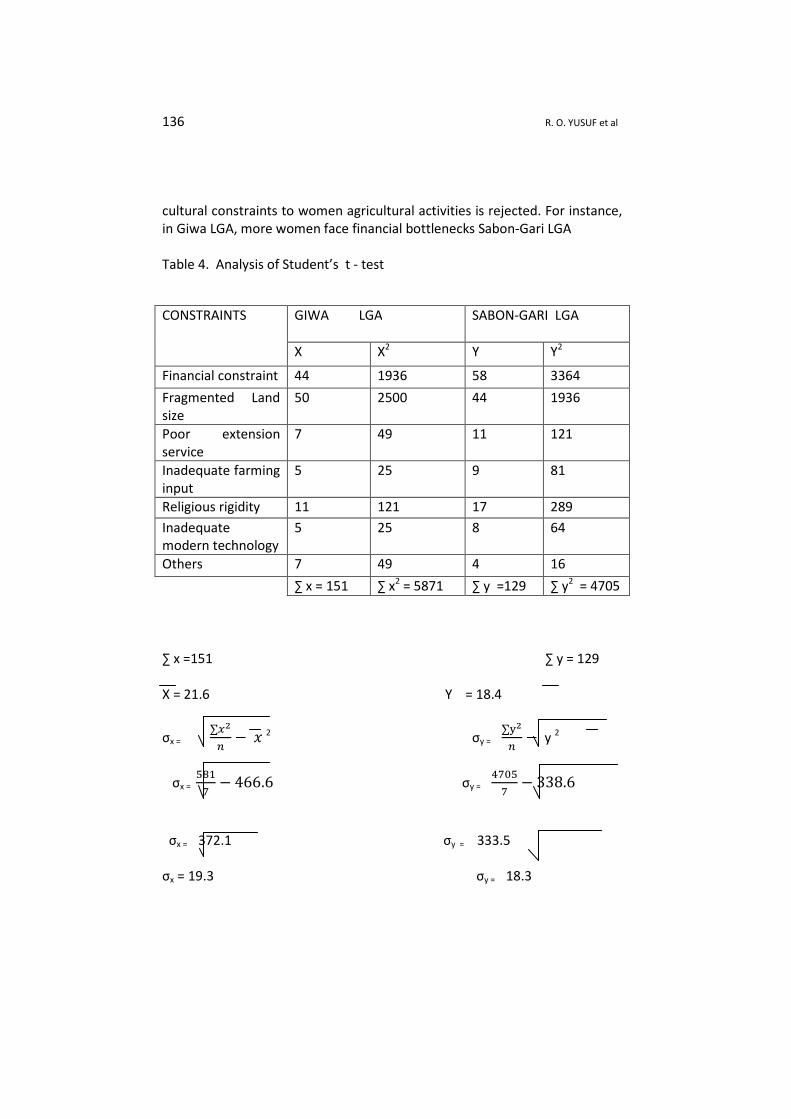
136 R. O. YUSUF et al
cultural constraints to women agricultural activities is rejected. For instance,
in Giwa LGA, more women face financial bottlenecks Sabon-Gari LGA
Table 4. Analysis of Student’s t - test
∑ x =151 ∑ y = 129
X = 21.6 Y = 18.4
σx = ∑��
�� � 2
σy = ∑��
�� y 2
σx = �
�� 466.6 σy =
���
�� 338.6
σx = 372.1 σy = 333.5
σx = 19.3 σy = 18.3
CONSTRAINTS GIWA LGA
SABON-GARI LGA
X X2 Y Y2
Financial constraint 44 1936 58 3364
Fragmented Land
size
50 2500 44 1936
Poor extension
service
7 49 11 121
Inadequate farming
input
5 25 9 81
Religious rigidity 11 121 17 289
Inadequate
modern technology
5 25 8 64
Others 7 49 4 16
∑ x = 151 ∑ x2 = 5871 ∑ y =129 ∑ y2 = 4705
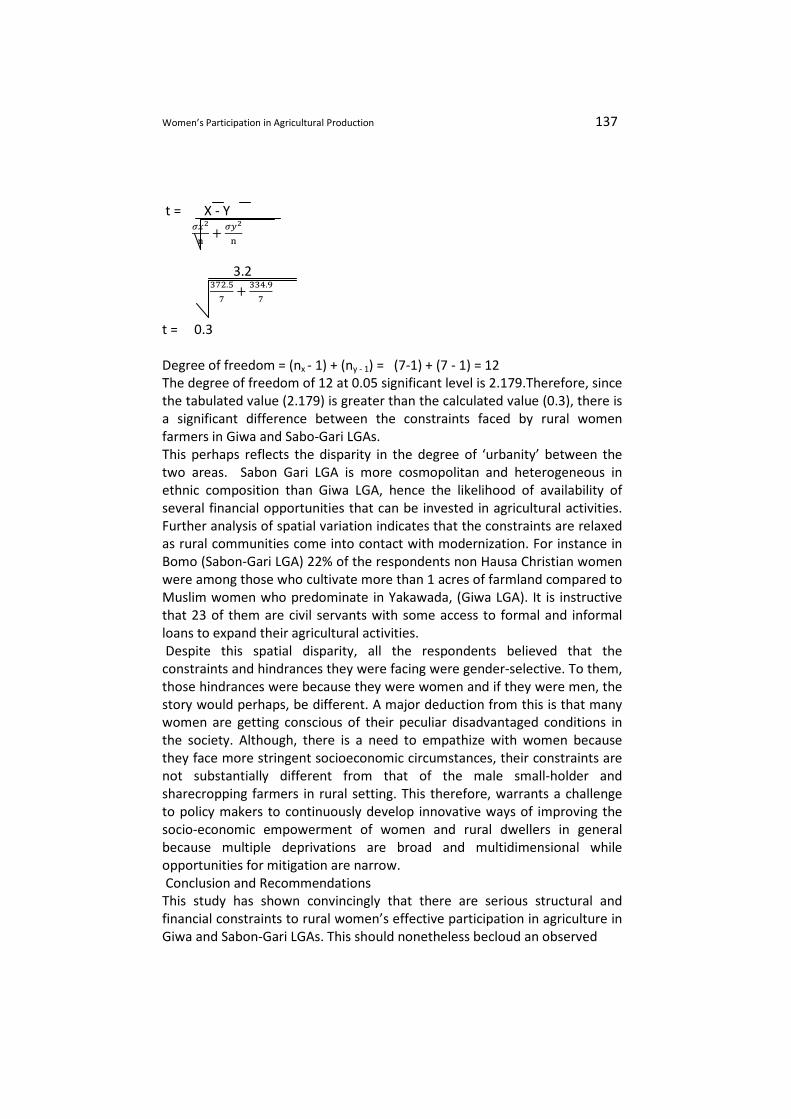
Women’s Participation in Agricultural Production 137
t = X - Y
���
��
���
�
3.2
���.
��
���.�
�
t = 0.3
Degree of freedom = (nx - 1) + (ny - 1) = (7-1) + (7 - 1) = 12
The degree of freedom of 12 at 0.05 significant level is 2.179.Therefore, since
the tabulated value (2.179) is greater than the calculated value (0.3), there is
a significant difference between the constraints faced by rural women
farmers in Giwa and Sabo-Gari LGAs.
This perhaps reflects the disparity in the degree of ‘urbanity’ between the
two areas. Sabon Gari LGA is more cosmopolitan and heterogeneous in
ethnic composition than Giwa LGA, hence the likelihood of availability of
several financial opportunities that can be invested in agricultural activities.
Further analysis of spatial variation indicates that the constraints are relaxed
as rural communities come into contact with modernization. For instance in
Bomo (Sabon-Gari LGA) 22% of the respondents non Hausa Christian women
were among those who cultivate more than 1 acres of farmland compared to
Muslim women who predominate in Yakawada, (Giwa LGA). It is instructive
that 23 of them are civil servants with some access to formal and informal
loans to expand their agricultural activities.
Despite this spatial disparity, all the respondents believed that the
constraints and hindrances they were facing were gender-selective. To them,
those hindrances were because they were women and if they were men, the
story would perhaps, be different. A major deduction from this is that many
women are getting conscious of their peculiar disadvantaged conditions in
the society. Although, there is a need to empathize with women because
they face more stringent socioeconomic circumstances, their constraints are
not substantially different from that of the male small-holder and
sharecropping farmers in rural setting. This therefore, warrants a challenge
to policy makers to continuously develop innovative ways of improving the
socio-economic empowerment of women and rural dwellers in general
because multiple deprivations are broad and multidimensional while
opportunities for mitigation are narrow.
Conclusion and Recommendations
This study has shown convincingly that there are serious structural and
financial constraints to rural women’s effective participation in agriculture in
Giwa and Sabon-Gari LGAs. This should nonetheless becloud an observed
138 R. O. YUSUF et al
spatial variation due to disparity in level of urbanization and intensity of
indicators of modernization. As such, it can be concluded that constraints
faced by rural women are relaxed with increasing heterogeneity of the rural
settlements, though further studies are needed to validate this assertion.
However, urgent remedial actions are needed to improve the situation. As a
result, the following recommendations are proffered.
There should be improved access to loan, either by establishing
women-centred cooperative societies that would aid easy access to loan by
these low-income and resource-poor women. . Evidences abound that
women are more often afflicted by poverty and rural women are usually the
worse off due to a number of interacting socio-economic factors. Women
farmers should be given attention by the Microfinance institutions (MFIs)
and Nigerian Agricultural Credit and Rural Development Bank (NACRDB)
currently used by government. This is because women by their nature can be
more parsimonious and debt-conscious than men hence are more likely not
to default in payment of loans. More over Women and Children welfare
departments in the local government councils can partner with MFIs and
NACRDB to specifically develop loan scheme that will benefit rural women
farmers.
The current land tenure system should be re-evaluated and
negotiated through workable policies on land restructuring and reform such
that fertile land will be available for agricultural purpose of women to boost
their production. It is pleasing that the federal government has made Land
Reforms one of its Seven-Point Agenda to achieving vision 20-20-20.
However conscientious effort should be made to see that its implementation
favours rural women who have been hitherto disadvantaged by the existing
socio-culturally defined tenure system
Also, there should be improved access to inputs such as fertilizer,
improved seeds, pesticide etc. at subsidized rates. In this direction,
organizing women to form functional cooperative societies will be helpful.
Through these cooperatives, subsidized input would get to the rural women
farmers, by-passing the middle-men that inflate prices. Better access of
women to agricultural extension services should be emphasized. By this,
information on best practices will get to them so as to enhance greater yield.
Public enlightenment programmes should be organized for women farmers
using their various cooperative societies. Through these they would improve
on their skill in agricultural practices and encourage rural development.
On a general note, there is a need to further examine the
constraints to agriculture facing both rural women and men. It is not enough
to single out a gender for empowerment since both men and women engage
in agriculture. Above all, human capital development is a major key to
unlocking poverty and increasing productivity. Education of the girl-child and
Women’s Participation in Agricultural Production 139
rural women should be intensified. Without being educated women
(especially rural women) will continue to grope in the abyss of poverty and
under maximization of their agricultural potentials.
The findings of the study have potential research benefits. There is a need
for further investigation of the factor that account for disparity in constraints
experienced by rural women in different socio-cultural settings so that
remedial measures for specific target groups can be evolved.
Acknowledgement
The authors are grateful to Mr Emmanuel Oluleye of the GIS Laboratory,
Department of Geography ABU, Zaria for digitizing the map and to Miss
Haulat Abdulraheem of Department of Geography ABU, Zaria for some
secretarial assistance.
REFERENCES
Akande, J.O. (1984): Participation of Women in Rural Development in Rural Development
and
Women in Africa Genera, ILO pp.129-134.
Ayoola, G.B (2001) Essay on the Agricultural Economy1.A Book of readings on Agricultural
Development Policy and Administration in Nigeria. Ibadan. T.M.A Publishers
Boserup, E .(1970) Women‘s Role in Economic Development. London.Allen and Unwin.
Bossen, L. (2005) Gender and Development Theories: From Invisible to Missing Women. A
Paper drafted for international workshop at the National Muzeum of Ethnology, Osaka,
Japan, pp 1-11
Dhamija, J. (1980), Technology as a threat to the Development of Women's Skill Authorities
still see Stereotypes. CERES/ FAO Review of Agriculture and Development
84(IV):6- 10 ECA African Training and Research Center for Women Addis Ababa.
Emeghara,E.E and Njoku,J.D(2008) Women Empowerment and Rural Poverty
Reduction
in Nigeria. In Igbozurike U,M et al (eds)Rural Poverty in Nigeria .Owerri. Cape
Printer and Publishers International .pp 111-121.
International Agency for Agricultural Development (IFAD) (1992) Women and Agricultural
Development in Africa. IFAD
Ipingbemi, O. and O. Aloba, (2005). The Transport Burden of Rural Women in Amuro District
in
Kogi State.Ilorin Journal of Busine and Social Sciences Vol. 10 No.1 pp, 1- 21
Lyam, A and Jeiyol, E.N (2008) Gender4 roles in Rural Land Degradation in Kwande Local
Government Areas of Benue state.,Nigeria. Savanna, Vol 21.Nos 1&2 pp 53-60.
Makun, H..J,.Ajanusi, J.O, Eboche, O.W, Olorunju, S.A.A and Otaru, S.M.(2005) Ownership
Pattern
of Goat and Goat Milking Practice in Nigeria. Savanna. Vol.1 pp 17-30.
Mamman, M (1995) Population and Women in Food Production. Savanna. Vol.16 pp 110-
119
Odugbesan,.J A.(2008) Gender and Sustainable Agriculture in Nigeria. Journal of
Geography, Environment and Planning.Vol 4. No 1. pp 134-138
Olayiwole, C.B. (1984). Women's Role in Agricultural and Economic Development in
Africa. The Case of Nigeria. A Paper Presented at the Seventeenth Annual
Seminar on Political Changes and Development in Africa. Southern University
Press, Louisiana. Pp 23.
140 R. O. YUSUF et al
Onyenechere,E.C (2008) The Effect on Women Informal Economic Activities of Reduction
on Poverty in Imo State. In Igbozurike, U.M et al (eds).Rural Poverty in Nigeria
.Owerri.
CapePrinter and publishers International. pp 99-110
Pala, A.O. (1976). African Women in rural Development. Research Trends and Priority. OLC
Paper No. 12. Overseas Liaison Committee, American Council on Education.
Peet, R.(1998) Modern Geographical Thought. Oxford. Blackwell Publisher.
Salihu, A.A and Ohwana, A.I (1995) New Perspectives on Women Empowerment
and Sustainable Rural Development in Nigeria. Savanna.Vol 15&16 pp 48-59
Stock , R. (2004). Africa, South of the Sahara. New York, The Guildford Press,
The Statistical Profile of Nigerian Women (1997) Abuja Federal Office of Statistic.
The Statistical Profile of Nigerian Women (1998) Abuja Federal Office of Statistic.
Trenchard , E.(1987) Rural Women’s work in Sub-Saharan Africa. In Monsen, J and
Townsend, J (eds) Geography of Gender in the Third World.Albany, State
University of New York Press. Pp 153-172
Ubogu, A.E and Aya, H.B (2010) Gender and Intra-Urban Transport in Sabon-Gari Area of Zaria
Kaduna state.A paper presented at the51st Annual Conference of the Association of
Nigerian Geographers held at the Kogi state University, Anyigba
between 7TH
-11TH
of March 2010.
Yusuf,O.R (2008) Participatory Appraisal of Poverty in the Rural Settlementsof Kaduna
states. in Igbozurike, U.M. et al (eds).Rural Poverty in Nigeria .Owerri. Cape
Printer and publishers International .pp 51-63
J. Agric. Res. & Dev. 9(2). Copy@2010. Faculty of Agriculture, University of Ilorin
The Use of Parkia Husk and Melon Wastes as Soil Amendments
O.B. FAWOLE, T.J. AJAYI, M.O. ADULOJU and J.O. OLANIYAN
Department of Agronomy, University of Ilorin,
Ilorin, Nigeria.
ABSTRACT
A pot experiment was conducted to assess the effects of amending soil with agricultural
wastes (Parkia biglobosa (Locust bean) husk (PAH), melon (Citrulus vulgaris) waste (MEW) and
their mixture (PAH + MEW)) on some soil physical and chemical properties. The agricultural
wastes were applied at two levels (7.5% and 10% w/w agricultural waste/soil) in a randomized
complete block design. Changes in soil properties (bulk density, water holding capacity,
organic carbon and available phosphorus contents) were observed over a period of 12 weeks.
The available phosphorus (P) content of the soil was significantly increased (P<0.05) by all
treatments. The P contents of the soils at 12 weeks after amendment at 10% level were: 8.6
mg Kg-1
soil for MEW, 7.7 mg Kg-1
soil for PAH, 7.0 mg Kg-1
soil for PAH + MEW while that of
the control (no amendment) was 2.5 mg Kg-1
soil. All the treatments significantly improved the
soil physical properties. A significant reduction (P<0.05) in soil bulk density was observed.
MEW significantly improved soil properties than PAH or the mixture of PAH and MEW. Both
MEW and PAH were found to have potentials for use in improving soil fertility and soil physical
properties.
Key words: Agricultural waste, Parkia husk, melon waste, soil properties
INTRODUCTION
The yields of crops have increased over the last fifty years, and
especially so in the last decade. This has taken a heavy toll on the soil, since it
has had to supply the nutrients required for the increase in crop yields. Most
soil nutrients have been found to correlate positively with the organic matter
content of Nigerian soils (Agboola and Corey, (1976). This remarkable
increase in soil productivity has caused reduction in organic matter level in
the soil, leaving the soil more prone to degradation and erosion (Ano, 1990).
Chemical fertilizers are essential in most cropping systems. However,
in long term field experiments where only mineral fertilizers have been used,
problems which include increase in soil erosion, soil compaction and
environmental pollution have been encountered (Lal, 1986). The use of
ammonium sulphate as a nitrogenous fertilizer was reported to increase
acidity in some soils and also destroy biotic life (Lal, 1986). The overall effects
of these chemical inputs in crop production include soil degradation, poor
plant nutrition and consequently, poor human nutrition, with resultant
public health implications. Organic fertilizers or manures have been shown to
improve physical properties of soils (Chai et al., 1988), soil fertility and
consequently crop yield (Lal and Mathur, 1989). Apart from production of
more vigorous and high
142 O. B. FAWOLE et al
yielding crops, improvement in overall soil quality from the use of organic
soil amendments could reduce the potential for nutrient contamination of
ground and surface water. Also, research studies have shown that
incorporation of crop res idues after harvest improved crop yields
either directly by enhancing nutrient availability (Rebefka et al, 1993, Sidhu
and Sur, 1993) or indirectly because of positive changes in soil properties
(Power et al,1998; Sow et al, 1998).
Phosphorus is an element of great importance in crop production,
especially in the savanna ecological zone. It is most abundant in seeds and
fruits. It is usually in short supplies in savanna soils and the little available
quantity is often sorbed and rendered unavailable to plants (Lombin, 1983).
Most of the phosphorus in savanna soils is positively correlated with soil
organic matter. In the southern Guinea savanna zone of Nigeria where this
study was carried out, Parkia biglobosa (Locust bean) is a common economic
tree crop while Citrulus vulgaris (melon) is a very important annual crop. The
wastes from both crops are usually discarded haphazardly on refuse dump
sites or left to rot on farmer’s farms in the study area.
Over the last decade, a lot of research into the use of plant residue as
organic fertilizer have been carried out. Nottidge et al. (2005), Adetunji and
Okeleye (2001), and Yusuf and Fawole (2006) worked on the use of Panicum
maximum and Imperata cylindrical (common grass weeds in this study area)
for improving soil available P. They all reported that soil physical properties
were improved and P contents of soils were increased when plant residues
were used as organic amendments. There are still many agricultural wastes
that can be used for soil amendments and as organic fertilizer. This work
studied the changes in soil properties and phosphorus content when Parkia
husk and melon waste were used for soil amendment.
MATERIALS AND METHODS
Pot experiment
Soil samples were taken randomly at a depth of 0-15cm from the Teaching
and Research Farm of the Faculty of Agriculture, University of Ilorin, in the
Southern Guinea Savannah zone of Nigeria. The soil samples were air-dried
and three kilograms of each sample was weighed into small plastic pots with
basal perforation. The pots were arranged in a screen-house in a
Randomized Complete Block Design (RCBD). One kilogram of each of the soil
samples were air-dried and sieved with a 2-mm sieve for chemical analyses in
the laboratory.
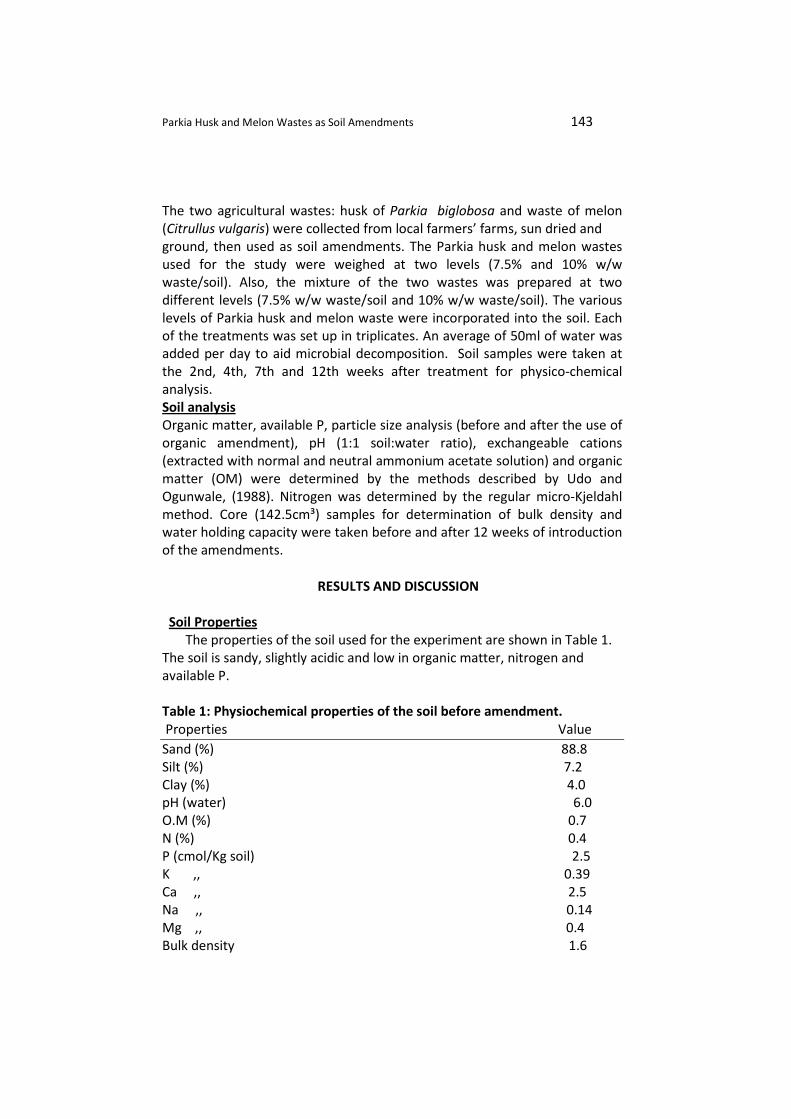
Parkia Husk and Melon Wastes as Soil Amendments 143
The two agricultural wastes: husk of Parkia biglobosa and waste of melon
(Citrullus vulgaris) were collected from local farmers’ farms, sun dried and
ground, then used as soil amendments. The Parkia husk and melon wastes
used for the study were weighed at two levels (7.5% and 10% w/w
waste/soil). Also, the mixture of the two wastes was prepared at two
different levels (7.5% w/w waste/soil and 10% w/w waste/soil). The various
levels of Parkia husk and melon waste were incorporated into the soil. Each
of the treatments was set up in triplicates. An average of 50ml of water was
added per day to aid microbial decomposition. Soil samples were taken at
the 2nd, 4th, 7th and 12th weeks after treatment for physico-chemical
analysis.
Soil analysis
Organic matter, available P, particle size analysis (before and after the use of
organic amendment), pH (1:1 soil:water ratio), exchangeable cations
(extracted with normal and neutral ammonium acetate solution) and organic
matter (OM) were determined by the methods described by Udo and
Ogunwale, (1988). Nitrogen was determined by the regular micro-Kjeldahl
method. Core (142.5cm³) samples for determination of bulk density and
water holding capacity were taken before and after 12 weeks of introduction
of the amendments.
RESULTS AND DISCUSSION
Soil Properties
The properties of the soil used for the experiment are shown in Table 1.
The soil is sandy, slightly acidic and low in organic matter, nitrogen and
available P.
Table 1: Physiochemical properties of the soil before amendment.
Properties Value
Sand (%) 88.8
Silt (%) 7.2
Clay (%) 4.0
pH (water) 6.0
O.M (%) 0.7
N (%) 0.4
P (cmol/Kg soil) 2.5
K ,, 0.39
Ca ,, 2.5
Na ,, 0.14
Mg ,, 0.4
Bulk density 1.6
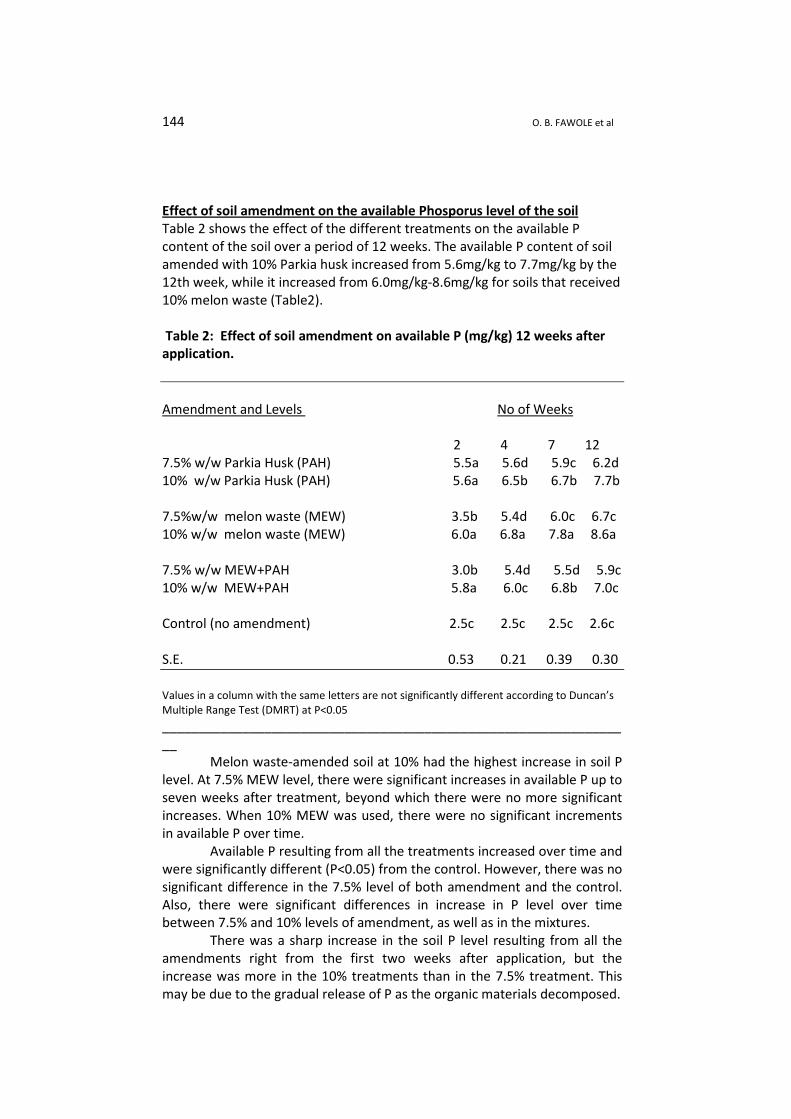
144 O. B. FAWOLE et al
Effect of soil amendment on the available Phosporus level of the soil
Table 2 shows the effect of the different treatments on the available P
content of the soil over a period of 12 weeks. The available P content of soil
amended with 10% Parkia husk increased from 5.6mg/kg to 7.7mg/kg by the
12th week, while it increased from 6.0mg/kg-8.6mg/kg for soils that received
10% melon waste (Table2).
Table 2: Effect of soil amendment on available P (mg/kg) 12 weeks after
application.
Amendment and Levels No of Weeks
2 4 7 12
7.5% w/w Parkia Husk (PAH) 5.5a 5.6d 5.9c 6.2d
10% w/w Parkia Husk (PAH) 5.6a 6.5b 6.7b 7.7b
7.5%w/w melon waste (MEW) 3.5b 5.4d 6.0c 6.7c
10% w/w melon waste (MEW) 6.0a 6.8a 7.8a 8.6a
7.5% w/w MEW+PAH 3.0b 5.4d 5.5d 5.9c
10% w/w MEW+PAH 5.8a 6.0c 6.8b 7.0c
Control (no amendment) 2.5c 2.5c 2.5c 2.6c
S.E. 0.53 0.21 0.39 0.30
Values in a column with the same letters are not significantly different according to Duncan’s
Multiple Range Test (DMRT) at P<0.05
_______________________________________________________________
__
Melon waste-amended soil at 10% had the highest increase in soil P
level. At 7.5% MEW level, there were significant increases in available P up to
seven weeks after treatment, beyond which there were no more significant
increases. When 10% MEW was used, there were no significant increments
in available P over time.
Available P resulting from all the treatments increased over time and
were significantly different (P<0.05) from the control. However, there was no
significant difference in the 7.5% level of both amendment and the control.
Also, there were significant differences in increase in P level over time
between 7.5% and 10% levels of amendment, as well as in the mixtures.
There was a sharp increase in the soil P level resulting from all the
amendments right from the first two weeks after application, but the
increase was more in the 10% treatments than in the 7.5% treatment. This
may be due to the gradual release of P as the organic materials decomposed.
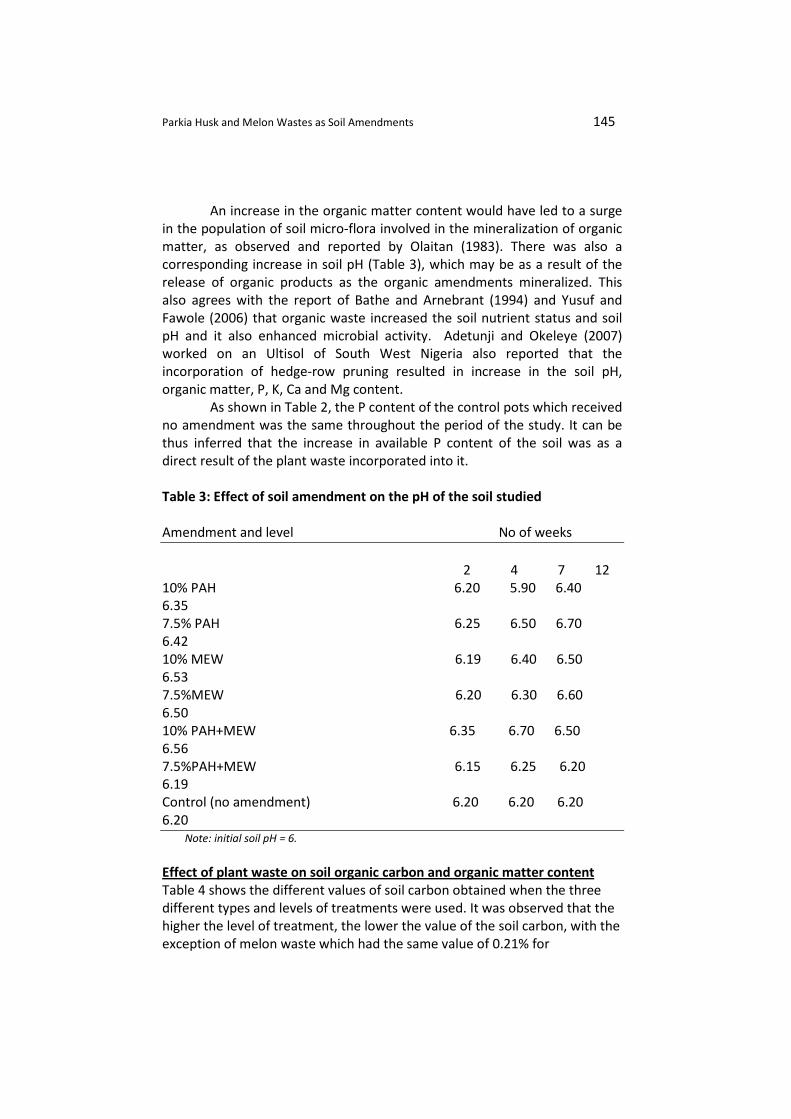
Parkia Husk and Melon Wastes as Soil Amendments 145
An increase in the organic matter content would have led to a surge
in the population of soil micro-flora involved in the mineralization of organic
matter, as observed and reported by Olaitan (1983). There was also a
corresponding increase in soil pH (Table 3), which may be as a result of the
release of organic products as the organic amendments mineralized. This
also agrees with the report of Bathe and Arnebrant (1994) and Yusuf and
Fawole (2006) that organic waste increased the soil nutrient status and soil
pH and it also enhanced microbial activity. Adetunji and Okeleye (2007)
worked on an Ultisol of South West Nigeria also reported that the
incorporation of hedge-row pruning resulted in increase in the soil pH,
organic matter, P, K, Ca and Mg content.
As shown in Table 2, the P content of the control pots which received
no amendment was the same throughout the period of the study. It can be
thus inferred that the increase in available P content of the soil was as a
direct result of the plant waste incorporated into it.
Table 3: Effect of soil amendment on the pH of the soil studied
Amendment and level No of weeks
2 4 7 12
10% PAH 6.20 5.90 6.40
6.35
7.5% PAH 6.25 6.50 6.70
6.42
10% MEW 6.19 6.40 6.50
6.53
7.5%MEW 6.20 6.30 6.60
6.50
10% PAH+MEW 6.35 6.70 6.50
6.56
7.5%PAH+MEW 6.15 6.25 6.20
6.19
Control (no amendment) 6.20 6.20 6.20
6.20
Note: initial soil pH = 6.
Effect of plant waste on soil organic carbon and organic matter content
Table 4 shows the different values of soil carbon obtained when the three
different types and levels of treatments were used. It was observed that the
higher the level of treatment, the lower the value of the soil carbon, with the
exception of melon waste which had the same value of 0.21% for
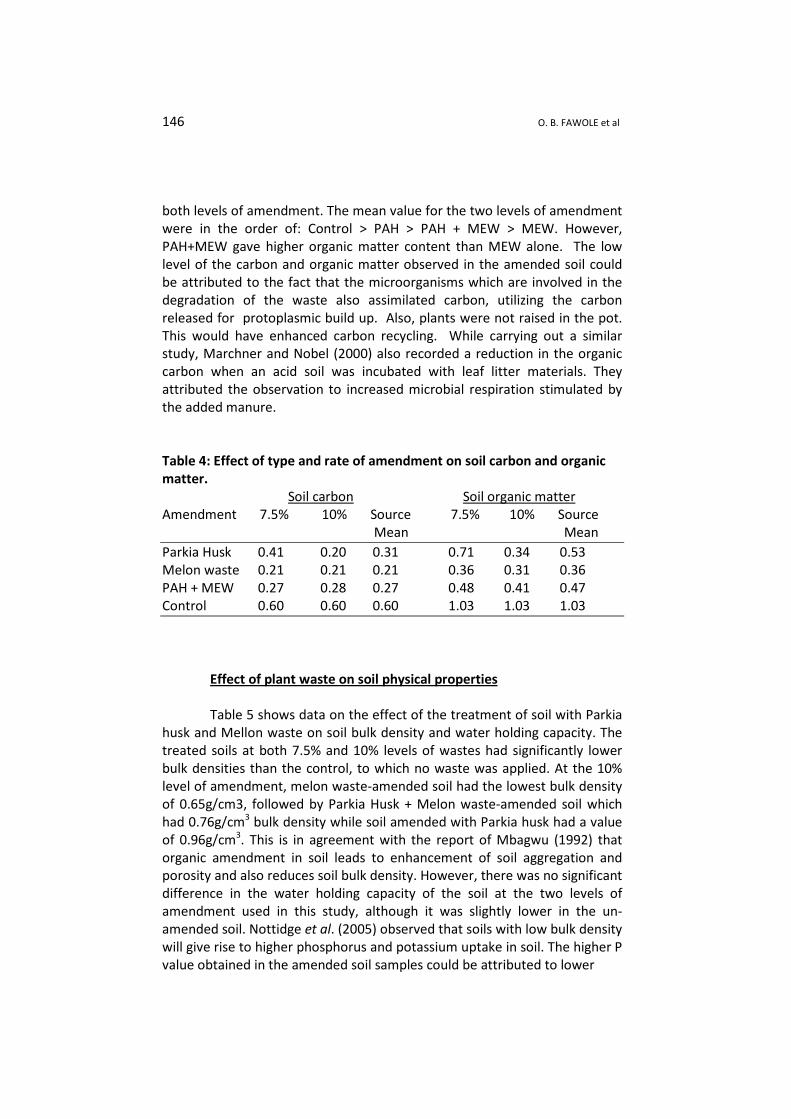
146 O. B. FAWOLE et al
both levels of amendment. The mean value for the two levels of amendment
were in the order of: Control > PAH > PAH + MEW > MEW. However,
PAH+MEW gave higher organic matter content than MEW alone. The low
level of the carbon and organic matter observed in the amended soil could
be attributed to the fact that the microorganisms which are involved in the
degradation of the waste also assimilated carbon, utilizing the carbon
released for protoplasmic build up. Also, plants were not raised in the pot.
This would have enhanced carbon recycling. While carrying out a similar
study, Marchner and Nobel (2000) also recorded a reduction in the organic
carbon when an acid soil was incubated with leaf litter materials. They
attributed the observation to increased microbial respiration stimulated by
the added manure.
Table 4: Effect of type and rate of amendment on soil carbon and organic
matter.
Soil carbon Soil organic matter
Amendment 7.5% 10% Source 7.5% 10% Source
Mean Mean
Parkia Husk 0.41 0.20 0.31 0.71 0.34 0.53
Melon waste 0.21 0.21 0.21 0.36 0.31 0.36
PAH + MEW 0.27 0.28 0.27 0.48 0.41 0.47
Control 0.60 0.60 0.60 1.03 1.03 1.03
Effect of plant waste on soil physical properties
Table 5 shows data on the effect of the treatment of soil with Parkia
husk and Mellon waste on soil bulk density and water holding capacity. The
treated soils at both 7.5% and 10% levels of wastes had significantly lower
bulk densities than the control, to which no waste was applied. At the 10%
level of amendment, melon waste-amended soil had the lowest bulk density
of 0.65g/cm3, followed by Parkia Husk + Melon waste-amended soil which
had 0.76g/cm3 bulk density while soil amended with Parkia husk had a value
of 0.96g/cm3. This is in agreement with the report of Mbagwu (1992) that
organic amendment in soil leads to enhancement of soil aggregation and
porosity and also reduces soil bulk density. However, there was no significant
difference in the water holding capacity of the soil at the two levels of
amendment used in this study, although it was slightly lower in the un-
amended soil. Nottidge et al. (2005) observed that soils with low bulk density
will give rise to higher phosphorus and potassium uptake in soil. The higher P
value obtained in the amended soil samples could be attributed to lower
Parkia Husk and Melon Wastes as Soil Amendments 147
bulk densities observed in them. For the un-amended soil which had a bulk
density of 1.69g/cm3, the low P value obtained could be due to the fact that
at higher bulk density, P mineralization is reduced.
Table 5: Effect of amendments on some soil physical properties.
Rate of Application
Amendments Bulk density (g/cm3) Water Holding
Capacity (%) 7.5% 10% 7.5% 10%
Parkia Husk 1.10b 0.96b 14.44 14.54
Melon Waste 0.89c 0.65c 14.36 14.92
PAH + MEW 0.84c 0.76d 14.62 14.75
Control 1.69a 1.69a 13.97 13.97
S.E. 0.03 0.04 NS NS
Values in a column with the same letters are not significantly different
(DMRT at 5% level of probability)
CONCLUSION
This study has shown that Parkia husk and melon waste have the
potential for use as organic fertilizers, particularly in soils with low
phosphorus level. The two levels of the wastes used significantly reduced the
soil bulk density and significantly increased the soil available P content.
However, melon waste treatment significantly improved soil properties more
than Parkia alone or mixtures of both.
REFERENCES
Adetunji, M. T. and Okeleye, K.A. (2001): Effect of Incorporating Legume Hedgerow
Prunning On Properties of An Oxic Palendult in South Western Nigeria.
Communication in Soil Science and Plant Analysis. 32:441-451.
Agboola, A. A. and Corey, R. B. (1976): Nutrient deficiency survey of maize in
Western Nigeria. Nig. Jour. Sci. 10: 1-14
Ano. A.O. (1990): Potassium fixation, speciation, distribution and exchange
thermodynamics in soil of Eastern Nigeria. Ph.D. Thesis, University of
Ibadan, Ibadan, Nigeria.
Bathe, E. and Arnebrant, K. (1994): Growth rate and response of bacterial
communities to pH in limed and ash treated forest soils. Soil Biology and
Biochemistry 6:995-1001.
148 O. B. FAWOLE et al
Chai, S.K.; Rao, D.L.N. and Batra, L. (1988): Nitrogen contribution to wetland rice by
green manuring with Sesbania spp. in an alkaline soil. Biology and Fertility of
Soil Journal (6). pg. 22-25.
Lal, S. and Mathur, B.S. (1989): Effect of Long Term Fertilization, Manuring and
Liming of an Alfisol in Maize, Wheat and Soil Properties, Journal of the
Indian Society of Soil Science. 37:717-224.
Lal. K. (1986): Soil Surface Management In The Tropics Advances In Soil Science,
Springer-Verlay, New York.
Lombin, G. (1983): Evaluating the micronutrient fertility of Nigeria’s semi-arid
savanna soils. 1: Copper and Manganese. Soil Science. 135(6): 377-384.
Marchner, B. and Nobel, A.D. (2000): Chemical and Biological Processes Leading to
the Neutralization of Acidity in Soil Incubated with Litter Materials. Soil
Biology and Biochemistry 32:805-813.
Mbagwu, J.S.C. (1992): Improving the Productivity of a Degraded Ultisol in Nigeria
Using Organic and Inorganic Amendments II: Changes in the Physical
Properties. Bioresource Technology 42:167-175.
Nottidge, D.O.; Ojeniyi, S.O. and Aswalam, D.O. (2005): Comparative Effects of Plant
Residues and NPK Fertilizers on Soil Properties in a Humid Ultisol. Nigerian
Journal of Soil Science 15:9-13.
Olaitan, S. O. (1983): Introduction to Tropical Soil Science Macmillan,
Ibadan,Nigeria.Pp63-66.
Power, J.F.;Koerner, P.T.; Doran, J.W. and Wilhelm,W.W.(1998): Residual effects of
crop residues on grain production and selected soil properties. Soil Sci. Soc.
Amer. Jour. 62:1393-1397.
Rebefka, P.F.; Ndunguru, B. J. and Marschnaer, H.(1993):Crop residues application
increase nitrogen fixation and dry matter production in groundnut (Arachis
hypogea L.) grown on an acid sandy soil in Niger. West Africa Plant and Soil
50: 213-222.
Sidhu, A.S. and Sur, H.S.(1993): Effect of Incorporation of Legume Straw on Soil
Properties and Crop Yield in a Maize-Wheat Sequence. Tropical Agric.
Trinidad 70:226-229.
Sow, A.A.;Hosner, L.R.: Unger,P.W. and Stewart,B.A.(1998): Effects of cultural
practices on nitrate in soil and nitrogen in grain Sorghum. Comm. Soil Sci.
and Plant Analysis. 29: 613-623.
Udo, U. J. and Ogunwale, J.A.(1988): Laboratory Manual for the Analysis of Soil,
Plant and Water Samples. Department of Agronomy, University of Ibadan,
Ibadan.
Yusuf, S.A. and Fawole, O. B. (2006): Effects of Soil Amendment with Guinea grass
(Panicum maximum Tacq.) on the Soil Available Phosphorus and Yield of
Maize (Zea mays L.) Journal of Agric. Research and. Development 5 (1): 75-
84
J. Agric. Res. & Dev.9(2). Copy@2010. Faculty of Agriculture, University of Ilorin
Agricultural Productivity under Taungya and Non-Taungya Land-Use
Options: A Case Study of Vandeikya Local Government, Benue State,
Nigeria
1 A.O. ADEGEYE,
2S.O. JIMOH and
2S.I.N . AGERA
1Department of Forest Resources Management, University of
Ibadan, Ibadan, Nigeria. 2
Department of Agricultural Extension Services, University of
Ibadan, Ibadan, Nigeria.
ABSTRACT
Taungya farming is a special arrangement between the forestry department and farmers ,
which combines the production of both arable and forest tree cops simultaneously on a piece
of land. The practice was adopted inVandeikya Local Government Area of Benue State Nigeria
in mid 1950s up to 2000. Using Stratified random sampling, two sets of questionnaire were
used to appraise the productivity of some arable crops and forest regeneration under taungya
and non-taungya cultural practices. The yields of arable crops were significantly higher under
taungya farming that non-taungya practice in the study area. There was however no
significant difference in the total forest area regenerated under the two land-use systems. The
apparent land hunger among farmers is a favourable factor for adoption of taungya as a land
use option in the study area. There is need to adopt multi-species planting approach in future
programmes sustainability of the programme. Also, the land tenure system which limits access
to land by strangers needs to be reviewed and greater awareness on the programme needs to
be generated among the farmers and forestry staff alike.
Key words: Taungya, Agroforestry, arable, productivity, forest.
INTRODUCTION
The principle of plant productivity has been viewed as a system of conversion
of solar energy into chemical energy that can be transported, and stored
through the process of photosynthesis (Nair, 1993). Management options
for optimizing productivity in plant communities under taungya practice are
based on the manipulation of solar radiation profile. The selection of species,
their arrangement and maintenance determine the photosynthetic efficiency
of the whole plant community. The traditional bush fallow system could be
sustained with sufficient fallow length which allows the soil to replenish itself
during the fallow period.
However, increases in human population leads to decrease in length
of fallow and increase in cropping intensity. Okojie (1997) observed that
shortened fallows caused by population explosion and excessive demand for
farmland in many parts of Nigeria has led to over-cropping of available
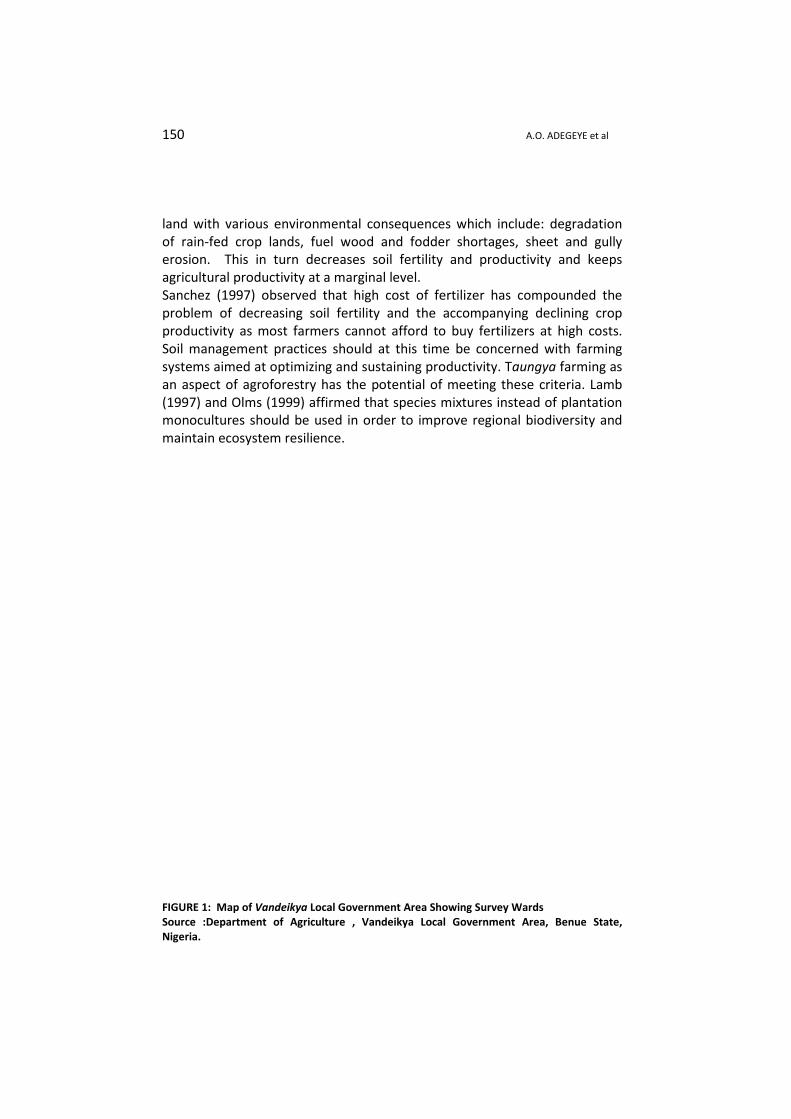
150
land with various environmental consequences which include: degradation
of rain-fed crop lands, fuel wood and fodder shortages
erosion. This in turn decreases soil fertility and productivity and keeps
agricultural productivity at a marginal level.
Sanchez (1997) observed that high cost of fertilizer has compounded the
problem of decreasing soil fertility and
productivity as most farmers cannot afford to buy fertilizers at high costs.
Soil management practices should at this time be concerned with farming
systems aimed at optimizing and sustaining productivity. T
an aspect of agroforestry has the potential of meeting these criteria. Lamb
(1997) and Olms (1999) affirmed that species mixtures instead of plantation
monocultures should be used in order to improve regional biodiversity and
maintain ecosystem resilienc
FIGURE 1: Map of Vandeikya
Source :Department of Agriculture , Vandeikya Local Government Area, Benue State,
Nigeria.
A.O. ADEGEYE et al
land with various environmental consequences which include: degradation
fed crop lands, fuel wood and fodder shortages, sheet and gully
erosion. This in turn decreases soil fertility and productivity and keeps
agricultural productivity at a marginal level.
Sanchez (1997) observed that high cost of fertilizer has compounded the
problem of decreasing soil fertility and the accompanying declining crop
productivity as most farmers cannot afford to buy fertilizers at high costs.
Soil management practices should at this time be concerned with farming
systems aimed at optimizing and sustaining productivity. Taungya farming a
an aspect of agroforestry has the potential of meeting these criteria. Lamb
(1997) and Olms (1999) affirmed that species mixtures instead of plantation
monocultures should be used in order to improve regional biodiversity and
maintain ecosystem resilience.
Vandeikya Local Government Area Showing Survey Wards
Source :Department of Agriculture , Vandeikya Local Government Area, Benue State,
A.O. ADEGEYE et al
land with various environmental consequences which include: degradation
, sheet and gully
erosion. This in turn decreases soil fertility and productivity and keeps
Sanchez (1997) observed that high cost of fertilizer has compounded the
the accompanying declining crop
productivity as most farmers cannot afford to buy fertilizers at high costs.
Soil management practices should at this time be concerned with farming
farming as
an aspect of agroforestry has the potential of meeting these criteria. Lamb
(1997) and Olms (1999) affirmed that species mixtures instead of plantation
monocultures should be used in order to improve regional biodiversity and
Source :Department of Agriculture , Vandeikya Local Government Area, Benue State,
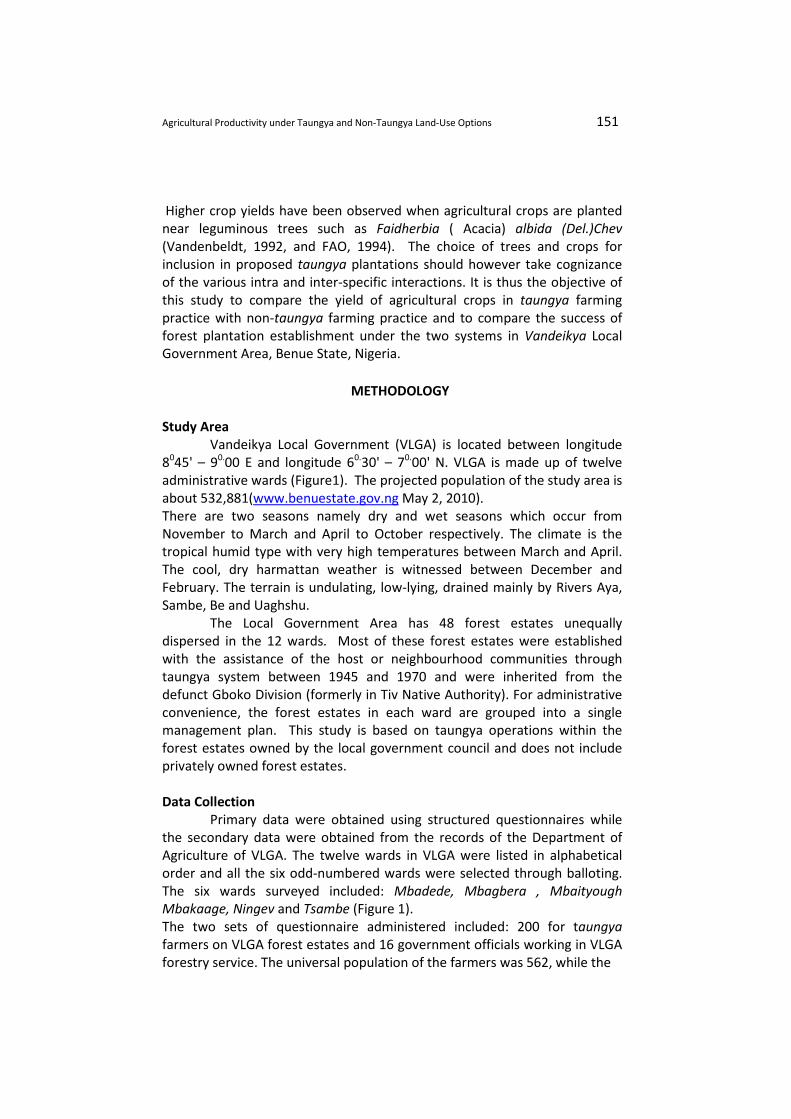
Agricultural Productivity under Taungya and Non-Taungya Land-Use Options 151
Higher crop yields have been observed when agricultural crops are planted
near leguminous trees such as Faidherbia ( Acacia) albida (Del.)Chev
(Vandenbeldt, 1992, and FAO, 1994). The choice of trees and crops for
inclusion in proposed taungya plantations should however take cognizance
of the various intra and inter-specific interactions. It is thus the objective of
this study to compare the yield of agricultural crops in taungya farming
practice with non-taungya farming practice and to compare the success of
forest plantation establishment under the two systems in Vandeikya Local
Government Area, Benue State, Nigeria.
METHODOLOGY
Study Area
Vandeikya Local Government (VLGA) is located between longitude
8045' – 90.00 E and longitude 60.30' – 70.00' N. VLGA is made up of twelve
administrative wards (Figure1). The projected population of the study area is
about 532,881(www.benuestate.gov.ng May 2, 2010).
There are two seasons namely dry and wet seasons which occur from
November to March and April to October respectively. The climate is the
tropical humid type with very high temperatures between March and April.
The cool, dry harmattan weather is witnessed between December and
February. The terrain is undulating, low-lying, drained mainly by Rivers Aya,
Sambe, Be and Uaghshu.
The Local Government Area has 48 forest estates unequally
dispersed in the 12 wards. Most of these forest estates were established
with the assistance of the host or neighbourhood communities through
taungya system between 1945 and 1970 and were inherited from the
defunct Gboko Division (formerly in Tiv Native Authority). For administrative
convenience, the forest estates in each ward are grouped into a single
management plan. This study is based on taungya operations within the
forest estates owned by the local government council and does not include
privately owned forest estates.
Data Collection
Primary data were obtained using structured questionnaires while
the secondary data were obtained from the records of the Department of
Agriculture of VLGA. The twelve wards in VLGA were listed in alphabetical
order and all the six odd-numbered wards were selected through balloting.
The six wards surveyed included: Mbadede, Mbagbera , Mbaityough
Mbakaage, Ningev and Tsambe (Figure 1).
The two sets of questionnaire administered included: 200 for taungya
farmers on VLGA forest estates and 16 government officials working in VLGA
forestry service. The universal population of the farmers was 562, while the
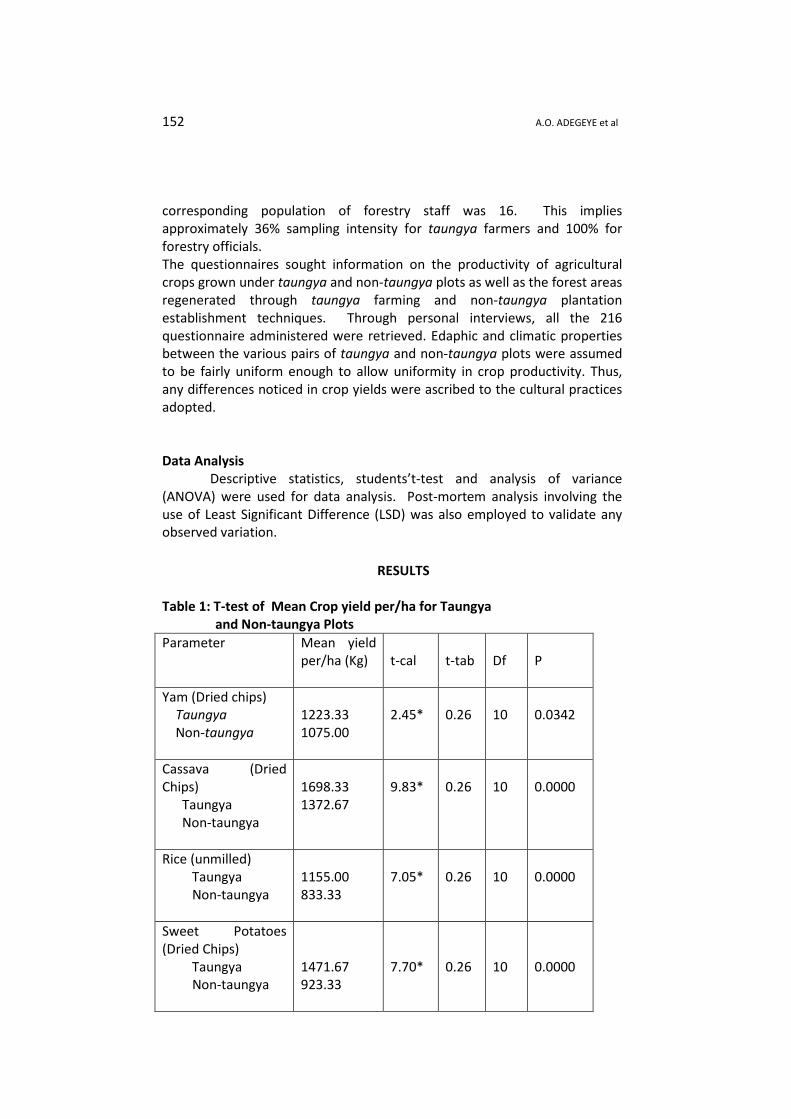
152 A.O. ADEGEYE et al
corresponding population of forestry staff was 16. This implies
approximately 36% sampling intensity for taungya farmers and 100% for
forestry officials.
The questionnaires sought information on the productivity of agricultural
crops grown under taungya and non-taungya plots as well as the forest areas
regenerated through taungya farming and non-taungya plantation
establishment techniques. Through personal interviews, all the 216
questionnaire administered were retrieved. Edaphic and climatic properties
between the various pairs of taungya and non-taungya plots were assumed
to be fairly uniform enough to allow uniformity in crop productivity. Thus,
any differences noticed in crop yields were ascribed to the cultural practices
adopted.
Data Analysis
Descriptive statistics, students’t-test and analysis of variance
(ANOVA) were used for data analysis. Post-mortem analysis involving the
use of Least Significant Difference (LSD) was also employed to validate any
observed variation.
RESULTS
Table 1: T-test of Mean Crop yield per/ha for Taungya
and Non-taungya Plots
Parameter Mean yield
per/ha (Kg)
t-cal
t-tab
Df
P
Yam (Dried chips)
Taungya
Non-taungya
1223.33
1075.00
2.45*
0.26
10
0.0342
Cassava (Dried
Chips)
Taungya
Non-taungya
1698.33
1372.67
9.83*
0.26
10
0.0000
Rice (unmilled)
Taungya
Non-taungya
1155.00
833.33
7.05*
0.26
10
0.0000
Sweet Potatoes
(Dried Chips)
Taungya
Non-taungya
1471.67
923.33
7.70*
0.26
10
0.0000
Maize
Taungya
Non-taungya
1133.33
710.00
13.40*
0.26
10
0.0000
Groundnuts
(unshelled)
Taungya
Non-taungya
1083.33
756.67
6.14*
0.26
10
0.0001
Soybeans
Taungya
Non-taungya
620.00
408.33
5.18*
0.26
10
0.0004
Guinea corn
Taungya
Non-taungya
725.00
516.67
5.73*
0.26
10
0.0001
Beans
Taungya
Non-taungya
458.33
408.33
2.42*
0.26
10
0.0358
Pepper
Taungya
Non-taungya
366.67
320.00
1.80*
0.26
10
0.1018
Melon
Taungya
Non-taungya
306.67
250.00
2.07
0.26
10
0.0655
* Significant
Forest Area Regenerated through Taungya and Non-Taungya Systems
Demographic Attributes of Respondents
The forestry members of staff were aged between 31 and 50 years; 87.50%
of them were married. Majority of the staff had low levels of educational
attainment with 68.75% having primary and secondary education without
professional training. Over sixty two percent of the forestry staff had annual
incomes of between N111, 000.00 and N150, 000.00. Twenty seven percent
of the farmer respondents were females. Sixty eight percent of them were
aged between 31 and 50 years. Eighty six percent of the farmer respondents
were married with family sizes of 7-12. Thirty eight percent of the farmers
were literate and 55% of them earned between N21, 000.00 and N40, 000.00
per annum.
Comparison of Crop Productivity on Taungya and Non-taungya Plots
The mean yield per hectare of each of the crops for the six sampled
wards are presented in Table 1. The mean yields of yam, cassava, rice, sweet
potatoes, maize, groundnuts, soybeans, guinea corn, beans, pepper and
** Each value represents the mean yields for 5 years
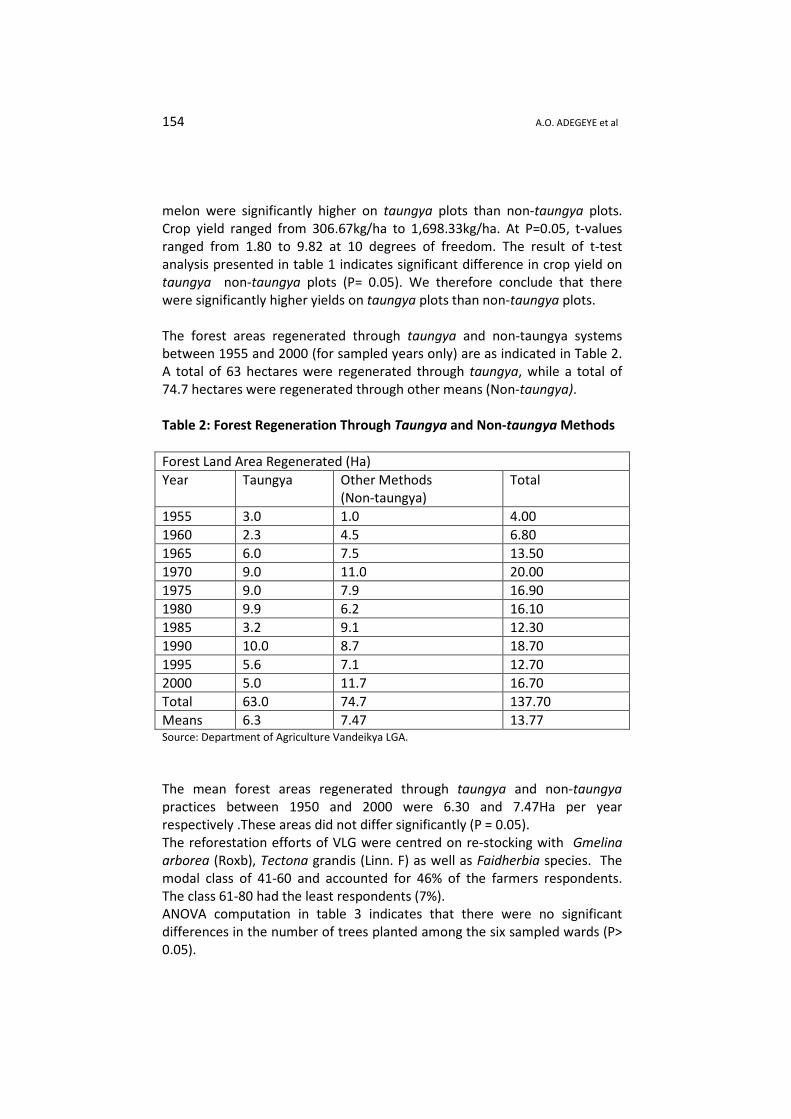
154 A.O. ADEGEYE et al
melon were significantly higher on taungya plots than non-taungya plots.
Crop yield ranged from 306.67kg/ha to 1,698.33kg/ha. At P=0.05, t-values
ranged from 1.80 to 9.82 at 10 degrees of freedom. The result of t-test
analysis presented in table 1 indicates significant difference in crop yield on
taungya non-taungya plots (P= 0.05). We therefore conclude that there
were significantly higher yields on taungya plots than non-taungya plots.
The forest areas regenerated through taungya and non-taungya systems
between 1955 and 2000 (for sampled years only) are as indicated in Table 2.
A total of 63 hectares were regenerated through taungya, while a total of
74.7 hectares were regenerated through other means (Non-taungya).
Table 2: Forest Regeneration Through Taungya and Non-taungya Methods
Forest Land Area Regenerated (Ha)
Year Taungya Other Methods
(Non-taungya)
Total
1955 3.0 1.0 4.00
1960 2.3 4.5 6.80
1965 6.0 7.5 13.50
1970 9.0 11.0 20.00
1975 9.0 7.9 16.90
1980 9.9 6.2 16.10
1985 3.2 9.1 12.30
1990 10.0 8.7 18.70
1995 5.6 7.1 12.70
2000 5.0 11.7 16.70
Total 63.0 74.7 137.70
Means 6.3 7.47 13.77 Source: Department of Agriculture Vandeikya LGA.
The mean forest areas regenerated through taungya and non-taungya
practices between 1950 and 2000 were 6.30 and 7.47Ha per year
respectively .These areas did not differ significantly (P = 0.05).
The reforestation efforts of VLG were centred on re-stocking with Gmelina
arborea (Roxb), Tectona grandis (Linn. F) as well as Faidherbia species. The
modal class of 41-60 and accounted for 46% of the farmers respondents.
The class 61-80 had the least respondents (7%).
ANOVA computation in table 3 indicates that there were no significant
differences in the number of trees planted among the six sampled wards (P>
0.05).
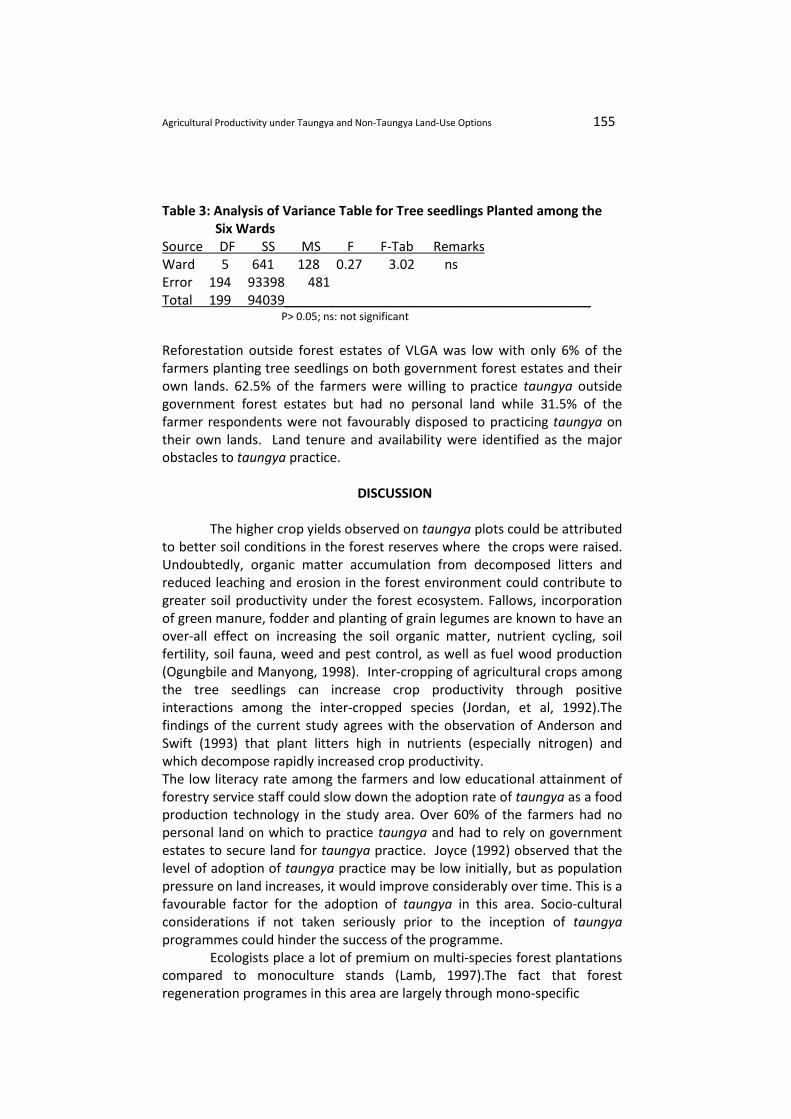
Agricultural Productivity under Taungya and Non-Taungya Land-Use Options 155
Table 3: Analysis of Variance Table for Tree seedlings Planted among the
Six Wards
Source DF SS MS F F-Tab Remarks
Ward 5 641 128 0.27 3.02 ns
Error 194 93398 481
Total 199 94039__________________________________________ P> 0.05; ns: not significant
Reforestation outside forest estates of VLGA was low with only 6% of the
farmers planting tree seedlings on both government forest estates and their
own lands. 62.5% of the farmers were willing to practice taungya outside
government forest estates but had no personal land while 31.5% of the
farmer respondents were not favourably disposed to practicing taungya on
their own lands. Land tenure and availability were identified as the major
obstacles to taungya practice.
DISCUSSION
The higher crop yields observed on taungya plots could be attributed
to better soil conditions in the forest reserves where the crops were raised.
Undoubtedly, organic matter accumulation from decomposed litters and
reduced leaching and erosion in the forest environment could contribute to
greater soil productivity under the forest ecosystem. Fallows, incorporation
of green manure, fodder and planting of grain legumes are known to have an
over-all effect on increasing the soil organic matter, nutrient cycling, soil
fertility, soil fauna, weed and pest control, as well as fuel wood production
(Ogungbile and Manyong, 1998). Inter-cropping of agricultural crops among
the tree seedlings can increase crop productivity through positive
interactions among the inter-cropped species (Jordan, et al, 1992).The
findings of the current study agrees with the observation of Anderson and
Swift (1993) that plant litters high in nutrients (especially nitrogen) and
which decompose rapidly increased crop productivity.
The low literacy rate among the farmers and low educational attainment of
forestry service staff could slow down the adoption rate of taungya as a food
production technology in the study area. Over 60% of the farmers had no
personal land on which to practice taungya and had to rely on government
estates to secure land for taungya practice. Joyce (1992) observed that the
level of adoption of taungya practice may be low initially, but as population
pressure on land increases, it would improve considerably over time. This is a
favourable factor for the adoption of taungya in this area. Socio-cultural
considerations if not taken seriously prior to the inception of taungya
programmes could hinder the success of the programme.
Ecologists place a lot of premium on multi-species forest plantations
compared to monoculture stands (Lamb, 1997).The fact that forest
regeneration programes in this area are largely through mono-specific
156 A.O. ADEGEYE et al
plantations establishment is a major ecological draw-back for the
programme(Taylor, 1999). Seventy six percent of the farmer respondents
recalled existence of exotic monoculture stands on their allocated plots
before such plots were cleared for taungya. The local communities and the
forestry department need to be sensitised on the benefits of multi-species
plantations as well as the benefits and demerits of sustainable taungya
practice.
The manual nature of taungya requires large households that can share
labour for agricultural production for expanded operation. Households
capable of supplying farm labour are most likely to participate more
meaningfully in taungya since there would be division of labour. The low
participation of women in taungya farming could be attributed to the
inability of women to pay for the initial high labour cost for land clearing.
CONCLUSION
An assessment of the productivities of some agricultural crops on
taungya and non-taungya plots indicates that generally, farming on taungya
plots is more productive than farming on non taungya plots. In VLGA, there
are no significant differences in forest areas in respect of reforestation
through taungya and non-taungya methods. An overwhelming majority
(68.5%) of the farmers had no personal land on which to practice taungya
farming. Reforestation efforts were tilted in favour of mono-species
plantations without regard for ecological sustainability and species diversity
expected of sustainable taungya practice.
Taungya farming is desirable in the study area as a means of forest
regeneration and food production. It should be intensified and refined for
better adoption by farmers. Land tenure laws have to be reviewed to give
taungya farmers easy access to land. There is also need to recruit qualified
forestry extension workers to provide necessary technical assistance to
farmers for increased adoption of taungya practice.
REFERENCES
ANDERSON, L.S. and SWIFT, M.J. (1993): Decomposition in the Tropical
Forest. In: Sulton, S.I., Whitmore, T.C. and Chadwick; A.C. (eds.). J.
Tropical Rain Forest: Ecology and Management. P. 287-309. Blackwell,
Oxford, U.K.
F.A.O. (1994). Tropical Soybeans: An Improvement and Production. Plant
Production and Protection and Protection Series; No 27, Rome, 1994.
Jordan, C.F. Gajaseni J., Watanabe H., (1992) Taungya: Forest Plantations with
Agriculture in Southeast Asia (eds) CAB International, Wallingford, Oxon
Ox 10 RDE UK.
JOYCE, A.S. (1992) Diffusion and Adoption. 2nd
IRNR/AFNETA
Agroforestry/Alley Farming for Development Training Course, Kumasi,
Ghana, 10-21 August, 1992.
Agricultural Productivity under Taungya and Non-Taungya Land-Use Options 157
Lamb, D. (1997). Biodiversity Restoration by Plantation. Tropical Forestry
Update ITTO Vol. 7 No 2 pp. 3-4.
Nair, K. (1993). An Introduction to Agroforestry. Kluver Academic Publishers
499p.
Ogungbile A.O. and Manyong, VM (1998). Economics of maintaining and
enhancing natural resources base through the adoption of stabilized
short fallow systems. In Atayi E.A. and Ladipo D.O. (eds). Strategies for
farming systems. development in sub-Saharan Africa. IITA Ibadan.
Okojie, J.A. (1997). Forestry and the Environment. Paper Presented at the
Department of Forestry, University of Ibadan. Symposium, 10th
July,
1997.
Olms, S. (1999). Non-wood Products: Utilization and Incomes Generation in the
Czech Republic, Finland and Lithuania. Unasylva 198/50 pp. 27-33.
Sanchez, P.A. (1997). Soil Productivity and Sustainability in Agroforestry
Systems. In Agroforestry: A Decade of Development. ICRAF, Nairobi
Taylor, D. H. (1999). Requisites of Thriving Rural Non-rural Forest Products
Enterprises. Unasylva 198/50 pp. 3-8.
www.benuestate.gov.ng May2, 2010
Vandenbelt, R.J. (1992). Faidherbia albida in the West African Semi-Arid
Tropics (ed). ICRISAT, Pantancheru, India.

J. Agric. Res. & Dev.9(2). Copy@2010. Faculty of Agriculture, University of Ilorin
Performance and Grazing Pattern of West African Dwarf Sheep to
seasonally Variable Forage Supply and Quality
O. A. FASAE+, I. A. ADEJOLA and O. M. ARIGBEDE *
Department of Animal Production and Health, University of Agriculture,
P.M.B. 2240, Abeokuta, Nigeria.
*Department of Pasture and Range Management, University of Agriculture,
Abeokuta, Nigeria.
ABSTRACT
Sixty (60) West African Dwarf sheep managed semi intensively and grazing on natural pastures
were used in a study to determine the performance and grazing pattern to seasonal forage
supply and quality. The animals were allowed to graze for about 6 hours daily for four months
each in the dry and wet seasons, respectively. Results showed that field grazing time and
active grazing time significantly increased (P<0.05) in the dry season with a corresponding
increase in grazing distance traveled while the non active grazing time decreased (P<0.05) in
the dry season. Season was observed to affect the forage quality and performance of sheep as
the wet season resulted in the production of higher (P<0.05) quality forages compared to the
dry season which led to a rapid increase (P<0.05) in the growth performance of the animals.
The daily gain in weight (g/day) of the animals during the wet season was higher (P<0.05)
relative to the dry season. It was therefore concluded that the performance and grazing
pattern of sheep was influenced by season and forage density. Sheep grazing natural pasture
should therefore be supplemented with high quality concentrate or/and drought resistance
forages for optimum performance during the dry season.
Keywords: Sheep, grazing pattern, performance, forage quality, season
INTRODUCTION
The West African Dwarf sheep is a trypanotolerant and hardy animal with a
compact body predominantly found in the humid south western part of
Nigeria where they are reared mainly under the traditional systems of
management (Adu and Ngere, 1985; Sowande and Sobola, 2008). The sheep
possess adaptability traits which include ability to survive seasonal
fluctuations, drought resistance, tolerance to diseases prevalent in the areas
where they live (Oni, 2002). Profitable sheep production has been found to
be highly dependent upon efficient production and use of forages.
Harvesting of forage crops by sheep themselves, with as little supplemental
feeding as possible, is the most practical and economical means to ensure
the success of sheep operation (Luginbuhl et al., 1998).
The productivity and long term viability of the production of these animals
largely depends on quality of the animals and environmental factors. One of
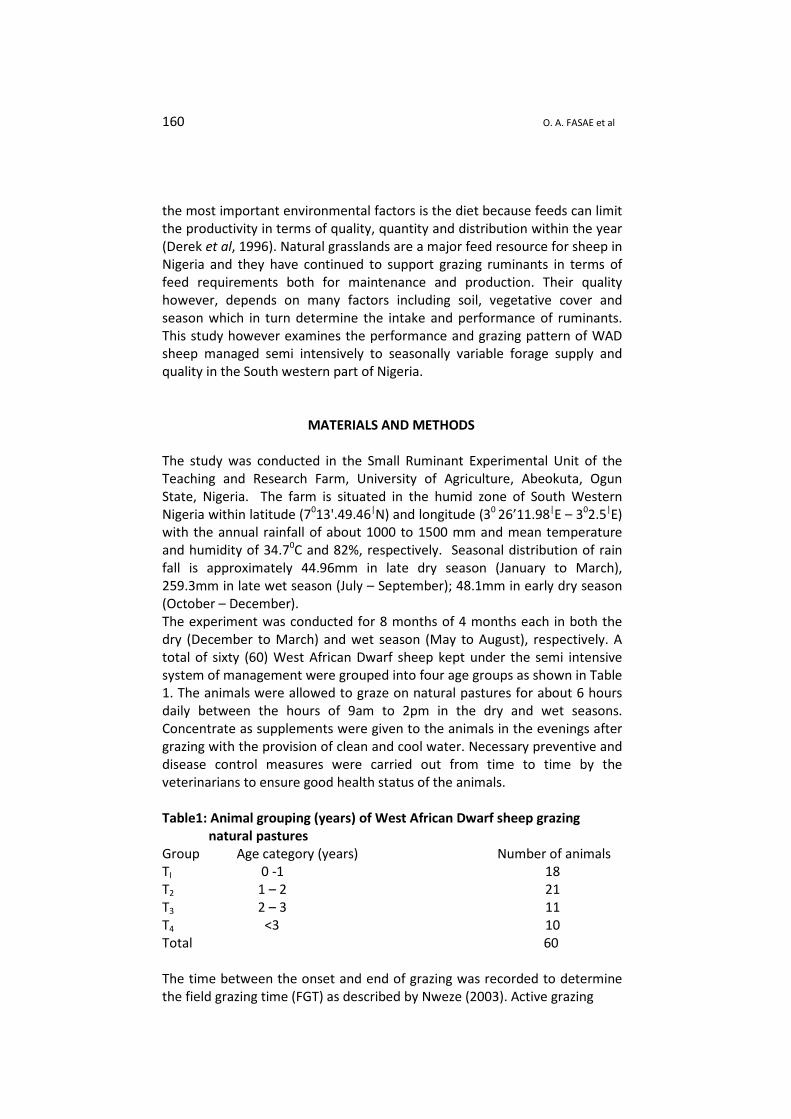
160 O. A. FASAE et al
the most important environmental factors is the diet because feeds can limit
the productivity in terms of quality, quantity and distribution within the year
(Derek et al, 1996). Natural grasslands are a major feed resource for sheep in
Nigeria and they have continued to support grazing ruminants in terms of
feed requirements both for maintenance and production. Their quality
however, depends on many factors including soil, vegetative cover and
season which in turn determine the intake and performance of ruminants.
This study however examines the performance and grazing pattern of WAD
sheep managed semi intensively to seasonally variable forage supply and
quality in the South western part of Nigeria.
MATERIALS AND METHODS
The study was conducted in the Small Ruminant Experimental Unit of the
Teaching and Research Farm, University of Agriculture, Abeokuta, Ogun
State, Nigeria. The farm is situated in the humid zone of South Western
Nigeria within latitude (7013'.49.46|N) and longitude (30 26’11.98|E – 302.5|E)
with the annual rainfall of about 1000 to 1500 mm and mean temperature
and humidity of 34.70C and 82%, respectively. Seasonal distribution of rain
fall is approximately 44.96mm in late dry season (January to March),
259.3mm in late wet season (July – September); 48.1mm in early dry season
(October – December).
The experiment was conducted for 8 months of 4 months each in both the
dry (December to March) and wet season (May to August), respectively. A
total of sixty (60) West African Dwarf sheep kept under the semi intensive
system of management were grouped into four age groups as shown in Table
1. The animals were allowed to graze on natural pastures for about 6 hours
daily between the hours of 9am to 2pm in the dry and wet seasons.
Concentrate as supplements were given to the animals in the evenings after
grazing with the provision of clean and cool water. Necessary preventive and
disease control measures were carried out from time to time by the
veterinarians to ensure good health status of the animals.
Table1: Animal grouping (years) of West African Dwarf sheep grazing
natural pastures
Group Age category (years) Number of animals
TI 0 -1 18
T2 1 – 2 21
T3 2 – 3 11
T4 <3 10
Total 60
The time between the onset and end of grazing was recorded to determine
the field grazing time (FGT) as described by Nweze (2003). Active grazing
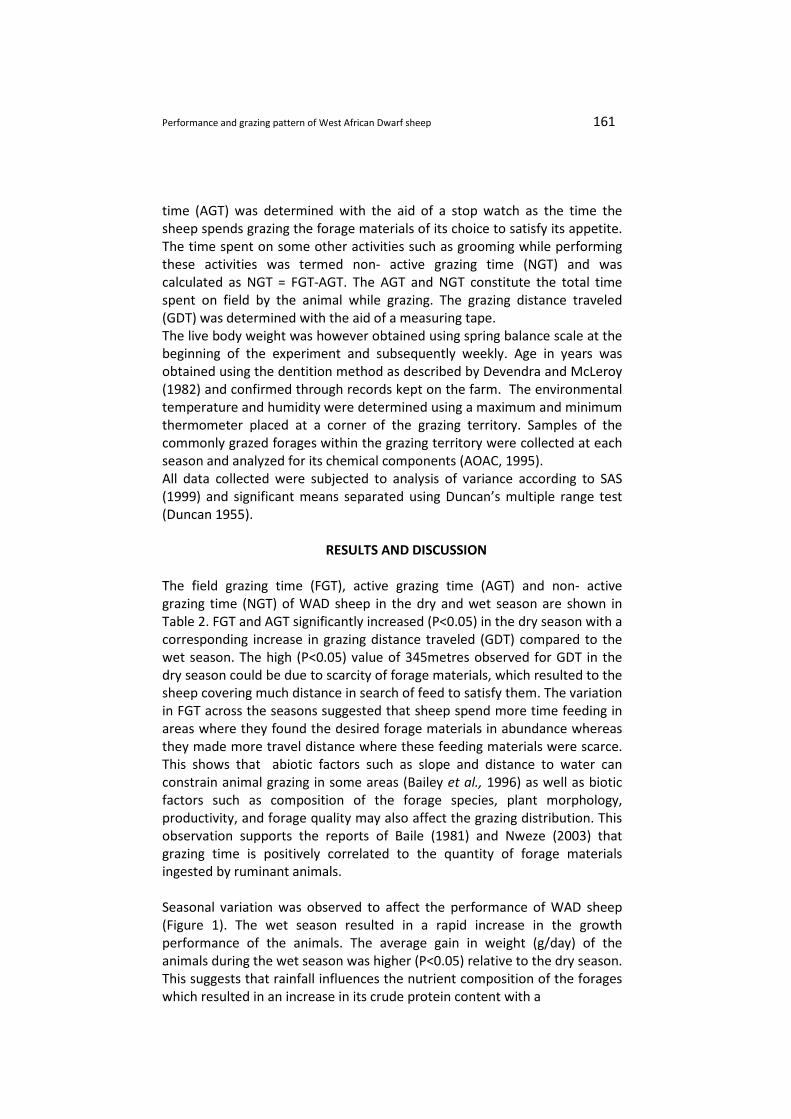
Performance and grazing pattern of West African Dwarf sheep 161
time (AGT) was determined with the aid of a stop watch as the time the
sheep spends grazing the forage materials of its choice to satisfy its appetite.
The time spent on some other activities such as grooming while performing
these activities was termed non- active grazing time (NGT) and was
calculated as NGT = FGT-AGT. The AGT and NGT constitute the total time
spent on field by the animal while grazing. The grazing distance traveled
(GDT) was determined with the aid of a measuring tape.
The live body weight was however obtained using spring balance scale at the
beginning of the experiment and subsequently weekly. Age in years was
obtained using the dentition method as described by Devendra and McLeroy
(1982) and confirmed through records kept on the farm. The environmental
temperature and humidity were determined using a maximum and minimum
thermometer placed at a corner of the grazing territory. Samples of the
commonly grazed forages within the grazing territory were collected at each
season and analyzed for its chemical components (AOAC, 1995).
All data collected were subjected to analysis of variance according to SAS
(1999) and significant means separated using Duncan’s multiple range test
(Duncan 1955).
RESULTS AND DISCUSSION
The field grazing time (FGT), active grazing time (AGT) and non- active
grazing time (NGT) of WAD sheep in the dry and wet season are shown in
Table 2. FGT and AGT significantly increased (P<0.05) in the dry season with a
corresponding increase in grazing distance traveled (GDT) compared to the
wet season. The high (P<0.05) value of 345metres observed for GDT in the
dry season could be due to scarcity of forage materials, which resulted to the
sheep covering much distance in search of feed to satisfy them. The variation
in FGT across the seasons suggested that sheep spend more time feeding in
areas where they found the desired forage materials in abundance whereas
they made more travel distance where these feeding materials were scarce.
This shows that abiotic factors such as slope and distance to water can
constrain animal grazing in some areas (Bailey et al., 1996) as well as biotic
factors such as composition of the forage species, plant morphology,
productivity, and forage quality may also affect the grazing distribution. This
observation supports the reports of Baile (1981) and Nweze (2003) that
grazing time is positively correlated to the quantity of forage materials
ingested by ruminant animals.
Seasonal variation was observed to affect the performance of WAD sheep
(Figure 1). The wet season resulted in a rapid increase in the growth
performance of the animals. The average gain in weight (g/day) of the
animals during the wet season was higher (P<0.05) relative to the dry season.
This suggests that rainfall influences the nutrient composition of the forages
which resulted in an increase in its crude protein content with a
162 O. A. FASAE et al
Table 2: Grazing pattern of West African Dwarf sheep, environmental
temperature and humidity in the dry and wet seasons.
a b values on the same row with identical superscripts are not significantly (P>0.05) different
corresponding increase in the weight of the sheep. This shows that the
emergence of fresh forages in the rainy season could have led to high
nutrient digestibility thereby having great beneficial impact on the sheep
performance (Krysl et al., 1987).
The poor sheep performance during the dry season could also be attributed
to the fact that feeding stuffs for these animals were not sufficiently
available, while those available were low in quality. And in searching for the
desired forage materials, animals undergo stress which could lead to weight
loss. Also, as a result of the presence of drought in the dry season which is
commonly accompanied by a decrease in the nutrient contents of forages
which may lead to reduced forage digestibility, higher level of gastro-
intestinal tract fill and longer residence time of particulate and fluid digesta
phase in the rumen (Demeyer, 1981) thereby eventually having effects on
animal performance. However, the range in gain in weight of 29.22 to
38.02g/day observed in the dry season for the experimental sheep were
lower than those earlier reported for the same breed of sheep subjected to
different feedstuff and management systems (Alli-Balogun et al., 2003;
Taiwo et al., 2005; Oduguwa et al., 2006) while values reported for the gain
in weight in the wet season (41.56 - 45.25g/day) fell within the range
reported by these authors. This however suggested that for better animal
performance, adequate supplementation of forages with high quality
concentrates and/or drought resistance forages is essential for grazing sheep
during the dry season.
Concentrates fed to ruminants has been found to increase the feeding value
of the entire diet by addition of energy over and above that supplied through
low quality pastures ( Ngwa and Tawah, 2002; Fasae et al., 2005). Moreover,
high environmental temperature could also have contributed to the low
animal performance observed in the dry season as high temperature have
been observed to cause late maturity of plants in the dry season which
Season
Parameters Dry season Wet season ± SEM
Field grazing time (mins) 371a 314b 21.11
Active grazing time (mins) 280a 225b 17.34
Non- active grazing time (mins) 91 109 9.77
Grazing distance traveled (m) 345a 292b 19.32
Temperature (0oC) 32.5 29 2.55
Humidity 57 65 3.89
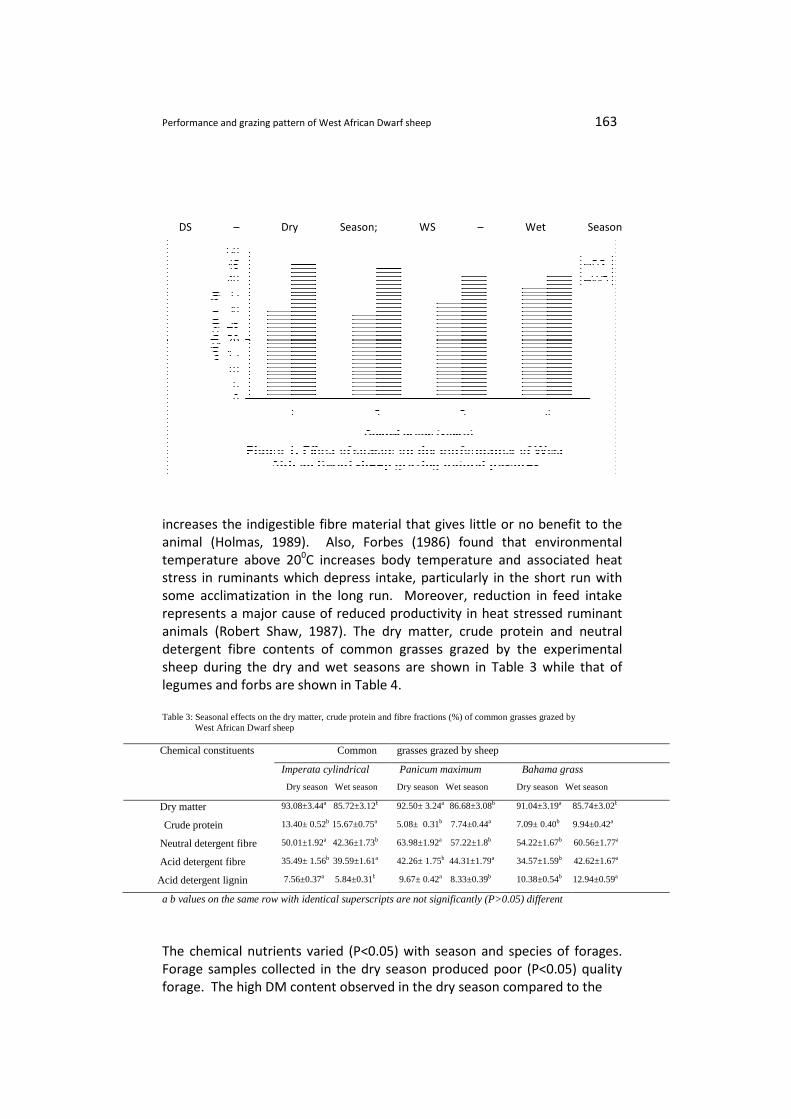
Performance and grazing pattern of West African Dwarf sheep
DS – Dry Season; WS
increases the indigestible fibre material that gives little or no benefit to the
animal (Holmas, 1989). Also, Forbes (1986) found that environmental
temperature above 20
stress in ruminants which depress in
some acclimatization in the long run. Moreover, reduction in feed intake
represents a major cause of reduced productivity in heat stressed ruminant
animals (Robert Shaw, 1987). The dry matter, crude protein and neu
detergent fibre contents of common grasses grazed by the experimental
sheep during the dry and wet seasons are shown in Table 3 while that of
legumes and forbs are shown in Table 4.
Table 3: Seasonal effects on the dry matter, crude protein and fibr West African Dwarf sheep
Chemical constituents
Imperata cylindrical
Dry matter 93.08±3.44
Crude protein 13.40± 0.52
Neutral detergent fibre 50.01±1.92
Acid detergent fibre 35.49± 1.56
Acid detergent lignin 7.56±0.37
a b values on the same row with identical superscripts are not significantly (P>0.05) different
The chemical nutrients varied (P<
Forage samples collected in the dry season produced poor (P<0.05) quality
forage. The high DM content observed in the dry season compared to the
Performance and grazing pattern of West African Dwarf sheep
Dry Season; WS – Wet Season
increases the indigestible fibre material that gives little or no benefit to the
animal (Holmas, 1989). Also, Forbes (1986) found that environmental
temperature above 200C increases body temperature and associated heat
stress in ruminants which depress intake, particularly in the short run with
some acclimatization in the long run. Moreover, reduction in feed intake
represents a major cause of reduced productivity in heat stressed ruminant
animals (Robert Shaw, 1987). The dry matter, crude protein and neu
detergent fibre contents of common grasses grazed by the experimental
sheep during the dry and wet seasons are shown in Table 3 while that of
legumes and forbs are shown in Table 4.
Table 3: Seasonal effects on the dry matter, crude protein and fibre fractions (%) of common grasses grazed by West African Dwarf sheep
Common grasses grazed by sheep
Imperata cylindrical Panicum maximum Bahama grass
Dry season Wet season Dry season Wet season Dry season Wet season
93.08±3.44a 85.72±3.12b 92.50± 3.24a 86.68±3.08b 91.04±3.19a
13.40± 0.52b 15.67±0.75a 5.08± 0.31b 7.74±0.44a 7.09± 0.40b
50.01±1.92a 42.36±1.73b 63.98±1.92a 57.22±1.8b 54.22±1.67b
35.49± 1.56b 39.59±1.61a 42.26± 1.75b 44.31±1.79a 34.57±1.59b
7.56±0.37a 5.84±0.31b 9.67± 0.42a 8.33±0.39b 10.38±0.54b
a b values on the same row with identical superscripts are not significantly (P>0.05) different
The chemical nutrients varied (P<0.05) with season and species of forages.
Forage samples collected in the dry season produced poor (P<0.05) quality
forage. The high DM content observed in the dry season compared to the
163
Wet Season
increases the indigestible fibre material that gives little or no benefit to the
animal (Holmas, 1989). Also, Forbes (1986) found that environmental
C increases body temperature and associated heat
take, particularly in the short run with
some acclimatization in the long run. Moreover, reduction in feed intake
represents a major cause of reduced productivity in heat stressed ruminant
animals (Robert Shaw, 1987). The dry matter, crude protein and neutral
detergent fibre contents of common grasses grazed by the experimental
sheep during the dry and wet seasons are shown in Table 3 while that of
e fractions (%) of common grasses grazed by
Bahama grass
Dry season Wet season
85.74±3.02b
9.94±0.42a
60.56±1.77a
42.62±1.67a
12.94±0.59a
0.05) with season and species of forages.
Forage samples collected in the dry season produced poor (P<0.05) quality
forage. The high DM content observed in the dry season compared to the
164 O. A. FASAE et al
wet season might be as a result of reduced moisture content during this
period.
Table 4: Seasonal effects on the dry matter, crude protein and fibre
fractions of common legumes/forbs grazed by West African dwarf sheep.
a b values on the same row with identical superscripts are not significantly (P>0.05) different
**;Chemical Constituents. DM=DryMatter, CP=Crude Protein, NDF=Neutral
Detergent Fibre, ADF=Acid Detergent Fibre, ADL=Acid Detergent Lignin. Performance and grazing pattern of West African Dwarf sheep
The crude protein content of the forages fell drastically during the dry season
while there was corresponding increase (P<0.05) in the contents of fibre
fractions. This supports the reports of Van Soest (1982) and Fasae et al.
(2009) that protein content of forages increased (P<0.05) in the wet season
with a decrease in the contents of the fibre fractions. This result also
confirmed the work of Valentine (1990) that crude protein content of forages
on a dry matter basis can be as high as 20% in new growth in the rainy
season, but could be as low as 2.5% in cured and weathered grass in the dry
season. This therefore suggests that the poor quality forage in the dry
season could be as a result of high environmental temperature, which may
cause dormancy in plant growth and increased indigestible fibre material.
However, the wet season produced high quality forage as the onset of
rainfall resulted into emergence of fresh and leafy forage with a rapid
increase in the level of the protein content.
CONCLUSION
It was concluded that the performance and grazing pattern of sheep varied
with season and forage density as animals performed best during the wet
season when compared to the dry season. It could therefore be
recommended that sheep grazing natural pastures should always be
supplemented with high quality concentrate or/and drought resistance
forages for optimum performance during the dry season.
legumes/forbs grazed by sheep
Calopgonium mucuniodes Tridax procumbens Chameachrista spp.
Dry season Wet season Dry seasonWet season Dry seasonWet season
DM 89.45±3.162a 85.42± 3.12b 89.50±3.5a86.61±3.32b 91.22±4.0a85.69±3.43b
CP 14.58±0.56b 18.26±0.73a 15.76±2.3b18.65±0.35a 6.11±0.2b 8.24±0.31a
NDF 54.74±1.67a 49.61±1.45b 54.87±1.7a47.89±1.33b 62.23±1.9a60.33±1.91b
ADF 34.37±1.01 36.95±1.03 39.59±1.1b42.26±1.26a 41.94±1.3b43.81±1.35a
ADL 5.37± 0.33 6.76±0.45 5.76±0.41 6.24 ±0.43 10.23±0.5 11.34±0.32
Performance and grazing pattern of West African Dwarf sheep 165
REFERENCES
AOAC (Association of Analytical Chemist). 1995. Official Methods of Analysis, 15th
edition. Washington, D.C., USA. Pp. 69-88.
Adu, I.F. and Ngere, L.O. 1979. Indigenous sheep of Nigeria. World Rev, Proc. XV. Pp.
56-62.
Alli – Balogun, J.K; Lakpini, C.A.M; Alawa J.P.; Mohammed, A. and Nwanta, J.A. 2003.
Evaluation of cassava as a protein supplement for sheep. Nig. J. Anim. Prod. 30
(1): 37- 46
Baile , C. 1981. Nature of hunger and satiety control system in ruminant. J. Dairy Sci.
64:1140-1152.
Bailey, D.W., Gross J.E., Laca, E.A., Rittenhouse L.R., Coughenour M.B., Swift, D.M.,
and Sims, P.L. 1996. Mechanism that involve in large herbivore grazing
distribution patterns. J. Range Manage. 49:386-400.
Devendra, C and Mcleroy, G.B. 1982. Goat and sheep production in the tropics. J.
Anim. Sci. (63): 20 – 21.
Deme yer, D.I. 1981. Rumen microbes and the digestion of plant cell walls. Agric and
Environ. 6:295-337.
Duncan, D. B., 1955. Duncan’s multiple range and Multiple F-Test Biometrics 11: 1-42
Fasae, O.A., Chineke, A.C. and Alokan, J.A. 2005. Relationship between some physical
parameters of grazing Yankasa ewes in the humid zone of Nigeria. Arch.
Zootecnia. 54(208):639-642.
Fasae O.A., Adu I.F; Aina, A.B.J. and Elemo K.A. 2009. Effects of defoliation time of
maize on leaf yield, quality and storage of maize leaves as dry season forage
for ruminant production. Brazillian Journal of Agricultural Science 4 (3): 358-
362.
Forbes, J.M.1986. The voluntary food intake of farm animals, Butterworth, London.
Holmas, W. 1989. Grass – Its production and utilization. 2nd
Edition Pub. British
Grassland Society. Black well scientific publication pp.43.
Luginbuhl, J.M; Green, J.T.; Mueller J.P. and Poore, M.H. 1998. Forage needs for
meat goats and sheep. In: “Production and utilization of Pastures and forages”
– Technical Bulletin 305, North Carolina State University Agricultural Research
Service, North Carolina State University, Raleigh. Pp. 3-7.
Nweze, B.O. 2003. The grazing pattern of Muturu cattle under range system. Nig. J.
Anim. Prod. 30(1):57-61.
Oduguwa, B.O.; Babayemi, J.O.; Jolaosho, A.O., Aina, A.B.J., Ozoje, M.O. and Adu, I.F.
2006. Utilization of malted sorghum sprout, shrimp waste meal and Tephrosia
bracteolate hay by West African Dwarf sheep fed soyabean stover based
diets. Nig. J. Anim. Prod. 33(2): 254-267.
Oni, O.O. 2002. Breeds and Genetic improvement of small ruminants. In: Small
Ruminant Production Training Workshop, National Animal Production
Research Institute, Shika, Zaria. 13th
– 18th
January, 2002. Pp. 1-7.
Robert Shaw, D. 1987. Heat stress, In: Proceedings on Conference on Grazing
Livestock Nutrition, July 23-24, 1987, Jackson Wyoming” University of Wyo,
Laramie. Pp.31-35.
SAS 1999. Statistical Analysis system users’ guide: statistics, version 8 edition.
Statistical Analysis System Institute, Inc. Cary. NC.
Sowande and Sobola, 2008. Body measurements of West African Dwarf sheep as
parameters for estimation of live weight. Trop. Anim. Health Prod. 40:433-
439.
166 O. A. FASAE et al
Taiwo, A.A.; Adebowale, E.A; Adejuyigbe, A.D.; Bankole, M.Y.and Olatunji, S.O. 2005.
Effect of feed block supplementation on weight changes of West African
dwarf sheep and goats on farm in the dry and wet seasons. Proceedings of the
30th
Annual Conference of the Animal Science Association Nigeria held at
University of Ado Ekiti, September 12-15 (Onibi G.E.; Dairo, F.A.S. and
Fajemilehin S.O.K. eds.) Pp.187-190.
Valentine, J.F.1990. Grazing management. Academic Press, Inc. San Diego, California
92101. Published by Academic Press Limited, 24-28, Oral road, London.
Van Soest, P.J. 1982. Environment and forage. In: P.J. Van Soest. Nutritional ecology
of the ruminant. O & B Books, Corvallis, Oregon.