A review of recent response-time analyses in educational ...
21
Psychological Test and Assessment Modeling, Volume 53, 2011 (3), 359-379 A review of recent response-time analyses in educational testing Yi-Hsuan Lee 1 & Haiwen Chen 2 Abstract The use of computer-based assessments in educational testing allows researchers to collect re- sponse times at a large scale for each test taker in standardized operational settings. The availability of these data sources has triggered more research aimed at utilizing response times to aid in current psychometric practice. This paper provides an overview of the type of research accomplished after year 2000. Future research directions are discussed. Key words: Response time; time-limit tests; high-stakes testing; low-stakes testing 1 Correspondence concerning this article should be addressed to: Yi-Hsuan Lee, PhD, Educational Testing Service, Rosedale Rd, Princeton, NJ 08541, USA; email: [email protected] 2 Educational Testing Service
Transcript of A review of recent response-time analyses in educational ...
Psychological Test and Assessment Modeling, Volume 53, 2011 (3), 359-379
A review of recent response-time analyses in educational testing Yi-Hsuan Lee1 & Haiwen Chen2
Abstract The use of computer-based assessments in educational testing allows researchers to collect re-sponse times at a large scale for each test taker in standardized operational settings. The availability of these data sources has triggered more research aimed at utilizing response times to aid in current psychometric practice. This paper provides an overview of the type of research accomplished after year 2000. Future research directions are discussed.
Key words: Response time; time-limit tests; high-stakes testing; low-stakes testing
1 Correspondence concerning this article should be addressed to: Yi-Hsuan Lee, PhD, Educational Testing Service, Rosedale Rd, Princeton, NJ 08541, USA; email: [email protected] 2 Educational Testing Service

Y.-H. Lee & H. Chen 360
The term response time (RT) refers to the time an examinee spends on an item in a test. As Schnipke and Scrams (2002) noted, interest in RTs as a method of revealing informa-tion about mental activity is as old as the field of psychology itself. In educational test-ing, it was rather difficult to record RTs before tests were administered on computers. Therefore, many more developments have been focusing on the accuracy of responses (e.g., classical test theory and item response theory, IRT) rather than other sources of information revealed during tests. The use of computer-based assessments makes possi-ble the collection of RTs in standardized, operational settings. Thus, RT analyses in educational assessments appeared much more frequently in peer-reviewed journals, book chapters, conference proceedings, and doctoral dissertations in the last decade. Schnipke and Scrams (2002) provided a quite complete review of the history of RT analyses. Their review includes research conducted before year 2000, among which a great portion of modeling was designed for simple cognitive tasks, or more generally, speed tests (Gulliksen, 1950). Gulliksen distinguished between examinations that meas-ure only knowledge, called power tests, and those that also measure cognitive processing speed, called speed tests. He defined a pure power test as a test with unlimited time but a fixed number of items of varying difficulty. In such tests, only the responses are utilized in scoring. On the other hand, a pure speed test was defined as a test with an unlimited (or a large but finite) number of items that are easy enough to be answered correctly. Such tests can be scored as (a) the total time used to complete a fixed number of items, or as (b) the number of items completed in a fixed time interval. In fact, the concepts of pure power and pure speed tests exist only as idealizations (van der Linden & Hamble-ton, 1997, p. 166). In reality, most educational assessments are designed to be power tests but for practically all tests, certain time limits are imposed. They are referred to as time-limit tests in this paper. The fact that RT models for time-limit tests should address both power and speed aspects of the tests has important consequences: It is not possible to fully understand the response process in a time-limit test unless both responses and RTs are taken into account (van Breukelen, 2005). As a result, most of the recent studies concentrate on time-limit tests in which RTs and responses are connected in a certain way. Analyses involving RTs are not only driven by an interest in RTs (e.g., modeling RTs in order to estimate person speed or item time-intensity) or in the relationship between speed component and accuracy component, but also driven by concerns about long-term issues in educational testing. One long-term issue is the impact of rapid-guessing behav-ior on the estimation of IRT model parameters. The reason why examinees exhibit rapid-guessing behavior varies across tests. For time-limit tests that have important conse-quences for the examinees (termed high-stakes tests), test speededness3 may be the ex-planation. For tests that have little or no consequences for the examinees (termed low-stakes tests), lack of motivation may be the reason. IRT-based approaches have been suggested to distinguish between examinees who engage in solution behavior and those engaging in rapid-guessing behavior (e.g., Yamamoto & Everson, 1997; Bolt, Cohen, & 3 Test speededness refers to the extent to which time limits affect examinees’ test performance (Schnipke & Scrams, 1997).

A review of recent response-time analyses in educational testing 361
Wollack, 2002). The influence of rapid-guessing behavior on the estimated model pa-rameters can then be detected and reduced. Given the availability of item-level timing and detailed response data from computer-based tests, a better set of detection mecha-nisms for rapid-guessing behavior may be proposed (Hadadi & Luecht, 1998). Analysis of RT has received increasing attention in the general psychometric community. To provide guidance in the form of documentation for educational researchers who are collecting timing data with the intention to further exploit the information, this paper focuses on recent developments on RT that have implications for educational assess-ments. Studies discussed include newly proposed models and concepts for or involving RT, their applications, and issues in educational testing that can be disentangled through use of RTs. Because different concerns often arise in high-stakes testing and low-stakes testing, our review is organized into the two areas accordingly. It should be noted that the categorization is mainly based on the testing scenarios considered in the original papers, and does not imply that the methods grouped in one area are limited to be used in that area only. For instance, models that are proposed to classify examinees as exhibiting solution behavior or rapid-guessing behavior often can be applied in both areas. When a testing program administers a test to calibrate new items (e.g., new item types or formats) for a high-stakes test, there is a certain risk that examinees who participate in the test are not fully motivated. In this circumstance, the techniques developed for low-stakes tests may be worth considering. RT research in psychological testing is not explicitly covered in this paper. This includes models designed for psychology experiments (Rouder, Sun, Speckman, Lu, & Zhou, 2003), reading tests (Jansen, 2003), spatial aptitude (Gaviria, 2005), mental rotation tasks and general cognitive testing (van Breukelen, 2005), personality tests (Ferrando & Lorenzo-Seva, 2007), etc. Note however that many of the approaches discussed here have a range of applications in testing cognitive skills in psychology and education.
1. High-stakes testing
A high-stakes test is any test that has important consequences for test takers. Examples include the Graduate Management Admission Test®, the Graduate Record Examinations® (GRE®), the SAT Reasoning Test™, etc. The following sections will discuss applications of RT modeling to better understand and improve high-stakes testing situations. Section 1.1 illustrates simple approaches to incorporate timing data into operations. Section 1.2 reviews theoretical models for or involving RT. Section 1.3 summarizes applications of the theoretical models and other research that is relevant but does not directly model RTs.
1.1 Simple approaches involving RTs
There are straightforward ways to incorporate RTs into operations. Take a non-adaptive test for example; afterward examination of test speededness can be devised using charted
Y.-H. Lee & H. Chen 362
RTs of each item or descriptive RT statistics such as mean, percentiles, standard devia-tion, etc. In this simple situation with only one fixed item sequence, each item only ap-pears in one position in the test. Therefore, if RTs seem to diminish with later item posi-tions, it implies that at least some examinees may be rushing their responses when look-ing at the later items. This can be viewed as a supplemental analysis of the classic meas-ure of speededness – test completion rate (e.g., Davey & Lee, 2011). It is also possible to use RT to ensure that time limits are generous enough to avoid speededness, in addition to test development experience, to post test feedback indicating that most (if not all) examinees answer all items, or to descriptive RT statistics when available. Scrams and Smith (2010) compared easily implemented algorithms for balancing time demands in the construction of parallel exam forms. They evaluated four simple algo-rithms based on descriptive RT statistics (i.e., mean only, median only, mean plus stan-dard deviation, and median plus standard deviation) and two reference algorithms (i.e., random selection and a distribution-based selection) for pre-equating time requirements across test forms. An operational data set from a large-scale professional licensure exam was manipulated to simulate a typical pre-test scenario: The 200 candidates with the earliest administration dates were treated as a pre-test sample and used to assemble forms according to the various algorithms. The remaining candidates were treated as opera-tional candidates and used to evaluate the performance of the form-construction algo-rithms. A reference form was first created by randomly choosing items from an item pool. Then, for each of the six algorithms, an item that most closely matches the respec-tive reference item according to the relevant algorithm and not included in the reference form was selected. A set of content constraints were also included. Performance of each algorithm was assessed by comparing the cumulative distribution functions of total test time for the operational candidates in terms of root mean squared difference. As ex-pected, the random algorithm performed worst among the six algorithms. However, it was unexpected to find that the more complex distribution-based selection algorithm did not outperform simpler algorithms that focus only on one or two RT statistics. In addi-tion, the simpler algorithms performed equally well. As the authors emphasized, some program-specific characteristics are very likely to impact the results and limit the appli-cability of the algorithms. Also, it is feasible to implement the algorithms with traditional psychometric constraints such as item difficulty, but the performance may heavily de-pend on the specific item pool and requires further investigation.
1.2 Modeling
The statistical models discussed in this section are proposed for time-limit tests mainly for three purposes. First, modeling RTs can inform the speed component of examinees and items; the estimated item time-intensities can later be used in test assembly. Second, some models examine the relationship between items’ or examinees’ speed component and accuracy component (e.g., examinee ability versus speed, and item difficulty versus time-intensity). Lastly, estimation of IRT parameters may be improved, especially when the tests are timed (or even speeded) and/or when the speed component is correlated with

A review of recent response-time analyses in educational testing 363
the accuracy component. Some models involve attempts of model integration where RT models are incorporated in item response models or the other way around. The others model responses and RTs simultaneously but separately.
Integrating RTs in a response model Wang and Hanson (2005) proposed an IRT model that incorporates RTs in the conven-tional three-parameter logistic (3PL) model, called the four-parameter logistic RT (4PLRT) model. RT is treated as a fixed predictor rather than a random variable. The model is designed for time-limit tests. It was claimed that, because time limit may affect examinee performance, RTs should be incorporated in the IRT model. Let ( | )j i ijP tθ be the probability of a correct response for examinee i with ability iθ to item j given the observed RT ijt . The proposed model is a variation of the 3PL model, given by
1
( | ) ,1 exp( 1.7 ( ))
jj i ij j
j i ij j
cP t c
a A bθ
θ−
= ++ − − −
(1)
where /ij i j ijA d tρ= , ja , jb , jc , and jd are the item discrimination, difficulty, guess-
ing and slowness parameters, respectively, and iρ is an examinee slowness parameter. The additional term in the exponent, ijA , determines the rate of increase in ( | )j i ijP tθ , and the asymptote is the probability of a correct answer in the 3PL model. The larger the two slowness parameters are, the slower ( | )j i ijP tθ converges to its asymptote as ijt approaches infinity. A parameter estimation procedure was developed using the EM algorithm, which requires an assumption that RT is independent of person ability and slowness parameters. This assumption is rarely met in educational testing. Instead, it is more common in experimental studies in which RT is controlled by the test administrator or the technology delivering the test, not considering examinee ability or slowness. To avoid this limitation, RT should be considered as a random variable and its distribution has to be specified. This model was examined using simulated data and real data from the ACT math test.
Wang (2006) extended the 4PLRT model by regarding RTs as a random variable and specifying a marginal distribution for RTs. The joint distribution of RTs and responses is defined as the product of the conditional distribution of response given RT and the mar-ginal distribution of RT. Following the notations in (1), the model for responses is a revision of (1) with /ij j ijA d t= . The marginal distribution of RTs follows a one-parameter Weibull distribution, which is a special case of the general three-parameter Weibull distribution with the location parameter set to zero, shape parameter set to 2, and scale parameter set to 2( )i i jbτ θ − . Note that this scale parameter determines the mean and variance of the RT distribution: the larger the 2( )i i jbτ θ − , the smaller the mean and variance. This expression means that the higher the iτ , the less the mean and variance for the RT distribution. In that sense, the examinee parameter iτ can be viewed as a speed parameter. Also, the more the iθ is different from jb , the smaller the mean and variance for the RT distribution, indicating that examinees will generally spend more time on items that match their ability level. This scale parameter is defined to address the test taking strategy suggested by Wang and Zhang (2006) (discussed in Section 1.3) that

Y.-H. Lee & H. Chen 364
“examinees should spend more time on items that match their ability level.” Wang pointed out that the one-parameter Weibull distribution may be an oversimplified model to capture the RTs in reality, and there are a number of ways to parameterize the scale parameter. In any case, this approach can be viewed as an initial step in exploring the appropriate models for RTs.
Incorporating responses in an RT model Lee (2007) presented a model that aims at modeling RTs in time-limit tests. It focuses on tests that are designed to measure skills related to ability rather than speed (i.e., power tests) and intends to measure speed component of examinees and items in an untimed environment. Thus, the RT of interest is the time to a correct response if there were no time limits. This model explicitly addresses the fact that a time-limit test is a power test administered with limited time: In power tests, it is likely that a person does not have sufficient proficiency to solve an item no matter how much time is allowed, which is modeled by a two-parameter logistic (2PL) model. If the person cannot solve the item, the observed RT for this examinee-item combination may not reflect how fast the exami-nee responds or how time consuming the item is – a mixture structure was introduced to differentiate between RTs of examinees with and without sufficient proficiencies. On the other hand, due to time limits, a person with sufficient proficiency may not be able to spend as much time as needed to complete the item solving process; the corresponding RT is said to be censored (i.e., the idea of censoring was brought in from the survival-analysis literature to account for the impact of time limits on RTs; see, e.g., Kalbfleisch & Prentice, 2002). Responses observed in the time-limit test serve as a censoring indica-tor (i.e., correct responses correspond to uncensored RTs, while omitted and incorrect responses correspond to censored RTs). Lee argued that the estimated item time-intensities are less affected by the time limit imposed when collecting the data, so test developers can pick items based on the estimated item time-intensities to maintain some overall testing time as assembling new test forms. A joint maximum-likelihood approach was developed for parameter estimation, and the method was evaluated using simulated data and real data from GRE.
Modeling RTs and responses simultaneously but separately Van der Linden (2007, see also his paper in this special issue) offered a hierarchical framework to model speed and accuracy in power tests with a generous time limit. It is assumed that, unless something unexpected happens, examinees are able to finish the test in time. At the first level, an examinee is assumed to respond at a fixed level of speed and a fixed level of accuracy. Responses are modeled by a three-parameter normal-ogive (3PNO) model and RTs are modeled by a lognormal model with one parameter for ex-aminee speed and two parameters for each item (time-intensity and time discrimination power). The author evaluated several models for RTs and concluded that the lognormal model led to the best fit (van der Linden, 2006). At the second level, a bivariate normal distribution describes the joint distribution of the examinee ability and speed parameters in a population. The correlation structured in this model is the between-person correla-

A review of recent response-time analyses in educational testing 365
tion rather than the within-person correlation (i.e., the within-person correlation reveals the tradeoff between speed and accuracy). Another five-variate normal distribution cap-tures the relationship between the five item parameters – the discrimination, difficulty, and guessing parameters in the 3PNO model and the time-intensity and time discrimina-tion power in the lognormal model. With pre-specified prior distributions for the second-level models, a Bayesian approach with Markov chain Monte Carlo (MCMC) was adopted for parameter estimation. All the parameters at the first level and the correlations at the second level can be estimated as long as responses and RTs are available for each examinee-item combination. The model was applied to a test from the computerized CPA exam. Several applications have been considered based on this hierarchical framework, as discussed in Section 1.3. Klein Entink, Fox, and van der Linden (2009) extended van der Linden’s (2007) hierar-chical framework in the way that potential explanatory variables of examinees, such as background variables and group membership, can be included at an additional level of the hierarchy to explain the variance in speed and accuracy between individuals and group of examinees. Models at the first level and the joint distribution of item parameters at the second level remain the same. In addition to that, regression structures were intro-duced to the joint distribution of examinee parameters: The interest is in the relationship between the person parameters and the effects of explanatory variables. The Bayesian approach with MCMC is used for parameter estimation as well. Use of this model was illustrated by two empirical examples: One data set came from a computerized version of a personality questionnaire taken by Psychology and Social sciences undergraduates from a university in Spain, and the other data set was collected from a computer-based version of the Natural World Assessment Test. To accommodate RTs that violate the lognormal assumption made in van der Linden’s (2007) hierarchical framework, Klein Entink, van der Linden, and Fox (2009) adopted a class of Box-Cox transformations for RT modeling to substitute for the lognormal RT distribution in the framework. The proposed Box-Cox normal model for RTs was shown to be able to approximate data generated from Weibull, gamma and exponential models. Its use also enhanced the description of the shape of the RT distributions in one data set from the Medical College Admission Test (the idea of incorporating a broad class of transformations for RT distributions was motivated by the same data set since the origi-nal lognormal model did not fit the data well). Meyer (2008) presented a mixture Rasch model (MRM; Rost, 1990) with RT compo-nents to account for differences in examinee test-taking behavior, and to control for the influence of different behaviors on parameter estimation. The model combines a finite mixture model for RTs with an MRM for responses. One latent class corresponds to one test-taking behavior. The RT model is characterized by class-specific item RT mean and precision. The MRM is depicted by class-specific examinee ability and item difficulty. It is assumed that RTs and the corresponding responses are independent given latent class membership. In addition, RTs and responses contribute to the estimation of latent class membership and the mixing proportions, but, given latent classes, responses do not con-tribute to the estimation of parameters in the mixture RT model, and RTs do not contrib-ute to the estimation of parameters in the MRM for responses. As an illustrative example,
Y.-H. Lee & H. Chen 366
the model was applied to simulated and real data (from one administration of the Infor-mation Literacy Test) to classify examinees into rapid-guessing behavior and solution behavior. In previous research, classification of the two behaviors has been done through use of mixture model for responses (e.g., Yamamoto & Everson, 1997; Bolt, Cohen, & Wollack, 2002; Wise & DeMars, 2006) or through use of mixture model for RTs (e.g., Luce, 1986; Schnipke & Scrams, 1997), but not two mixture models. Wollack and Woo (2009) investigated item parameter recovery under speeded conditions for end-of-test items. They compared two mixture model approaches: the mixture Rasch model (MRM-R) for speeded responses (Yamamoto & Everson, 1997; Bolt, Cohen, & Wollack, 2002), and the combination of two mixture models for responses and RTs (MRM-RT) proposed by Meyer (2008). The Rasch model was implemented as the base-line of comparison. Their particular interest was in studying the extent to which recovery in the MRM-R could be improved by extending the MRM-R to utilize RTs in addition to responses (i.e., the MRM-RT) in determining class membership. Results of their simula-tion study indicated that the MRM-RT did not offer a significant improvement upon the MRM-R, but both mixture models offered a considerable improvement upon the Rasch model in terms of item parameter recovery for end-of-test items in a speeded test. The authors mentioned that the findings were somewhat surprising, in light of previous re-search detailing the utility of RT data in accounting for test speededness. Possible expla-nations include (a) the MRM-R worked so well even without RT information that there was very little room for improvement, (b) the nature of the data simulation, and (c) the nature of the constraints and prior distributions forced the two mixture models to produce highly similar solutions. Further research is recommended.
1.3 Applications
Different approaches using RTs have been suggested to improve item selection in com-puterized adaptive testing (CAT), to detect differential speededness4, to inform possible cheating behavior between pairs of examinees, and to suggest an appropriate pacing strategy. Conventional statistical methods, such as hierarchical linear modeling and struc-tural equation modeling, can also be employed to model changes in RT patterns.
Item selection RTs can be used to improve the current item selection methods used in CAT. One ex-ample was illustrated in van der Linden (2008). With maximum-information as the crite-rion of item selection, estimation of examinee ability with the expected a posteriori (EAP) can be improved by modeling responses and RTs jointly as suggested in van der Linden (2007) to incorporate collateral information from RTs. Effectiveness of the pro- 4 If some of the subtests have items that require more time to be solved but all test takers are subjected to the same time limit, differences in time pressure under which they have to operate may occur. This phe-nomenon has been named differential speededness of the test (van der Linden, Scrams, & Schnipke, 1999).

A review of recent response-time analyses in educational testing 367
cedure was evaluated through an empirical study using a real item pool of calibrated 3PL item parameters. Item parameters for the RT model were randomly generated. The use of RTs was found profitable in terms of mean squared error (MSE) in the EAP estimator. When the correlation between ability and speed was equal to 0.6, the estimated MSEs for a test of 10 items with the use of RTs were virtually identical to the MSEs for a test of double length without the use of RTs. However, incorporation of RTs did not reduce bias in the EAP estimator.
Speededness Van der Linden, Breithaupt, Chuah, and Zang (2007) presented a method for analyzing multistage tests for differential speededness. The method is an application of the log-normal RT model proposed in van der Linden (2006). A basic assumption is that the examinees operate at a constant speed during the test. One can diagnose a test for differ-ential speededness using these parameter estimates. For example, to check for systematic differences in time intensity between the items in the more difficult and easier subtests, one can plot the distributions of the estimated time-intensity parameters for items in the subtests as a function of the difficulty level of the subtests. The question whether differ-ential speededness has occurred can be answered by a residual analysis of RTs. Conclu-sions can be made more powerful by a simultaneous analysis of the residual responses under the IRT model used to calibrate the items. This model is also built on the assump-tion of stationary examinee ability. Analyses of the residual responses may therefore reveal concomitant changes in ability.
Cheating To detect collusion between pairs of examinees, van der Linden (2009) proposed a bivariate lognormal model for the distribution of the RTs on a test by a pair of exami-nees. As the model has known parameters for the item effects on the RTs, its correlation parameter automatically corrects for the spuriousness in the observed correlation between the RTs of different examinees because of variation in the time intensities of the items. This feature suggests using the model in a routine check of RT patterns for possible collusion between examinees using an estimate of the correlation parameter or a statisti-cal test of hypothesis about it. The author emphasized that results from such procedure needs to be corroborated by evidence from other sources, for example, results from a response-based analysis or observations during the test session.
Pacing Wang and Zhang (2006) theoretically examined the conventional advice on pacing strat-egy, such as “(Test-wise students) use time effectively by beginning to work rapidly. They omitted items that seemed unnecessarily difficult and used their time on items they can get correct”. They dealt with optimal partitioning of limited testing time to achieve maximum expected total score (i.e., the sum of expected item scores) with a focus on the relationship between optimal solution and item difficulty. A probability model was as-sumed for the item score (i.e., probability of answering correctly) as a function of RT.

Y.-H. Lee & H. Chen 368
They first stated and discussed the optimization problem under some generic item re-sponse (time) model, but the analytical solution was not attainable. More properties of the optimal solution were derived assuming the 4PLRT model proposed in Wang and Hanson (2005). Their results suggested that the optimal strategy was to (a) give up the most difficult items, and, for items to be answered, to (b) spend more time on the items of the middle difficulty range than on the easiest and hardest items. The results generally agree with the conventional advice on pacing strategy. Later, Wang (2006) adapted this suggested pacing strategy in his joint modeling of response and RT. Thomas (2006) compared two statistical methods to model changes in RT patterns, or trajectories, on a CAT. One is a two-level hierarchical linear modeling (HLM), and the other is a growth model using structural equation modeling (SEM). He used proficiency levels and pass/fail status as a means of classifying the examinees into three groups (passed, indeterminate, and failed), and fit the models separately for each of the exami-nee groups. The two approaches produced comparable but not identical results. Gener-ally, both methods indicated a possible association between ability and pacing skill. All three examinee groups tended to have decreased RTs, or increased pacing, even without any risk of running out of time. The passed group demonstrated the fastest initial pacing, and their RTs decreased at the slowest rate among the three groups. The indeterminate group seemed to adopt a slower initial pacing than the passed group with a steady decline in the RTs as the test proceeded (note: there was no aggregate evidence suggesting that they had too little time). The failed group demonstrated the slowest initial pacing but appeared to increase in their pacing approximately at the same rate as the indeterminate group. The author concluded that the HLM-based approach has an interpretive advantage over the SEM-based approach since the former can provide direct between-group com-parisons of the estimated model parameters.
2. Low-stakes testing
Examiners who administer low-stakes tests aim at descriptions of what the test takers know and can do. Individuals who are asked to take the tests will experience little or no consequences of their performance on the test. Typically, low-stakes tests can be divided into three categories. The first is the tests used by governments to evaluate the educa-tional achievements in countries participating in the program, in a nation administering a country wide assessment, or in a region. Examples are the Programme for the Interna-tional Assessment of Adult Competencies (PIAAC) for the Organisation for Economic Co-operation and Development (OECD) countries to assess adult competencies, the Programme for International Student Assessment (PISA) for OECD countries to assess 15-year-olds’ performance in reading literacy, mathematics literacy, and science literacy, the National Assessment of Educational Progress (NAEP) for the U.S. government to assess what America’s K-12 students know and can do, and all state assessments in the United States based on the No Child Left Behind policy. The second type is based on tests given by teachers to survey the prerequisite knowledge for a given course and/or to evaluate the effects of educational programs or interventions. The last type is based on
A review of recent response-time analyses in educational testing 369
tests given by testing organizations to try out, select, and calibrate items when establish-ing new testing programs (Wise, Bhola, & Yang, 2006; Abdelfattah, 2007).
2.1 Issue of motivation and its influence on RT analyses
When the test results have little impact on the examinees – many times the examinees will not even get feedback about their own scores – some examinees may not give their best effort. Test takers may either rapidly guess, rushing through the items, or randomly select answers. Results based on these types of responses are shown to be unreliable (Kiplinger & Linn, 1993; Klein & Hamilton, 1999; Parshall, 2002; Sundre & Wise, 2003; Bracey, 2007; DeMars & Wise, 2007). Motivated examinees are found to outper-form their less motivated counterparts by an average of 0.58 standard deviations (De-Mars, 2000; Wise & DeMars, 2005; Wise, Bhola, & Yang, 2006). Wise and DeMars (2005) cited evidence that examinee motivation tends to be unrelated to their true profi-ciency, so the mean score difference between motivated and unmotivated examinees is largely due to differences in test-taking effort rather than differences in what the exami-nees actually know and can do. In low-stakes testing, motivation has been an issue that the researchers are most con-cerned about. Different approaches have been proposed for the goal of improving the quality of test results, including ways to motivate examinees and ways to identify re-sponses from unmotivated examinees (see the end of Section 2.3 for more discussion). The availability of timing data provides another source of information to help identify unmotivated examinees. In Section 2.2, we review a few concepts that are developed to identify examinees who engage in rapid-guessing behavior due to lack of motivation and to measure examinee efforts. Those concepts are utilized in a new IRT model that is proposed with the inten-tion to remove responses associated with rapid-guessing behavior. Section 2.3 summa-rizes the applications of this new model. A variety of ways to monitor and improve examinee effort are discussed in the end. It should be noted that most of the methods and applications reviewed in Section 1 are applicable in low-stakes tests (e.g., Klein Entink, Fox, & van der Linden, 2009; Lee, 2007; Meyer, 2008; Wang, 2006; van der Linden, 2006, 2007), but some level of data cleaning may be needed when the percentage of unmotivated examinees is not negligible.
2.2 Concepts and modeling
Concept 1: Threshold The primary idea underlying the work of Schnipke and Scrams (1997) and Wise and Kong (2005) is the classification of each examinee-item combination as reflecting either solution behavior or rapid-guessing behavior. For a given item j, a threshold Bj is defined
Y.-H. Lee & H. Chen 370
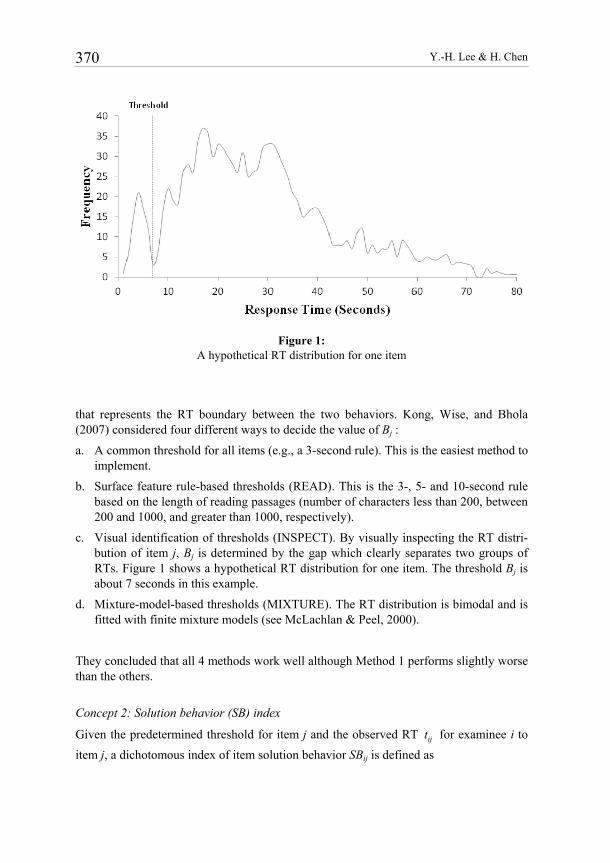
Figure 1:
A hypothetical RT distribution for one item
that represents the RT boundary between the two behaviors. Kong, Wise, and Bhola (2007) considered four different ways to decide the value of Bj : a. A common threshold for all items (e.g., a 3-second rule). This is the easiest method to
implement. b. Surface feature rule-based thresholds (READ). This is the 3-, 5- and 10-second rule
based on the length of reading passages (number of characters less than 200, between 200 and 1000, and greater than 1000, respectively).
c. Visual identification of thresholds (INSPECT). By visually inspecting the RT distri-bution of item j, Bj is determined by the gap which clearly separates two groups of RTs. Figure 1 shows a hypothetical RT distribution for one item. The threshold Bj is about 7 seconds in this example.
d. Mixture-model-based thresholds (MIXTURE). The RT distribution is bimodal and is fitted with finite mixture models (see McLachlan & Peel, 2000).
They concluded that all 4 methods work well although Method 1 performs slightly worse than the others.
Concept 2: Solution behavior (SB) index
Given the predetermined threshold for item j and the observed RT ijt for examinee i to item j, a dichotomous index of item solution behavior SBij is defined as

A review of recent response-time analyses in educational testing 371
1 if
.0 otherwise
ij jij
tSB
≥ Β⎧⎪= ⎨ ⎪⎩
(2)
As might be expected, responses for examinee-item combinations whose SBij = 0 are found to be correct at a rate consistent with random responding (Wise, Kingsbury, Tho-mason, & Kong, 2004; Wise & Kong, 2005; Wise, 2006; Wise, Bhola, & Yang, 2006).
Concept 3: Response time effort (RTE) Wise and Kong (2005) defined a new measure for each examinee, termed response time effort (RTE). Let K be the number of items in the test. Assume that all examinees take all items. The index of overall RTE for examinee i to the test is given by
1 ,K
ijji
SBRTE
K==
∑ (3)
and the RTE index ranges from 0 to 1.
Concept 4: Response time fidelity (RTF) Analogous to the RTE index for individual examinees, a response time fidelity index (RTF; Wise, 2006) is proposed for each item based on the SB index. Let N be the num-ber of examinees, and assume that all examinees take all items. The index of overall RTF for item j to the test is defined by
1 .N
ijij
SBRTF
N== ∑ (4)
Clearly, the RTF index also lies between 0 and 1.
Modeling: The effort-moderated IRT model From his study, Wise (2006) found that 25.5% of the responses under rapid-guessing behavior were correct, as compared with an expected accuracy of 25.1% for random responses. By contrast, 72% of the responses under solution behavior were correct. This finding inspired the work of Wise and DeMars (2006), who developed the effort-moderated IRT (EM-IRT) model by incorporating the SB index defined in (2) to com-bine two behavior models for ( )j iP θ , the probability of a correct response for examinee i to item j:
Solution behavior model if 1
( ) .Rapid-guessing behavior model if 0
ijj i
ij
SBP
SBθ
=⎧⎪= ⎨ =⎪⎩ (5)
The 3PL model is often suggested as the approach to represent solution behavior. A constant probability model that equals to the reciprocal of the number of response op-

Y.-H. Lee & H. Chen 372
tions for item j is often employed to represent rapid-guessing behavior. The EM-IRT model is similar to the extended HYBRID model for test speededness (Yamamoto & Everson, 1997), except that the classification of behaviors is now determined by RTs and treated as known (rather than being estimated as part of the model). Statistically, this model treats all rapidly guessed examinee-item combinations as not reached, which es-sentially is what Plake (2002) suggested. So it is not surprising that the accuracy of both ability estimation and item parameter estimation is substantially improved. This model was further studied by Yang (2007) and Wise, Pastor, and Kong (2009).
2.3 Applications
Monitoring and improving examinee effort One major issue for low-stakes testing is how to promote examinee motivation. Before computer-based exams were available, post-test questionnaires were used to measure examinees’ efforts. The disadvantage of this method is that responses to the question-naires are subjective since the evaluation is done by the examinees themselves. Although people still use questionnaires to measure motivation and spend time and effort to im-prove their efficiency (Sundre, 1999; Sundre & Moore, 2002; Wise & DeMars, 2003; O’Neil, Abedi, Miyoshi, & Mastergeorge, 2005; Wise & DeMars, 2005; Eklof, 2006; Wise, Wise, & Bhola, 2006), more objective evaluation is preferred if available. RT information is one such example, and the SB index and RTE index, defined in (2) and (3), have been considered in several studies (Wise, Kingsbury, Thomason & Kong, 2004; Wheadon & He, 2006; Wise, Wise, & Bhola, 2006; DeMars, 2007; DeMars & Wise, 2007; Verbić & Tomić, 2009). Examiners manage to motivate the examinees to engage into solution behavior. Various methods have been developed and tested for their effectiveness, and the following ones were recommended by Wise and DeMars (2003): a. Raise the stake of the tests (by reporting individual scores or by making final grades
partially from the test results). b. Provide incentives, either with moral praises (e.g., Kong, Wise, Harmes, & Yang,
2006) and/or monetary rewards (e.g., O’Neil, Abedi, Miyoshi, & Mastergeorge, 2005).
c. Choose tests that are not too mentally taxing. Items with extensive readings always reduce motivation.
d. Make the tests more intrinsically motivating. Mentally preparing individuals for low-stakes testing may also gear them toward solution behavior. In Verbić and Tomić’s (2009) study, all test takers were asked to think about all the questions and to give their best answers, and they would receive their scores af-terward (although the results would be used for exploration purposes only). Question-naires were filled out and students could practice answering different question types before the test. To discourage the students from guessing, 0.25 point was awarded for

A review of recent response-time analyses in educational testing 373
each non-answered items. They found that the rapid-guessing rate was only 0.3%, which is very low when compared with the typical rapid-guessing rate of 5-15% for other low-stakes tests. Another strategy is to give the examinees a warning if the rapid-guessing behavior has been detected. Wise, Bhola, and Yang (2006) developed the Effort Monitoring Computer Based Testing (EMCBT), where warnings are issued to anyone who exhibits rapid-guessing behavior. They found that, by comparing with a control group (of examinees who were randomly assigned to the No Warning condition of the EMCBT), the group of examinees under the Warning condition of the EMCBT had higher score averages, lower score variations, and higher RTE values. Test design and administration may affect examinee motivation. DeMars (2000) found that constructed-response items fared worse than multiple-choice items for low-stakes tests. Wise’s (2006) study showed that text length and position of items would influence examinees’ motivation, but graphic inserts (including tables) and item difficulty have almost no impact. More detailed studies about the relationship between rapid-guessing behavior and item characteristics can be found in Wise, Pastor, and Kong (2009). In addition, examinees tend to be more motivated when a test is given at the beginning of a semester than when it is given later in the semester (DeMars, 2007). Effort differences were not observed related to the time of an academic year (i.e., fall, winter, and spring testing terms) or day of week (i.e., Monday through Friday), but there was a clear indica-tion of a time of day effect – rapid-guessing behavior occurred more often as the day progressed (Wise, Kingsbury, Hauser, & Ma, 2010). The reason for this finding is un-clear due to non-randomized assignment to testing times, so some confounding variables might be operating. Hence, more research is likely to help better understand the time of day effect on test effort. Also, there is a body of research regarding the relationship be-tween time of day and student achievement/performance, but conclusions vary across studies: For example, Sjosten-Bell (2005) found higher achievement in the morning than in the afternoon, while Wolkowitz, Templin, and Kingston (2010) observed a pattern (not statistically significant though) of higher performance in the afternoon section and lower performance in the morning section. Note that the participants in these studies are students of different grades (e.g., seventh graders in Wolkowitz et al., 2010; third to ninth graders in Wise et al., 2010; third graders in Sjosten-Bell, 2005); whether the con-flicting results relate to grade of the students is unclear. More investigations will shed some light on how these findings generalize to tests of different content areas and to participants at different (grade) levels.
Improving validity and assessment accuracy Test validity and accuracy are two of the most important goals of test design and imple-mentation. With tools such as the SB index, RTE, EM-IRT model and even the use of questionnaires, researchers have improved the odds to successfully identify examinee-item combinations that are associated with rapid-guessing behavior, and to remove prob-lematic cases accordingly for data analyses and parameter estimation. It has been shown that, with cleaned data, test validity and the accuracy of estimation of the ability and item

Y.-H. Lee & H. Chen 374
parameters can be improved substantially (O’Neil, Abedi, Miyoshi, & Mastergeorge, 2005; Wise & DeMars, 2005; Kong, Wise, Harmes & Yang, 2006; Wise, Bhola, & Yang, 2006; Wise & DeMars, 2006; Wise, Wise, & Bhola, 2006; Wise & Bhola, 2007). Remark. In searching for published papers on using RTs in low-stakes testing, we found that Abdelfattah (2007, Chapter 2) did a quite extensive literature review in his disserta-tion for RT-related issues up to year 2007. His references provide a good collection of papers and many of them are included in this review.
3. Discussion
RT research in educational testing was in its infancy in the 1990s (Schnipke & Scrams, 2002). It is still a growing area and becomes more and more relevant with the ubiquitous availability of technology and its increasing role in education and testing. This paper organizes the research on RTs in testing into high-stakes testing and low-stakes testing. Depending on the testing scenarios considered in the original papers, newly proposed models and concepts for or involving RTs, their applications, and issues in educational testing that can be disentangled through use of RTs are discussed in one of the two areas. Both areas need additional research. For instance, it is unclear how different the classifi-cation of solution behavior and rapid-guessing behavior could be across different mixture models (for responses only, for RTs only, and for both). How the RT models proposed for high-stakes testing perform in the area of low-stakes testing remains undetermined, especially when the percentage of unmotivated examinees is not negligible. Some level of data cleaning may be necessary prior to their applications. For methods that jointly model responses and RTs, ability estimation relies on the relationship between speed and accuracy and RT becomes part of the examinees’ scores. It is important to establish the validity and interpretation of the scores before they are of practical use (Ingrisone & Ingrisone, 2010; Schnipke & Scrams, 2002). In light of new research, there is the potential for testing programs in which RTs are available to add to existing research and improve on current practice. For programs that have access to timing data but have not fully exploited them, it is recommended to begin with exploratory analyses of RTs that may shed some light on how RT information can be utilized in operation and on what additional research is needed. The basic approaches discussed in Section 1.1 are easy to implement and promise to yield information for additional analyses with more sophisticated models. Although it is necessary to evaluate their performance with consideration of program-specific characteristics and needs, these basic methods should be applicable without too much effort. It is anticipated that RTs are useful in providing relevant information about the treatment of omitted responses (espe-cially in low-stakes tests), but appropriateness of the treatment has to be investigated further in different testing scenarios. Establishing response time thresholds for individual items (as discussed in Section 2.2) should be quite beneficial to help remove data from examinee-item combinations that are connected with rapid-guessing behavior. An ex-amination of item-level RT distributions would suggest the suitable time thresholds for the items in question. On the other hand, theoretical RT models can offer detailed item-
A review of recent response-time analyses in educational testing 375
specific and examinee-specific RT characteristics that do not confound with item diffi-culty and examinee ability. Such effort lays the theoretical foundation for applied work and has great potential to enhance the design and functioning of computer-based assess-ments. However, they more or less rely on model assumptions that should be checked empirically before they can be extensively applied. As a result, how they fit in different testing scenarios requires more research to determine.
References
Abdelfattah, F. A. (2007). Response latency effects on classical and item response theory parameters using different scoring procedures. Unpublished doctoral dissertation, Ohio University, Athens, OH.
Bolt, D. M., Cohen, A. S., & Wollack, J. A. (2002). Item parameter estimation under condi-tions of test speededness: Application of a mixture Rasch model with ordinal constraints. Journal of Educational Measurement, 39, 331-348.
Bracey, G. (2007, February 26). The kids are ok, but journalists and U.S. Department of Education Bureaucrats.... Huffington Post. Retrieved September 3, 2009, from http://www.huffingtonpost.com/gerald-bracey/the-kids-are-ok-butjour_b_42178.html.
Davey, T., & Lee, Y.-H. (2011). Potential impact of context effects on the scoring and equat-ing of the multistage GRE® revised General Test (ETS GRE Board Report No. GREB-08-01; ETS Research Report No. RR-11-26). Princeton, NJ: ETS.
DeMars, C. E. (2000). Test stakes and item format interactions. Applied Measurement in Education, 13(1), 55-77.
DeMars, C. E. (2007). Changes in rapid-guessing behavior over a series of assessments. Educational Measurement, 12(1), 23-45.
DeMars, C. E., & Wise, S. L. (2007, April). Can differential rapid-guessing behavior lead to differential item functioning? Paper presented at the Annual meeting of the American Educational Research Association, Chicago, IL.
Eklof, H. (2006). Motivational beliefs in the TIMSS 2003 context: Theory, measurement and relation to test performance. Doctoral dissertation, Umea University: Umea, Sweden.
Ferrando, P. J., & Lorenzo-Seva, U. (2007). An item response theory model for incorporating response time data in binary personality items. Applied Psychological Measurement, 31(6), 525-543.
Gaviria, J.-L. (2005). Increase in precision when estimating parameters in computer assisted testing using response time. Quality & Quantity, 39, 45-69.
Gulliksen, H. (1950). Theory of mental tests. New York: Wiley.
Hadadi, A., & Luecht, R. M. (1998). Some methods for detecting and understanding test speededness on timed multiple-choice tests. Academic Medicine, 73(10), 47-50.
Ingrisone, S. J., & Ingrisone, J. (2010, May). A joint distribution model using item response and response time. Paper presented at the annual meeting of the National Council on Measurement in Education, Denver, CO.
Y.-H. Lee & H. Chen 376
Jansen, M. G. H. (2003). Estimating the parameters of a structural model for the latent traits in Rasch’s model for speed tests. Applied Psychological Measurement, 27(2), 138-151.
Kalbfleisch, J. D., & Prentice, R. L. (2002). The statistical analysis of failure time data, 2nd Edition. New York: Wiley.
Kiplinger, V. L., & Linn, R. L. (1993). Raising stakes of test administration: The impact on student Performance on NAEP (Technical Report). Los Angeles: Center for Research on Evaluation, Standards, and Student Testing.
Klein, S. & Hamilton, L. (1999). Large-scale testing current practices and new directions. Pittsburgh, PA: RAND.
Klein Entink, R. H., Fox, J.-P., & van der Linden, W. J. (2009). A multivariate multilevel approach to the modeling of accuracy and speed of test takers. Psychometrika, 74 (1), 21-48.
Klein Entink, R. H., van der Linden, W. J., & Fox, J.-P. (2009). A Box-Cox normal model for response times. British Journal of Mathematical and Statistical Psychology, 62, 621-640.
Kong, X. J., Wise, S. L., & Bhola, D. S. (2007). Setting the response time threshold parame-ter to differentiate solution behavior from rapid-guessing behavior. Educational and Psy-chological Measurement, 67(4), 606-619.
Kong, X. J., Wise, S. L., Harmes, J. C. & Yang, S. (2006, April). Motivational effects of praise in response-time-based feedback: A follow-up study of the effort-monitoring CBT. Paper presented at the Annual Meeting of the National Council on Measurement in Edu-cation, San Francisco, CA.
Lee, Y.-H. (2007). Contributions to the statistical analysis of item response time in educa-tional testing. Unpublished doctoral dissertation, Columbia University, New York.
Luce, R. D. (1986). Response times: Their role in inferring elementary mental organization. New York: Oxford University Press.
Meyer, J. P. (2008, March). A mixture Rasch model with item response-time components. Paper presented at the annual meeting of the National Council on Measurement in Educa-tion, New York, NY.
McLachlan, G., & Peel, D. (2000). Finite mixture models. New York: Wiley.
O’Neil, H., Abedi, J., Miyoshi, J., & Mastergeorge, A. (2005). Monetary incentives for low-stakes tests. Educational Assessment, 10(3), 185-208.
Parshall, C. (2002). Item development and pretesting in a CBT environment. In C. Mills, M. Potenza, J. Fremer, & W. Ward (Eds.), Computer-based testing: Building the foundation for future assessments (pp. 119-141). Mahwah, NJ: Lawrence Erlbaum Associates.
Plake, B. (2002). Alternatives for scoring CBTs and analyzing examinee behavior. In C. Mills, M. Potenza, J. Fremer, & W. Ward (Eds.), Computer-based testing: Building the foundation for future assessments (pp. 267-274). Mahwah, NJ: Lawrence Erlbaum Asso-ciates.
Rost, J. (1990). Rasch models in latent classes: An integration of two approaches to item analysis. Applied Psychological Measurement, 14, 271-282.

A review of recent response-time analyses in educational testing 377
Rouder, J. N., Sun, D., Speckman, P. L., Lu, J., & Zhou, D. (2003). A hierarchical Bayesian statistical framework for response time distributions. Psychometrika, 68(4), 589-606.
Schnipke, D. L., & Scrams, D. J. (1997). Modeling item response times with a two-state mixture model: A new method of measuring speededness. Journal of Educational Meas-urement, 34, 213-232.
Schnipke, D. L., & Scrams, D. J. (2002). Exploring issues of examinee behavior: Insights gained from response-time analyses. In C.N. Mills, M. Potenza, J.J. Fremer, & W. Ward (Eds.), Computer-based testing: Building the foundation for future assessments (pp. 237-266). Hillsdale, NJ: Lawrence Erlbaum Associates.
Scrams, D. J., & Smith, R. W. (2010, May). A practical approach to balancing time demands across test forms. Paper presented at the annual meeting of the National Council on Measurement in Education, Denver, CO.
Sjosten-Bell, W. (2005). Influence of time-of-day on student performance on mathematical algorithms. Unpublished masters thesis, Dominican University of California, San Rafael, CA.
Sundre, D. L. (1999, April). Does examinee motivation moderate the relationship between test consequences and test performance? Paper presented at the annual meeting of the American Educational Research Association, Montreal. (ERIC Document Reproduction Service No. ED432588).
Sundre, D. L., & Moore, D. L. (2002). The student opinion scale: A measure of examinee motivation. Assessment Update, 14(1), 8-9.
Sundre, D. L., & Wise, S. L. (2003, April). Motivation filtering: An exploration of the impact of low examinee motivation on the psychometric quality of tests. Paper presented at the Annual Meeting of the National Council on Measurement in Education, Chicago, IL.
Thomas, M. H. (2006). Modeling differential pacing trajectories in high stakes computer adaptive testing using hierarchical linear modeling and structural equation modeling. Unpublished doctoral dissertation, The University of North Carolina, Greensboro, NC.
Van Breukelen, G. J. P. (2005). Psychometric modeling of response speed and accuracy with mixed and conditional regression. Psychometrika, 70(2), 359-376.
Van der Linden, W. J. (2006). A lognormal model for response times on test items. Journal of Educational and Behavioral Statistics, 31(2), 181-204.
Van der Linden, W. J. (2007). A hierarchical framework for modeling speed and accuracy on test items. Psychometrika, 72(3), 287-308.
Van der Linden, W. J. (2008). Using response times for item selection in adaptive testing. Journal of Educational and Behavioral Statistics, 33(1), 5-20.
Van der Linden, W. J. (2009). A bivariate lognormal response-time model for the detection of collusion between two test takers. Journal of Educational and Behavioral Statistics, 34(3), 378-394.
Van der Linden, W. J., Breithaupt, K., Chuah, S. C., & Zang, Y. (2007). Detecting differen-tial speededness in multistage testing. Journal of Educational Measurement, 44(2), 117-130.

Y.-H. Lee & H. Chen 378
Van der Linden, W. J., & Hambleton, R. K. (Eds.) (1997). Handbook of modern item re-sponse theory. New York: Springer-Verlag.
Van der Linden, W. J., Scrams, D. J., & Schnipke, D. L. (1999). Using response-time con-straints to control for speededness in computerized adaptive testing. Applied Psychologi-cal Measurement, 23, 195-210.
Verbić, S., & Tomić, B. (2009). Test item response time and the response likelihood. http://arxiv.org/ftp/arxiv/papers/0901/0901.4356.pdf .
Wang, T. (2006). A model for the joint distribution of item response and response time using one-parameter Weibull distribution (CASMA Research Report 20). Iowa City, IA: Center for Advanced Studies in Measurement and Assessment.
Wang, T., & Hanson, B. A. (2005). Development and calibration of an item response model that incorporates response time. Applied Psychological Measurement, 29(5), 323-339.
Wang, T., & Zhang, J. (2006). Optimal partitioning of testing time: theoretical properties and practical implications. Psychometrika, 71(1), 105-120.
Wheadon, C. & He, Q. (2006). An investigation of the response time for math items in a computer adaptive test. Proceedings of the 10th International Computer Assisted Assess-ment Conference, Loughborough University, 455-466.
Wise, S. (2006). An investigation of the differential effort received by items on a low-stakes computer-based test. Applied Measurement in Education, 19(2), 95-114.
Wise, S., Bhola, D. S., & Yang, S. (2006). Taking the time to improve the validity of low-stakes tests: The effort-monitoring CBT. Educational Measurement: Issues and Practice, 25(2), 21-30.
Wise, S., & DeMars, C. (2003, June). Examinee motivation in low-stakes assessment: Prob-lems and potential solutions. Paper presented at the annual meeting of the American As-sociation of Higher Education Assessment Conference, Seattle, WA.
Wise, S., & DeMars, C. (2005). Low examinee effort in low-stakes assessment: Problems and potential solutions. Educational Assessment, 10(1), 1-17.
Wise, S., & DeMars, C. (2006). An application of item response time: The effort-moderated IRT model. Journal of Educational Measurement, 43(1) 19-38.
Wise, S. L., Kingsbury, G. G., Thomason, J., & Kong, X. (2004, April). An investigation of motivation filtering in a statewide achievement-testing program. Paper presented at the annual meeting of the National Council on Measurement in Education, San Diego, CA.
Wise, S. L., Kingsbury, G. G., Hauser, C., & Ma, L. (2010, May). An investigation of the relationship between time of testing and test-taking effort. Paper presented at the annual meeting of the National Council on Measurement in Education, Denver, CO.
Wise, S., & Kong, X. (2005). Response time effort: A new measure of examinee motivation in computer-based tests. Applied Measurement in Education, 18(2), 163-183.
Wise, S., Pastor, D. A., & Kong, X. (2009). Correlates of rapid-guessing behavior in low- stakes testing: Implications for test development and measurement practice. Applied Measurement in Education, 22(2), 185-205.

A review of recent response-time analyses in educational testing 379
Wise, V., Wise, S., & Bhola, D. (2006). The generalizability of motivation filtering in im-proving test score validity. Educational Assessment, 11(1), 65-83.
Wolkowitz, A. A., Templin, J., & Kingston, N. (2010, May). When do seventh grade students perform best on reading and mathematics assessments? Paper presented at the annual meeting of the National Council on Measurement in Education, Denver, CO.
Wollack, J. A., & Woo, V. (2009, April). Using response times to improve parameter estima-tion for speeded test items. Paper presented at the annual meeting of the National Council on Measurement in Education, San Diego, CA.
Yang, X. (2007). Methods of identifying individual guessers from item response data. Educa-tional and Psychological Measurement, 67(5), 745-764.
Yamamoto, K., & Everson, H. (1997). Modeling the effects of test length and test time on parameter estimation using the hybrid model. In J. Rost (Ed.), Applications of latent trait and latent class models in the social sciences (pp. 89-98). Münster, Germany: Waxmann.