A review of Perceived Service Quality - DiVA portal531619/FULLTEXT01.pdf · A review of Perceived...
62
A review of Perceived Service Quality: An empirical investigation of grocery stores’ customers in Växjö, Sweden Authors: George Panteloukas 891202-H550 Albert Mbu Etonga Asopo 770917-9019 Roland Buwag 800207-2570 Tutor: Sarah Philipson Examiner: Rana Mostaghel Subject: Strategic Marketing Level: Bachelor thesis Year of publication: Spring 2012
Transcript of A review of Perceived Service Quality - DiVA portal531619/FULLTEXT01.pdf · A review of Perceived...

A review of Perceived Service Quality: An empirical investigation of grocery stores’ customers in
Växjö, Sweden
Authors: George Panteloukas891202-H550 Albert Mbu Etonga Asopo 770917-9019 Roland Buwag 800207-2570
Tutor: Sarah Philipson
Examiner: Rana Mostaghel
Subject: Strategic Marketing
Level: Bachelor thesis
Year of publication: Spring 2012

Bachelor Thesis 15hp (2FE07E; 2FE10E) School of Business and Economics
Abstract Service quality and customer satisfaction are important concepts to grocery
industry. It is therefore important for companies to know how to measure this
construct of expectations and perceptions because consumers’ expectations of service
quality are increasing and people are becoming more and more critical of the quality
of service they experience. The service quality model SERVQUAL is discussed in
this study and how it can be applied in the context of grocery stores. The data in use
were gathered from consumers in a southern Swedish town, called Växjö and the goal
was to measure their expectations and perceptions of the services provided to them.
After going through a significant number of articles and literature, the SERVQUAL
model was altered by adding more variables (products, location, and waiting time) to
its five dimensions. The aim was to find out if consumers are satisfied with the
services been provided to them by grocery stores.
Purpose – The purpose of the paper was to identify the dimensions influencing
consumers’ perceived service quality in the grocery retailing.
Method/approach – Using a sample of 200 respondents, a self-completion
questionnaire was given out to consumers in Växjö, to determine their expectations
and perceptions of service quality in grocery stores.
Findings – The results show that expectations exceeded perceptions, denoting gaps in
service quality, which means that grocery stores do not provide the level of service
demanded by customers. This entails that customer satisfaction is rather low and that
there is still room for grocery stores to improve on their performance.
Managerial implications – The findings show that the SERVQUAL model can be a
very useful instrument in measuring service quality in grocery stores. The additional
variables proposed show a strong correlation to customer satisfaction, with products
and waiting time being of high importance to overall service quality. Managers can
use this tool to understand how customers assess service quality in grocery stores and
in turn enhance their service experience.
Originality/value – We introduce three new variables in the SERVQUAL model
which, we believe, complete the assessment of service quality in the context of
grocery stores.
Key words – Service quality, customer satisfaction, SERVQUAL and grocery stores
2
Bachelor Thesis 15hp (2FE07E; 2FE10E) School of Business and Economics
Acknowledgements We like to sincerely thank our supervisor, Dr Sarah Philipson for the kind gesture and
support she has gave us to produce this work. It was particularly interesting to our
independence in judging and handling knowledge in different scientific articles and
readings. Three seminars were held to check the progress of the work and to guide us
in getting things right and improve on the quality of the research. In the seminars,
there were lots of interesting discussions and feedback from all the participants. We
want also to thank our examiner Dr Rana Mostaghel for guiding us through these
seminars, as well as Dr Magnus Hultman for his contribution to our paper with his
lectures. Last but not least, we want to give special thanks to all our respondents for
giving answers to our questionnaires. We really appreciate their support in all this
effort.
3

Bachelor Thesis 15hp (2FE07E; 2FE10E) School of Business and Economics
Table of contents Abstract…………………………………………………………………...2
Acknowledgements……………………………………………………....3
List of figures…………………………………………………………….6
List of tables……………………………………………………………...6
1 Introduction…………………………………………………………...7
1.1 Background……………………………………………………….7
1.2 Problem discussion……………………………………………….9
1.3 Purpose…………………………………………………………..11
1.4 Delimitations…………………………………………………….11
1.5 Disposition………………………………………………………12
2 Literature review…………………………………………………….13
2.1 Service quality………….………………………………………..13
2.2 Expectations vs perceptions……………………………………..14
2.3 Customer satisfaction……………………………………………15
2.4 Service quality and customer satisfaction……………………….16
2.5 Service quality models…………………………………………..17
2.5.1 The SERVQUAL model…………………………………….19
2.5.2 Criticism of SERVQUAL model……………………………20
2.6 State of the art…………………………………………………...21
2.6.1 Adapted SERVQUAL model………………………………..22
2.7 Research question and hypotheses………………………………23
3 Methodology………………………………………………………...24
3.1 Research approach………………………………………………24
3.2 Research design…………………………………………………25
3.3 Data sources……………………………………………………..26
3.4 Research strategy………………………………………………..26
3.5 Data collection method………………………………………….27
4

Bachelor Thesis 15hp (2FE07E; 2FE10E) School of Business and Economics
3.6 Data collection instrument………………………………………28
3.6.1 Operationalization and measurement of variables…………..28
3.6.2 Questionnaire design………………………………………...32
3.6.3 Pretesting…………………………………………………….34
3.7 Sampling…………………………………………………………34
3.8 Data analysis method…………………………………………….35
3.9 Quality criteria…………………………………………………...37
3.9.1 Validity………………………………………………………37
3.9.2 Reliability……………………………………………………37
4 Empirical results and analysis……………………………………….39
4.1 Demographics……………………………………………………39
4.2 Reliability testing………………………………………………...40
4.3 Expectation, perception and gap scores………………………….41
4.4 Regression……………………………………………………….44
4.5 Analysis………………………………………………………….47
5 Conclusions……………………………………………………….....50
5.1 Discussion……………………………………………………….50
5.2 Implications……………………………………………………...51
5.3 Limitations……………………………………………………….51
5.4 Suggestions for future research………………………………….52
6 Reference list………………………………………………………...53
Appendix………………………………………………………………..60
5
Bachelor Thesis 15hp (2FE07E; 2FE10E) School of Business and Economics
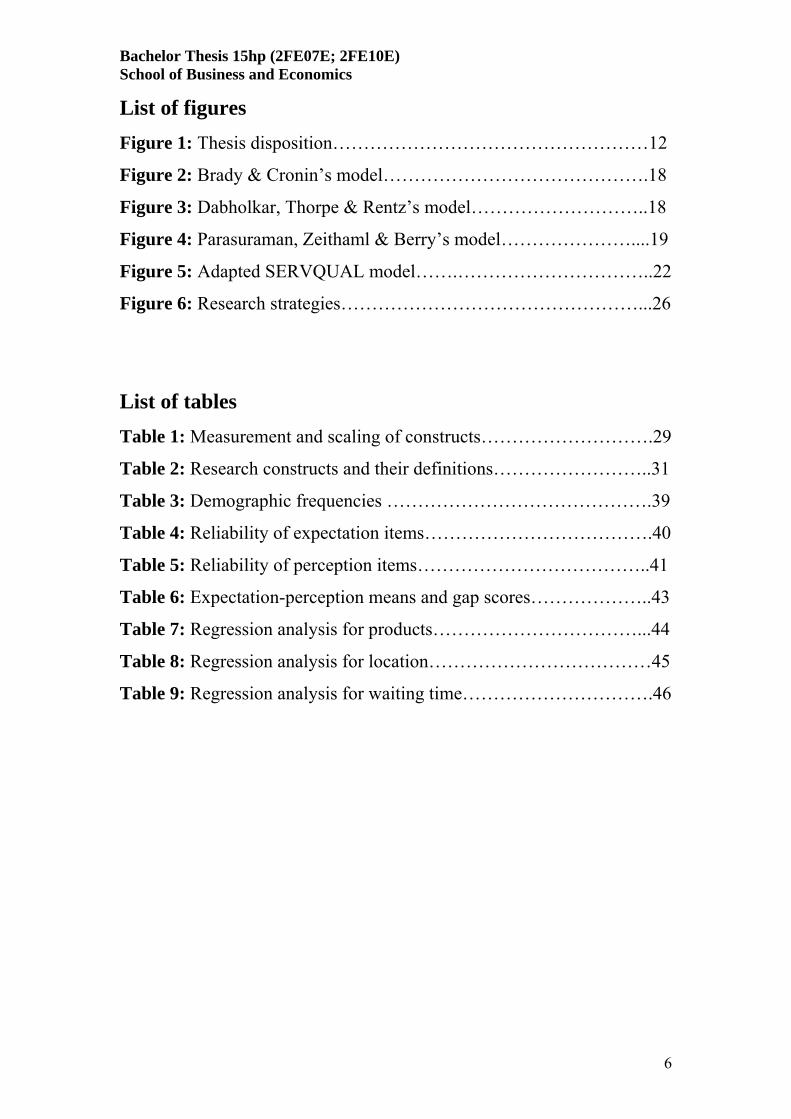
List of figures Figure 1: Thesis disposition……………………………………………12
Figure 2: Brady & Cronin’s model…………………………………….18
Figure 3: Dabholkar, Thorpe & Rentz’s model………………………..18
Figure 4: Parasuraman, Zeithaml & Berry’s model…………………....19
Figure 5: Adapted SERVQUAL model…….…………………………..22
Figure 6: Research strategies…………………………………………...26
List of tables Table 1: Measurement and scaling of constructs……………………….29
Table 2: Research constructs and their definitions……………………..31
Table 3: Demographic frequencies …………………………………….39
Table 4: Reliability of expectation items……………………………….40
Table 5: Reliability of perception items………………………………..41
Table 6: Expectation-perception means and gap scores………………..43
Table 7: Regression analysis for products……………………………...44
Table 8: Regression analysis for location………………………………45
Table 9: Regression analysis for waiting time………………………….46
6

Bachelor Thesis 15hp (2FE07E; 2FE10E) School of Business and Economics
1. Introduction In this chapter, we introduce the reason for choosing the area of study. We
present some information about service quality in the background, our choice of
study, next we proceed to our problem discussion and a purpose for this study
follows. The delimitations are also stated, as well as the continued disposition of
the study, which ends the first chapter.
1.1 Background Service quality has gained significant importance in the last two decades, due to the
unique characteristics of services involving intangibility (services can not be seen,
tasted, heard, smelt or felt), inseparability (services can not be separated from their
providers), variability (the quality of services varies due to who provides them, where,
when and how they are provided) and perishability (services can not be held/stored
and they must be consumed when offered). These characteristics make the process of
service purchase and delivery very complex for both customer and seller and for most
types of services. Indeed, there is no consensus in the measurement and definition of
service quality and this is why the concept has much attention in the marketing
literature (Wisniewski, 2001; Schneider & White, 2004).
As stated by Howcroft (1991), service quality entails constant anticipation of what
customers expect from the service provider. Service quality has been emphasised in
many dimensional advantages leading to customer’s satisfaction (Raddon, 1987;
Buzzell & Gale, 1987). Parasuraman, Zeithaml & Berry (1988) emphasize that there
is credibility in the sales force if the quality of service provided is high. They further
observed that, in the context of grocery stores, the longer such a store keeps
improving on its service performance, the more it meets the expectations of
customers. If customers perceive quality as unsatisfactory, they may divert their
attention elsewhere. Thus, as stated by Balachandran, Voelker & Bahl (2003),
providing high service quality, means achieving success in competing services. More
importantly, in the case of grocery stores which offer identical services,
differentiation through services is of high competitive advantage (Ibid.).
7

Bachelor Thesis 15hp (2FE07E; 2FE10E) School of Business and Economics
For a long time, there has been low competition and low customer satisfaction in the
Swedish grocery retail sector (Andersson, Fornell & Rust, 1997; Elg & Johansson,
1992). However, there have been significant changes in the last twenty years, due to
the high demand for service quality improvement by customers. Presently, there is an
increased market share consisting of discount stores, foreign store chains and also a
growing number of clear-cut supermarket concepts and convenience stores
(Anselmsson, 2006). However, consumers need something more than convenient
store solutions and enhanced products. Differentiation through service has
traditionally been a forceful competitive tool (e.g. Parasuraman et al., 1988; Mazursky
& Jacoby, 1986) and according to numerous marketing researchers the offering of
high service quality is often said to be of fundamental importance in retailing (Berry,
1986; Reichheld & Sasser, 1990; Dabholkar, Sheperd & Thorpe, 2000; McGoldrick,
2002). Since grocery stores provide consumers with basic commodities, there is need
for retailers to focus in delivering superior service quality so they can achieve high
levels of customer satisfaction (Anselmsson, 2006). To, therefore, maintain a high
quality image, it is important to measure service quality and find out the expectations
and perceptions of consumers in order to know which dimensions of service need
improvement (Ibid.). The interest of this study was directed towards finding these
dimensions that influence grocery retailing services.
Moreover, as a consequence of the increasing competition and major changes in
retailing, it is important to understand what service signifies from a customer
perspective and what impact service has as a means of competition in the retailing
sector. There has been much research on service quality and which attributes of
service quality are needed to meet the expectations of customers (Anselmsson, 2006).
In recent times there has been much research on how to establish an operational scale
and measurement for the evaluation and monitoring of service quality. The most well-
renowned is the SERVQUAL-scale, an instrument for measuring customer
perceptions of service quality (Parasuraman et al., 1988). However, as McGoldrick
(2002) states, a limitation of the SERVQUAL in the retailing context is that its scale
has been developed and tested mainly in pure service settings, not for profit settings.
He argues that the model has not been developed in retail business settings. Scales
have not been specifically developed to capture the essence of service quality in
8

Bachelor Thesis 15hp (2FE07E; 2FE10E) School of Business and Economics
grocery retailing and as a result, more research is needed (Mehta, Lalwani, & Han,
2000).
1.2 Problem discussion As stated by Lovelock & Wirtz (2007), customers have become more and more aware
of their requirements and they demand higher standards of services. Customers’
perception and expectations are continuously evolving, making it difficult for the
service provider to measure and manage services effectively. It is therefore important
for the service provider to pay attention to the most critical service
attributes/dimensions as a part of customer service management (Sachdev & Verman,
2004). It is also important to understand how sensitive customers respond to the
different service attributes or dimensions. Service providers should allocate their
resources in a way consistent with customer priorities, enhancing the effectiveness of
service operations.
In such context, customer satisfaction is one of the most prominent objectives for
service providers. Rust & Oliver (1994) define satisfaction as the “customer fulfilment
response”. Satisfaction is an evaluation as well as an emotion-based response to a
service (Ibid.). According to Geetika & Ashwini (2008), to Sachdev & Verma (2004),
to Ekinci (2003) and Czepiel (1990), customer satisfaction has been commonly
accepted as a major indicator of service quality. Grönroos (1984), states that,
satisfaction from service quality is usually evaluated in terms of technical and
functional quality. Donabedian (1980), however, gives emphasis on the fact that
customers do not get much about the technical aspects of a service and so functional
quality forms their perceptions of service quality.
Perceived service quality has been proven to be a difficult concept to measure. Some
researchers in this area, such as Parasuraman et al. (1985), referred to the concept as
“elusive” and considered as still unsolved, meaning it is “far from conclusive”. Other
researchers, such as Czepiel (1990), defined service quality as the customer
perception of how well a service meets or exceeds the expectations of customers.
Sachdev & Verma (2004) claim it can be measured in terms of customer expectation,
customer perception, customer satisfaction and customer attitude. However, the
9

Bachelor Thesis 15hp (2FE07E; 2FE10E) School of Business and Economics
conceptualization and measurement of service quality is a debated and controversial
issue in the service marketing literature. There is still need to examine the
dimensionality of the service quality concept (Parasuraman et al., 1985).
There are several service quality models helping researchers and practitioners to
identify and improve the efficiency and profitability of the overall performance of
services. Indeed, there are two major conceptualizations of the service quality concept
mentioned in the literature. One perspective is the Nordic school by Grönroos (1984)
who defines the dimension of service quality in a global term as consisting of a
functional dimension and a technical dimension of perceived service quality. The
second perspective is the American school by Parasuraman et al. (1988), who use
terms that describe service encounter characteristics, such as tangibles, reliability,
responsiveness, assurance and empathy (explained in chapter 2.5.1) to formulate a
service quality framework, the SERVQUAL. In a different model, Brady & Cronin
(2001) attempt a hierarchical approach of service quality, which describes three
primary dimensions as the basic determinants of service quality, namely interaction,
physical environment and outcome, dividing each in three more sub-dimensions (in
total nine). Other scholars have considered different dimensions of service quality,
such as Lehtinen & Lehtinen (1982) who consider interactive, physical and corporate
quality or Hedvall & Paltschik (1989) who focus on willingness/ability to serve and
the physical/psychological access to the service.
Though the American school of thought dominates the literature of perceived service
quality, a consensus has not been reached as to which approach is appropriate and no
attempt has been made to consider how the different conceptualizations are related
(Brady & Cronin, 2001). It is thus evident that perception of service quality is
generally based on many dimensions, however there is no general agreement on the
nature of these dimensions.
Another model that is mentioned in the literature of service quality is the one of
service quality gap. Compared to the traditional models, this one involves five
additional components and eight additional gaps (Shahin & Abolhasani, 2008). This
model deals with if a service meets or exceeds customer needs and expectations. A
service quality gap can be defined as the difference between customer expectations
10

Bachelor Thesis 15hp (2FE07E; 2FE10E) School of Business and Economics
and perceptions of service quality. Hence, if expectations are higher than what is
delivered, the perceived quality is less than satisfactory and the customer gets
disappointed with the service, which implies that the customer will switch to a
competitor (Parasuraman et al., 1985; Lewis & Mitchell, 1990).
It is therefore important to understand the role of expectations because consumers’
expectations of service quality are increasing and people are becoming more and more
critical of the quality of the service they experience (Philip & Hazlett, 1997). Ekinci
(2003) indicates that customer satisfaction comes from the evaluation of service
quality. However, service quality evaluation is a highly complex process that may
operate on several levels of abstraction (Carman, 1990). The literature shows that
there is no consensus on the determinants of service quality and that there is no
unified theory or conceptualization which reflects the complexity and the nature of the
concept (Brady & Cronin, 2001).
1.3 Purpose To identify the dimensions influencing consumers’ perceived service quality in the
grocery retailing.
1.4 Delimitations This study is limited to grocery stores in Växjö, Sweden. It is assumed that the
services offered to the customers by these grocery stores are almost the same, based
on the product and services they offer. The aim of this study is not to look on a single
case or make comparisons between grocery stores. Instead, it seeks an average
opinion for all the grocery stores visited by consumers in Växjö.
11

Bachelor Thesis 15hp (2FE07E; 2FE10E) School of Business and Economics
1.5 Disposition Chapter 1 introduces the background and reasons for choosing the area of research.
Chapter 2 presents our theoretical framework that constitutes the foundation for this
study and the solution to our problem discussion. Conceptual models are also
presented in this chapter. Then, chapter 3 describes the chosen methodology, our way
of approaching this research. The empirical data collected from the subjects of this
study are publicized in chapter 4. An analysis of the empirical findings and a
comparison with the theoretical framework is made in the same chapter. Conclusions
can be found in chapter 5, drawn from the discussion in the previous chapters and also
our research question is answered in this chapter. Finally, managerial implications are
presented as well as limitations and directions for future research.
Figure 1: Thesis disposition
12

Bachelor Thesis 15hp (2FE07E; 2FE10E) School of Business and Economics
2. Literature review In this chapter, we review literature relevant to our topic. We discuss issues of
service quality, expectations and perceptions, customer satisfaction, relationship
between service quality and customer satisfaction, service quality models and
define relevant concepts to enhance our understanding of the chosen topic and
provide answers to our research question.
2.1 Service quality Authors and researchers have given different definitions of service quality over time.
Zeithaml & Bitner (2003) and Bitner & Hubert (1993) defined service quality as a
comparison of what the customers feel a service provider should offer (expectations).
Oliver (1993) and Bitner (1995) state that service quality perceived by customers, is
the difference between customers’ perceptions and expectations of service quality. In
marketing literature, Parasuraman et al. (1985) have defined service quality as the
extent to which a service meets or exceeds customer expectations. Parasuraman et al.
(1988), however, suggest that customers perceive service quality in different ways.
The first level is expected/desired service, which is the level of service the customer
hopes to receive by the service provider. The second level is adequate service, which
is the level of service the customer will accept (Ibid.). Therefore, it is important for
management to understand the basic concept of this construct because customers are
very sensitive especially if what they get, doesn’t meet their expectations (Ibid.).
Presbury, Fitzgerald & Chapman (2005) emphasize that it is vey important to provide
service quality that meets the expectations of customers. Antony, Antony & Ghosh
(2004) refer to service quality as the concept of meeting and exceeding the
expectations of customers and if these expectations are not exceeded, then service can
be seen as ordinary or inferior. It is thus important for service providers to offer good
quality service to customers so that the conception of quality can be influenced not
only by the service outcome but also by the service process (Ibid.).
Indeed, service quality has turned out to be the leading element in the grocery
retailing these days. Ghobadian, Speller & Jones (1994) state that the interest in
service quality has increased noticeably because it is one of the requirements needed
13

Bachelor Thesis 15hp (2FE07E; 2FE10E) School of Business and Economics
to survive in the contemporary, competitive business environment. The nature of the
service is such that the customer is present in the process. He further states that
service quality, in business context, is the measure to which the service delivered
meets customer expectations. So, service quality is achieved through meeting
expectations (Ibid).
2.2 Expectations vs perceptions It is important for marketers to understand the needs of their customers and provide
goods and services that meet their needs better than their competitors. Therefore, it is
important to understand the expectations of the customer because customers make
their purchases by thinking critically of their requirements. As Parasuraman et al.
(1988) state, expectations are predictions by customers about what is going to happen
during a particular transaction, what the customer thinks the transaction is going to
look like.
There has been frequent research on service quality, to an extent on which attributes
are necessary to satisfy customer expectations, because of the slow growth rate in the
grocery retail sector; the pursuit of market share is the objective of managers in these
sectors (Uusitalo, 2001). According to Parasuraman et al. (1988) and Mazursky &
Jacoby (1986), it is important for retail shops to offer and supply high service quality.
Therefore, expectations may concern a particular category of retail shop that will
guide the consumers’ perception, leading to an overall evaluation of a store, as well as
making a choice (Parasuraman et al., 1988; Mazursky & Jacoby, 1986).
As stated by Birtwistle, Clarke & Freathy (1999), it is important to improve the
understanding of customers’ perceptions because managers have different views on
their retail image from what customers have. Another author, Wilkie (1994), states
that consumers’ perceptions comprise of three stages which are: sensing, selecting and
interpreting. Therefore, interpreting in this sense means how consumers give meaning
to a perceived object, for example a store. As stated by Sujan (1985), consumers
categorize a structure in their minds about how a retail store should look like. Their
expectations concerning what a grocery store should possess and what performance
14

Bachelor Thesis 15hp (2FE07E; 2FE10E) School of Business and Economics
level can be expected from these stores is of great importance to the success of
grocery stores (Ibid.).
Grönroos (1984) and Parasuraman et al. (1985) state that consumers’ perception of
service quality is based on the differences between expectations and perceptions of
service quality. According to Parasuraman et al. (1988), expectations are what the
customer thinks that he/she should have from a service provider and that is the type of
service that the store should offer; perceptions are what a service provider really
offers. The implication is that when these providers do not meet the expected service,
this leads to customer dissatisfaction. On the other hand, when customer’s
expectations are met, this will lead to customer retention as well as customer loyalty
(Ibid.).
2.3 Customer satisfaction Customer satisfaction has been the subject of much debate in the field of marketing
literature. According to Cronin & Taylor (1992), the meaning of customer satisfaction
is based on the customer’s experience in a particular service encounter. Some authors,
like Jones & Suh (2000), consider customer satisfaction as an accumulative concept
based on the overall evaluation of a service experience. Na, Marshall & Keller (1999)
view satisfaction as a consequence of strong associations or images. Satisfied
customers experience “a pleasurable level of consumption-related fulfilment” (Hunt,
1977, p. 459-460). Fornell (1992, p. 11) defines customer satisfaction as “an overall
post-purchase evaluation”, while Day (1984, p. 496) defines customer satisfaction as
“the consumer’s response to the evaluation of the perceived discrepancy between
prior expectations and the actual performance of the product as perceived after its
acquisition”. However, the definitions mentioned above consider satisfaction as a
post-purchase response, because customers evaluate service quality after the service
encounter.
Yi (1990) states that, customer satisfaction is considered as an attitude. In the case of
grocery shops, the shopping experience is important in evaluating customer
satisfaction. In this regard, customer satisfaction is evaluated based on the multiple
interactions the customer has with the service provider (Ibid.). According to Wicks &
15

Bachelor Thesis 15hp (2FE07E; 2FE10E) School of Business and Economics
Roethlein (2009, p. 83), “organisations that consistently satisfy their customers, enjoy
higher retention levels and greater profitability”. It is crucial then to keep customers
satisfied.
However, since perceptions of satisfaction appear to be influenced by pre-existing
expectations, this will mean that satisfaction results from a “disconfirmation
judgement”, as to the difference between expectations of the service provided and the
perceptions of the actual service performance (Rust & Oliver, 1994). Therefore, the
problem with the disconfirmation paradigm exists with respect to satisfaction. In this
case, satisfaction will be considered as “part of the overall attitude towards a service
provider in certain number of measures” (Levesque & McDougall, 1996, p. 14). It is
thus important to evaluate service quality by considering the important quality
attributes that firms can take improvement actions, especially those attributes that
have lower satisfaction level.
2.4 Service quality and customer satisfaction In the past few years, the relation of customer satisfaction and service quality has
received considerable academic attention (Spreng & Mackoy, 1996). Marketing
literature and practice hold the concepts of service quality and customer satisfaction at
the pick of important objectives (Ibid.).
The key for grocery retailing stores lies on delivering high quality service that can in
turn result to customer satisfaction (Shemwell, Yavas & Bilgin, 1998). In the case of
grocery stores, customer satisfaction is considered a prerequisite for customer
retention and loyalty and this obviously helps in realizing economic goals like
profitability and market share (Scheuing, 1995; Reichheld, 1996; Hackl & Westlund,
2002). Different arguments, concerning service quality and customer satisfaction,
claim that these concepts may be conceptually distinct but they are closely related
constructs (Parasuraman et al., 1994; Dabholkar, 1995; Shemwell et al., 1998).
Their relation, as stated by Bitner & Hubert (1994), shows that although there is a
strong correlation between service quality and customer satisfaction, the two concepts
are indeed different, which means that it becomes imperative for service providers to
16

Bachelor Thesis 15hp (2FE07E; 2FE10E) School of Business and Economics
view the two constructs separately. Customer satisfaction reflects the customer
feelings when he or she enters a grocery shop in multiple encounters such as
experience. Service quality is more abstract and is likely to be influenced by external
factors such as advertising and other forms of communication (Bitner et al., 1994).
While customer satisfaction is a broader concept, service quality targets on identifying
dimensions of service (Zeithaml, Bitner & Gremler, 2006). Based on these views,
service quality is a component of customer satisfaction and the two are closely
connected to each other (Ibid.).
2.5 Service quality models Seth, Deshmukh & Vrat (2005) state that researchers and managers are in constant
purchase of the components of service quality that lead to customer satisfaction and
increased profitability. They specifically stress that models can assist managers in not
only identifying and learning about these components, but also in providing directions
for improvement. Conceptual models are a simplified way of describing real-life
situations and thus a way of identifying quality problems and enhancing what an
organization has to offer; thereby improving efficiency, profitability and overall
performance) (Ibid.).
Literature has developed various models over the years, reporting more than 25
conceptualizations, one building on the other and each adding some value to the
service quality concept (Sangeetha & Mahalingam, 2011; Seth et al., 2005). For this
study, three models are shortly introduced, which also helped in the construction of
our questionnaire (see chapter 3.6). However, more emphasis will be given on the
work of Parasuraman et al. (1988) since this served as the core model for this
research. The models used are:
Brady & Cronin’s model illustrates a hierarchical approach of service quality and it
identifies nine subdimensions that define the three direct determinants of service
quality; interaction, environment, and outcome. These reflect the composite set of
factors customers consider when they evaluate the quality of the service (Brady &
Cronin, 2001).
17

Bachelor Thesis 15hp (2FE07E; 2FE10E) School of Business and Economics
Source: Brady & Cronin (2001)
Figure 2: Brady & Cronin’s model
In the retail store context, Dabholkar, Thorpe & Rentz’s model presents a hierarchical
factor structure of retail service quality and it identifies five dimensions of the retail
service quality; physical aspects, reliability, personal interaction, problem solving and
policy. The first three dimensions have two more sub-dimensions as shown in the
figure and the whole model depicts the dimensions important to retail customers
(Dabholkar et al., 1996).
Source: Dabholkar, Thorpe & Rentz (1996) Figure 3: Dabholkar, Thorpe & Rentz’s model
18

Bachelor Thesis 15hp (2FE07E; 2FE10E) School of Business and Economics
2.5.1 The SERVQUAL model
SERVQUAL is a 22-item subsequent scale for measuring consumers’ expectations
and perceptions of service quality. Originally, Parasuraman et al. (1985) identified
five organizational gaps within the process of service design/delivery that cause
deficits in quality and leading to dissatisfied customers. However, they refined their
research and the original ten dimensions of service quality (proposed in their work in
1985), became five (Parasuraman et al., 1988). As Parasuraman et al. (1988) describe
in their work, these dimensions are: tangibles (the environment of the company and
how the working staff appears to be), reliability (ability to serve customers in a
dependable way), responsiveness (a company’s tendency to serve customers willingly
and promptly), assurance (making the customers feel safe and easy around the
company’s environment) and empathy (ability to understand the needs of the
customer).
Source: Parasuraman et al. (1988)
Figure 4: Parasuraman, Zeithaml & Berry’s model
SERVQUAL’s basic idea is the difference between a customer's expectations for a
service to be used and his or her perceptions of the service received (Parasuraman et
al., 1988). This difference is called a “gap” (gap 5 as shown in figure 4) and it is
referred to as “perceived service quality”. External factors may, however, influence
the expectations of customers, which are not under the control of the service provider
(Ibid.). This study has a focus on this gap and tries to identify the difference between
expectations and perceptions.
19
Bachelor Thesis 15hp (2FE07E; 2FE10E) School of Business and Economics
2.5.2 Criticism of SERVQUAL model
According to Buttle (1996), there are some criticisms of SERQUAL, both theoretical
and operational. In the theoretical criticism, the author states that SERVQUAL is
based on a disconfirmation paradigm instead of an attitudinal paradigm and that it
does not draw on established economic, statistical and psychological theories.
Secondly, using the gap model, there is little evidence that customers will assess
service quality in terms of P-E gaps (perceptions-expectations). The author continues
by stating that the process orientation of SERVQUAL focuses on the process of
service delivery and not on the outcome of the service encounter. Using the five
dimensions, the author states that they are not universal and that there is a high degree
of interrelation between the dimensions (Ibid.).
In the operational criticism, Buttle (1996) argues that the term “expectations” has
different definitions and that consumers use other measures than sole expectations to
evaluate service quality. In item composition the author says the five items can not
capture the variability within each service quality dimension. Customers may assess
service quality in various ways from the “moment of truth” (time of interaction of a
service encounter between the two parties). Finally, he states that the SERVQUAL
instruments of expectations and perceptions can cause confusion (Ibid.).
Even though it has some weaknesses and despite the criticisms, Buttle (1996) still
supports the model to be a very good tool in understanding customers’ expectations
and make improvements in service. He states that the extensive use of this model has
proved SERVQUAL to be very reliable and for this reason we believe that this model
can be applied in the context of grocery stores.
20

Bachelor Thesis 15hp (2FE07E; 2FE10E) School of Business and Economics
2.6 State of the art
Over a decade, researchers have proposed and evaluated alternative service quality
models and instruments for measuring service quality. Among these models,
SERVQUAL (Parasuraman et al., 1988) is the most dominant and the most widely
used. The model is based on the comparison of performance with expectations. Good
service quality means that the customers’ perceptions of service performance meet or
exceed their expectations of what the service firm should provide (Ibid).
Through in-depth interviews and focus group discussions with firms in four different
service industries, Parasuraman et al. (1988) identified the five determinants of
service quality (stated in chapter 2.5.1) and provided the basis for the measurement of
customer satisfaction. Since then, the SERVQUAL scale has been widely used to
measure service quality in different service contexts, such as professional services
(Freeman & Dart, 1993), health care (Lam, 1997), tourism (Tribe & Snaith, 1988),
business school (Pariseau & McDaniel, 1997) and information systems (Kettinger &
Lee, 1994).
It has also been widely tested for its validity and reliability (Babakus & Boller, 1992;
Bolton & Drew, 1991; Cronin & Taylor, 1992; 1994). Despite that some of these
studies failed to support the SERVQUAL model, Parasuraman et al. (1993) defended
their structure on both conceptual and practical grounds.
Considering the strengths and weaknesses of SERVQUAL and related instruments,
the issue of how best to conceptualize and operationalize service quality is still a
subject of heated debate (Cronin & Taylor, 1994; Parasuraman et al., 1993; Teas,
1994). However, it is generally agreed that SERVQUAL is a multi-dimensional/multi-
attribute construct instrument of being valid and reliable. This study finds the
instrument to be valid and reliable for measuring retail service quality and applicable
for research in Växjö. Based on a modified SERVQUAL, the authors of this study
estimate that this service quality instrument can be applied in measuring service
quality in the field of grocery retailing.
21

Bachelor Thesis 15hp (2FE07E; 2FE10E) School of Business and Economics
2.6.1 Adapted SERVQUAL model
For the purpose of this research, we want to present an adapted SERVQUAL model,
which we believe is more fitting to the context of grocery stores. We essentially use
the basic SERVQUAL model with some additions. As Parasuraman et al. (1993)
suggest, with minor modification, SERVQUAL can be adapted to any service
industry. Thus, we apply the main quality dimensions proposed by Parasuraman et al.
(1988) and we add three more variables; “products”, “location” and “waiting time”.
Products will be looked in the light of variety and quality, which means the different
variations of a product-brand a grocery store offers (flavours, sizes, etc) and their state
when purchased (fresh, not expired, not broken, etc). Location will be looked as the
place of the store, either centrally located or in the outskirts of a city/town and waiting
time as the time spent while shopping, including the waiting time for payment. We,
thus, adopt a modified SERVQUAL model with eight dimensions; tangibles,
reliability, responsiveness, assurance, empathy, products, location and waiting time.
Figure 5: Adapted SERVQUAL model
For this model, the initial 22 items of the SERVQUAL model were modified, some of
them were excluded and other items were included. This model is a summary of items
used from basically three major studies, the ones of Parasuraman et al. (1988),
Dabholkar et al. (1996) and Brady & Cronin (2001). Items of our own making were
also constructed to complete the questionnaire of this study, all based on the literature
gathered and relevant to the concepts we address to our respondents. The aim was to
measure the service quality gap between the expectations respondents have from a
22

Bachelor Thesis 15hp (2FE07E; 2FE10E) School of Business and Economics
grocery store and the actual service they experience. Furthermore, we were interested
in finding out the overall service quality perceived by customers and with which
dimensions respondents are mostly satisfied with.
2.7 Research question and hypotheses
Owing to the fact that customers are sensitive to services provided to them, we look
on the dimensions that customers value the most. We are interested in contributing to
the service quality concept of grocery stores’, adding more value to the
dimensionality of service quality. We will therefore like to answer the following
question in our study:
• Are consumers satisfied with service quality offered by grocery stores?
To answer our research question, we formulate a hypothesis based on the adapted
SERVQUAL model we use:
H1: The smaller the gap between expectations and perceptions, the higher customer
satisfaction is
Also, since the five dimensions of the SERVQUAL have already been widely tested
for their applicability, we are mostly interested in the relation between the three
variables proposed in this study with customer satisfaction and for that reason we
would like to test the following hypotheses:
H2: The good physical condition and variety of a grocery store’s products lead to
customer satisfaction
H3: The location of the grocery store plays a big role to customer satisfaction
H4: The time spent in the grocery store is of high importance to customer
satisfaction
23
Bachelor Thesis 15hp (2FE07E; 2FE10E) School of Business and Economics
3. Methodology In this chapter, we present and motivate our choice of method in collecting and
analysing the data of this study. We present both theoretical and practical point
of view and then compare the advantages and drawbacks of other alternative
methods that may be less appropriate to the context of the study.
3.1 Research approach The two research approaches according to Bryman & Bell (2011) are the inductive
and deductive: inductive means that according to the implications of his findings, a
researcher infers a new theory; deductive is when a researcher deduces a hypothesis
or a problem, based on an already known theoretical background in a certain area of
expertise, which then tests with an empirical investigation (Ibid.).
The approach this study follows is the deductive. The interest of the study initiated by
looking at different dominating theories and aspects of service quality and customer
satisfaction that can be applied in the grocery retailing and eventually reaching to our
research question. The aim is to answer this question by undergoing an empirical
investigation.
To accomplish that, there are two ways, the quantitative or the qualitative approach
(Bryman & Bell, 2011): a quantitative research has to do with collecting results which
are measurable and presentable in the form of numbers and statistics, by testing
variables in a large population. Its purpose is to make generalizations based on the
processed results of the investigation; a qualitative research strives to gain a deeper
and more complete understanding of the studied problem by testing several variables
in a smaller population (Ibid.).
For this study, the quantitative approach was chosen, as we want to test some aspects
and dimensions of service quality on a large sample of the population. The
dimensions tested were the ones most relevant to the grocery stores’ service and the
objective is to get a view about customer satisfaction dimensions from a relatively
large number of consumers, in order to be able to generalize the results to the
population as a whole. Furthermore, the qualitative approach would be a more
24

Bachelor Thesis 15hp (2FE07E; 2FE10E) School of Business and Economics
subjective analysis from our part and aim is to gather tangible information to support
our case.
3.2 Research design A research design, as stated by Bryman & Bell (2011, p. 40), “provides a framework
for the collection and analysis of data”. According to Malhotra (2010), it is a
blueprint that includes details of all the procedures needed to solve marketing research
problems. The decision of which research design to choose, is determined by if the
researcher wants to express connections between variables, generalize results to a
population, understand behaviour or compare current with old results (Bryman &
Bell, 2011).
There are three types of research designs according to Malhotra (2010): the
exploratory research design, the descriptive research design and the causal research
design. The exploratory research design gives the researcher an initial understanding
of the problem at hand and provides insights before an approach can be developed.
The descriptive research design is used to describe market characteristics of functions
or make comparisons of variables and make predictions. The causal research design is
employed when a researcher wants to find out which of his or her studied variables is
the cause (independent variables) is and which are the effect (dependent variables) of
the phenomenon he or she studies and tries to obtain evidence regarding this cause-
and-effect relationships (Ibid.).
The design followed in this study is the descriptive because the goal was to look in
some characteristics of the grocery store service and make assumptions and inferences
about them. To be more explicit, the approach followed was the single cross-sectional
design (part of the descriptive design). This design involves the collection of data
from only one sample of a population (Malhotra, 2010). Indeed, one sample was
chosen from our population, so this design best suited the study, primarily due to time
constraints.
25

Bachelor Thesis 15hp (2FE07E; 2FE10E) School of Business and Economics
3.3 Data sources Data can be collected either from primary data sources or secondary: Malhotra (2010)
refers to primary data simply as information collected for the research needs at hand.
Bryman & Bell (2011) refer to them as information collected first-hand, up-to-date
and tailor-made to answer specific research questions. Secondary data are information
collected for reasons other than helping to solve the exact problem at hand and they
are gathered more to provide some background or alternatives to the main research
problem (Ibid.).
For the needs of this research, primary data were found more appropriate, since the
focus is to find current information about the preferences of consumers and which
relate directly to our research questions. This choice was made because secondary
data could prove insufficient or inaccurate since the study was undertaken in Växjö
and probably they couldn’t be generalizable to answer the problem at hand.
3.4 Research strategy According to Yin (2009), there are five major research strategies to follow in a study,
namely experiment, survey, archival analysis, history and case study. These strategies
are presented in figure 6, describing briefly where each focuses:
Source: Yin (2009)
Figure 6: Research strategies
26
Bachelor Thesis 15hp (2FE07E; 2FE10E) School of Business and Economics
Our study followed the survey strategy, as it takes a sample of the grocery stores’
population and tries to make statistical inferences about this population. It could not
take a history or archival analysis path because we primarily test the contemporary
beliefs of the consumers in Växjö and secondly not just observe/examine accumulated
documents, which may not even have any specific relevance to our own work. An
experiment was also ruled out due to the difficulty to run. A case study was excluded
too because the aim was to take data from a large number of units and not just an
individual unit (company, person/group, event). Thus, a survey serves the interest of
this study more adequately since in this way we can answer our research question
with more accuracy.
3.5 Data collection method There are several methods for collecting the data required for a study. The most
common of them are interviews, focus groups, content analysis, different types of
surveys and observations (Bryman & Bell, 2011). Interviews and focus groups are a
good way of getting an in-depth insight of the study object but they tend to be more
subjective in the interpretation and examine a smaller part of a population (Ibid.) and
our focus is firstly to get the most realistic view and secondly from a larger sample.
Furthermore, since the study is quantitative, a survey is more suitable. The reason is
that, since we examine the effect of specific dimensions of grocery stores’ service
quality, the use of collected data from a rather big sample, to give organized statistics
and results, complies perfectly with the purpose of this study.
The different types of surveys include four different contact methods, which means
reaching a test-subject via mail, internet/email, telephone or personal approach
(Bryman & Bell, 2011). For this study, the personal approach was chosen mainly
because we wanted a face-to-face “communication” with our respondents. By
personal or face-to-face, we mean a more direct approach than the other methods. We
wanted essentially to be able to clarify any problems/questions our subjects could not
understand, which would be difficult especially in the case of mails or emails. Also,
we achieved a better response rate with this approach, because of the personal
involvement and chance we had to explain everything to our respondents. The speed
of data collection was likewise very good and depended on us mostly and not just on
27

Bachelor Thesis 15hp (2FE07E; 2FE10E) School of Business and Economics
waiting for answers on mails or emails. For these reasons, a personal contact method
was used to serve the purpose of this research.
3.6 Data collection instrument
To know how customers perceive service quality, self-completion questionnaires were
used for this study. The reason was to collect anonymous answers that could really get
the data we were interested in.
According to Bryman & Bell (2011), self-completion questionnaires are
questionnaires that can be answered without the aid of an interviewer. The author
gives a couple of reasons to support the use of self-completion questionnaires as well
as some of their drawbacks. Advantages include that self-completion questionnaires
are cost effective, meaning they are easy to distribute and without many expenses.
Also, they don’t take a long time to administer (compared to interviews), since they
can be filled in at the same time by many respondents. Additionally, self-completion
questionnaires give respondents convenience and autonomy to respond to questions
when they want and at any speed they want. On the other hand, the main drawbacks
of self-completion questionnaires include low response rate, questionnaires not being
completely answered and biased responses (Ibid.).
Despite the drawbacks cited above, we endeavoured to overcome them by checking
each questionnaire when respondents handed them in. Therefore, by doing so, our
response rate was really high. We even tried to explain the questionnaire to the
respondents in brief to avoid any confusion. The questions-statements were structured
so as to get the respondents’ expectations about the grocery stores in Växjö and their
experiences (perception) of these stores. The statements used seek to find out the
customers’ preferences and identify which of the different dimensions of our adapted
SERVQUAL model actually matter to them.
3.6.1 Operationalization and measurement of variables
Operationalization is the process of defining variables into measurable factors. The
process defines fuzzy concepts and allows them to be measured, empirically and
quantitatively. It is basically how a concept is to be measured in a research and,
28

Bachelor Thesis 15hp (2FE07E; 2FE10E) School of Business and Economics
according to Bryman & Bell (2011), all concepts that have been implemented in a
quantitative research have to be measured.
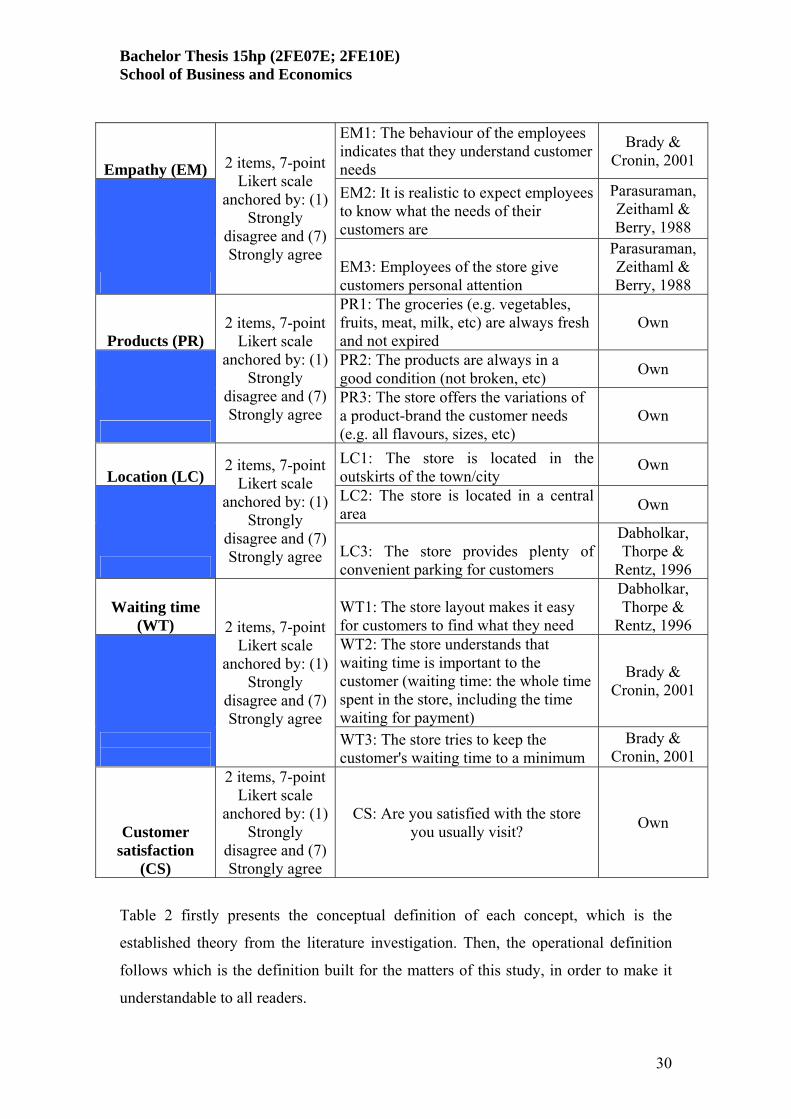
Table 1 presents the indicators used in the questionnaire, by displaying the concepts,
the type of scale and its construction, the items used and their references. To ease our
analysis of the data collected, we also coded our main variables from the adapted
SERVQUAL model.
Table 1: Measurement and scaling of constructs
Concept
Type of scale & its
construction Items used Adopted
from
Tangibles (TN) TN1: The store has modern-looking equipment
Dabholkar, Thorpe &
Rentz, 1996 TN2: The store has clean and convenient physical facilities
Das, Kumar & Saha, 2010
2 items, 7-point Likert scale
anchored by: (1) Strongly
disagree and (7) Strongly agree TN3: The physical facilities of the
store are visually appealing Brady &
Cronin, 2001
Reliability (RL) RL1: The store has merchandise available when the customers want it
Dabholkar, Thorpe &
Rentz, 1996
RL2: The store provides its services at the time it promises to do so
Parasuraman, Zeithaml & Berry, 1988
2 items, 7-point Likert scale
anchored by: (1) Strongly
disagree and (7) Strongly agree RL3: Customers can count on the
employees taking actions to address their needs
Brady & Cronin, 2001
Responsiveness (RN)
RN1: Employees of the store are able to handle customer complaints directly and immediately
Dabholkar, Thorpe &
Rentz, 1996 RN2: It is okay if the employees are too busy to respond to customer requests promptly
Parasuraman, Zeithaml & Berry, 1988
2 items, 7-point Likert scale
anchored by: (1) Strongly
disagree and (7) Strongly agree RN3: Employees of the store respond
quickly to customer needs Brady &
Cronin, 2001
Assurance (AS) AS1: Customers are able to trust employees of the store
Parasuraman, Zeithaml & Berry, 1988
AS2: Customers feel safe in their transactions with the store
Parasuraman, Zeithaml & Berry, 1988
2 items, 7-point Likert scale anchored by:
AS3: Employees in the store are consistently polite with customers
Das, Kumar & Saha, 2010
29
Bachelor Thesis 15hp (2FE07E; 2FE10E) School of Business and Economics
Empathy (EM)
EM1: The behaviour of the employees indicates that they understand customer needs
Brady & Cronin, 2001
EM2: It is realistic to expect employees to know what the needs of their customers are
Parasuraman, Zeithaml & Berry, 1988
2 items, 7-point Likert scale
anchored by: (1) Strongly
disagree and (7) Strongly agree
EM3: Employees of the store give customers personal attention
Parasuraman, Zeithaml & Berry, 1988
Products (PR)
PR1: The groceries (e.g. vegetables, fruits, meat, milk, etc) are always fresh and not expired
Own
PR2: The products are always in a good condition (not broken, etc) Own
2 items, 7-point Likert scale
anchored by: (1) Strongly
disagree and (7) Strongly agree
PR3: The store offers the variations of a product-brand the customer needs (e.g. all flavours, sizes, etc)
Own
Location (LC) LC1: The store is located in the outskirts of the town/city
Own
LC2: The store is located in a central area Own
2 items, 7-point Likert scale
anchored by: (1) Strongly
disagree and (7) Strongly agree LC3: The store provides plenty of
convenient parking for customers
Dabholkar, Thorpe &
Rentz, 1996
Waiting time (WT)
WT1: The store layout makes it easy for customers to find what they need
Dabholkar, Thorpe &
Rentz, 1996 WT2: The store understands that waiting time is important to the customer (waiting time: the whole time spent in the store, including the time waiting for payment)
Brady & Cronin, 2001
2 items, 7-point Likert scale
anchored by: (1) Strongly
disagree and (7) Strongly agree
WT3: The store tries to keep the customer's waiting time to a minimum
Brady & Cronin, 2001
Customer satisfaction
(CS)
2 items, 7-point Likert scale
anchored by: (1) Strongly
disagree and (7) Strongly agree
CS: Are you satisfied with the store you usually visit? Own
Table 2 firstly presents the conceptual definition of each concept, which is the
established theory from the literature investigation. Then, the operational definition
follows which is the definition built for the matters of this study, in order to make it
understandable to all readers.
30

Bachelor Thesis 15hp (2FE07E; 2FE10E) School of Business and Economics
Table 2: Research constructs and their definitions
Concept Conceptual definition Operational definition
Tangibles (TN)
“Physical facilities, equipment and appearance of personnel” (Parasuraman et al., 1988, p. 23)
Ambiance of the grocery store and how the working staff appears to be
Reliability (RL)
“Ability to perform the promised service dependably and accurately” (Parasuraman et al., 1988, p. 23)
Ability to serve customers adequately and in time
Responsiveness (RN)
“Willingness to help customers and provide prompt service” (Parasuraman et al., 1988, p. 23)
The grocery store's tendency to serve customers fast and with verve
Assurance (AS)
“Knowledge and courtesy of employees and their ability to inspire trust and confidence” (Parasuraman et al., 1988, p. 23)
Making the customers feel safe and easy around the grocery store environment
Empathy (EM)
“Caring individualized attention the firm provides to its customers” (Parasuraman et al., 1988, p. 23)
Ability to understand the needs of the customer, to get in the “shoes” of the customer
Products (PR) Variety and product quality
The different variations of products-brands the grocery store offers (flavours, sizes, etc) and their state when purchased (fresh, not expired, not broken, etc)
Location (LC) Place of the store
If the grocery store is centrally located or in the outskirts of a city/town
Waiting time (WT) Time spent in a store
Time spent while shopping, including the waiting time for payment
31

Bachelor Thesis 15hp (2FE07E; 2FE10E) School of Business and Economics
3.6.2 Questionnaire design
The questionnaire is comprised of three parts and it includes 29 questions (see
Appendix). The main part of the questionnaire is divided in two sections, one for
expectations and one for perceptions. The respondents had to evaluate the same
statements-items, firstly in the light of expectations and secondly in the light of
perceptions.
The first part of the questionnaire aims at measuring the respondents’ expectations of
service quality in grocery stores. It requires from respondents to show the extent to
which they believe grocery stores “should” possess the features stated. In other words,
its purpose is to picture the ideal service people want from a grocery store and express
their desire for a particular attribute of service quality.
The second part aims at measuring respondents’ perceptions. Respondents were
requested to show the extent to which the statements reflect their experience from
grocery stores in Växjö. In this part, they were asked to picture the store in Växjö they
visit the most and answer accordingly.
After completing these two sections of the questionnaire, having 24 questions, the
respondents were asked to fill one question about the overall satisfaction they get
from grocery stores in Växjö. This question intends to measure their opinion
regardless their expectations and perceptions.
In the last part of the questionnaire, we accumulated some demographic
characteristics, like gender, age, level of education and their monthly expenditure in
grocery stores. Monthly expenditure was calculated in Swedish currency, the Swedish
Kronor.
As stated in section 2.6.1, most of the statements used in this study were originally
developed by Parasuraman et al. (1988), Dabholkar et al. (1996) and Brady & Cronin
(2001). This research has changed the original SERVQUAL instrument, but we have
tried to bring in some new dimensions and rephrased the statements to be context-
relevant. To ensure content validity, we have added three new dimensions, product,
location and waiting time (described in section 2.5.2). All eight dimensions included
32

Bachelor Thesis 15hp (2FE07E; 2FE10E) School of Business and Economics
three items each. We have therefore employed 24 statements to measure our
dimensions. Questions 1 to 3 will be used to measure the tangibility aspect of grocery
stores in Växjö. The reliability dimension will be measured in statement 4 to 6, while
the responsiveness dimension will be measured in statement 7 to 9. The assurance and
empathy dimensions will be measured in 10 to 12 and 13 to 15 respectively. The
product dimension will be measured in statement 16 to 18. Lastly, the location and
waiting time dimensions will be measured in statements 19 to 21 and 22 to 24
respectively. Question 25 measures if the respondents are satisfied in the whole from
the grocery store they visit. Finally, questions 26 to 29 are devoted to demographic
features as explained above.
The questions are close-ended. By being such, the results of the questions are easy to
complete by respondents and process and compare for researchers (Bryman & Bell,
2011). They are easy and quicker to analyze and reduce the probability of
misinterpreting the questions by giving respondents a set of possible answers (Ibid.).
The scale in our survey questions is the 1 to 7 Likert-type scale, originally developed
by Rensis Likert, with 1 denoting ‘I strongly disagree’ and 7 denoting ‘I strongly
agree’.
All in all, the adapted SERVQUAL model was used to assess consumers’
expectations and perceptions of grocery stores service. Both were measured using the
7-point Likert scale to rate the level of agreement and disagreement, through which
the higher number indicated a high level of expectations and perceptions.
Expectations are based on past experiences and information while perceptions are
based on the actual service received in grocery stores. As Parasuraman et al. (1985)
suggest, service quality scores are measured as the difference between perceptions (P)
and expectations (E) scores and this is how measurement was made in this study, with
the only difference it was thought as expectations minus perceptions. What we are
more interested in, is the absolute difference between expectations and perceptions;
the signs (+) or (–) just indicate which one is higher. This score measures the degree
to which expectations exceed perceptions. The more positive this P-E score, the
higher the level of service quality, leading in turn to a higher level of customer
satisfaction (Ibid.).
33

Bachelor Thesis 15hp (2FE07E; 2FE10E) School of Business and Economics
We could therefore assume based on the above that, in most cases, when expectations
and perceptions are equal, then service quality leads to satisfaction. This is actually
the, based on discrepancy theories, disconfirmation paradigm (Oliver, 1977). As this
theory suggests, consumers judge satisfaction as a result of their expectations and
perceptions. Therefore, positive disconfirmation leads to increased satisfaction and
negative disconfirmation leads to decreased satisfaction (Ibid.). We therefore kept in
mind this theory when developing the questionnaire, which can be seen in the
Appendix.
3.6.3 Pretesting
To ensure that our questionnaire is field-ready, we followed some pretesting of the
questionnaire. Testing the questionnaire helps researchers determine whether the
questionnaire is able to capture the required data to answer the purpose of the
research. It helps firstly in making the questions understandable to all respondents and
secondly making it easy for the researchers to document the information gathered
(Bryman & Bell, 2011).
For these reasons, experts in the field as well as parts of the survey population were
needed to examine the items of our questionnaire. Our test “pilots” for the
questionnaire was our tutor, our examiner and students from our university. The
questionnaire was at first discussed with our tutor and examiner and necessary
adjustments were made to the initial version. After that, the questionnaire was handed
out to students studying in fields outside Marketing, to ensure that everyone,
regardless of study-field, can understand the questions. Based on the feedback we got
from the test pilots, changes and improvements were made accordingly and the
questionnaire was ready to hand out to our real sample.
3.7 Sampling A survey can examine either every element of the population (census survey)
(Bryman & Bell, 2011), or in our case, a sample of the population (sample survey). A
census survey cannot be a viable option and so a sample survey had to meet the
expectations of this study because of its time, cost and resource saving characteristics.
34

Bachelor Thesis 15hp (2FE07E; 2FE10E) School of Business and Economics
Our study was carried out in Växjö Sweden and we are interested to find out how
consumers in this town perceive service quality in grocery stores. Växjö is a town
located in the south of Sweden with a population of approximately 80,000 inhabitants
and it is considered as the administrative headquarter of Kronoberg County (Växjö
Kommun Statistics, 2012). Our sample was from the inhabitants of Växjö, being
either Swedish or any other nationality living in town. To determine that sample, we
used the statistical method/formula (see below) and we calculated our sample size
target to be at 382 inhabitants.
n= {2500 x N x Z2}/ {[25 (N-1)] + [2500 x Z2]}
n= sample size,
N= population size,
Z= number of standard errors (1.96 for 95% confidence level)
However, due to time constraints, our sample was decreased to 200 respondents of
this population. We believe that this sample is sufficient to meet the objectives of this
study.
To gather this sample, we situated ourselves in front of different grocery stores in
Växjö so as to reach a large number of consumers. We approached any person who
had a shopping experience of the store we were outside from. Lastly, we shared the
questionnaires with everyone, without being biased and gave it to anyone who was
willing to answer.
3.8 Data analysis method For this quantitative research, the use of statistical tools was needed to help us do
some analyses. The SPSS program (Statistical Package for Social Sciences) was used
for the analysis of our data, as well as the Excel program to present tables and figures
of our results. We used descriptive statistics, mainly involving percentage frequencies
and arithmetic mean. The Cronbach's alpha test was also employed as well as a
regression analysis to test our different concepts. The tools used are briefly described
below:
35

Bachelor Thesis 15hp (2FE07E; 2FE10E) School of Business and Economics
The arithmetic mean is the total of all the values in a distribution, divided by the
number of these values (Bryman & Bell, 2011). Whenever answers were missing
from a statement of a questionnaire, a means/average was computed from the rest of
the answers of that same statement, in order to have a complete list of data to add in
the SPSS.
Cronbach's alpha is a test for a model or survey's internal consistency. It is widely
used to test internal reliability. Cronbach's alpha assesses the reliability of a rating
extracted from a multi-point formatted questionnaire or scale, summarizing a group of
survey answers which measure a specific concept (Blumberg, Cooper & Schindler,
2008; Bryman & Bell, 2011). A computed alpha coefficient varies between 1 (perfect
internal reliability) and 0 (no internal reliability). To have an acceptable level of
internal reliability, the figure 0.8 is typically employed, meaning “α” must be equal or
higher than this figure; α=>0.8 (Ibid.). However, in this study and in accordance with
our tutor, the figure used to denote acceptable level of reliability was α=>0.6.
Regression analysis is a statistical tool for the investigation of relationships between
one dependent variable (criterion) and one or more independent variables (predictor)
(Malhotra, 2010). The results of a regression analysis are assessed by looking at three
key factors; R-square, Beta value and significance. R-square ranges between 0 and 1
and indicates the proportion of the variance in the dependent variable which is
accounted for by the model. An example of R-square=0.357 means that 35.7% of the
variance is explained by the model. The Beta variable is a measure of how strongly
the independent variable influences the dependent variable. The higher the beta is, the
greater the impact of the dependent variable on the independent variable (Field,
2009). Lastly, significance is about how confident a researcher can be that his/her
findings can be generalized from a sample to a population (Bryman & Bell, 2011). If
a significant score is greater than 0.1, then the results are not significant or differently,
they do not support a hypothesis. If it is equal to 0.1 or greater than 0.05, then the
results are significant at 10% level of significance and support a hypothesis at p<0.1.
If it is equal to 0.05 or greater than 0.01, then the results are significant at 5% level of
significance and support a hypothesis at p<0.05. Finally, if a significance score is 0.01
36

Bachelor Thesis 15hp (2FE07E; 2FE10E) School of Business and Economics
or less, then the results are significant at 1% level of significance and support a
hypothesis at p<0.01, which is the highest level of significance (Ibid.).
3.9 Quality criteria The two main quality criteria for business research are validity and reliability. Next
follows a brief explanation of what these concepts stand for and the reasons we
believe that they characterize this study.
3.9.1 Validity
Bryman & Bell (2011, p. 42) define validity as “the concern with the integrity of the
conclusions that are generated from a piece of research”. In simple words, validity
concerns the accuracy of the study, whether a researcher measures the things that
he/she was supposed to measure. Validity can be seen from an external and an
internal perspective according to several authors (Bryman & Bell, 2007; Miles &
Huberman, 1994). External validity describes the degree of generalisation of the
results. Internal validity refers to the congruence of the observations and the
theoretical ideas (Bryman & Bell, 2007). According to LeCompte & Goetz (1982),
internal validity is seen as a strong point in quantitative research because the concept
and the observation match together.
We are inclined to believe that our work is valid and relevant and it can measure the
concepts we are addressing to our respondents. The items used in our questionnaire
have already been tested in practice by other researchers and have been proven to give
answers to the same concepts we measure in our study. For this reason, we believe
that with this questionnaire, it is possible to gather the data to answer our research
question.
3.9.2 Reliability
The consistency or the degree to which a research is replicable is expressed in the
term of reliability. The reliability is estimated high when an instrument measures the
same results under the same conditions monitoring the same subject. According to
Miles & Huberman (1994, p. 278), a reliable study is “consistent and reasonably
stable over time and across researcher and methods”. Problems with the reliability of
37

Bachelor Thesis 15hp (2FE07E; 2FE10E) School of Business and Economics
quantitative research are likely to occur because of change of the settings in which the
study is embedded (Bryman & Bell, 2007).
We believe that our work is reliable and if a future research would be undertaken, it
would give the same or almost the same results with us. The items we used in the
questionnaire are easy to comprehend and could be answered in any point in time.
Considering also that the questions are close-ended, this means that the responses are
limited. There is a chance though that results collected in another point of time could
change because consumers’ expectations are always changing. However, in the
whole, we think that if this study is carried out again, the results will be almost similar
to our own, especially because the answers are limited and specific.
38

Bachelor Thesis 15hp (2FE07E; 2FE10E) School of Business and Economics
4. Empirical results and analysis In this chapter we present the results of the study and analyse the primary data
we collected with our questionnaire. We present tables to demonstrate the results
and we interpret these results in compliance with the theories gathered.
4.1 Demographics To start the empirical chapter and give some information about our respondents, the
authors present their demographic characteristics in percentages. Our sample was
almost half divided with female respondents up to 52% and male up to 48%. The age
parameter counted 76.5% respondents being of 20-30 years old, 14.5% below 20 and
8.5% of 31-40 years old. Their level of education was in high percentage, having
93.5% respondents of university education and 4.5% of high school. Lastly, from
income expenditure, 40% of the respondents claimed to spend per month between
1001-2000Kr of their incomes in grocery stuff, while 26.5% claimed they spend 500-
1000Kr and 28% spend above 2000Kr). The percentages are summarized in table 3:
Table 3: Demographic frequencies
Characteristics Percentage Gender Male 48%
Female 52% Age <20 14.5%
20-30 76.5% 31-40 8.5%
41-50 0.5% Level of education Secondary school 2%
High school 4.5% University 93.5%
Monthly expenditure <500Kr 5.5% 500 – 1000Kr 26.5% 1001 – 2000Kr 40%
>2000Kr 28%
39
Bachelor Thesis 15hp (2FE07E; 2FE10E) School of Business and Economics
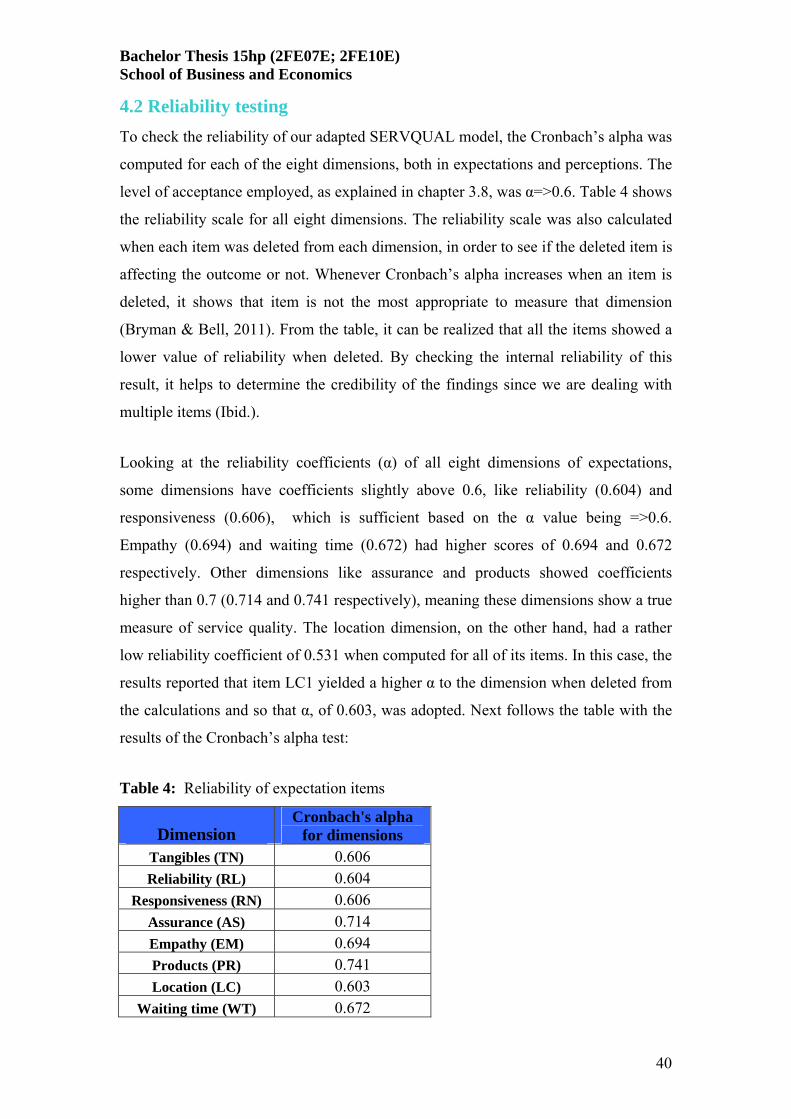
4.2 Reliability testing To check the reliability of our adapted SERVQUAL model, the Cronbach’s alpha was
computed for each of the eight dimensions, both in expectations and perceptions. The
level of acceptance employed, as explained in chapter 3.8, was α=>0.6. Table 4 shows
the reliability scale for all eight dimensions. The reliability scale was also calculated
when each item was deleted from each dimension, in order to see if the deleted item is
affecting the outcome or not. Whenever Cronbach’s alpha increases when an item is
deleted, it shows that item is not the most appropriate to measure that dimension
(Bryman & Bell, 2011). From the table, it can be realized that all the items showed a
lower value of reliability when deleted. By checking the internal reliability of this
result, it helps to determine the credibility of the findings since we are dealing with
multiple items (Ibid.).
Looking at the reliability coefficients (α) of all eight dimensions of expectations,
some dimensions have coefficients slightly above 0.6, like reliability (0.604) and
responsiveness (0.606), which is sufficient based on the α value being =>0.6.
Empathy (0.694) and waiting time (0.672) had higher scores of 0.694 and 0.672
respectively. Other dimensions like assurance and products showed coefficients
higher than 0.7 (0.714 and 0.741 respectively), meaning these dimensions show a true
measure of service quality. The location dimension, on the other hand, had a rather
low reliability coefficient of 0.531 when computed for all of its items. In this case, the
results reported that item LC1 yielded a higher α to the dimension when deleted from
the calculations and so that α, of 0.603, was adopted. Next follows the table with the
results of the Cronbach’s alpha test:
Table 4: Reliability of expectation items
Dimension Cronbach's alpha
for dimensions Tangibles (TN) 0.606 Reliability (RL) 0.604
Responsiveness (RN) 0.606 Assurance (AS) 0.714 Empathy (EM) 0.694 Products (PR) 0.741 Location (LC) 0.603
Waiting time (WT) 0.672
40

Bachelor Thesis 15hp (2FE07E; 2FE10E) School of Business and Economics
The next table shows the reliability testing for the items of perceptions. It can be seen
that all items showed a lower value of reliability when deleted, except for WT1 (the
store layout makes it easy for customers to find what they need) which had a higher
value of 0.756, showing it is not the best measure under that dimension. Consequently
that α was adopted. The reliability coefficients of five of the dimensions were in the
desirable frame of α=>0.6, for instance tangibles (0.653), reliability (0.603),
responsiveness (0.613), empathy (0.648) and products (0.666). The location
dimension had, however, a lower reliability coefficient of 0.585, denoting low internal
reliability as in the expectations reliability testing. In this case, the results reported
that item LC2 yielded a higher α to the dimension when deleted from the calculations
and so that α, of 0.616, was adopted. The results can be seen below:
Table 5: Reliability of perception items
Dimension Cronbach's alpha
for dimensions Tangibles (TN) 0.653 Reliability (RL) 0.603
Responsiveness (RN) 0.613 Assurance (AS) 0.609 Empathy (EM) 0.648 Products (PR) 0.666 Location (LC) 0.616
Waiting time (WT) 0.658
4.3 Expectation, perception and gap scores In this part, we computed the arithmetic means for all the items of both expectations
and perceptions. The aim was to measure the gap that exists between expectations and
perceptions.
The items with the highest expectation scores were PR1 (freshness of the groceries)
with 6.33, AS2 (safety of customer transactions with the store) with 6.31 and PR2
(good condition of the products) with 6.27. The lower mean was 4.14 of the RN2 item
(it is okay if the employees are too busy to respond to customer requests promptly).
The overall mean of expectations was computed too and the result was at 5.8,
meaning that expectations of the sample taken are quite high.
41

Bachelor Thesis 15hp (2FE07E; 2FE10E) School of Business and Economics
The items with the highest perception scores were AS2 (safety of customer
transactions with the store) with 5.85, RL2 (the store provides its services in time)
with 5.37 and LC3 (offer of convenient parking) with 5.27. The lower mean was 4.21
of the RN2 item (it is okay if the employees are too busy to respond to customer
requests promptly). The overall mean of perceptions was at 4.81, which means that
the actual service perceived by the respondents is quite low. It can be seen that
perceptions in general are lower than expectations, which was anticipated as
Parasuraman et al. (1988) also suggested.
To find out which dimensions of service quality consumers are more satisfied with,
gap scores were computed. According to Parasuraman et al. (1985), the more positive
the P-E score, the higher the level of service quality, and to this extent a higher level
of customer satisfaction. In this regard, the gap scores were computed based on the
difference between consumers’ expectations and perceptions, with the only difference
it was thought as expectations minus perceptions in the calculations (explained in
chapter 3.6.2).
The largest gaps scores were clearly reported on the dimension of waiting time with
1.39, 1.47 and 1.51 scores in each of the three items employed. Other big gaps were
reported in the products dimensions PR1 (freshness of groceries) and PR2 (good
condition of products), scoring 1.32 and 1.14 respectively. In the responsiveness
dimension, RN1 (employees able to handle customer complaints) scored 1.23 and in
the reliability dimension, RL3 (customers counting on employees) scored 1.07.
Lastly, from the assurance dimension, AS3 (politeness of employees) scored 1.08.
The smallest gap was found in item AS2 (safety in transactions with store) scoring
0.46. EM2 (expect employees to know customers’ needs) and LC3 (offer of
convenient parking), both scored 0.49, denoting small gaps as well.
Negative scores were found only in the responsiveness dimension RN2 (okay if
employees are too busy to respond to respond to customers), which scored -0.07 and
location dimension LC1 (stores located in the outskirts of a town/city), which scored -
42
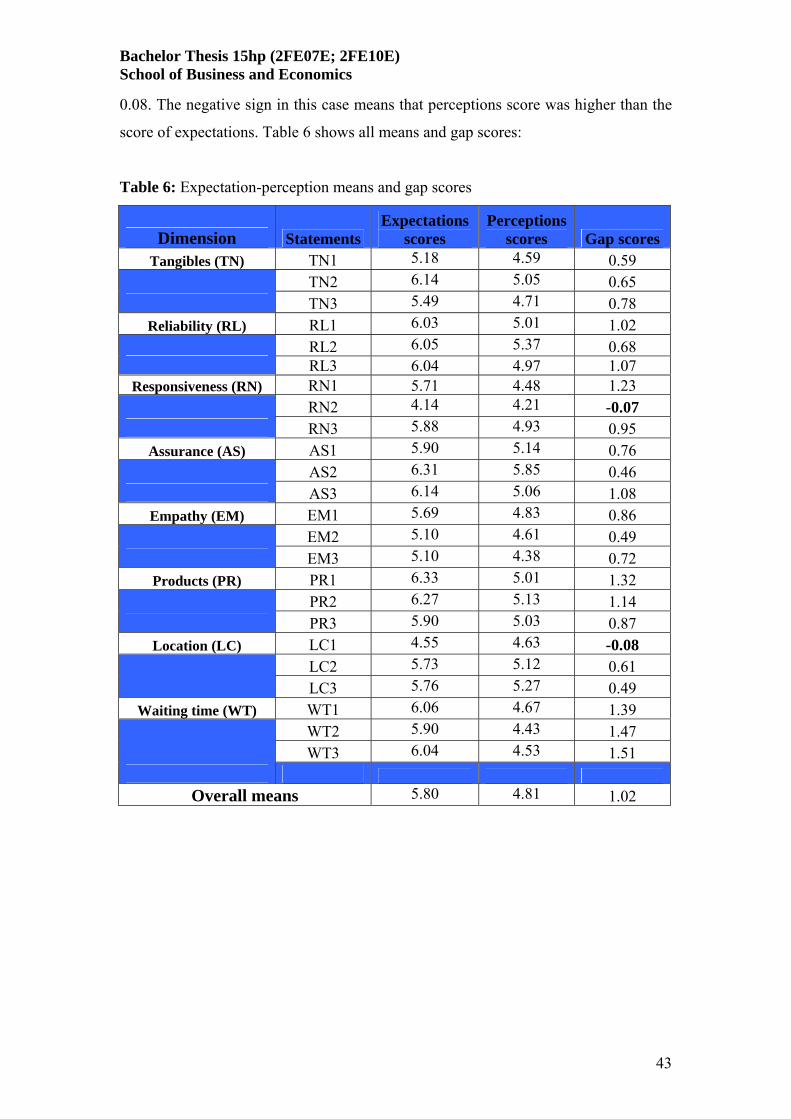
Bachelor Thesis 15hp (2FE07E; 2FE10E) School of Business and Economics
0.08. The negative sign in this case means that perceptions score was higher than the
score of expectations. Table 6 shows all means and gap scores:
Table 6: Expectation-perception means and gap scores
Dimension Statements Expectations
scores Perceptions
scores Gap scores Tangibles (TN) TN1 5.18 4.59 0.59
TN2 6.14 5.05 0.65 TN3 5.49 4.71 0.78
Reliability (RL) RL1 6.03 5.01 1.02 RL2 6.05 5.37 0.68
RL3 6.04 4.97 1.07 Responsiveness (RN) RN1 5.71 4.48 1.23
RN2 4.14 4.21 -0.07 RN3 5.88 4.93 0.95
Assurance (AS) AS1 5.90 5.14 0.76 AS2 6.31 5.85 0.46
AS3 6.14 5.06 1.08 Empathy (EM) EM1 5.69 4.83 0.86
EM2 5.10 4.61 0.49 EM3 5.10 4.38 0.72
Products (PR) PR1 6.33 5.01 1.32 PR2 6.27 5.13 1.14
PR3 5.90 5.03 0.87 Location (LC) LC1 4.55 4.63 -0.08
LC2 5.73 5.12 0.61 LC3 5.76 5.27 0.49
Waiting time (WT) WT1 6.06 4.67 1.39 WT2 5.90 4.43 1.47 WT3 6.04 4.53 1.51
Overall means 5.80 4.81 1.02
43

Bachelor Thesis 15hp (2FE07E; 2FE10E) School of Business and Economics
4.4 Regression To test our hypotheses concerning the three proposed variables, a regression analysis
was employed for each of the dimensions. The dependent variable (criterion) for this
analysis was the customer satisfaction item (see table 1, chapter 3.6.1) and as
independent variables (predictors) were each time one of the dimensions. Because of
the fact that each dimension has three items, a mean was computed for each of the
dimensions and this mean was used in each test. The names adopted for these means
were PR, LC and WT. Also, this analysis was based on the answers of perceptions
since our interest revolves around the real experience. The hypotheses are presented
below, in parallel with the tables, so as to base the arguments of whether they are
supported or not:
H2: The good physical condition and variety of a grocery store’s products lead to
customer satisfaction
Table 7: Regression analysis for products
Model Summary
Model R R
Square
Adjusted R
Square
Std. Error of the
Estimate 1 0.424a 0.180 0.176 0.972a. Predictors: (Constant), PR
ANOVAa
Model Sum of Squares df
Mean Square F Sig.
Regression 41.000 1 41.000 43.441 0.000b Residual 186.875 198 0.944
1
Total 227.875 199 a. Dependent Variable: CS Are you satisfied with the store you usually visit? b. Predictors: (Constant), PR
Coefficientsa Unstandardized
Coefficients Standardized Coefficients
Model B Std.
Error Beta t Sig. (Constant) 3.303 0.337 9.815 0.000 1 PR 0.430 0.065 0.424 6.591 0.000
a. Dependent Variable: CS Are you satisfied with the store you usually visit?
44

Bachelor Thesis 15hp (2FE07E; 2FE10E) School of Business and Economics
The results for the products dimension indicate that the independent variable is a
rather strong predictor of the criterion variable (customer satisfaction). The R-square
of 0.180 shows a good correlation between the two variables. Beta value of 0.424
shows a positive correlation between the variables, indicating a rather good
contribution to explaining the dependent variable. The significance shows that this
dimension made a statistically significant contribution to the variation of the
dependent variable. PR is statistically significant at the 1% significance level, in other
words, results support the hypothesis H2 at p<0.01 level, reaching the highest level of
significance. The ranges of R-square, Beta value and significance are explained in
chapter 3.8.
H3: The location of the grocery store plays a big role to customer satisfaction
Table 8: Regression analysis for location
Model Summary
Model R R
Square
Adjusted R
Square
Std. Error of the
Estimate 1 0.262a 0.069 0.064 1.035a. Predictors: (Constant), LC
ANOVAa
Model Sum of Squares df
Mean Square F Sig.
Regression 15.702 1 15.702 14.653 0.000b Residual 212.173 198 1.072
1
Total 227.875 199 a. Dependent Variable: CS Are you satisfied with the store you usually visit? b. Predictors: (Constant), LC
Coefficientsa Unstandardized
Coefficients Standardized Coefficients
Model B Std.
Error Beta t Sig. (Constant) 4.038 0.382 10.561 0.000 1 LC 0.287 0.075 0.262 3.828 0.000
a. Dependent Variable: CS Are you satisfied with the store you usually visit?
45

Bachelor Thesis 15hp (2FE07E; 2FE10E) School of Business and Economics
The results for the location dimension indicate that this independent variable is overly
a moderate predictor of the criterion variable. The R-square of 0.069 shows a rather
small correlation between the two variables. On the other hand, the Beta value of
0.262 shows a positive correlation between the variables, indicating a rather good
contribution to explaining the dependent variable. The significance also shows that
this dimension made a statistically significant contribution to the variation of the
dependent variable. LC is statistically significant at the 1% significance level and that
means the results support the hypothesis H3 at p<0.01 level (highest level of
significance).
H4: The time spent in the grocery store is of high importance to customer satisfaction
Table 9: Regression analysis for waiting time
Model Summary
Model R R
Square
Adjusted R
Square
Std. Error of the
Estimate 1 0.373a 0.139 0.135 0.995a. Predictors: (Constant), WT
ANOVAa
Model Sum of Squares df
Mean Square F Sig.
Regression 31.760 1 31.760 32.066 0.000b Residual 196.115 198 0.990
1
Total 227.875 199 a. Dependent Variable: CS Are you satisfied with the store you usually visit? b. Predictors: (Constant), WT
Coefficientsa Unstandardized
Coefficients Standardized Coefficients
Model B Std.
Error Beta t Sig. (Constant) 3.862 0.293 13.157 0.000 1 WT 0.355 0.063 0.373 5.663 0.000
a. Dependent Variable: CS Are you satisfied with the store you usually visit?
46

Bachelor Thesis 15hp (2FE07E; 2FE10E) School of Business and Economics
The results for the waiting time dimension indicate that the independent variable is
also a rather strong predictor of the criterion variable. The R-square of 0.139 shows a
good correlation between the two variables. Beta value of 0.373 shows a positive
correlation between the variables, indicating a rather good contribution to explaining
the dependent variable. The significance shows that this dimension made a
statistically significant contribution to the variation of the dependent variable. WT is
statistically significant at the 1% significance level, meaning results support the
hypothesis H4 at p<0.01 level (highest level of significance).
4.5 Analysis The process of the collected data yielded different results which would need some
interpretation to have a better value. It can be seen from table 3 that our sample was
equally divided among men and women, more of 20-30 years old and representing a
high percentage of University education. The equal gender division was made on
purpose, to have a view at both sexes and the range of age was chosen based on the
fact that authors wanted to know the young studying and working population of
Växjö. The monthly expenditure of the respondents on grocery stores also varied,
showing the difference in importance people give in spending a lot or not too much
money on grocery stores.
In checking the reliability of the items used, the results from the Cronbach’s alpha test
were positive in almost all cases. Assurance and products items scored high
coefficients in both expectations and perceptions, which means that they show a true
measure of service quality. Other dimensions such as tangibles, reliability,
responsiveness, empathy and waiting time also scored within the desired measure of
α, meaning they can be used in the context of grocery stores. However, it was
expected to find some low reliability especially because we are dealing with a lot of
items (Bryman & Bell, 2011). The dimension of location was found to have low
internal reliability in both expectations and perceptions and so the α adopted was each
time when an item was deleted from the calculations. It seems that items LC1 and
LC2 were a bit confusing and should probably have a different wording or even a
different statement to represent the location dimension in its entirety or at least as we
define it in chapter 2.6.1.
47

Bachelor Thesis 15hp (2FE07E; 2FE10E) School of Business and Economics
On to table 6, it can be easily realized that expectations of the respondents exceeded
their perceptions. According to Parasuraman et al. (1988), it is usual for expectations
to exceed perceptions and that this means that companies should keep improving their
performance. However, there is not much difference between the scores but generally
expectation scores were higher than perception scores.
The largest gaps scores were reported in the dimension of waiting time and secondly
in the dimension of products. That proves that consumers think of the time spent in
the store as very valuable and the result they get in the stores is not the most
satisfying. As Na et al. (1999) state, satisfaction comes as a consequence of strong
associations, in our case of waiting time with service quality. Also, products
dimension seems to be very important for them, especially in terms of freshness and
good condition, which means that stores should pay a lot of attention to the quality
and the variety of products they offer. This comes in line with the technical dimension
of service quality Grönroos (1984) suggested. Altogether, all the dimensions had at
least one item which had a rather high gap score, meaning consumers expect more; in
reliability, counting on the employees, in responsiveness, handling of customer
complaints and in assurance, politeness of employees for instance.
The smallest gap was found in the assurance item AS2 (safety in transactions with the
store). Expectations as well as perceptions in this item were high, which means that
consumers feel safe in their dealings with the grocery stores and really get what they
ask for. The location item LC3 (offer of convenient parking) noted also a small gap
but in this case, expectations as a mean were not that high and neither was the mean
of perceptions. This can be interpreted in terms that consumers do not hold this offer
as the most important service but they would still prefer to benefit from it, as part of
the overall service experience.
In the whole, perceptions did not meet consumers’ expectations, except for two items.
Responsiveness item RN2 (okay if employees are too busy to respond to respond to
customers) and location item LC1 (stores located in the outskirts of a town/city) noted
negative scores, meaning that perceptions in this case were greater than expectations.
As Fen & Lian (2005) suggest, higher perceptions indicate higher satisfaction since
48
Bachelor Thesis 15hp (2FE07E; 2FE10E) School of Business and Economics
service quality and satisfaction are positively related. Consumers seem not to have
many expectations on these two matters but they acknowledge their existence as part
of the service.
To test hypothesis H1 (below) and from the above:
H1: The smaller the gap between expectations and perceptions, the higher customer
satisfaction is
it can be inferred that hypothesis H1 is true. Positive gaps scores in this study signify
that the actual experienced service consumers get is lower than their expectations,
therefore lower customer satisfaction. As Douglas & Connor (2003) state, it is very
important to understand and measure customers’ expectations, to identify these gaps
in delivering service with quality that could ensure satisfaction. These gaps can occur
because of the poor interaction between customer and service provider (in this case
grocery store) and because consumers are becoming more demanding and do not
tolerate shortfalls in the quality of services (Ibid.). Customer satisfaction is higher
only when these gaps are small or when the perceptions exceed expectations.
Lastly, to test hypotheses H2, H3 and H4 (see chapter 2.7), concerning the three
dimensions we proposed, a regression analysis helped in showing if they were
supported or not. It seems from the empirical data that all the hypotheses are
supported, since the levels of significance in each case report the highest levels of p-
values. In particular, the dimensions of products and waiting time show a better
overall correlation to the concept of customer satisfaction than location but all have a
rather good contribution to explaining this dependent variable. It can be inferred, thus,
that all the hypotheses are supported in a good level.
49

Bachelor Thesis 15hp (2FE07E; 2FE10E) School of Business and Economics
5. Conclusions In this chapter, we answer our research question by having a general discussion
based on all the literature and findings. Implications are also presented as well as
the limitations of this research. The chapter ends with suggestions for future
research.
5.1 Discussion After going through a literature review and an analysis of the empirical data we
assembled, we can at last proceed in answering our research question:
Are consumers satisfied with service quality offered by grocery stores?
As the literature suggests, customer satisfaction depends on the difference between
expectations and perceptions. The findings indicate that expectations of the
respondents exceeded their perceptions. The overall mean computed in expectations
for all the dimensions, showed that consumers’ expectations from grocery stores are
quite high. The overall mean of perceptions, on the other hand, was low, giving in
turn the gap scores when compared to expectations. In particular, the largest gap
scores were reported in two of the three dimensions added in the SERVQUAL model.
Both waiting time (time spent in the grocery store) and products (quality and variety)
scored high in expectations whereas low in perceptions. This proves that consumers
give high importance to these dimensions. This does not imply that the rest six
dimensions do not report big gaps. On the contrary, these dimensions also report quite
big gaps, which indicate a lack of service quality.
All the above prove hypothesis H1 which entails that the smaller the gap between
expectations and perceptions, the higher customer satisfaction is. Customer
satisfaction can only be high when these gaps are very small or when the perceptions
exceed expectations, which does not happen in our case. In addition, hypotheses H2,
H3 and H4 were also supported by the tests we ran, giving even more proof that
service quality of grocery stores depends on these dimensions as well as the
dimensions of the original SERVQUAL model. We can therefore conclude that the
service quality perceived from grocery stores is not adequate enough, consumers are
not completely satisfied with what they experience and that there is still room for
more improvement.
50
Bachelor Thesis 15hp (2FE07E; 2FE10E) School of Business and Economics
5.2 Implications
The analysis of the empirical results showed that the adapted SERVQUAL model can
be used in the context of grocery stores. The additional dimensions proposed, show a
strong correlation to customer satisfaction, with products and waiting time being of
high importance to overall service quality, along with all the original dimensions of
the model. For this reason, we believe that that our adapted SERVQUAL model can
truly contribute to the field of grocery retailing and add more value as a whole in the
marketing literature.
Also, we believe that our adapted model can be of great use to managers in
understanding how customers assess service quality in the grocery store context and
guide them to enhance customers’ service experiences. In looking at the service
quality gaps, managers can diagnose where performance improvement is needed. By
combining the largest gaps with dimensions which report high expectations, a
manager can see which aspect of service performance should be improved. Equally, if
perceptions are higher, then this means that managers use this feature of the service in
a good way.
All in all, grocery stores should focus on all the dimensions of service quality. Efforts
to improve these dimensions can improve performance, which in turn will lead to
higher perceived service quality and customer satisfaction. Managers should,
therefore, regularly measure service quality to acknowledge customers’ satisfaction
standards and hence make necessary adjustments in performance.
5.3 Limitations There are some limitations in this study as in any research project. The results of this
study cannot be generalised in all studies of service quality because the proposed
dimensions have to do with the grocery store context. Also, the sample size consists
of mostly young respondents, who are mostly university students as well. Another
limitation is that different store sizes may yield different results because consumers
may expect more from bigger grocery stores that they do with smaller ones. Cultural
difference is also a limitation to this study because other countries have different
standards of service quality assessment. This means that this study may only be
51

Bachelor Thesis 15hp (2FE07E; 2FE10E) School of Business and Economics
generalized to Sweden or other Scandinavian countries, which seem more close to
these standards. Despite the limitations mentioned above, carrying these kinds of
studies is always important in order to improve the overall service quality perceived
by customers.
5.4 Suggestions for future research We believe that our adapted SERVQUAL model will be useful for future research
because of the three additional dimensions it incorporates, which proved to be adding
value to the service quality concept of grocery stores. A similar study can be carried
out with a larger sample size so that results can be generalised in a larger population.
We also think further studies can be carried out, with similar sample size, in other
areas of Sweden. Further suggestion includes using different statements-items in the
three dimensions proposed in this study to test the reliability of the dimensions.
Furthermore, removing and adding another dimension could be an option, to test if a
new aspect applies on grocery stores. In the whole, we believe that further research
could be conducted in order to enhance the understanding of these concepts, since
they can be really important in every service industry.
52

Bachelor Thesis 15hp (2FE07E; 2FE10E) School of Business and Economics
6. Reference list Anderson, E. W., Fornell, C. & Rust, R. T. (1997), Customer satisfaction, productivity, and profitability: Differences between goods and services, Marketing Science, Vol. 16, No. 2, pp. 129-145 Anselmsson, J. (2006), Customer perceived service quality in the supermarket and the discount store: Examination of a service quality measurement scale in a Swedish context, Lund Institute of Economic Research, Working Paper Series Antony, J., Antony, F. J. & Ghosh, S. (2004), Evaluating service quality in a UK hotel chain: A case study, International Journal of Contemporary Hospitality Management, Vol. 16, No. 6, pp. 380-384 Babakus, E. & Boller, G. W. (1992), An empirical assessment of the SERVQUAL scale, Journal of Business Research, Vol. 24, No. 3, pp. 253-268 Balachandran, A., Voelker, G. M. & Bahl, P. (2003), Wireless Hotspots: Current Challenges and Future Directions, Mobile Networks and Applications, Vol. 10, pp. 265–274 Berry, L. L. (1986), Retail businesses are services businesses, Journal of Retailing, Vol. 62, No. 1, pp. 3-7 Birtwistle, G., Clarke, I. & Freathy, P. (1999), Store image in the UK fashion sector: Consumer versus retailer perceptions, The International Review of Retail, Distribution and Consumer Research, Vol. 9, No. 1, pp. 1-16 Bitner, M. J. (1995), Building service relationships: It’s all about promises, Journal of Academic Marketing Science, Vol. 23, No. 4, pp. 246-251 Bitner, M. J. & Hubbert, A. R. (1993), Encounter satisfaction vs overall satisfaction vs quality the customer’s voice, in: Service quality new directions in theory and practice, Rust, R. T. & Oliver, R. L. (Eds.), Sage Publications, Newbury Park, USA, pp. 71-93 Blumberg, B., Cooper, D. R. & Schindler, P. S. (2008), Business research methods, (2nd ed.), McGrew-Hill Higher Education, New York, USA Bolton, R. N. & Drew, J. H. (1991), “A longitudinal analysis of the impact of service changes on customer attitudes, Journal of Marketing, Vol. 55, No. 1, pp. 1-9 Brady, M. K. & Cronin, J. J. (2001), Some new thoughts on conceptualizing perceived service quality: A hierarchical approach, Journal of Marketing, Vol. 65, No. 3, pp. 34-49 Bryman, A. & Bell, E. (2007), Business research methods, (2nd ed.), Oxford University Press, New York, USA
53

Bachelor Thesis 15hp (2FE07E; 2FE10E) School of Business and Economics
Bryman, A. & Bell, E. (2011), Business research methods, (3rd ed.), Oxford University Press, New York, USA Buttle, F. (1996), SERVQUAL: Review, critique, research agenda, European Journal of Marketing, Vol. 30, No. 1, p. 8-32 Buzzell, R. D. & Gale, B. T. (1987), The PIMS principles: Linking strategy to performance, Free Press, New York, USA Carman, J. M. (1990), Consumer perceptions of service quality: An assessment of the SERVQUAL dimensions, Journal of Retailing, Vol. 66, No. 1, pp. 33-35 Cronin, J. J. & Taylor, S. A. (1992), Measuring service quality: A re-examination and extension, The Journal of Marketing, Vol. 56, No. 3, pp. 55-68 Cronin, J. J. & Taylor, S. A. (1994), SERVPERF versus SERVQUAL: Reconciling performance-based and perceptions-minus-expectations measurement of service quality, Journal of Marketing, Vol. 58, No. 1, pp. 125-131 Czepiel, J. A. (1990), Service encounters and service relationships: Implications for Research, Journal of Business Research, Vol. 20, No. 1, pp. 13-21 Dabholkar, P. A. (1995), A contingency framework for predicting causality between customer satisfaction and service quality, Vol. 22, No. 1, pp.101-108 Dabholkar, P. A., Sheperd, C. D. & Thorpe, D. I. (2000), A comprehensive framework for service quality: An investigation of critical conceptual and measurement issue through a longitudinal study, Journal of Retailing, Vol. 76, No. 2, pp. 139-173 Dabholkar, P. A., Thorpe, D. I. & Rentz, J. O. (1996), A measure of service quality for retail stores: Scale development and validation, Journal of the Academy of Marketing Science, Vol. 24, No. 1, pp. 3-16 Das, A., Kumar, V. & Saha, G. C. (2010), Retail service quality in context of CIS countries, International Journal of Quality & Reliability Management, Vol. 27, No. 6, pp. 658-683 Day, R. L. (1984), Modelling choices among alternative responses to dissatisfaction, in: Advances in Consumer Research, Vol. 11, Kinnear, T. C. (Eds.), Ann Arbor, MI: Association for Consumer Research, Vol. 22, pp. 469-499 Donabedian, A. (1980), Explorations in quality assessment and monitoring, Vol. 1, The definition of quality and approaches to its assessment, Michigan: Health Administration Press, Ann Arbor, USA Douglas, L. & Connor, R. (2003), Attitudes to service quality: The expectation gap, Nutrition & Food Science, Vol. 33, No. 4, pp. 165-172
54

Bachelor Thesis 15hp (2FE07E; 2FE10E) School of Business and Economics
Ekinci, Y. (2003), An investigation of the determinants of customer satisfaction, Tourism Analysis, Vol. 8, No. 2, pp. 193-196 Elg, U. & Johansson, U. (1992), The interplay between structure and behaviour of the retail chain: An analysis from an inter-organizational network perspective, Lund University Press, Lund, Sweden Fen, Y. S. & Lian, K. M. (2005), Service quality and customer satisfaction: Antecedents of customer’s re-patronage intentions, Sunway Academic Journal, Vol. 4, No. 1, p. 59-73 Field, A. (2009), Discovering statistics using SPSS, (3rd ed.), Sage Publications, London, UK Fornell, C. (1992), A national customer satisfaction barometer: The Swedish experience, Journal of Marketing, Vol. 56, No. 1, pp. 6-21 Freeman, K. D. & Dart, J. (1993), Measuring the perceived quality of professional business services, Journal of Professional Services Marketing, Vol. 9, No. 1, pp. 27-47 Geetika, N. T. & Ashwini, U. (2008), Internet banking in India: Issues and prospects, Journal of Bank Management, Vol. 7, No. 2, pp. 47-61 Ghobadian, A., Speller, S. & Jones, M. (1994), Service quality: Concepts and models, International Journal of Quality and Reliability Management, Vol. 11, No. 9, pp. 43-66 Grönroos, C. (1984), A service quality model and its marketing implications, European Journal of Marketing, Vol. 18, No. 4, pp. 36-44 Hackl, P. & Westlund, A. H. (2000), On structural equation modelling for customer satisfaction measurement, Total Quality Management, Vol.11, No. 4/5/6, pp. 820-825 Hedvall, M. B. & Paltschik, M. (1989), An investigation in and generation of service quality concepts, in: Marketing thought and practice in the 1990s, Eds. Avlonitis, G.J. et al., European Journal of Marketing Academy, Athens, Greece Howcroft, J. B. (1991), Customer satisfaction in retail banking, Service Industries Journal, Vol. 11, No. 1, pp. 11-17 Hunt, H. K. (1977), Conceptualization and measurement of consumer satisfaction and dissatisfaction, Marketing Science Institute, Cambridge, MA Jones, M. A. & Suh, J. (2000), Transaction-specific satisfaction and overall satisfaction: An empirical analysis, Journal of Services Marketing, Vol. 14, No. 2, pp. 147-159
55

Bachelor Thesis 15hp (2FE07E; 2FE10E) School of Business and Economics
Kettinger, W. J. & Lee, C. C. (1994), Perceived service quality and user satisfaction with the information services function, Decision Sciences, Vol. 25, No. 5/6, pp. 737-766 Lam, S. K. (1997), SERVQUAL: A tool for measuring patients’ opinions of hospital service quality in Hong Kong, Total Quality Management, Vol. 8, No. 4, pp. 145-152 LeCompte, M. D. & Goetz, J. P. (1982), Problems of reliability and validity in ethnographic research, Review of Educational Research, Vol. 52, No. 1, pp. 31-60 Lehtinen, J. R. & Lehtinen, O. (1982), Service quality: A study of quality dimensions, Unpublished working paper, Service Management Institute: Helsinki Levesque, T. & McDougall, G. H. G. (1996), Determinants of customer satisfaction in retail banking, International Journal of Bank Marketing, Vol. 14, No. 7, pp. 12-20 Lewis, B. R. & Mitchell, V. W. (1990), Defining and measuring the quality of customer service, Marketing Intelligence & Planning, Vol. 8, No. 6, pp. 11-17 Lovelock, C. & Wirtz, J. (2007), Services marketing: People, technology, strategy, (6th ed.), Pearson Education International Prentice Hall, Upper Saddle River, USA Malhotra, N. K. (2010), Marketing research: An applied orientation, (6th ed.), Pearson Education, Upper Saddle River, USA Mazursky, D. & Jacoby, J. (1986), Exploring the development of store images, Journal of Retailing, Vol. 62, No. 2, pp. 145-165 McGoldrick, P. J. (2002), Retail Marketing, (2nd ed.), McGraw Hill Higher Education, Berkshire, UK Mehta, S. C., Lalwani, A. K. & Han, S. L. (2000), Service quality in retailing: Relative efficiency of alternative measurement scales for different product service environments, International Journal of Retail and Distribution Management, Vol. 28, No. 2, pp. 61-72 Miles, M. B. & Huberman, A. M. (1994), Qualitative data analysis: An expanded sourcebook, (2nd ed.), Sage Publications, California, USA Na, W. B., Marshall, R. & Keller, L. K. (1999), Measuring brand power: Validating a model for optimizing brand equity, Journal of Product & Brand Management, Vol. 8 No. 3, pp. 170-84 Oliver, R. L. (1993), A conceptual model of service quality and service satisfaction: Compatible goals, different concepts, Advances in Services Marketing and Management, Vol. 2, pp. 65-85 Oliver, R. L. (1977), Effect of expectation and disconfirmation on post-expense product evaluations: An alternative interpretation, Journal of Applied Psychology, Vol. 62, No. 4, pp. 480-486
56

Bachelor Thesis 15hp (2FE07E; 2FE10E) School of Business and Economics
Parasuraman, A., Zeithaml, V. A. & Berry, L. L. (1985), A conceptual model of service quality and its implications for future research of service, Journal of Marketing, Vol. 49, No. 4, pp. 41-50 Parasuraman, A., Zeithaml, V. A. & Berry, L. L. (1988), SERVQUAL: A multiple item scale for measuring consumer perceptions of service quality, Journal of Retailing, Vol. 64, No. 1, pp. 12-40 Parasuraman, A., Zeithaml, V. A. & Berry, L. L. (1993), More on improving service quality measurement, Journal of Retailing, Vol. 69, No. 1, pp. 140-147 Parasuraman, A., Zeithaml, V. A. & Berry, L. L. (1994), Alternating scales for measuring service quality: A comparative assessment based on psychometric and diagnostic criteria, Journal of Retailing, Vol. 70, No. 3, pp. 201-230 Pariseau, S. E. & McDaniel, J. R. (1997), Assessing service quality in Schools of Business, International Journal of Quality and Reliability Management, Vol. 14, No. 3, pp. 204-218 Philip, G. & Hazlett, S. A. (1997), The measurement of service quality: A new P-C-P attributes model, International Journal of Quality & Reliability Management, Vol. 14, No. 3, pp. 260-286 Presbury, R., Fitzgerald, A. & Chapman, R. (2005), Impediments to improvements in service quality in luxury hotels, Management service quality, Vol. 15, No. 4, pp. 357-373 Raddon, G. H. (1987), Quality service: A low-cost profit strategy, Bank Marketing, pp. 10-20 Reichheld, F. F. (1996), The loyalty effect, Harvard Business School Press, Boston, Massachusetts, USA Reichheld, F. F & Sasser, W. R. (1990), Zero defections quality comes to service, Harvard Business Review, Vol. 68, No. 5, pp. 105-112 Rust, R. T. & Oliver, R. L. (1994), Service quality: New directions in theory and practice, SAGE Publications, Thousand Oaks, USA Sachdev, S. B. & Verman, H. V. (2004), Relative importance of service quality dimensions: A multisectoral study, Journal of Services Research, Vol. 4, No. 1, pp. 93-116 Sangeetha, J. & Mahalingam, S. (2011), Service quality models in banking: A review, International Journal of Islamic and Middle Eastern Finance and Management, Vol. 4, No. 1, pp. 83-103 Scheuing, E. E. (1999), Creating customers for life, Productivity Press, Portland, Oregon, USA
57

Bachelor Thesis 15hp (2FE07E; 2FE10E) School of Business and Economics
Schneider, B. & White, S. (2004), Service quality – Research perspectives, SAGE Publications, Thousand Oaks, USA Seth, N. & Deshmukh, S. G. & Vrat, P. (2005), Service quality models: A review, International Journal of Quality & Reliability Management, Vol. 22, No. 9, pp. 913-949 Shahin, A. & Abolhasani, Z. (2008), Internal service quality gaps and analysis of the relationship with employee job satisfaction: A case study in the Iran insurance CO of Isfahan, PhD thesis, Isfahan: University of Isfahan Shemwell, D. J., Yavas, U. & Bilgin, Z. (1998), Customer-service provider relationships: An empirical test of a model of service quality, satisfaction and relationship-oriented outcome, International Journal of Service Industry Management, Vol. 9, No. 2, pp. 155-168 Spreng, R. A. & Mackoy, R. D. (1996), An empirical examination of a model of perceived service quality and satisfaction, Journal of Retailing, Vol. 72, No. 2, pp. 201-214 Sujan, M. (1985), Consumer knowledge: Effects on evaluation strategies mediating consumer judgments, Journal of Consumer Research, Vol. 12, No. 1, pp. 31-46 Teas, R. K. (1994), Expectations as a comparison standard in measuring service quality: An assessment of a reassessment, Journal of Marketing, Vol. 58, No. 1, pp. 132-139 Tribe, J. & Snaith, T. (1988), From SERVQUAL to HOLSAT: Holiday satisfaction in Varadero Cuba, Tourism Management, Vol. 19, No. 1, pp. 25-34 Uusitalo, O. (2001), Consumer perceptions of grocery retail formats and brands, International Journal of Retail & Distribution Management, Vol. 29, No. 5, pp. 214-225 Wicks, A. M. & Roethlein, C. J. (2009), A satisfaction-based definition of quality, Journal of Business & Economic Studies, Vol. 15, No. 1, pp. 82-97 Wilkie, W. L. (1994), Consumer Behavior, (3rd ed.), John Wiley & Sons, New York, USA Wisniewski, M. (2001), Using SERVQUAL to assess customer satisfaction with public sector services, Managing Service Quality, Vol. 11, No. 6, pp. 380-388 Yi, Y. (1990), A critical review of consumer satisfaction, in: Zeithaml, V. (Eds.), Review of Marketing, American Marketing Association, Chicago, IL, pp. 68-123 Yin, R. K. (2009), Case study research: Design and methods, (4th ed.), SAGE Publications, California, USA
58

Bachelor Thesis 15hp (2FE07E; 2FE10E) School of Business and Economics
Zeithaml, V. & Bitner, M. (2003), Service marketing: Integrating customer focus across the firm, (3rd ed.), McGraw-Hill Irwin, New York, USA Zeithaml, V. A., Bitner, M. J. & Gremler, D. D. (2006), Services marketing: integrating customer focus across the firm, (4th ed.), McGraw-Hill Irwin, Boston, Massachusetts, USA
Internet sources
Växjö Kommun (2012), Statistics, webpage: http://vaxjo.se/Kommun--
politik/Statistik-undersokningar-och-kvalitet/Statistik/, accessed 2012-04-22, 10.40
59

Bachelor Thesis 15hp (2FE07E; 2FE10E) School of Business and Economics
Appendix - Questionnaire
We are Bachelor students in Marketing from Linnaeus University and we are carrying out a study on how consumers perceive service quality in grocery stores in Växjö. We would be very glad if you could help us by answering the following questionnaire. You should answer each statement as follows: Strongly disagree (SD) Strongly agree (SA) 1 2 3 4 5 6 7 Circle your choice of answer. The questionnaire is divided in two sections; expectations, the ideal service for you (left column) and perceptions, your experience of the services you actually receive (right column). Expectations: The left column deals with your opinion of grocery stores. Please, show the extent to which you think grocery stores “should” possess the following features. We are interested essentially in knowing your expectations, the ideal service you would like to get from grocery stores in Växjö. Perceptions: The right column deals with your perception of the services that you actually experience in grocery stores. Please, show the extent to which the statements reflect your experience of service in grocery stores in Växjö. It will be easier to answer this section if you picture your experience from the grocery store you visit most often.
Scores for expectations Statements
Scores for perceptions
SD SA SD SA1 2 3 4 5 6 7 1. The store has modern-looking equipment 1 2 3 4 5 6 7
1 2 3 4 5 6 7 2. The store has clean and convenient physical facilities 1 2 3 4 5 6 7
1 2 3 4 5 6 7 3. The physical facilities of the store are visually appealing 1 2 3 4 5 6 7
1 2 3 4 5 6 7 4. The store has merchandise available when the customers want it 1 2 3 4 5 6 7
1 2 3 4 5 6 7 5. The store provides its services at the time it promises to do so 1 2 3 4 5 6 7
1 2 3 4 5 6 7 6. Customers can count on the employees taking actions to address their needs 1 2 3 4 5 6 7
1 2 3 4 5 6 7 7. Employees of the store are able to handle customer complaints directly and immediately 1 2 3 4 5 6 7
1 2 3 4 5 6 7 8. It is okay if the employees are too busy to respond to customer requests promptly 1 2 3 4 5 6 7
1 2 3 4 5 6 7 9. Employees of the store respond quickly to customer needs 1 2 3 4 5 6 7
60

Bachelor Thesis 15hp (2FE07E; 2FE10E) School of Business and Economics
1 2 3 4 5 6 7 10. Customers are able to trust employees of the store 1 2 3 4 5 6 7
1 2 3 4 5 6 7 11. Customers feel safe in their transactions with the store 1 2 3 4 5 6 7
1 2 3 4 5 6 7 12. Employees in the store are consistently polite with customers 1 2 3 4 5 6 7
1 2 3 4 5 6 7 13. The behaviour of the employees indicates that they understand customer needs 1 2 3 4 5 6 7
1 2 3 4 5 6 7 14. It is realistic to expect employees to know what the needs of their customers are 1 2 3 4 5 6 7
1 2 3 4 5 6 7 15. Employees of the store give customers personal attention 1 2 3 4 5 6 7
1 2 3 4 5 6 7 16. The groceries (e.g. vegetables, fruit, meat, milk, etc) are always fresh and not expired 1 2 3 4 5 6 7
1 2 3 4 5 6 7 17. The products are always in a good condition (not broken, etc) 1 2 3 4 5 6 7
1 2 3 4 5 6 7
18. The store offers the variations of a product-brand the customer needs (e.g. all flavours, sizes, etc) 1 2 3 4 5 6 7
1 2 3 4 5 6 7 19. The store is located in the outskirts of the town/city 1 2 3 4 5 6 7
1 2 3 4 5 6 7 20. The store is located in a central area 1 2 3 4 5 6 7
1 2 3 4 5 6 7 21. The store provides plenty of convenient parking for customers 1 2 3 4 5 6 7
1 2 3 4 5 6 7 22. The store layout makes it easy for customers to find what they need 1 2 3 4 5 6 7
1 2 3 4 5 6 7
23. The store understands that waiting time is important to the customer (waiting time: the whole time spent in the store, including the time waiting for payment) 1 2 3 4 5 6 7
1 2 3 4 5 6 7 24. The store tries to keep the customer's waiting time to a minimum 1 2 3 4 5 6 7
25. Are you satisfied with the store you usually visit? 1 2 3 4 5 6 7 Demographics (choose one option) 26. Gender Male Female 27. Age <20 20-30 31-40 41-50 51-60 61-70 >70 28. Level of education Secondary school High school University 29. Monthly expenditure <500Kr 500 – 1000Kr 1001 – 2000Kr >2000Kr
Thank you for your time!
61
Bachelor Thesis 15hp (2FE07E; 2FE10E) School of Business and Economics
62