A Review of Cogeneration in Alberta
21
1 Analysis and Results prepared for: Oil Sands Community Alliance (OSCA) Unit 617, 8600 Franklin Avenue Fort McMurray, Alberta T9H 4G8 A Review of Cogeneration in Alberta Issued: September 29, 2015
Transcript of A Review of Cogeneration in Alberta

1
Analysis and Results prepared for: Oil Sands Community Alliance (OSCA)
Unit 617, 8600 Franklin Avenue
Fort McMurray, Alberta
T9H 4G8
A Review of Cogeneration
in Alberta
Issued: September 29, 2015
A Review of Cogeneration in Alberta (September 2015) 1
Disclaimer
The information and data provided in this report has been obtained or prepared from sources that are believed
to be reliable and accurate but has not necessarily been independently verified. EDC Associates Ltd. makes no
representations or warranties as to the accuracy or completeness of such information and data nor the conclusions that have been derived from its use. Further, the data in this report is generally of a forecast
nature and is based on what are believed to be sound and reasonable methodologies and assumptions, however cannot be warranted or guaranteed with respect to accuracy. Therefore, any use of the information
by the reader or other recipient shall be at the sole risk and responsibility of such reader or recipient.
The information provided in this report and the facts upon which the information is based as well as the
information itself may change at any time without notice subject to market conditions and the assumptions made thereto. EDC Associates Ltd. is under no obligation to update the information or to provide more
complete or accurate information when it becomes available.
EDC Associates Ltd. expressly disclaims and takes no responsibility and shall not be liable for any financial or
economic decisions or market positions taken by any person based in any way on information presented in this report, for any interpretation or misunderstanding of any such information on the part of any person or for any
losses, costs or other damages whatsoever and howsoever caused in connection with any use of such
information, including all losses, costs or other damages such as consequential or indirect losses, loss of revenue, loss of expected profit or loss of income, whether or not as a result of any negligent act or omission
by EDC Associates Ltd.
Copyright © EDC Associates Ltd., 2015
This document was prepared under contract by EDC Associates Ltd. and may not be copied or reproduced, translated to electronic media in any form or manner whatsoever, in whole or in part, nor distributed to any
third party without the prior written consent of EDC Associates Ltd.
EDC Associates Ltd.
Suite #310, 505-8th Avenue SW Calgary, AB T2P 1G2
www.EDCAssociates.com
© EDC Associates Ltd.
A Review of Cogeneration in Alberta (September 2015)
2
Table of Contents
Executive Summary & Conclusions ......................................................................................... 3
Introduction to Cogeneration ................................................................................................. 4
Deployment of Cogeneration in Alberta ................................................................................. 6
Benefits of Cogeneration ....................................................................................................... 11
Risks & Barriers to Cogeneration .......................................................................................... 16
Qualifications ......................................................................................................................... 18
Appendix 1 – CV’s of Contributing Personnel ....................................................................... 20
List of Figures
Figure 1 – Cogeneration Configuration ................................................................................................... 4
Figure 2 - Source of 2014 Steam Production for In-Situ Oil Sands Projects ..................................... 6
Figure 3 - Ordered List of Current Alberta Cogeneration Plants ......................................................... 7
Figure 4 - Current Alberta Cogeneration Market Share by Industry ................................................... 8
Figure 5 - Progression of OSCA Expected Cogeneration Capacity (MW) ......................................... 9
Figure 6 – Cogeneration Potential in Balancing to Electricity Needs or Steam Needs ................. 10
Figure 7 - Comparison of Typical Oil Sands Cogen & Boiler Costs ................................................. 11
Figure 8 - Comparison of Range of Emission Intensities by Fuel Type ........................................... 12
Figure 9 - Alberta 2014 Capacity Factors by Fuel Type ...................................................................... 14
Figure 10 – Generation Comparative Levelized Costs........................................................................ 15
© EDC Associates Ltd.
A Review of Cogeneration in Alberta (September 2015)
3
Executive Summary & Conclusions
Cogeneration currently has the lowest levelized cost for new generation, given the re-use of the waste heat to produce useful by-product steam. The fuel, natural gas, is produced locally, in abundance at low cost with a corresponding royalty benefit to the crown. The benefits of cogeneration can be segmented into four categories:
1) Improved efficiency and reduced emission intensity for generation of steam and electricity.
2) Improved life-cycle economics (under appropriate market conditions) to produce steam and electricity.
3) Increased reliability for oil sands project (own generation capacity)
4) Potential additional margin from the sale of low-cost excess power to the Alberta electricity grid.
In addition to the benefits which accrue to cogeneration owners, cogeneration also provides an additional and diverse source of electricity capacity to the overall Alberta grid.
Despite its many benefits, only an estimated 16% of the total oil sands steam requirements is being produced through cogeneration. Developers of cogeneration face a number of challenges that have impeded it from reaching its full potential. Some are related to market fundamentals, like the uncertainty of future prices of natural gas and electricity. Others arise from individual development policies at the corporate level, including access to the incremental capital that cogeneration requires versus steam boilers. Finally, government policy makers can play a decisive role in enabling and encouraging fulsome development of cogeneration, such as providing timely clarity on future greenhouse gas emissions compliance obligations, reducing barriers and development timelines for the connection and approval process, and ensuring adequate transmission capacity is developed on time for industry requirements.
The perceived and real risks and issues outlined above have overshadowed the significant economic benefits of cogeneration such that Alberta may have foregone efficiency and environmental benefits.

© EDC Associates Ltd.
A Review of Cogeneration in Alberta (September 2015)
4
Introduction to Cogeneration
In the early 1990’s, Alberta began to deregulate its once vertically integrated cost-of-service regulated electric utility sector, creating an environment more conducive to industrial customers building behind the fence generation, largely in the form of cogeneration.
Cogeneration (cogen) technology is well established and has been deployed in the industrial sector of North America in its current forms for over 30 years. Efficiency gains in the technology have greatly improved with the continued advancement in aero-derivative turbine technology. Capital costs and delivery times have similarly improved with “packaged” systems.
Historically, the Alberta industrial sector has consumed approximately 65% of the electricity produced in the province, with much of the incremental growth in electricity demand coming from the oil sands sector. Oil sands projects (especially SAGD) have a significant demand for process steam, mostly used to produce high viscosity bitumen out of the ground. Even more so in these low oil-price times, bitumen producers are motivated to find the most reliable and economic source for both electricity and steam, creating the perfect environment and host for cogen.
In a cogen, natural gas is burned directly at the blades of a gas combustion turbine, which spins a generator to make electricity. The extremely hot exhaust gases are passed through a Heat Recovery Steam Generator (HRSG, pronounced “her-sig”), which converts the waste heat to steam. Most facilities also employ additional duct firing in the HRSG to generate additional process steam at optimal efficiencies. The steam is then put to work in its host’s process, displacing steam otherwise produced by a traditional standalone steam boiler. Simultaneously creating electrical energy and steam energy is much more efficient (90%) and economic over the life-cycle than making the two separately (54% and 85% efficiency respectively).
Figure 1 – Cogeneration Configuration
The level of cogeneration investment can be described at three general levels:
1. No cogeneration. Buy all electricity from the grid and produce steam through steam boilers. Many small oil sands plants use no cogeneration, since they have less opportunity to capture certain economies of scale for such things as the connection and fixed operating costs of running the generator.
2. Match the size of cogeneration to the expected electricity use and complement the remaining steam demand with traditional steam boilers.
3. Match the size of cogeneration to the level of on-site steam required and sell excess electricity to the grid. When a cogeneration project is sized to meet the thermal load requirements of the heat-
Heat Recovery
Steam
Generator
Waste HeatHot
Exhaust
Gas
High Pressure
Steam to another
Process
Combustion
Gas Turbine
Gen
erat
or
Gas
Extra Duct
Firing Gas
© EDC Associates Ltd.
A Review of Cogeneration in Alberta (September 2015)
5
intensive oil sands extraction process, the facility produces electricity greatly in excess of its own requirements (e.g., Shell Carmon Creek, in its fully developed 3-unit configuration (600 MW), may produce three times as much electricity as it will consume behind the fence. MEG Energy Christina Lake produces up to 5 times as much electricity as it uses on site).
Each site owner uses its own set of criteria to set the level of cogeneration capacity development. Each company has different access to expertise and experience in evaluating, constructing, operating, selling excess electricity and integrating cogens into their core business, so have a greater or lesser degree of corporate comfort. Each company has different access to and strategy for allocating capital, different risk tolerance and natural hedging opportunities, different levels of understanding of the fundamentals of electricity and even different approaches to environmental impact compliance.

© EDC Associates Ltd.
A Review of Cogeneration in Alberta (September 2015)
6
Deployment of Cogeneration in Alberta
In Alberta, the cogeneration fleet has grown rapidly from the turn of the millennium, as both Suncor and Syncrude significantly expanded production of their oil sands mining operations and both installed cogeneration in excess of their own needs. Cogen development has accelerated with the advent and deployment of thermal based in situ bitumen extraction methods (e.g., SAGD).
Despite the sizeable amount of cogeneration application from the oil sands sector, the potential has not been realized. Figure 2 shows the amount of total steam used by in situ oil sands projects in 2014
1. By comparison,
EDC has estimated amount of steam produced by cogeneration (in blue) at only 16.3% of the total steam needs.
Figure 2 - Source of 2014 Steam Production for In-Situ Oil Sands Projects
In the early years, cogen capacity would be sized to produce most of the steam required by the host, resulting in a significant excess of electricity that had to be sold at the prevailing market pool price. Because the host needed the steam and did not provision for adequate backup steam boilers, the cogen would generally have to run even if it was losing money on the electricity. In 2005, natural gas prices rose significantly at the same time that a new base load coal-fired power plant commissioned (Genesee 3), putting severe downward pressure on electricity prices and driving the spark spread (the gross operating margin per unit of electricity, net of fuel costs) negative. However, in recent years, cogen developers have been more sensitive to the heat rate (the amount of
1 ST-53 2014 Alberta In Situ Oil Sands Summary produced by (AER) Alberta Energy Regulator
0
100,000
200,000
300,000
400,000
500,000
600,000
Ste
am
Pro
du
cti
on
(b
bl/
day)
Steam Production Source for In-Situ Oil Sands Projects
Steam from Boilers bbls/d
Steam from Cogens, bbls/d
Percentage of In-Situ Steam Needs Met from Cogen: 16.3%

© EDC Associates Ltd.
A Review of Cogeneration in Alberta (September 2015)
7
fuel used to one unit of electricity) risk and have been sizing their cogens to match their internal electricity consumption rather than their steam needs. Some existing facilities (e.g., Joffre) have subsequently added stand-alone traditional boilers to make their cogens more dispatchable (to deal with these market circumstances).
Figure 3 - Ordered List of Current Alberta Cogeneration Plants
As seen in Figure 3, the Alberta cogeneration fleet, with 32 identified owners/locations/facilities, has a current capacity of over 4,500 MW, with an excess supply capacity of 1,900 MW sent to the grid (“net-to-grid”). Suncor (901 MW) and Syncrude (510 MW) are still the largest cogeneration facility locations, followed by Joffre (474 MW) and DOW (326 MW), then a number of medium-sized other oil sands, upgraders, refineries and forestry sector cogens, plus some smaller cogens providing institutional combined heat and power (e.g., UoA, UoC and SAIT).
0
100
200
300
400
500
600
700
800
900
1,000
Nam
ep
late
Pla
nt
Cap
acit
y (
MW
) o
r A
ve
rag
e E
nerg
y (
aM
W)
Net-to-Grid Energy (Average MW)
Behind-the-Fence Energy (Average MW)
Nameplate Plant Capacity (MW)
© EDC Associates Ltd.
A Review of Cogeneration in Alberta (September 2015)
8
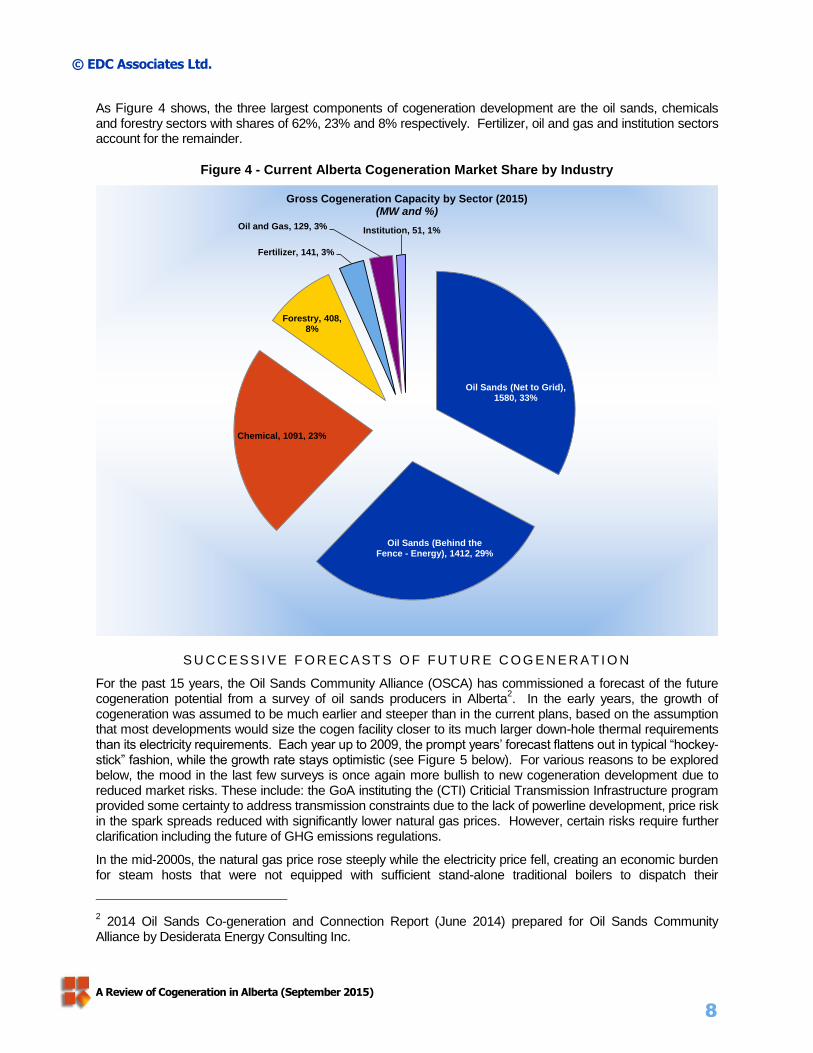
As Figure 4 shows, the three largest components of cogeneration development are the oil sands, chemicals and forestry sectors with shares of 62%, 23% and 8% respectively. Fertilizer, oil and gas and institution sectors account for the remainder.
Figure 4 - Current Alberta Cogeneration Market Share by Industry
S U C C E S S I V E F O R EC A ST S O F F U T U R E C O G E N E R AT I O N
For the past 15 years, the Oil Sands Community Alliance (OSCA) has commissioned a forecast of the future cogeneration potential from a survey of oil sands producers in Alberta
2. In the early years, the growth of
cogeneration was assumed to be much earlier and steeper than in the current plans, based on the assumption that most developments would size the cogen facility closer to its much larger down-hole thermal requirements than its electricity requirements. Each year up to 2009, the prompt years’ forecast flattens out in typical “hockey-stick” fashion, while the growth rate stays optimistic (see Figure 5 below). For various reasons to be explored below, the mood in the last few surveys is once again more bullish to new cogeneration development due to reduced market risks. These include: the GoA instituting the (CTI) Criticial Transmission Infrastructure program provided some certainty to address transmission constraints due to the lack of powerline development, price risk in the spark spreads reduced with significantly lower natural gas prices. However, certain risks require further clarification including the future of GHG emissions regulations.
In the mid-2000s, the natural gas price rose steeply while the electricity price fell, creating an economic burden for steam hosts that were not equipped with sufficient stand-alone traditional boilers to dispatch their
2 2014 Oil Sands Co-generation and Connection Report (June 2014) prepared for Oil Sands Community
Alliance by Desiderata Energy Consulting Inc.
Oil Sands (Net to Grid), 1580, 33%
Oil Sands (Behind the Fence - Energy), 1412, 29%
Chemical, 1091, 23%
Forestry, 408, 8%
Fertilizer, 141, 3%
Oil and Gas, 129, 3% Institution, 51, 1%
Gross Cogeneration Capacity by Sector (2015)(MW and %)

© EDC Associates Ltd.
A Review of Cogeneration in Alberta (September 2015)
9
cogenerators down during low-priced hours. This persisted long enough for steam hosts to reconsider the prudency of sizing their cogens to fully meet their electricity load and virtually stopped consideration of commissioning additional merchant capacity above that.
Figure 5 - Progression of OSCA Expected Cogeneration Capacity (MW)
From 2011 to 2014, the mood in the surveys has been progressively more upbeat, although still progressively more delayed for the prompt years. Figure 6 below shows the relative magnitude of sizing cogen to either the total electricity needs or the total steam needs, using the EDC’s Third Quarter-2015 Forecast assumed total barrels of bitumen production, very similar to the Alberta Energy & Resources (AER) forecast. These are compared to the 2014 OSCA report value (medium case) shown in Figure 5, above. If all cogens from the beginning of oil sands exploration had been sized to fully meet their expected electricity load based on those barrels of production, the total cogen capacity would be slightly higher than expected by the OSCA report. This deficit occurs partly because some oil sands plants never did build cogen. The OSCA report appears to assume that most new oil sands plants will match their cogen size to their electricity load. If the cogens instead had all been sized to balance to the total steam load, the figure would be about 5 times larger. Oil sands development of cogen is based on long term economics. Thus require reasonable certainty in long term factors including market access and regulations such as environmental regulations.
0
1,000
2,000
3,000
4,000
5,000
6,000
7,000
2008 2009 2010 2011 2012 2013 2014 2015 2016 2017 2018 2019 2020 2021 2022 2023
MW
Expected Operating Capacity - Medium Case (MW)
2008 Survey
2009 Survey
2010 Survey
2011 Survey
2012 Survey
2013 Survey
2014 Survey

© EDC Associates Ltd.
A Review of Cogeneration in Alberta (September 2015)
10
Figure 6 – Cogeneration Potential in Balancing to Electricity Needs or Steam Needs
EDC estimates3 that, including growth in demand, exports and retirements over the study period, the market
could absorb an additional 5,000 MW of additional “net-to-grid” generation plus an additional 1,500 MW of behind-the-fence load growth by 2030, only one fifth of the full potential 35,000 MW of cogens production if all units were sized to meet the full steam needs of the oil sands hosts.
In other client studies, EDC has estimated that, depending on the amount of room reserved for mandated renewables and any future modifications to the mandated coal electricity generation retirements, the market could absorb from 5,000 to 7,750 MW of new cogeneration by 2030 without significantly distorting the market or affecting FEOC
4 principles. With future mandated coal electricity generation retirements and existing industrial
host needs for steam, cogeneration is well positioned to support Alberta's future supply needs in short fashion. Because cogen is so much more efficient than even combined cycle generation, this additional cogen would lower fleet emissions and simultaneously reduce oil sands electricity and steam costs without requiring the out-of-market payments (tax breaks, incentive grants) used to incent the more expensive renewables. Assuming an additional 5,000 MW of cogen could be encouraged by supportive government policies, the generation on the margin would be displaced by lower emissivity cogen. For example, if 5,000 MWh of new cogen (at 0.25 t/MWh emissions) displaced coal generation (at 1.1 t/MWh) 40% of the time, combined cycle generation (at 0.42 t/MWh) 40% of the time and simple cycle (at 0.5 t/MWh) 10% of the time, it would reduce provincial emissions by about 19 Mt/year. This one, zero-cost initiative amounts to a ~42% reduction in provincial electricity emissions (44.7 Mt in 2013) and a ~7% reduction of the total provincial emissions (267 Mt in 2013).
3 EDC Q3-2015 Quarterly Report p.79
4 Fair, Efficient and Open Competition Regulation (FEOC Regulation), Alta Reg 159/2009
0
5,000
10,000
15,000
20,000
25,000
30,000
35,000
2008 2009 2010 2011 2012 2013 2014 2015 2016 2017 2018 2019 2020 2021 2022 2023
MW
Oil Sands Cogeneration Potential
Balanced to Steam Needs
Balanced to Electricity Needs
2014 OSDG Survey (Medium Case)
2014 OSCA Survey (Medium Case)
Balanced to Electricity Needs
Balanced to Steam Needs

© EDC Associates Ltd.
A Review of Cogeneration in Alberta (September 2015)
11
Benefits of Cogeneration
Cogenerator justifications can be segmented into four principle categories:
1) Improved efficiency and reduced emission intensity for generation of steam and electricity.
2) Improved life-cycle economics (under appropriate market conditions) to produce steam and electricity.
3) Increased reliability for oil sands project (own generation capacity).
4) Potential additional margin from the sale of low-cost excess power to the Alberta electricity grid.
In addition to the benefits which accrue to cogeneration owners, cogeneration also provides an additional and diverse source of electricity capacity to the overall Alberta grid.
With favorable regulatory and market conditions, the production of electricity and steam together (i.e. cogeneration) drives improved life-cycle economics over producing steam or electricity separately. Moreover, when a cogeneration project is sized to meet the thermal load requirements of such a heat-intensive application as the oil sands extraction process, the facility produces electricity greatly in excess of its own requirements. Over time, the on-site electricity demand may change, resulting in more or less excess cogeneration electricity supply. Some facilities can generate upwards of 5 times the excess supply over the on-site demand (e.g., MEG Energy Christina Lake).
Figure 7 illustrates the costs of a cogeneration configuration to meet the steam and power requirements of a typical 170MW, 60,000 bbl/d SAGD project assuming a steam-to-oil ratio of 2.8.
Figure 7 - Comparison of Typical Oil Sands Cogen & Boiler Costs
Even though the cogeneration unit incurs incremental operating and capital costs, the benefit obtained from selling the excess electricity to the Alberta grid more than offsets these costs over a wide range of
$-
$10
$20
$30
$40
$50
$60
$70
$80
$90
$100
$110
$120
$130
$140
Cogeneration cogen Excess Power Sold and GHGCredit
Cogen after Power Sold/GHGCredits
Boilers
$/M
Wh
Total Cost Cogeneration vs Boilers (170 MW, 60,000 bbl/d Bitumen Production, SOR=2.78)
Transmission Cost Incremental Capital Fixed Cost Variable Cost
Purchased Power GHG Fuel for Power Fuel for Steam

© EDC Associates Ltd.
A Review of Cogeneration in Alberta (September 2015)
12
expected electricity and natural gas prices. In addition, a configuration with only boilers, although less capital intensive and with lower operating costs, will require purchases of electricity from the grid. The arrows in the figure illustrate the range of risks introduced by variations of electricity and natural gas prices, transmission costs and environmental compliance costs. Cogeneration may have lower risk than separate production and gas and power because the mild correlation between them will act a partial hedge.
By extracting useful energy from otherwise exhaust heat, cogeneration typically achieves higher total system efficiencies than other forms of natural-gas fired generation. Actual practical efficiencies will depend on a large number of factors specific to the particular project and design, but Table 1 summarizes a range of typical values.
Table 1 - Typical Efficiencies of Cogeneration
While cogeneration utilizes the same gas turbine (GT) generation technology as merchant simple-cycle units, its effective net emission rates are much lower than combined-cycle (as shown in Figure 8).
Figure 8 - Comparison of Range of Emission Intensities by Fuel Type
Because a significant part of the energy (about half) can be allocated to steam production, a proportional amount of the fuel and the emissions can be similarly allocated to steam production, such that the net effective
Technology Simple Cycle Combined Cycle BoilerCombined
Efficiency
Cogeneration 34% 85% HRSG 90%
Separate Combined Cycle and Boiler 54% 85% OTSG 70%
Typical Efficiencies of Steam and Power Processes
0.00
0.20
0.40
0.60
0.80
1.00
1.20
Sub-CriticalCoal
Super-CriticalCoal
Simple CycleGT
CombinedCycle GT
Cogeneration Biomass Hydro Imports Wind Grand Total
To
nn
es/M
Wh
Raw
Net of Allocation for Steam
2007
2019
2020
2030
LEGEND
High
Average
Low
Raw
Net of Allocation for Steam
2007
2019
2020
2030
LEGEND
High
Average
Low

© EDC Associates Ltd.
A Review of Cogeneration in Alberta (September 2015)
13
emission rate allocated to electricity is virtually half of the simple-cycle GT emission intensity. While a wide range of emissions intensity is possible, as shown in Figure 8, even with the vagaries of the above allocation methodology, typically oil sands cogen applications are calculated at the lower end of the range (0.25 t/MWh), given their operational efficiencies and the substantial allocation of emissions to steam production.
Cogeneration can improve host productivity by avoiding shutdowns otherwise attributable to electricity transmission system failures or derates. As illustrated in Figure 9, the cogeneration fleet in Alberta operates with the second highest availability. When the transmission system fails, facilities with significant cogeneration can continue to operate.
In its latest Long-Term Transmission Plan, the AESO proposes two large, high capacity 500 kV transmission lines connecting generation-rich Edmonton and Heartland to the Ft. McMurray area, both designated as Critical Transmission Infrastructure projects. The first of these units, already tendered by competitive process, is on schedule to commission around the end of 2019. For technical reasons (single largest contingency), this first line will bring less relief (~300 MW) than the second line (~1000 MW), but, by 2020 will relieve currently growing congestion until NE Alberta growth again overtakes it. The second line, less secure in its timeline and more prone to delay or cancellation, would strongly reinforce the existing transmission lines, and would, if actually built, almost eliminate any reliability issues in the northeast quadrant of the province. Depending on the extent of delays of these lines, additional cogens may be partially justified on the basis of interim reliability improvement. Some oil sands operators are considering the effect that different levels of standby generation will have on their ability to keep producing bitumen during transmission failures or derates, which are currently higher in faults/100 km in the rapidly growing Fort McMurray area than in the rest of Alberta. The longer the transmission build is delayed, the more value a cogen will create for an oil sands owner, in terms of avoided potential production interruption. With such finely tuned production processes, even a short power interruption at a sophisticated processing facility can cause multiple days of recovery and re-stabilization and $ millions in lost production and potentially equipment damage.
The set of CTI transmission lines, originally set to be in-service by 2017, has been pushed back in the new plan until 2019, with that date possibly being optimistic. As it now sits, the current Northeast bulk system is occasionally constrained, simply by the random coincidences of net flows (in and out) of plants. With the constant expansion of bitumen production, even more transmission failure events are likely.
Unlike wind generators, cogeneration units, even though concentrated geographically in the Northeast, are not highly correlated to one another. In fact, the output to the grid is usually governed more by local forces (outages or planned turnarounds at individual plants). Rarely, such as in the summer of 2011, a major transmission failure or local catastrophe (e.g., forest fire, pipeline leak) will knock out several northeast plants simultaneously, but the correlations are small, and not very statistically significant, regardless of how resilient the transmission is. This means that it is unlikely that the net outputs at each plant will regularly conspire to raise or lower total supply like they do across some of the wind fleet. However, even a few events a year can cause enormous lost production costs that could be avoided with an on-site cogen.

© EDC Associates Ltd.
A Review of Cogeneration in Alberta (September 2015)
14
Figure 9 - Alberta 2014 Capacity Factors by Fuel Type
Figure 10 illustrates the comparative levelized unit cost (real 2015$) for the dominant technology types in Alberta, excluding GHG costs. Cogeneration currently has the lowest levelized cost for development of new electricity generation capacity, given the re-use of the waste heat to produce useful steam.
Since most of the waste heat created by the gas turbine electricity generator is being put to work, it is appropriate to allocate some of the burned gas to the steam generation (called “fuel allocated to steam”, FAS). That effectively lowers the heat rate of the generator from a typical 9 GJ/MWh heat rate for a modern simple-cycle unit or a 6.5GJ/MWh heat rate of an efficient combined-cycle, to something in the order of 4.5 GJ/MWh effective heat rate for the cogen. At $4/GJ gas price, even a conservative 2 GJ/MWh cost advantage over a combined-cycle unit (6.5-4.5GJ/MWh) would lower the marginal cost of electricity by $8/MWh (2 GJ/MWh X $4/GJ) based on fuel alone, giving cogen a significant cost advantage over even the most efficient combined-cycle. With that fuel savings, plus an allowance for the capital and other operating costs allocated to the steam, a cogenerator is comfortably the lowest levelized cost source of base load power.
The significantly lower effective heat rate and the high ‘must run’ component of the total capacity ensure cogens will run at a high capacity factor.
0%
10%
20%
30%
40%
50%
60%
70%
80%
90%
100%
Coal Cogeneration OilSands
CogenerationOther
Gas CombinedCycle
Wind Hydro Solar Gas Simple Cycle
Cap
acit
y F
acto
r

© EDC Associates Ltd.
A Review of Cogeneration in Alberta (September 2015)
15
Figure 10 – Generation Comparative Levelized Costs
Since cogenerators need to ensure they are not dispatched off when process steam is needed, they offer over 80% of their electricity production at $0/MWh. In the short-term, this will have the effect of contributing to lower pool price, which accounts for over 50% of a typical RRO customer’s electricity bill
5.
5 Alberta MSA, “Alberta Retail Markets for Electricity and Natural Gas - A description of basic structural features”
(July 2014) pg. 22
© EDC Associates Ltd.
A Review of Cogeneration in Alberta (September 2015)
16
Risks & Barriers to Cogeneration
Some steam hosts embrace cogeneration while others do not, depending on many factors. Of those who do, some only size their generation to balance to their electricity needs, even though, on paper at least, there is a very good case for a much larger unit size, balanced more closely to their much larger steam energy needs. While the financial case for much larger cogeneration is clear, other factors also come into play.
Despite the potential economic advantages of cogeneration, potential developers must address a number of challenges when deciding on cogen.
Factors related to market fundamentals include:
1) The uncertainty on costs of natural gas and electricity from cogeneration
2) The cost differential between simple standby transmission charges versus transmission of the full load
3) The potential for the development community to collectively over or under-build.
Corporations planning to develop cogeneration need to take into account their internal policies regarding the level of investment, control and generation of electric energy supply, the availability of in-house expertise on power generation, and potential changes to existing GHG policy and regulations for both electricity and bitumen.
Some factors influencing the decision to develop cogeneration are under the control of government policy makers.
Governments are charged with:
1) Providing clarity on future greenhouse gas emissions compliance obligations
2) Credit allowances, emissions policy and timing of coal retirements
3) Improving transmission access by ensuring adequate transmission capacity is developed on time for industry requirements
4) Reducing barriers and development timelines for the connection and approval process
While numerous untapped applications exist outside the oil sands arena (forestry, chemicals, food-processing, CHP), by far the application with the largest appetite for steam is oil sands stimulation (especially SAGD). This field is highly specialized.
Oil sands technical and business expertise is focused on geotechnical engineering, refinery permitting and construction, world oil market dynamics and the ability to attract massive, patient capital. Getting approval, constructing and connecting a cogenerator, then dynamically marketing, managing offers and hedging positions in the complex Alberta electricity market requires a different, only partially related set of competencies, which will be present in varying degrees in different oil sands companies.
Faced with a cogeneration investment, an oil sands developer with capital constraints looks not only at the rate of return of cogeneration versus combined-cycle or simple-cycle generation, but also versus the rate of return on the next dollar of capital spent on his core competency, finding and developing more oil reserves and production.
In the ever critical quarter-by-quarter world of capital and financial markets, an oil company is not likely to get as much acclaim from shareholders for developing a new cogenerator as they would for spending the capital to develop the next phase of production. Faced with the competing time pressures of managing such a complex, extended set of tasks and risks, it is easy to see how a management team would put a lower priority on organizing a cogenerator project than on expanding their own oil sands infrastructure.
Similarly, on the physical operating side, a plant operator may be unwilling to take on the added

© EDC Associates Ltd.
A Review of Cogeneration in Alberta (September 2015)
17
complexity and risk exposure of another piece of equipment that has different operating characteristics beyond a traditional steam boiler. It will have to be on-site, conflicting with other structures for real estate and flow-routing. If the cogenerator fails and the operator finds himself short of steam for his process, he will have to have immediate access to technical expertise outside of his wheelhouse. Furthermore, existing reward mechanisms may not incent the same behaviours when applied to power generation machinery as they do to getting the oil product out the door.
Of course, a steam host can farm out the job of developing and operating a cogenerator to any number of willing, highly competent and proven third party developers. The host has an ongoing need for both the steam and the electricity, and may be willing to give the generation developer a very valuable commodity, a long term takeoff agreement. This agreement allows the cogen developer to secure higher capital leverage and a lower interest rate and keep dollars off the host’s balance sheet, albeit with the complication of having non-company operating staff on site. The much lower capital cost structure plays a significant role in lowering the levelized cost of cogen. The challenge comes when the financial reliability and risk assignment terms of the agreement are being negotiated. Although there is a lot of value being generated, it can be difficult for the two parties to find a reasonable arrangement to share that value and the attendant risks. If the host takes too much of the savings or too little of the risks, the developer is not interested and vice versa.

© EDC Associates Ltd.
A Review of Cogeneration in Alberta (September 2015)
18
Qualifications
Incorporated in 1992, EDC Associates Ltd. (“EDCA”) is an independent energy-consulting firm based in Calgary, Alberta, Canada that provides consulting services with respect to electric energy pricing, generation economic development, energy procurement, regulatory/legal issues, and electric industry training.
EDCA has been the premier supplier of independent pool price forecasts and generation energy production simulations in Alberta since the start of the electric energy industry re-structuring in 1996. As part of the energy pricing consulting services provided by EDC, the company has been retained to prepare case by case client specific market analysis and forecasts for a wide range of electricity industry participants including marketers, retailers, generation developers, industrial customers, regulators and governmental departments and also publishes several multi-client studies, newsletters and reports on its own volition that are widely circulated to industry clients (over 300 active company subscriptions, including the AESO) on a fee for service basis. EDCA has on many occasions prepared and filed evidence in both legal and regulatory proceedings in Alberta and other provincial jurisdictions. The following graphic illustrates EDCA’s typical client base segmented by broad customer category.
For over 24 years in Alberta, EDCA has been continually engaged by a wide variety of electric industry participants including loads, generators, power marketers, legislators and implementing agencies, to provide its professional judgment and opinion in respect of asset valuation, market impact assessments and recommendations for purchases and sales of electricity, and to provide evidence in written format and as oral expert witness testimony for court litigations and quasi-judicial regulatory proceedings in the electricity industry.
EDCA also publishes weekly, monthly, quarterly and annual reports for hundreds of subscribers, which include 2-20 year forecasts of expected supply, load, hourly electricity pool price and gas price (see for product line and client list). For these reasons, EDCA represents itself and is often retained as an industry expert, as outlined in Section 620 of the Handbook of International Auditing, Assurance, and Ethics Pronouncements, 2010 Edition, for the purpose of evaluating the fair market value of the ESA as contemplated in the IFRS, Section IAS 39: Financial Instruments: Recognition and Measurement.
Energy Marketing/Retailers/
Utilities18%
Generators20%
C&I Consumers36%
Governement/Agencies
11%
Financial/Legal Services/Consultants
15%
EDC Associates Ltd. Customers by CategoryEDC’s Customers by Category
© EDC Associates Ltd.
A Review of Cogeneration in Alberta (September 2015)
19
EDCA’s Experience and Qualifications
EDCA has designed, developed and continually updates and maintains an integrated suite of computer models that are used to provide very detailed quantitative analysis in support of its consulting services. These models are based on robust forecast methodologies to assess intricate market fundamentals and have been recognized as being leading edge, comprehensive and the “barometer” of energy (electricity and natural gas) pricing used by industry and market participants. More specifically, these models are used to analyze electric energy market fundamentals to produce both short and long-term hourly forecasts of expected supply, load, hourly electricity pool price and heat rate, typically from 1 to 30-years, which EDCA publishes weekly, monthly, quarterly and annually for hundreds of subscribers. EDCA has been the premier supplier of independent electricity price forecasts and generation energy production simulations in Alberta since the start of the electric energy industry re-structuring in 1996. As part of this detail quantitative analysis, EDCA also closely follows and analyzes world oil and North American natural gas markets as they relate to and impact on the Alberta energy markets.
As part of the energy pricing consulting services provided by EDCA, the company has been retained to prepare case by case client specific market analysis and forecasts for a wide range of electricity industry participants including marketers, retailers, generation developers, industrial customers, regulators and governmental departments and also publishes several multi-client studies, newsletters and reports on its own volition that are widely circulated to industry clients on a fee for service basis.
As part of the generation economic development services provided by EDCA, the company has been retained by its clients to provide independent and rigorous analysis with respect to generation feasibility and economic modeling used by those considering generation development, value optimization, acquisition or divestiture. EDCA incorporates Monte Carlo analysis with respect to quantifying volume, price and other key risk components related particularly to asset valuation, energy production, ancillary services revenues and risk/hedging analysis as part of any generation economic or options study.
As part of the energy procurement consulting services provided by EDCA, the company has been retained by energy suppliers and consumers to facilitate energy procurement or sale processes for electricity and natural gas. EDCA provides services in regards to: requests for quote and proposal development, purchase/sale recommendations, purchase/sale strategies and portfolio monitoring services, budget assistance and reporting. EDCA has made recommendations and negotiated vendor contract terms in respect of electricity and natural gas over-the-counter agreements up to 20 years in length.
As part of its regulatory and legal consulting services provided by EDCA, the company has on many occasions prepared and filed evidence in both legal and regulatory proceedings in Alberta and other provincial jurisdictions. EDCA staff has been prepared as an expert witness on behalf of several clients and proceedings, with several appearances in front of the then AEUB (now AUC).
EDCA’s Independence and Objective Professionalism
EDCA maintains strict neutrality between commodity suppliers, generation developers, marketers and equipment suppliers. EDC owns no generation assets or capacity rights and has no preferred commodity suppliers. This neutrality ensures our actions and advice are always independent and unbiased.
EDCA’s client list further exemplifies the fact that our services are industry neutral, with services being provided to all segments of the market from consumers to suppliers, marketers, retailers, utilities, governments and other impartial and regulatory agencies.
A Review of Cogeneration in Alberta (September 2015) 20
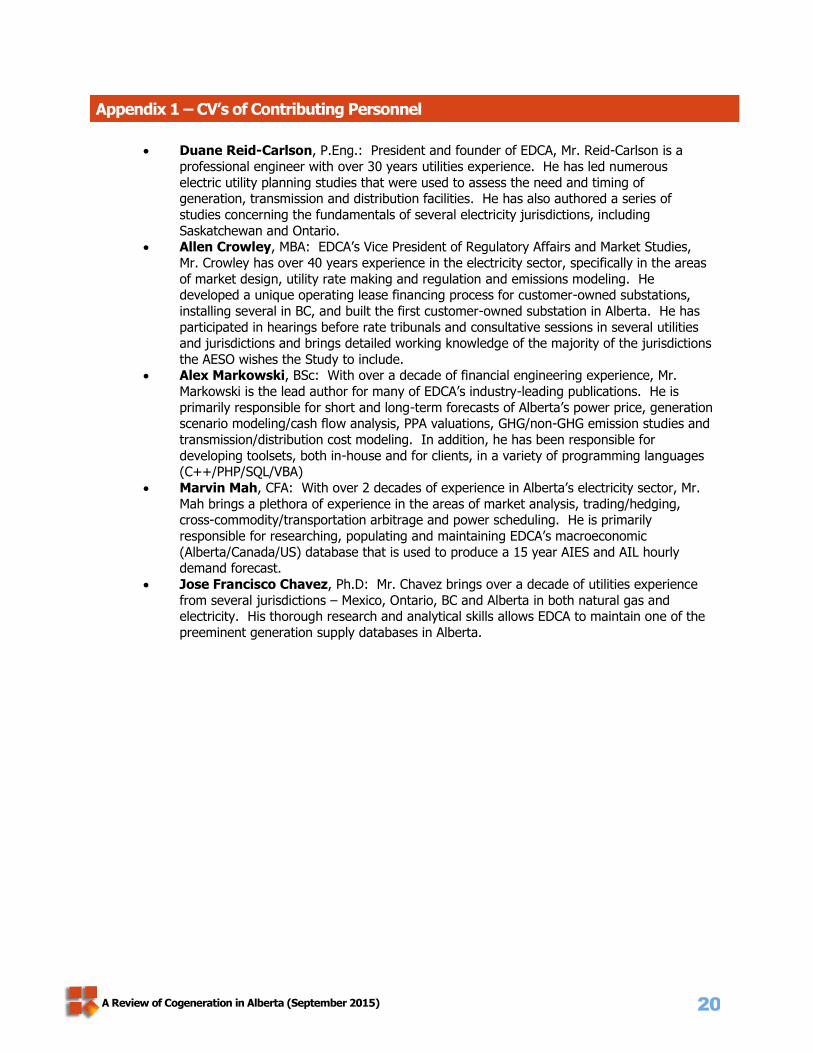
Appendix 1 – CV’s of Contributing Personnel
Duane Reid-Carlson, P.Eng.: President and founder of EDCA, Mr. Reid-Carlson is a
professional engineer with over 30 years utilities experience. He has led numerous
electric utility planning studies that were used to assess the need and timing of generation, transmission and distribution facilities. He has also authored a series of
studies concerning the fundamentals of several electricity jurisdictions, including
Saskatchewan and Ontario. Allen Crowley, MBA: EDCA’s Vice President of Regulatory Affairs and Market Studies,
Mr. Crowley has over 40 years experience in the electricity sector, specifically in the areas
of market design, utility rate making and regulation and emissions modeling. He developed a unique operating lease financing process for customer-owned substations,
installing several in BC, and built the first customer-owned substation in Alberta. He has
participated in hearings before rate tribunals and consultative sessions in several utilities and jurisdictions and brings detailed working knowledge of the majority of the jurisdictions
the AESO wishes the Study to include. Alex Markowski, BSc: With over a decade of financial engineering experience, Mr.
Markowski is the lead author for many of EDCA’s industry-leading publications. He is
primarily responsible for short and long-term forecasts of Alberta’s power price, generation scenario modeling/cash flow analysis, PPA valuations, GHG/non-GHG emission studies and
transmission/distribution cost modeling. In addition, he has been responsible for
developing toolsets, both in-house and for clients, in a variety of programming languages (C++/PHP/SQL/VBA)
Marvin Mah, CFA: With over 2 decades of experience in Alberta’s electricity sector, Mr.
Mah brings a plethora of experience in the areas of market analysis, trading/hedging, cross-commodity/transportation arbitrage and power scheduling. He is primarily
responsible for researching, populating and maintaining EDCA’s macroeconomic
(Alberta/Canada/US) database that is used to produce a 15 year AIES and AIL hourly demand forecast.
Jose Francisco Chavez, Ph.D: Mr. Chavez brings over a decade of utilities experience
from several jurisdictions – Mexico, Ontario, BC and Alberta in both natural gas and electricity. His thorough research and analytical skills allows EDCA to maintain one of the
preeminent generation supply databases in Alberta.