A REVIEW OF BIAS PATTERNS IN THE MIRAS BRIGHTNESS TEMPERATURES OVER THE OCEAN Joe Tenerelli SMOS...
55
A REVIEW OF BIAS PATTERNS IN THE MIRAS BRIGHTNESS TEMPERATURES OVER THE OCEAN Joe Tenerelli SMOS Quality Working Group #10 4-5 Feb 2013 ESRIN
-
Upload
angelica-hill -
Category
Documents
-
view
219 -
download
0
Transcript of A REVIEW OF BIAS PATTERNS IN THE MIRAS BRIGHTNESS TEMPERATURES OVER THE OCEAN Joe Tenerelli SMOS...

A REVIEW OF BIAS PATTERNS IN THE MIRAS BRIGHTNESS
TEMPERATURES OVER THE OCEAN
Joe TenerelliSMOS Quality Working Group #10
4-5 Feb 2013ESRIN

OVERVIEWWhile significant progess has been made by the calibration team in improving the accuracy of the calibrated visibilities and the image reconstruction procedure, troublesome biases remain in the brightness temperatures obtained from the reprocessed and operational data. Moreover, the biases exhibit clear seasonal and spatial trends, and significant discrepancies remain between ascending and descending passes.
For descending passes, there is a striking resemblance between the evolution of the antenna patch temperature (Tp7) and the AF FoV bias as a function of latitude and time. But any correspondence is less evident in ascending passes. It has been speculated that the direct sun may play a role in the bias, but any such role is difficult to demonstrate.

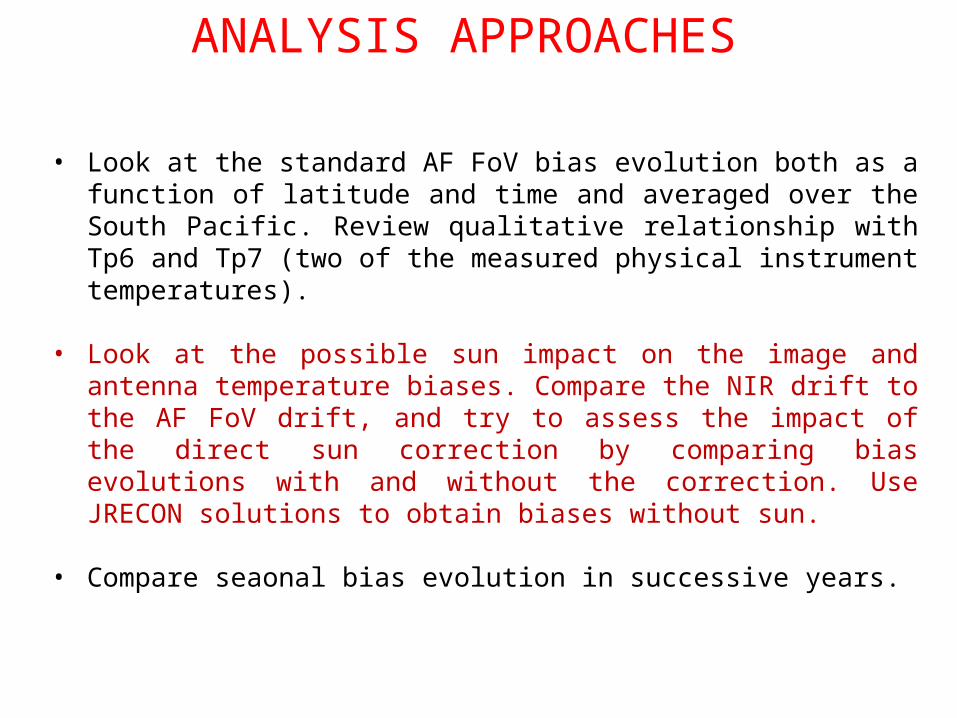
ANALYSIS APPROACHES
• Look at the standard AF FoV bias evolution both as a function of latitude and time and averaged over the South Pacific. Review qualitative relationship with Tp6 and Tp7 (two of the measured physical instrument temperatures).
• Look at the possible sun impact on the image and antenna temperature biases. Compare the NIR drift to the AF FoV drift, and try to assess the impact of the direct sun correction by comparing bias evolutions with and without the correction. Use JRECON solutions to obtain biases without sun.
• Compare seaonal bias evolution in successive years.

All of the bias computations presented here use the level 1B and 1A data from the last reprocessing campaign of ESA up through the end of 2011 and from the operational DPGS system for January 2012 up to the present.
These data all employ the 1-Slope model for the antenna loss L1 as developed by the Level 1 calibration team.
The one exception to this is that, on a few slides, we also show biases for the so-called ‘Calibrated L1’ approach introduced by Ignasi Corbella.
Biases are computed both for the reconstructed images (AF and EAF FoV) and for the NIR antenna temperatures. Hovmoller plots show averages over the open-ocean portion of all passes (Atlantic, Pacific, Indian Ocean). However, for computational reasons, the NIR antenna temperature biases are computed over a small subset of Pacific Ocean passes.
BIAS COMPUTATIONS
Data sources for the bias computations:
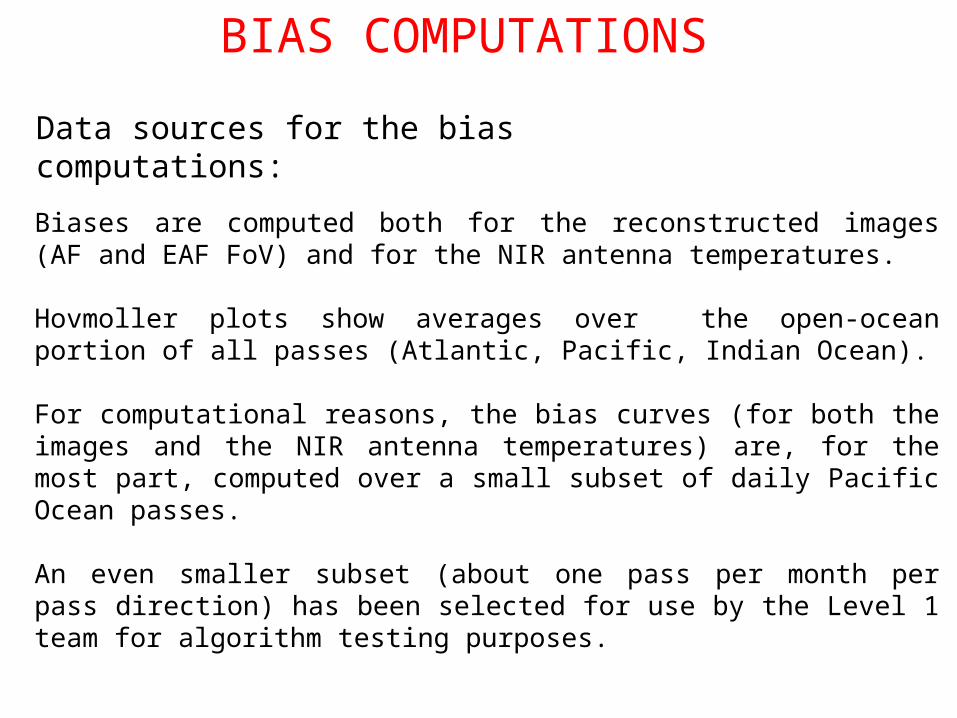
Biases are computed both for the reconstructed images (AF and EAF FoV) and for the NIR antenna temperatures.
Hovmoller plots show averages over the open-ocean portion of all passes (Atlantic, Pacific, Indian Ocean).
For computational reasons, the bias curves (for both the images and the NIR antenna temperatures) are, for the most part, computed over a small subset of daily Pacific Ocean passes.
An even smaller subset (about one pass per month per pass direction) has been selected for use by the Level 1 team for algorithm testing purposes.
BIAS COMPUTATIONS
Data sources for the bias computations:

Domain-averaged biases are calculated over both the alias-free (AF) and extended alias-free (EAF) portions of the field of view (FOV). Gridpoints within 0.044 director cosine units of the domain boundaries are excluded from the averaging.
BIAS COMPUTATIONS
AF FoV and EAF FoV domain averaged biases:

Bias between measured and modeled antenna temperatures are computed along each half-orbit. Scene brightness is modeled over entire front half space, which includes celestial sky radiation directly incident at the antennas and the contribution of the direct sun to Txx and Tyy. The sun brightness is assumed to be unpolarized. Contribution is computed for each NIR separately using the corresponding antenna patterns. Cross-polarization terms are excluded.
BIAS COMPUTATIONS
NIR antenna temperature biases:

The bias curves present here have been computed by averaging per-epoch biases (for both NIR antenna temperatures and the images) between 40oS and 5oN. This range of latitudes is used to avoid impact of land and ice on the antenna temperatures.
BIAS COMPUTATIONS
Latitudinal averaging and the bias trend curves:

A LITTLE REMINDER OF THE MAGNITUDE OF THE DRIFT
PROBLEM

THREE-MONTH MEAN MAPS (USING ONLY ALIAS-FREE FIELD OF VIEW) SHOW CLEARLY THE GLOBAL BIAS EVOLUTION
Jun,Jul,Aug 2012
Nov,Dec,Jan 2012/3
To produce these maps we have used the first Stokes parameter in the AF-FoV only, after having removed all snapshots with maximum brightness temperature (Txx,Tyy, or |Uxy|) exceeding some threshold.
Also, only one OTT was applied in order to reveal the drift from the NH summer 2012 to the present.

(Tx+Ty)/2 bias +1 K SSS bias -2 psu(independent of incidence angle)

THREE-MONTH MEAN MAPS (USING ONLY ALIAS-FREE FIELD OF VIEW) SHOW CLEARLY THE GLOBAL BIAS EVOLUTION
Jun,Jul,Aug 2012
Nov,Dec,Jan 2012/3
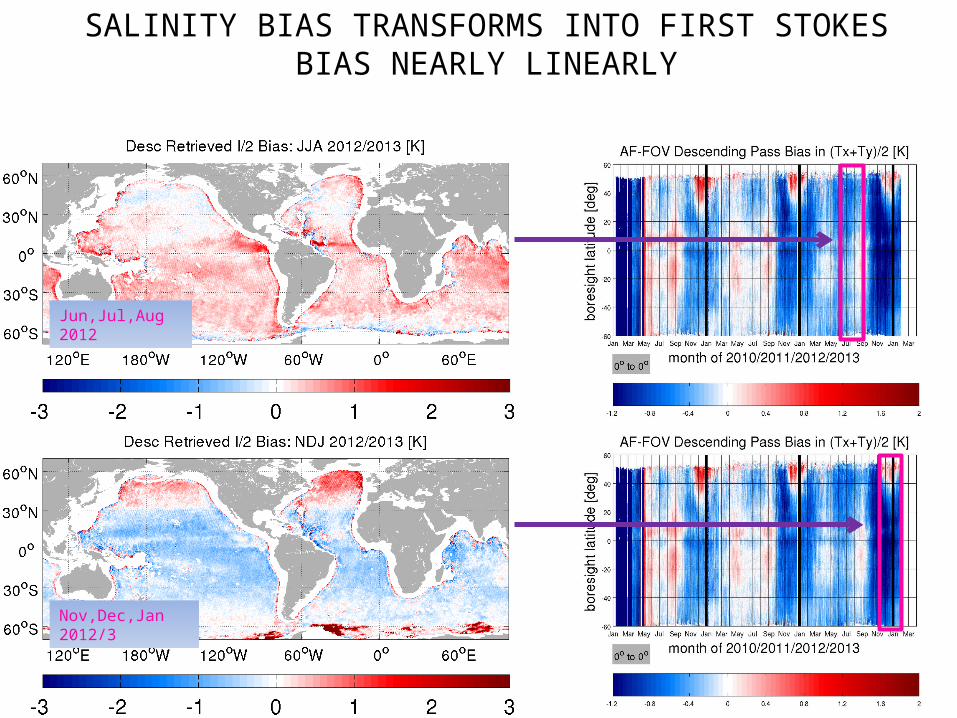
SALINITY BIAS TRANSFORMS INTO FIRST STOKES BIAS NEARLY LINEARLY
Jun,Jul,Aug 2012
Nov,Dec,Jan 2012/3

SUBTRACTING MEAN SSS BIAS FOR NOV-DEC-JAN 2012/3 FROM SSS BIAS FOR JUN-JUL-AUG 2012 SHOWS LATITUDINAL
DEPENDENCE OF THE EVOLUTION OF SPATIAL BIAS DISTRIBUTION
BIAS EVOLUTION EXHIBITS DOMINANT ZONAL SYMMETRY

SAME EVOLUTION AS IN PREVIOUS SLIDE BUT FOR THE FIRST STOKES PARAMETER DIVIDED BY TWO
BIAS EVOLUTION EXHIBITS DOMINANT ZONAL SYMMETRY

ANALYSIS APPROACHES
• Look at the standard AF FoV bias evolution both as a function of latitude and time and averaged over the South Pacific. Review qualitative relationship with Tp6 and Tp7 (two of the measured physical instrument temperatures).
• Look at the possible sun impact on the image and antenna temperature biases. Compare the NIR drift to the AF FoV drift, and try to assess the impact of the direct sun correction by comparing bias evolutions with and without the correction. Use JRECON solutions to obtain biases without sun.
• Compare seaonal bias evolution in successive years.

THERMAL IMPACT OF THE SUN: TP6Time-latitude evolution of both Tp6 and Tp7 show clear seasonal patterns with similar amplitude from year to year at any given time of year. There is not a clear interannual drift:

THERMAL IMPACT OF THE SUN: TP7Time-latitude evolution of both Tp6 and Tp7 show clear seasonal patterns with similar amplitude from year to year at any given time of year. There is not a clear interannual drift:

THERMAL IMPACT OF THE SUN: TP7AF-FoV first Stokes parameter bias evolution resembles somewhat the evolution of Tp7 in descending passes, but the relationship in ascending passes is not as clear. Also, unlike Tp6 and Tp7, the first Stokes biases in asc and desc passes exhibit a long-term downward trend that is not present in Tp7.

THERMAL IMPACT OF THE SUN: TP7
First Stokes biases in asc and desc passes exhibit a long-term trend that is not present in Tp7. Also amplitude of bias drop late in year in descending passes is increasing from year to year while the variation of Tp7 is not. So perhaps a thermal effect is not the whole story; perhaps L-band brightness of sun plays a role.
Figures below compare trends of both one-slope and calibrated L1 solutions for AF-FoV mean bias in (Tx+Ty)/2 to trends in latitudinally-averaged Tp7 deviations. Tp7 curves are offset to fit on these figures.
ANALYSIS APPROACHES
• Look at the standard AF FoV bias evolution both as a function of latitude and time and averaged over the South Pacific. Review qualitative relationship with Tp6 and Tp7 (two of the measured physical instrument temperatures).
• Look at the possible sun impact on the image and antenna temperature biases. Compare the NIR drift to the AF FoV drift, and try to assess the impact of the direct sun correction by comparing bias evolutions with and without the correction. Use JRECON solutions to obtain biases without sun.
• Compare seaonal bias evolution in successive years.

CAN WE HOPE TO SEPARATE THE THERMAL IMPACT OF THE SUN FROM THE IMPACT OF THE SUN L-BAND BRIGHTNESS ON THE IMAGES?
The sun L-band brightness exhibits strong quasi-monthly oscillations over the last couple of years. Note in particular the recent strong oscillation with a nearly one-month period:

CAN WE HOPE TO SEPARATE THE THERMAL IMPACT OF THE SUN FROM THE IMPACT OF THE SUN L-BAND BRIGHTNESS ON THE IMAGES?
The L-band brightness temperature of the sun oscillates between about 15,000 K and 200,000 K with a very regular cycle from Aug through Nov 2012:
CHECK FOR EVIDENCE OF POSSIBLE SUN IMPACT ON NIR AND AF FOV BIAS EVOLUTION FROM JUNE 2010 THROUGH
DECEMBER 2012
COMPARE SOLUTIONS WITH AND WITHOUT (JRECON) DIRECT SUN CORRECTION APPLIED TO THE IMAGES

• Green curve = AF Bias without – with the current DPGSdirect sun correction• Blue and red curves: Bias evolution of the NIR antenna temperatures (zero baseline)• Yellow curve: Computed sun impact on NIR CA antenna temperature (Tx+Ty)/2
Overall, for ascending passes there is good correspondence between NIR TA evolution (red and blue curves) and AF Fov bias with and without direct sun correction (cyan and green curves).

• Green curve = AF Bias without – with the current DPGSdirect sun correction• Blue and red curves: Bias evolution of the NIR antenna temperatures (zero baseline)• Yellow curve: Computed sun impact on NIR CA antenna temperature (Tx+Ty)/2
In descending passes there is an increase in temporal ripples during the period with strong sun brightness oscillations.
AF-FoV biases with and without sun correction (cyan and green curves respectively) are nearly identical.
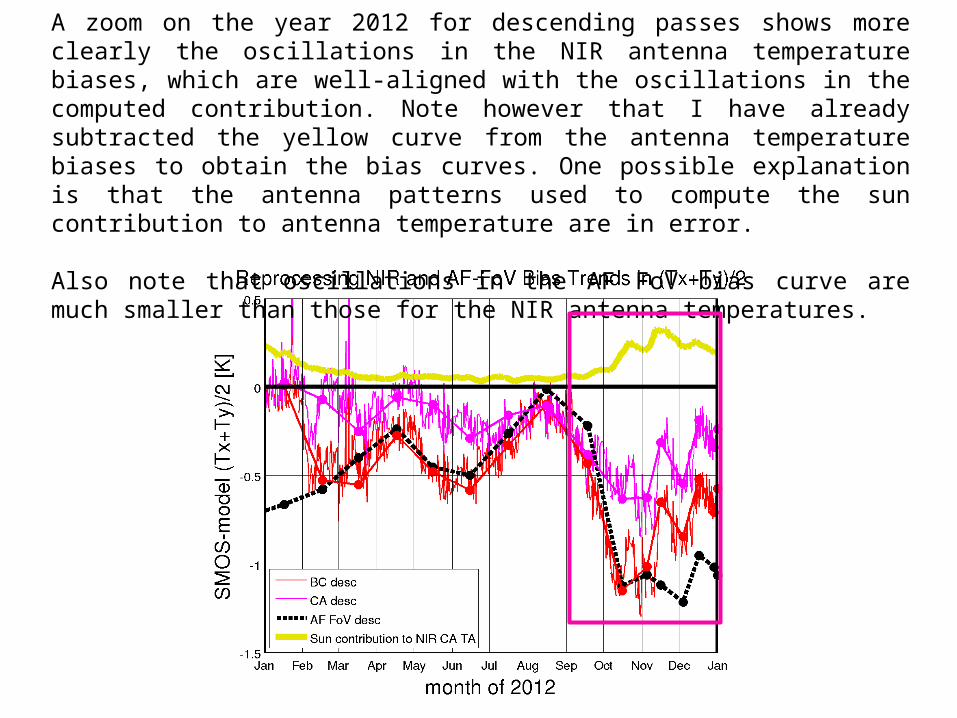
A zoom on the year 2012 for descending passes shows more clearly the oscillations in the NIR antenna temperature biases, which are well-aligned with the oscillations in the computed contribution. Note however that I have already subtracted the yellow curve from the antenna temperature biases to obtain the bias curves. One possible explanation is that the antenna patterns used to compute the sun contribution to antenna temperature are in error.
Also note that oscillations in the AF FoV bias curve are much smaller than those for the NIR antenna temperatures.

ANALYSIS APPROACHES
• Look at the standard AF FoV bias evolution both as a function of latitude and time and averaged over the South Pacific. Review qualitative relationship with Tp6 and Tp7 (two of the measured physical instrument temperatures).
• Look at the possible sun impact on the image and antenna temperature biases. Compare the NIR drift to the AF FoV drift, and try to assess the impact of the direct sun correction by comparing bias evolutions with and without the correction. Use JRECON solutions to obtain biases without sun.
• Compare seaonsal bias evolution in successive years.

Comparing bias trends in 2011 and 2012, the seasonal trends in the NIR TA and AF FoV biases are similar but the amplitude of the bias drop towards the end of the year is stronger in 2012 than in 2011. Also, in Oct-Dec of both years the NIR TA biases begin to shift upward before those of the AF FoV.

Comparing bias trends in 2011 and 2012, the seasonal trends in the NIR TA and AF FoV biases are similar but the amplitude of the bias drop towards the end of the year is stronger in 2012 than in 2011. Also, in Oct-Dec of both years the NIR TA biases begin to shift upward before those of the AF FoV.

CONCLUSIONS
• There is not a really noticeable interannual trend in Tp7 but there is a significant downward trend in the ascending and descending pass AF FoV and NIR antenna temperature biases (in first Stokes parameter at least).
• There seems to be very little impact of the direct sun correction upon the AF FoV bias trends. More impact in seen in the NIR antenna temperatures, but the NIR antenna temperature biases, for which the direct sun contribution has already been removed, exhibit strong temporal ripples that are aligned with sun Tb variations.
• Comparing bias trends in 2011 and 2012, the seasonal trends in the NIR TA and AF FoV biases are similar but the amplitude of the bias drop towards the end of the year is stronger in 2012 than in 2011. Also, in Oct-Dec of both years the NIR TA biases begin to shift upward before those of the AF FoV.

AN ASIDE:
A STRANGE DISCONTINUITY IN THE ESTIMATED SUN
BRIGHTNESS TEMPERATURE IN ASCENDING PASSES IN THE
CURRENT OPERATIONAL DPGS

When we collect all ascending passes since Jan 2010 and plot the estimated sun brightness temperature as a function of time and boresight latitude, a very strong discontinuity appears between May and September of every year:
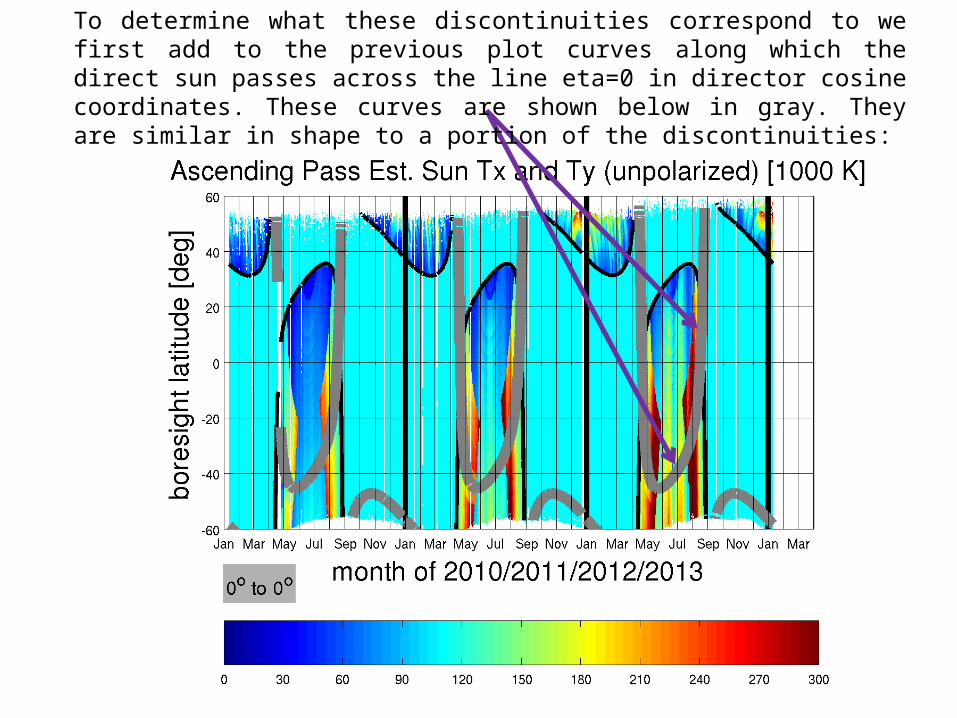
To determine what these discontinuities correspond to we first add to the previous plot curves along which the direct sun passes across the line eta=0 in director cosine coordinates. These curves are shown below in gray. They are similar in shape to a portion of the discontinuities:
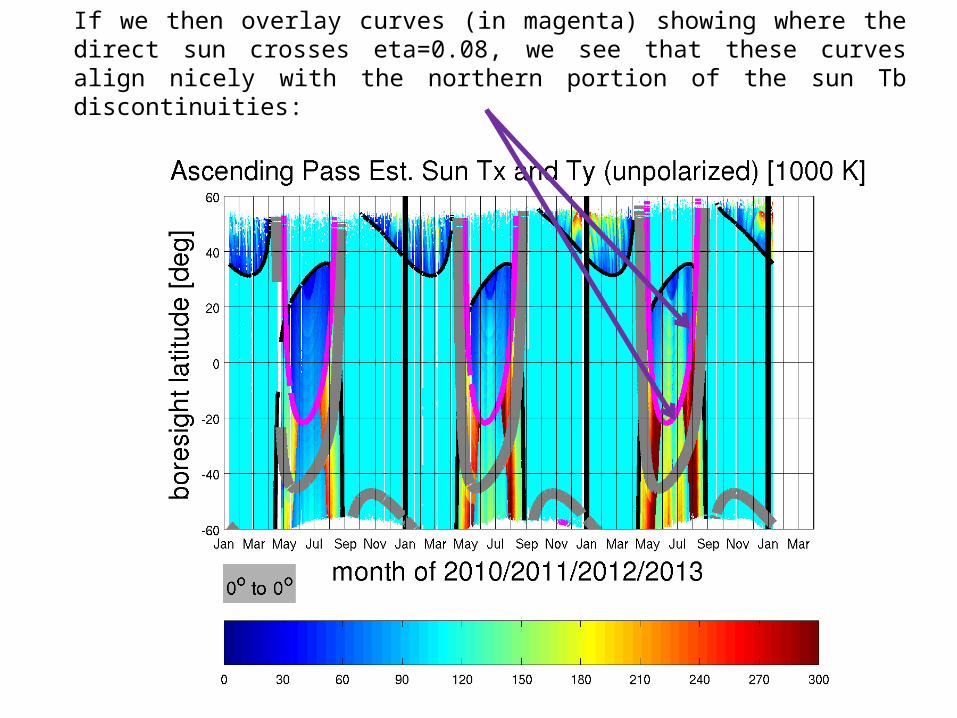
If we then overlay curves (in magenta) showing where the direct sun crosses eta=0.08, we see that these curves align nicely with the northern portion of the sun Tb discontinuities:

If we then overlay, in dahsed magenta, curves along which the direct sun crosses xi=0.985, we see that these curves align nicely with the remaining portions of the discontinuities:

If we then map these discontinuities back onto director cosine coordinates, we obtain the black curve shown here, which clearly shows how the discontinuities correspond to the sun crossing specific portions of the FOV.
For reference we also show the paths of the sun through example ascending passes on 15 May and 20 July 2010.
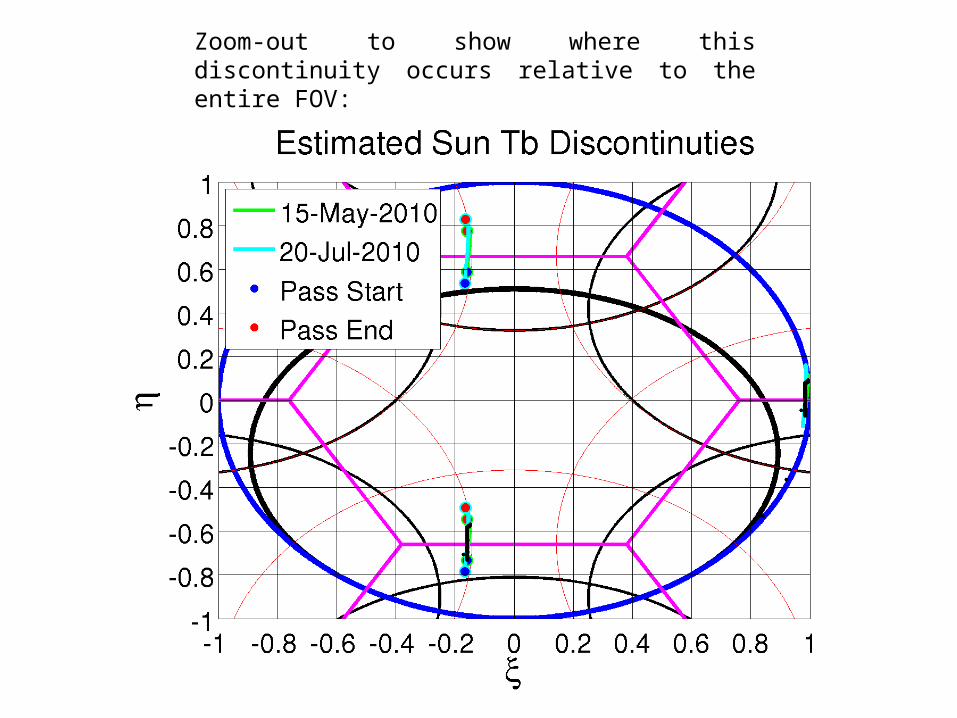
Zoom-out to show where this discontinuity occurs relative to the entire FOV:

Next consider an example half orbit from May 16, 2012 that exhibits a strong jump in the estimated sun brightness temperature:

When we do not attempt to remove the sun, the brightness temperatures in the vicinity of the sun aliases is similar before and after the jump:
BEFORE JUMP

AFTER JUMP
When we do not attempt to remove the sun, the brightness temperatures in the vicinity of the sun aliases is similar before and after the jump:
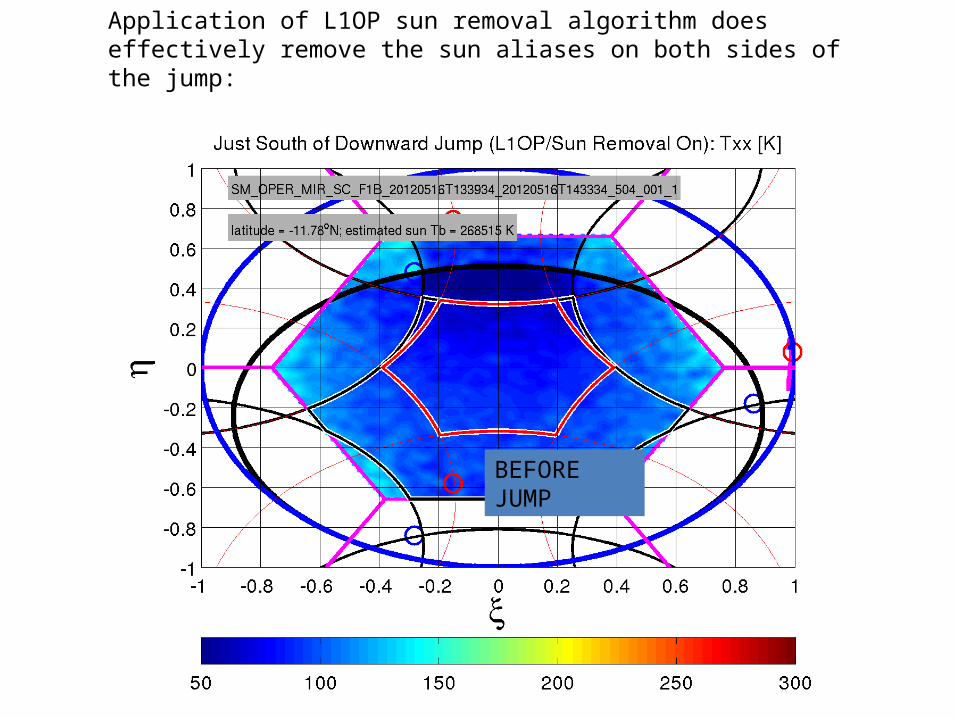
Application of L1OP sun removal algorithm does effectively remove the sun aliases on both sides of the jump:
BEFORE JUMP

Application of L1OP sun removal algorithm does effectively remove the sun aliases on both sides of the jump:
AFTER JUMP

There is no corresponding discontinuity in the AF-FoV mean biases, however:
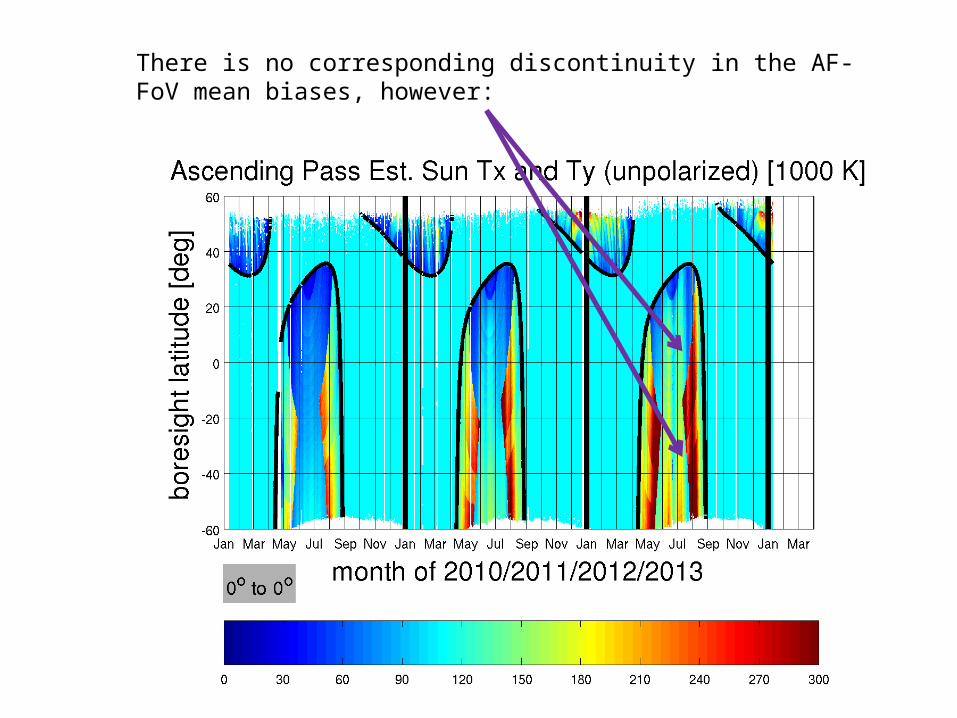
There is no corresponding discontinuity in the AF-FoV mean biases, however:

EXTRA SLIDES


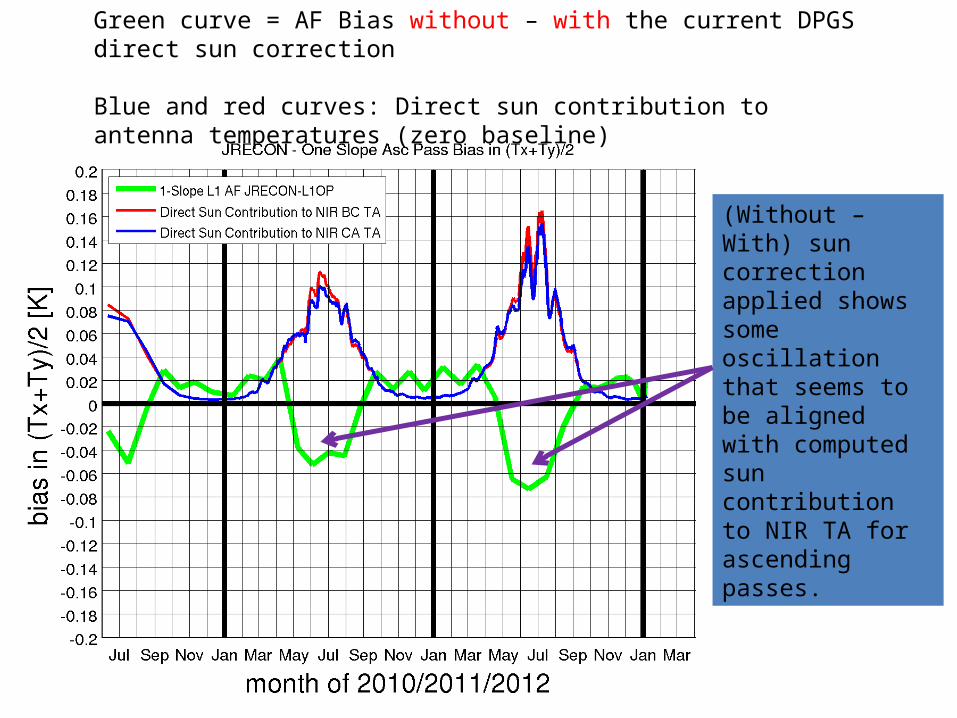
Green curve = AF Bias without – with the current DPGS direct sun correction
Blue and red curves: Direct sun contribution to antenna temperatures (zero baseline)
(Without – With) sun correction applied shows some oscillation that seems to be aligned with computed sun contribution to NIR TA for ascending passes.

Green curve = AF Bias without – with the current DPGS direct sun correction
Blue and red curves: Direct sun contribution to antenna temperatures (zero baseline)
But any correspondence is less clear for descending passes…

ANOTHER STRATEGY IS TO COMPARE NIR AND AF FOV BIAS EVOLUTIONS IN 2010,
2011, and 2012
DIRECT SUN IMPACT SHOULD BE DIFFERENT FROM YEAR TO YEAR

Here