A Revealer of Secrets in the Data of Life and the Universe · Quanta Magazine April 11, 2018 A...
8
Quanta Magazine https://www.quantamagazine.org/donald-richards-seeks-patterns-in-the-data-of-life-and-the-universe-20180411/ April 11, 2018 A Revealer of Secrets in the Data of Life and the Universe The statistician Donald Richards lives to uncover subtle patterns hiding in real-world data. By Natalie Wolchover Jessica Kourkounis for Quanta Magazine Donald Richards at Pennsylvania State University, where he is a professor of statistics, in February. In statistics, abstract math meets real life. To find meaning in unruly sets of raw numbers, statisticians like Donald Richards first look for associations: statistical links between, say, smoking and lung cancer, or the closing values of the New York Stock Exchange one day and the Tokyo
Transcript of A Revealer of Secrets in the Data of Life and the Universe · Quanta Magazine April 11, 2018 A...
Quanta Magazine
https://www.quantamagazine.org/donald-richards-seeks-patterns-in-the-data-of-life-and-the-universe-20180411/ April 11, 2018
A Revealer of Secrets in the Data of Life and theUniverseThe statistician Donald Richards lives to uncover subtle patterns hiding in real-world data.
By Natalie Wolchover
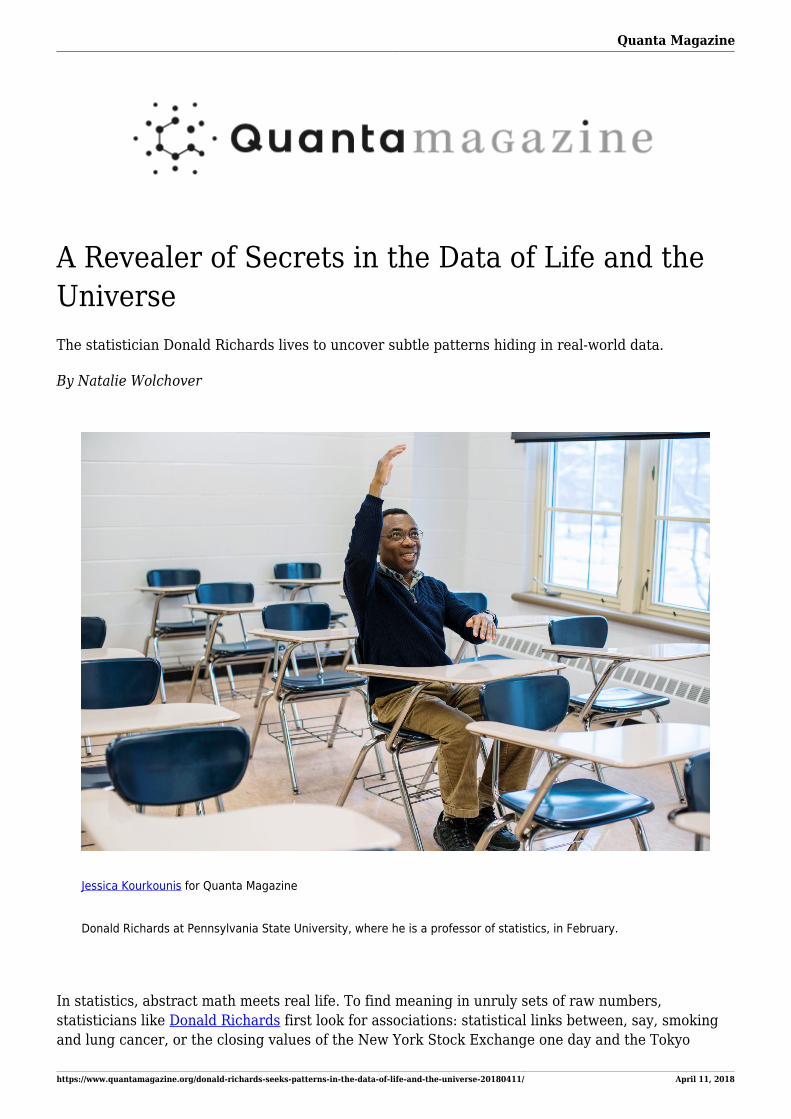
Jessica Kourkounis for Quanta Magazine
Donald Richards at Pennsylvania State University, where he is a professor of statistics, in February.
In statistics, abstract math meets real life. To find meaning in unruly sets of raw numbers,statisticians like Donald Richards first look for associations: statistical links between, say, smokingand lung cancer, or the closing values of the New York Stock Exchange one day and the Tokyo

Quanta Magazine
https://www.quantamagazine.org/donald-richards-seeks-patterns-in-the-data-of-life-and-the-universe-20180411/ April 11, 2018
exchange the next. Further study can then probe whether one phenomenon causes the other, or ifboth have common causes.
“Statistics is a way of analyzing data and discovering the inner hidden secrets being concealed bythe data,” Richards said over Skype from his home in Pennsylvania in January. “Can we find patternsthat tell us that climate change is underway? Can we find patterns that suggest that bitcoin hastopped out? That’s what we’re constantly searching for — patterns.”
The patterns can be subtle. However, the search for them is not esoteric, in his view, but rather “theonly thing that anybody with brains should be doing with their life.”
In the lilt of his native Jamaica, Richards, 63, describes statisticians as innovators, ever in search ofnew mathematical tools for finding hidden associations between phenomena, and thus furthering theancient quest to link causes and effects. How, for example, did people first figure out what theycould eat? “In Jamaica there’s a tree called the ackee tree,” he said. “When the ackee fruit is notripe, it’s highly poisonous, but [as a deadly search for correlations must have revealed] when it’sripe, if cleaned properly it can be cooked and eaten.”
Throughout a career that has taken him to the universities of the West Indies, North Carolina,Wyoming, Virginia and Pennsylvania State University in State College, where he is currently aprofessor, Richards has derived many new mathematical formulas for use in statistics. He has alsoapplied them to sleuth out correlations in real data, such as galaxy surveys, financial derivatives,agricultural data and the Affordable Care Act insurance market. A formula that he proved with hismentor and longtime collaborator, Kenneth Gross, in the 1980s assisted in the development ofcellphone data transmission protocols that made calls statistically less likely to drop. “Every time Isee someone using a cellphone I wonder if I can get them to fork over just one cent,” he joked.
Lately, Richards has taken up a powerful new tool for detecting correlations, the “distancecorrelation” method. In 2014, he and his wife, the Jamaican-American astrophysicist MercedesRichards, and a third coauthor applied the distance correlation method to detect previouslyunknown associations among 63,500 galaxies – identifying, for instance, that some were “starburstgalaxies” that quickly burn themselves up.
Real life also has a way of intruding in unwelcome ways. Mercedes died in 2016 at the age of 60, andGross died last year at 78. Richards wears his grief on his sleeve, even as he revels in the joy ofstatistics. After the January interview, Quanta followed up with Richards by phone in March. Thefollowing questions and answers have been edited and condensed for clarity.
Growing up in Jamaica, did you always enjoy math?
My mother was very good at mathematics. Because she was a teacher, learning did not stop simplybecause school was out. During the summer her three sons, and even our friends from neighboringhomes, if they wanted to play with us, were required to do schoolwork at our house from 9 until 12.After lunch, the rest of the day was ours.
One summer, when I was 10, she had me work through chapters of one of her old algebra books,Higher Algebra by Hall and Knight. I didn’t understand it; it was just silly algebra. I had no reason tothink it was useful for anything. But then the next summer, she said, “Why don’t you start with Halland Knight again.” And the second time those chapters were a lot easier to handle.
In high school, at Kingston College, I hit the jackpot with a superb math teacher in third form [theequivalent of ninth grade]. In fourth form, I hit the jackpot again as I had another superb math

Quanta Magazine
https://www.quantamagazine.org/donald-richards-seeks-patterns-in-the-data-of-life-and-the-universe-20180411/ April 11, 2018
teacher. Then in fifth form, I hit the Powerball; I had a superb math teacher who taught me for threeyears straight [Kingston goes up to grade 13]. So coming out of high school I had one of the bestpreparations possible for a math student in Jamaica, and I would dare say anywhere in the BritishCommonwealth, and maybe even in the British Empire.
Yet you were the only student in your math cohort to pursue it academically.Why is that?
There was a tendency in Jamaica for people to shy away from mathematics because of the economicconsiderations. Incomes would tend to be substantially smaller than if you were to become, say, adoctor, lawyer or engineer.
Jessica Kourkounis for Quanta Magazine
How did you find your way to statistics?
When I went to the University of the West Indies, mathematics was everything. If I had tried to studyphysics or chemistry or biology or law or medicine, I would have been a complete failure. I took acourse on probability and statistics in my second year from Rameshwar Gupta, who eventuallybecame my thesis adviser. He was an expert in multivariate analysis [which concerns therelationships between many variables], and so that became my field. I’m a great believer in workingwith people I like. And I could also see that there were lots of interesting mathematics problemsworking with him, so it was the best of both worlds.
That’s how I got into statistics, but I didn’t really become a statistician until I was fairly close to

Quanta Magazine
https://www.quantamagazine.org/donald-richards-seeks-patterns-in-the-data-of-life-and-the-universe-20180411/ April 11, 2018
getting tenure at the University of North Carolina. I knew all the formulas, but the art and joy ofanalyzing data did not really hit home until then. Before that, I was basically just a mathematicianpretending to be a statistician.
What’s the difference between a mathematician and a statistician?
It’s so hard to decide where the boundaries lie, but I would say that mathematics is a field thatspecializes in deductive logic: They lay down a bunch of axioms and then they try to deduce thelogical consequences of those axioms. Two points define a line, and so on and so forth, and then offyou go. Whereas statistics is more the art of inductive logic: We look at the end result and we try tounderstand what could have caused such an end result.
We “mathematical statisticians” come up with formulas that help with the inductive aspect of ourdata analyses. Let me try and give you a simple example: Suppose I have a coin in my hand and Iask, is the coin a fair coin or is it biased toward heads or tails? What we would do is toss the coin100 times, and if the percentage of heads is too far from one-half in either direction then we wouldbe inclined to say that the coin seems to be unfair. But the question is, how far is too far? Supposewe got 48 percent heads. How about 40 percent heads? The question of how far from one-half is toofar is answered by using various mathematical formulas and probabilistic calculations.
So, how far is too far? I would guess 40.
You made a very good guess! I am very impressed! This question has consumed people’s attentionfor centuries. My cardinal rules are: If a coin is tossed 100 times and the number of heads is zero to40, or 60 to 100, then you have strong statistical evidence that the coin is biased. Moreover,depending on how much money is at stake, if you get 41 or 59 heads, then you’re well-advised toleave the casino immediately. Even at 42 or 58 heads, you should be nervous about the tosser.
When people come to you for advice, you tell them to stick to the middle roadin most endeavors. What do you mean by that?

Quanta Magazine
https://www.quantamagazine.org/donald-richards-seeks-patterns-in-the-data-of-life-and-the-universe-20180411/ April 11, 2018
Jessica Kourkounis for Quanta Magazine
You go safest in the middle course. My advice to go with the middle course is taken from BenjaminGraham’s book, The Intelligent Investor, a book whose acolytes generally do very well in thefinancial markets. If people know nothing about financial matters, it would be my advice for them togo with large mutual funds that are widely diversified and do very little trading. Not trying to maketons of money overnight. Don’t buy bitcoin. Don’t buy anything that’s newfangled, by the way. Thereare people who make huge amounts of money buying newfangled stuff, but the bulk of people whodo that eventually go broke.
People, even some statisticians, might be surprised to learn there’s agroundbreaking new mathematical tool for finding statistical relationships —the distance correlation method.
Without a doubt there have been innovations. Let me explain the situation regarding the concept ofcorrelation. People like Karl Pearson and Francis Galton in the late 1800s pioneered the concept ofwhat we now call the Pearson correlation coefficient, the widely used measure of correlation.
Galton studied the correlation between heights of fathers and heights of sons,right?
Yes. Galton was trying to understand how to grow a wonderful human body — bigger, taller,stronger, faster, more intelligent. And so he took a large collection of fathers and sons and plottedthe data — you can find the scatter plots on the internet, actually — and he fit a straight line through

Quanta Magazine
https://www.quantamagazine.org/donald-richards-seeks-patterns-in-the-data-of-life-and-the-universe-20180411/ April 11, 2018
the data, finding that if your father is tall then you are likely to be tall. This method, which KarlPearson formalized in what’s now known as the Pearson correlation coefficient, has its advantages.But it also has flaws. For example, it can be applied only when you’re trying to study the relationshipbetween one-dimensional variables — between height and weight, or height of father and height ofson. If you want to study the correlation between one batch of variables and another batch, thenthere is no single Pearson correlation to measure the strength of an association. A second problem,which people often overlook in everyday applications, is that the Pearson correlation coefficientshould be used only when there is a reasonably linear relationship between the two variables. If therelationship is highly nonlinear then this method is inapplicable.
What’s an example of a nonlinear relationship between variables?
Height and age. Imagine that I take a human being and I measure their height from birth toadulthood. It’s an S-shaped curve, right? A linear relationship does not apply.
It seems like there might be more cases like that than linear relationships.
I guarantee you that the bulk of applications of the Pearson correlation coefficient are invalid. Oftenit’s being used where it’s really not helpful, and leading to conclusions that are not supported by thedata. Health data, financial data, astrophysical data, meteorological data: People just jump right inand start using Pearson’s correlation without any thought to whether there is any plausibly linearrelationship between the variables.
We’ve been aware for a long, long time of the need for a correlation coefficient that can be appliedregardless of whether there is a linear or nonlinear relationship, and can be applied when we havebatches of variables on both sides. And that’s where the distance correlation came in. Around 2007,Gábor Székely, Maria Rizzo and Nail Bakirov wrote these papers in which they defined the conceptof distance correlation and applied it to data. And when I saw those papers I said, “Aha! I know howto apply this to astrophysical data.” And it was exactly to the data that my wife, Mercedes, ElizabethMartínez-Gómez [of the Autonomous Technology Institute of Mexico] and I had been thinking about.

Quanta Magazine
https://www.quantamagazine.org/donald-richards-seeks-patterns-in-the-data-of-life-and-the-universe-20180411/ April 11, 2018
Courtesy of Donald Richards
Donald and Mercedes Richards in 2015 during a visit to the Heidelberg Institute for Theoretical Studies in Germany.
Are you continuing your studies of astrophysical data?
Mercedes and I were going to write a third paper on distance correlation for other astrophysicaldata. I have the notes on that, and I need to do it. But as you can imagine, every time I look at it Ifeel a little bit… well, the word that comes to mind is “depressed.” But that’s something I reallyshould finish. Ken Gross and I were going to write another paper on what’s called thehypergeometric functions of matrix argument. We worked on it for 20 years; I have hundreds ofpages of notes. That paper will be over 100 pages long, and I need to sit down and do it.
At this very moment, two coauthors and I are revising a manuscript that will provide applications ofdistance correlation to manufacturing processes. We have found ways of applying the method todetermine whether processes are in control or not, meaning the average number of defects perproduct is below a certain threshold.
How does distance correlation work?
This is where the concept of a Fourier transform comes in. A Fourier transform is a way of breakingup a mathematical function into its component frequencies, similar to how a music chord can bedecomposed into its constituent notes. All functions can be uniquely characterized by Fouriertransforms, so people started to try to define the concept of a measure of correlation by usingFourier transforms. If you give me two probability distributions — the statistical spread of valuesthat a variable takes on — and if I want to test whether the two distributions are the same, all I haveto do is calculate their Fourier transforms. If these are equal then I know that the two probabilitydistributions had to be equal to begin with. The distance correlation coefficient, in layman’s terms, isa measure of how far apart these Fourier transforms are.
You wrote a paper last year giving examples where distance correlationimproves on Pearson’s method. Talk about the case of homicide rates andstate guns laws.
This was prompted by an opinion piece in The Washington Post in 2015, by Eugene Volokh, aprofessor of law at UCLA. The title of the article is “Zero Correlation Between State Homicide Rateand State Gun Laws.” What he did was — you know, my eyes bugged out; I couldn’t believe it — hefound some data on the states’ Brady scores, which are ratings based on the toughness of their gunlaws, and he plotted the Brady scores on an x-y plot against the homicide rates in each of thesestates. And if you look at the plot, it looks like there’s no pattern. He used Excel or something to fit astraight line to this data set, and he calculated the Pearson correlation coefficient for this data set,and it came out to be nearly zero. And he said, “Aha, zero correlation between state homicide rateand state gun laws.”
That’s not kosher?
I was horrified. There are so many things wrong with this analysis. The first thing you notice in thescatter plot is that there’s one dot which is way, way out from the others, with both a high Bradyscore and high homicide rate. That turns out to be the District of Columbia, which is not a state; it’s

Quanta Magazine
https://www.quantamagazine.org/donald-richards-seeks-patterns-in-the-data-of-life-and-the-universe-20180411/ April 11, 2018
really a city, so if you include it in the analysis, because it’s so far away from everybody else, it’sgoing to have a major effect on the slope of the regression line. That’s the first complaint; he shouldhave removed that data point — you learn that in Stat 100. If you remove it and refit the linearregression line, the Pearson correlation is not zero, actually.
But should you even fit a linear regression line to this data set? If you look at the rest of the data,you don’t see any linearity to the relationship, and it’s easy to understand why: There are bunches ofpoints that correspond to geographic and culturally similar regions. If you break up the states byregion, then you see reasonably linear relationships starting to show up in the scatter plots. Andthen in each case, you find that the higher the Brady score, the lower the homicide rate.
Distance correlation does an even better job without having to split things up,right?
Exactly. My wife and I did these calculations in the fall of ’15, when we saw the opinion piece. Shewas a whiz at computer programming — I miss her just for that! It’s a silly reason to miss her, don’tyou think? She calculated the distance correlation coefficient. And even with the District ofColumbia included, it signaled that there was a statistically significant relationship between Bradyscores and homicide rates.
There are so many examples like that of statistics getting misused in publicdiscourse. I wonder whether you spend time thinking about how to improvethe use of statistics by nonexperts.
Yes, there are these horrifying misapplications of statistics. And I have to tell you the truth:Sometimes I just give up. It just never stops, the number of misapplications. As an educator I know Ihave a duty to continually educate the world. But I’m just one little guy. At some point, you knowwhat, I’m going to go cook myself a nice dinner and have a glass of wine and let the world dowhatever it wants.
Do you hope that by developing better tools — like distance correlation — thateventually these methods will seep out into more common use?
Yes, I hope so. And in fact, I have heard that one of the big pharmaceutical companies is nowstarting to use distance correlation methods. And I know that people in academia are using it more. Ihope to live long enough to see distance correlation be a standard pulldown tab in Excel, or if notExcel, certainly on Wolfram Alpha. You enter your x-y data, and boom: It gives you the distancecorrelation. I live for that day!