
A Retinoic Acid Rich Tumor Microenvironment Provides ... · Microenvironment and Immunology A...
11
Microenvironment and Immunology A Retinoic Acid — Rich Tumor Microenvironment Provides Clonal Survival Cues for Tumor-Specific CD8 þ T Cells Yanxia Guo 1 , Karina Pino-Lagos 1 , Cory A. Ahonen 1 , Kathy A. Bennett 1 , Jinshan Wang 3 , Joseph L. Napoli 3 , Rune Blomhoff 5 , Shanthini Sockanathan 6 , Roshantha A. Chandraratna 4 , Ethan Dmitrovsky 2 , Mary Jo Turk 1 , and Randolph J. Noelle 1,7 Abstract While vitamin A has been implicated in host resistance to infectious disease, little is known about the role of vitamin A and its active metabolite, retinoic acid (RA) in host defenses against cancer. Here, we show that local RA production within the tumor microenvironment (TME) is increased up to 5-fold as compared with na € ve surrounding tissue, with a commensurate increase in RA signaling to regionally infiltrating tumor-reactive T cells. Conditional disruption of RA signaling in CD8 þ T cells using a dominant negative retinoic acid receptor a (dnRARa) established that RA signaling is required for tumor-specific CD8 þ T-cell expansion/accumulation and protective antitumor immunity. In vivo analysis of antigen-specific CD8 þ T-cell responses revealed that early T- cell expansion was RA-independent; however, late T-cell expansion and clonal accumulation was suppressed strongly in the absence of RA signaling. Our findings indicate that RA function is essential for the survival of tumor-reactive CD8 þ T cells within the TME. Cancer Res; 72(20); 5230–9. Ó2012 AACR. Introduction The morphogenic role of the active form of vitamin A, retinoic acid (RA), in controlling spatial and temporal developmental patterning has underscored the powerful and essential function of this mediator during embryogenesis (1, 2). Similarly, within the immune system, RA has been shown to exert profound effects as a differentiation factor in inducing gut homing of leukocytes (3–6), the differentiation and stability of adaptive regulatory T cells (7–9), the differentiation of CD4 þ T cells toward T-helper 1(T H 1)/T H 17 cells (10, 11), IgA class switching in B cells (6), and the differentiation of myeloid cells (12, 13). It has been proposed that regionalized production of RA is critical for its role as an immune differentiation factor (11). Genetic approaches of ablating RA signaling in T cells have established how RA influences CD4 þ T-cell response in vivo (10, 11), but little is known about its role in governing CD8 þ T-cell respon- siveness. Given the well-recognized role of RA in supporting T- cell responses, and the need for robust T-cell responses in the development of protective antitumor immunity (14), the role of RA in the host resistance against cancer was addressed with a focus on CD8 þ T-cell expansion and function. The studies presented herein show that RA is abundantly produced within the tumor microenvironment (TME) and accumulates to levels much higher than in surrounding tissue. Selective disruption of RA signaling in CD8 þ T cells incapacitates their ability to undergo effective clonal expansion in vivo and as such, inter- feres with the development of protective antitumor immunity. Materials and Methods Animals C57BL/6 (CD45.1) and C57BL/6 (CD45.2) were purchased from National Cancer Institute (Bethesda, MD). CD4 Cre and OTI transgenic mice were from Jackson Laboratory. The DR5- Luciferase (4) and dominant negative retinoic acid receptor a (dnRARa) mice (15) are as previously described. All animals were maintained in a pathogen-free facility at Geisel School of Medicine at Dartmouth (Hanover, NH). Tumor B16.Ovalbumin (B16.OVA) melanoma cell line was genera- ted (16) by overexpressing chicken OVA-RFP in B16-F10 (obtained from Mary Jo Turk in 2005). B16.OVA was trans- duced with plasmid containing DR5-Luciferase to generate B16.OVA-DR5-Luciferase cell line. Both cell lines were period- ically authenticated by morphologic inspection and tested negative for Mycoplasma contamination by PCR tests in 2008 to 2012, and last time tested in February 2012. For tumor growth curve measurement, 0.5 10 5 B16.OVA cells were injected into mice intradermally and measured 3 times a week. Authors' Affiliations: 1 Department of Microbiology and Immunology, The Geisel School of Medicine at Dartmouth, Norris Cotton Cancer Center, Lebanon, New Hampshire; 2 Department of Pharmacology and Toxicology, The Geisel School of Medicine at Dartmouth, Hanover, New Hampshire; 3 Program in Metabolic Biology, Nutritional Science and Toxicology, Univer- sity of California-Berkeley, Berkeley; 4 IO Therapeutics, Santa Ana, California; 5 Department of Nutrition, Institute of Basic Medical Sciences, University of Oslo, Oslo, Norway; 6 The Solomon H. Snyder Department of Neuroscience, Johns Hopkins University School of Medicine, Baltimore, Maryland; and 7 Medical Research Council Centre of Transplantation, Guy's Hospital, King's College London, King's Health Partners, London, United Kingdom Note: Supplementary data for this article are available at Cancer Research Online (http://cancerres.aacrjournals.org/). Corresponding Author: Randolph J. Noelle, Norris Cotton Cancer Center, One Medical Center Drive, Rubin Bldg., Room 730, Lebanon, NH 03755. Phone: 603-653-9908; Fax: 603-653-9952; E-mail: [email protected] doi: 10.1158/0008-5472.CAN-12-1727 Ó2012 American Association for Cancer Research. Cancer Research Cancer Res; 72(20) October 15, 2012 5230 on May 30, 2020. © 2012 American Association for Cancer Research. cancerres.aacrjournals.org Downloaded from Published OnlineFirst August 17, 2012; DOI: 10.1158/0008-5472.CAN-12-1727
Transcript of A Retinoic Acid Rich Tumor Microenvironment Provides ... · Microenvironment and Immunology A...
Microenvironment and Immunology
A Retinoic Acid—Rich Tumor Microenvironment ProvidesClonal Survival Cues for Tumor-Specific CD8þ T Cells
Yanxia Guo1, Karina Pino-Lagos1, Cory A. Ahonen1, Kathy A. Bennett1, Jinshan Wang3, Joseph L. Napoli3,Rune Blomhoff5, Shanthini Sockanathan6, Roshantha A. Chandraratna4, Ethan Dmitrovsky2, Mary Jo Turk1,and Randolph J. Noelle1,7
AbstractWhile vitamin A has been implicated in host resistance to infectious disease, little is known about the role of
vitamin A and its activemetabolite, retinoic acid (RA) in host defenses against cancer. Here, we show that local RAproduction within the tumor microenvironment (TME) is increased up to 5-fold as compared with na€�vesurrounding tissue, with a commensurate increase in RA signaling to regionally infiltrating tumor-reactive T cells.Conditional disruption of RA signaling in CD8þ T cells using a dominant negative retinoic acid receptor a(dnRARa) established that RA signaling is required for tumor-specific CD8þ T-cell expansion/accumulation andprotective antitumor immunity. In vivo analysis of antigen-specific CD8þ T-cell responses revealed that early T-cell expansion was RA-independent; however, late T-cell expansion and clonal accumulation was suppressedstrongly in the absence of RA signaling. Our findings indicate that RA function is essential for the survival oftumor-reactive CD8þ T cells within the TME. Cancer Res; 72(20); 5230–9. �2012 AACR.
IntroductionThemorphogenic role of the active formof vitaminA, retinoic
acid (RA), in controlling spatial and temporal developmentalpatterning has underscored the powerful and essential functionof this mediator during embryogenesis (1, 2). Similarly, withinthe immune system, RA has been shown to exert profoundeffects as a differentiation factor in inducing gut homing ofleukocytes (3–6), the differentiation and stability of adaptiveregulatory T cells (7–9), the differentiation of CD4þ T cellstoward T-helper 1(TH1)/TH17 cells (10, 11), IgA class switchingin B cells (6), and the differentiation of myeloid cells (12, 13). Ithas been proposed that regionalized production of RA is criticalfor its role as an immune differentiation factor (11). Geneticapproaches of ablating RA signaling in T cells have establishedhow RA influences CD4þ T-cell response in vivo (10, 11), butlittle is known about its role in governing CD8þ T-cell respon-
siveness. Given the well-recognized role of RA in supporting T-cell responses, and the need for robust T-cell responses in thedevelopment of protective antitumor immunity (14), the role ofRA in the host resistance against cancer was addressed with afocus on CD8þ T-cell expansion and function. The studiespresented herein show that RA is abundantly produced withinthe tumor microenvironment (TME) and accumulates to levelsmuch higher than in surrounding tissue. Selective disruption ofRA signaling in CD8þ T cells incapacitates their ability toundergo effective clonal expansion in vivo and as such, inter-feres with the development of protective antitumor immunity.
Materials and MethodsAnimals
C57BL/6 (CD45.1) and C57BL/6 (CD45.2) were purchasedfrom National Cancer Institute (Bethesda, MD). CD4Cre andOTI transgenic mice were from Jackson Laboratory. The DR5-Luciferase (4) and dominant negative retinoic acid receptor a(dnRARa) mice (15) are as previously described. All animalswere maintained in a pathogen-free facility at Geisel School ofMedicine at Dartmouth (Hanover, NH).
TumorB16.Ovalbumin (B16.OVA) melanoma cell line was genera-
ted (16) by overexpressing chicken OVA-RFP in B16-F10(obtained from Mary Jo Turk in 2005). B16.OVA was trans-duced with plasmid containing DR5-Luciferase to generateB16.OVA-DR5-Luciferase cell line. Both cell lines were period-ically authenticated by morphologic inspection and testednegative for Mycoplasma contamination by PCR tests in2008 to 2012, and last time tested in February 2012. For tumorgrowth curve measurement, 0.5 � 105 B16.OVA cells wereinjected intomice intradermally andmeasured 3 times a week.
Authors' Affiliations: 1Department of Microbiology and Immunology, TheGeisel School of Medicine at Dartmouth, Norris Cotton Cancer Center,Lebanon, New Hampshire; 2Department of Pharmacology and Toxicology,The Geisel School of Medicine at Dartmouth, Hanover, New Hampshire;3Program in Metabolic Biology, Nutritional Science and Toxicology, Univer-sity of California-Berkeley, Berkeley; 4IO Therapeutics, Santa Ana, California;5Department of Nutrition, Institute of Basic Medical Sciences, University ofOslo, Oslo, Norway; 6The Solomon H. Snyder Department of Neuroscience,Johns Hopkins University School of Medicine, Baltimore, Maryland; and7Medical ResearchCouncil Centre of Transplantation,Guy'sHospital, King'sCollege London, King's Health Partners, London, United Kingdom
Note: Supplementary data for this article are available at Cancer ResearchOnline (http://cancerres.aacrjournals.org/).
Corresponding Author:Randolph J. Noelle, Norris Cotton Cancer Center,One Medical Center Drive, Rubin Bldg., Room 730, Lebanon, NH 03755.Phone: 603-653-9908; Fax: 603-653-9952; E-mail:[email protected]
doi: 10.1158/0008-5472.CAN-12-1727
�2012 American Association for Cancer Research.
CancerResearch
Cancer Res; 72(20) October 15, 20125230
on May 30, 2020. © 2012 American Association for Cancer Research. cancerres.aacrjournals.org Downloaded from
Published OnlineFirst August 17, 2012; DOI: 10.1158/0008-5472.CAN-12-1727
For whole body imaging (WBI), OVA-tetramer staining andIFN-g enzyme-linked immunosorbent spot (ELISPOT) assay,1.5� 105 B16.OVA cells were injected. To deplete CD4þ T cells,mice received 250 mg aCD4 (clone GK1.5, BioXcell). For pan-RAR antagonist treatment, recipient mice were treated intra-peritoneally (i.p.) 3 times per week with control vehicle[dimethyl sulfoxide (DMSO)] or 25 mg/mouse Pan-RAR antag-onist (NRX 194310, NuRX Pharmaceuticals).
Monoclonal antibodiesThe following FITC-, PE-, PerCP-, APC-Cy7-, Pacific Blue-
or APC-conjugated antibodies were used: a-CD45.1 (A20),a-CD45.2 (104), a-CD8 (53–6.7), a-CD11c (N418), a-CD62L(Mel-14), a-CD11b (M1/70), a-CD44 (IM7), a-MHCII (M5),a-IFN-g (XMG1.2), a-CD69 (H1.2F3), a-BrdUrd (PRB-1), anda-a4b7 (DATK32). All antibodies were purchased fromBioLegend except a-BrdUrd and anti-a4b7 (BD Biosciences).MitoTracker Green was purchased from Invitrogen. 7-AAD(BD Biosciences) or LIVE/DEAD Fixable Near-IR Dead CellStain Kit (Invitrogen) was used to exclude dead cells influorescence-activated cell sorting (FACS) analysis.
Imaging and luciferase assayWBI and luciferase activity of purified cells (5 � 105 cells
per well) was conducted as previously described (11). Forin vitro cultured B16.OVA-DR5-Luciferase tumor cells, cellswere cultured for 24 hours with RA and Pan-RAR antagonist(2.5 mg/mL), plated at 1 � 106 cells per well, administratedD-luciferin at 150 mg/mL, and imaged. Analysis and imageswere obtained using the Living Image Software (version 2.6.1).
All-trans retinoic acid measurementTumor, tumor-draining lymph node (TDLN), and spleen
were taken from day 6 B16.OVA-bearing or na€�ve mice. Liquidchromatography/tandem mass spectrometry (LC/MS-MS)was used as described previously to measure all-trans retinoicacid (ATRA) concentration (17).
RALDH activity analysisRALDH activity in individual cells was estimated using
ALDEFLUOR staining kits (StemCell Technologies), accordingto the manufacturer's protocol as previously described (18).For immunophenotyping of ALDHbri cells, the cells weresubsequently stained with PE-, PerCP-, APC-, PE-Cy7-, orAPC-Cy7–conjugated monoclonal antibody (mAb) in ice-coldALDEFLUOR assay buffer. Cells were analyzed using FACSCalibur or MACS Quant (Miltenyi Biotech).
Bone marrow chimera miceC57BL/6 (CD45.1) or DR5-Luciferase (CD45.2) mice were
lethally irradiated and received 5 � 106 bone marrow cellsharvested from DR5-Luciferase and C57BL/6 (CD45.1), respec-tively. Reconstitution was confirmed 8 weeks later by stainingwith a-CD45.1 and a-CD45.2. All BMCs exceeded 96% recon-stitution efficiency.
ImmunizationdnRARa and dnRARaCD4Cre mice were immunized with
500 mg Ovalbumin (Sigma–Aldrich), 50 mg aCD40 (BioX-
cell), and 50 mg polyI:C (InvivoGen) by intraperitonealinjection.
Analysis ofMHC-I tetramer and IFN-gbyflow cytometeryMHCI-I tetramer and IFN-g staining was conducted as
previously described (19). Four-color FACS data were collectedon a BD FACSCalibur flow cytometer and analyzed usingFlowJo software. Analysis typically pregated on CD8þMHCII�
cells.
ELISPOT assayELISPOT was done according to the procedures described
previously (20). Briefly, CD8þ effector T cells were harvestedfrom spleen, TDLN, or tumor-infiltrating lymphocytes (TIL) ofday 12 B16.OVA-bearing mice, and plated at 1:1 ratio withirradiated T-cell–depleted C57BL/6 splenocytes pulsedwith 10mg/mL SIINFEKL peptide (or without peptide as control).Plates were incubated for 20 hours at 37�C and then developedwith aminoethylcarbazole chromogen.
Phenotype analysis of OVA-specific CD8þ T cellsEnrichment was done at different time points as described
previously (21) and stained as described in the text.
Statistical analysisData graphs weremade using GraphPad Prism software and
expressed as the mean � SEM or mean � SD. Differences forgraphs with one grouping variables were analyzed by Student ttest (2 groups). For studies of B16.OVA tumor growth and OVAtetramer kinetics, 2-way ANOVA was used to assess signifi-cance. In all analysis, � ,P< 0.05; ��, P< 0.01; ���, P< 0.001, and nsdenotes P > 0.05.
ResultsHeightened RA signaling and RA synthesis within theTME
We previously reported that inflammatory mediatorsinduced a spatially and temporally restricted induction of RAsynthesis and signaling in vivo (11). To determine if tumorgrowth in vivo induced restricted and heightened RA signalingand synthesis, a tumor that reports RA signalingwas injected invivo. During the growth of B16.OVA-DR5-Luciferase, in whichthe RA response element, DR5 repeat, is coupled to a luciferasereporter, an increase of RA signaling over the tumor growthcourse (Fig. 1A) was observed. The reporting signal was RA-dependent, as it was inhibited by the administration of pan-RAR antagonist (NRX 194310; data not shown). The same RAreporting signal was also observed using B16-DR5-Luciferasecells, indicating that expression of OVA was not critical forinduction of RA (data not shown). To confirm that enhancedRA synthesis at the tumor site was induced during tumorgrowth, DR5-Luciferase transgenic reporter mice were used,which express DR5-luciferase in all tissues (4). B16.OVA tumorcells were injected into DR5-Luciferase mice and RA signalingcould be readily detected primarily at the growing tumor siteby day 6 (Fig. 1B). The induced RA signaling was also observedin other tumormodels, such as EL4 thymoma, MB49 urothelialcacrcinoma, and B16 melanoma (data not shown). To
Retinoic Acid and Tumor Immunity
www.aacrjournals.org Cancer Res; 72(20) October 15, 2012 5231
on May 30, 2020. © 2012 American Association for Cancer Research. cancerres.aacrjournals.org Downloaded from
Published OnlineFirst August 17, 2012; DOI: 10.1158/0008-5472.CAN-12-1727
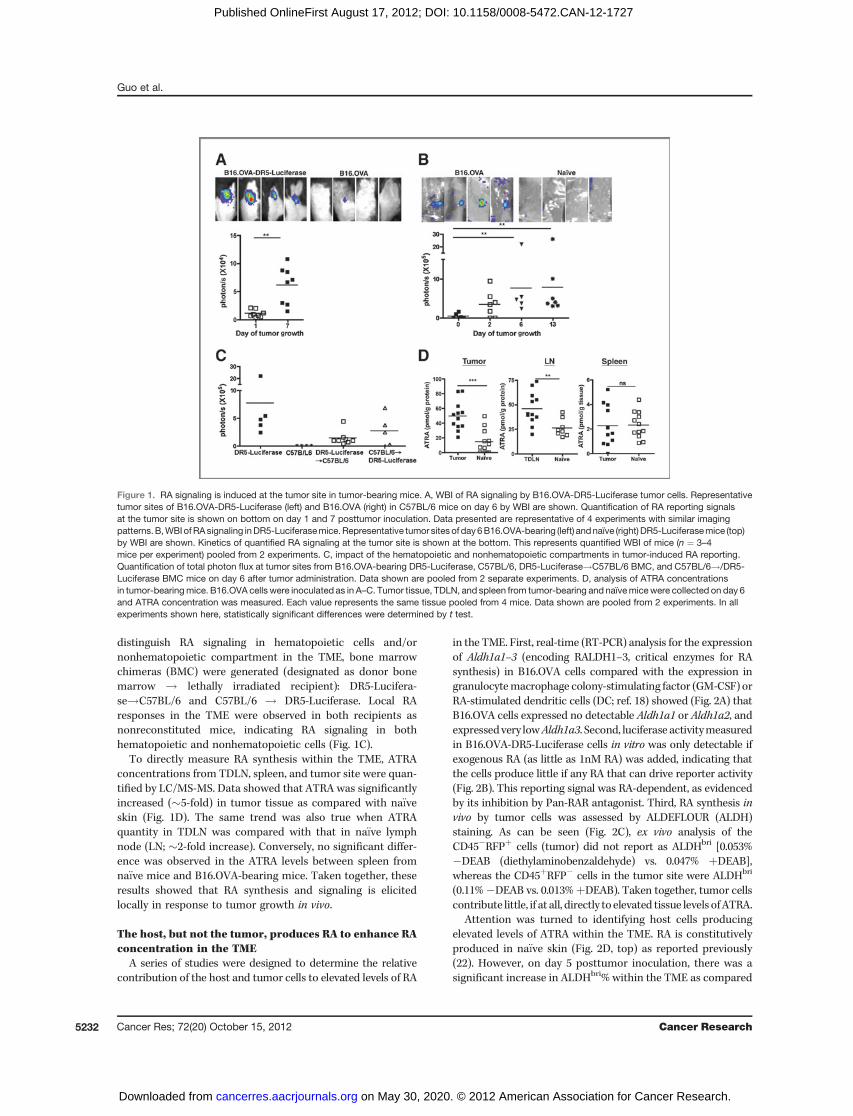
distinguish RA signaling in hematopoietic cells and/ornonhematopoietic compartment in the TME, bone marrowchimeras (BMC) were generated (designated as donor bonemarrow ! lethally irradiated recipient): DR5-Lucifera-se!C57BL/6 and C57BL/6 ! DR5-Luciferase. Local RAresponses in the TME were observed in both recipients asnonreconstituted mice, indicating RA signaling in bothhematopoietic and nonhematopoietic cells (Fig. 1C).
To directly measure RA synthesis within the TME, ATRAconcentrations from TDLN, spleen, and tumor site were quan-tified by LC/MS-MS. Data showed that ATRA was significantlyincreased (�5-fold) in tumor tissue as compared with na€�veskin (Fig. 1D). The same trend was also true when ATRAquantity in TDLN was compared with that in na€�ve lymphnode (LN; �2-fold increase). Conversely, no significant differ-ence was observed in the ATRA levels between spleen fromna€�ve mice and B16.OVA-bearing mice. Taken together, theseresults showed that RA synthesis and signaling is elicitedlocally in response to tumor growth in vivo.
The host, but not the tumor, produces RA to enhance RAconcentration in the TME
A series of studies were designed to determine the relativecontribution of the host and tumor cells to elevated levels of RA
in the TME. First, real-time (RT-PCR) analysis for the expressionof Aldh1a1–3 (encoding RALDH1–3, critical enzymes for RAsynthesis) in B16.OVA cells compared with the expression ingranulocytemacrophage colony-stimulating factor (GM-CSF) orRA-stimulated dendritic cells (DC; ref. 18) showed (Fig. 2A) thatB16.OVA cells expressed no detectable Aldh1a1 or Aldh1a2, andexpressedvery lowAldh1a3. Second, luciferase activitymeasuredin B16.OVA-DR5-Luciferase cells in vitro was only detectable ifexogenous RA (as little as 1nM RA) was added, indicating thatthe cells produce little if any RA that can drive reporter activity(Fig. 2B). This reporting signal was RA-dependent, as evidencedby its inhibition by Pan-RAR antagonist. Third, RA synthesis invivo by tumor cells was assessed by ALDEFLOUR (ALDH)staining. As can be seen (Fig. 2C), ex vivo analysis of theCD45�RFPþ cells (tumor) did not report as ALDHbri [0.053%�DEAB (diethylaminobenzaldehyde) vs. 0.047% þDEAB],whereas the CD45þRFP� cells in the tumor site were ALDHbri
(0.11%�DEAB vs. 0.013%þDEAB). Taken together, tumor cellscontribute little, if at all, directly toelevated tissue levels ofATRA.
Attention was turned to identifying host cells producingelevated levels of ATRA within the TME. RA is constitutivelyproduced in na€�ve skin (Fig. 2D, top) as reported previously(22). However, on day 5 posttumor inoculation, there was asignificant increase in ALDHbri% within the TME as compared
Figure 1. RA signaling is induced at the tumor site in tumor-bearing mice. A, WBI of RA signaling by B16.OVA-DR5-Luciferase tumor cells. Representativetumor sites of B16.OVA-DR5-Luciferase (left) and B16.OVA (right) in C57BL/6 mice on day 6 by WBI are shown. Quantification of RA reporting signalsat the tumor site is shown on bottom on day 1 and 7 posttumor inoculation. Data presented are representative of 4 experiments with similar imagingpatterns.B,WBIofRAsignaling inDR5-Luciferasemice.Representative tumor sites of day6B16.OVA-bearing (left) andnaïve (right) DR5-Luciferasemice (top)by WBI are shown. Kinetics of quantified RA signaling at the tumor site is shown at the bottom. This represents quantified WBI of mice (n ¼ 3–4mice per experiment) pooled from 2 experiments. C, impact of the hematopoietic and nonhematopoietic compartments in tumor-induced RA reporting.Quantification of total photon flux at tumor sites from B16.OVA-bearing DR5-Luciferase, C57BL/6, DR5-Luciferase!C57BL/6 BMC, and C57BL/6!/DR5-Luciferase BMC mice on day 6 after tumor administration. Data shown are pooled from 2 separate experiments. D, analysis of ATRA concentrationsin tumor-bearingmice. B16.OVA cells were inoculated as in A–C. Tumor tissue, TDLN, and spleen from tumor-bearing and naïvemicewere collected on day 6and ATRA concentration was measured. Each value represents the same tissue pooled from 4 mice. Data shown are pooled from 2 experiments. In allexperiments shown here, statistically significant differences were determined by t test.
Guo et al.
Cancer Res; 72(20) October 15, 2012 Cancer Research5232
on May 30, 2020. © 2012 American Association for Cancer Research. cancerres.aacrjournals.org Downloaded from
Published OnlineFirst August 17, 2012; DOI: 10.1158/0008-5472.CAN-12-1727
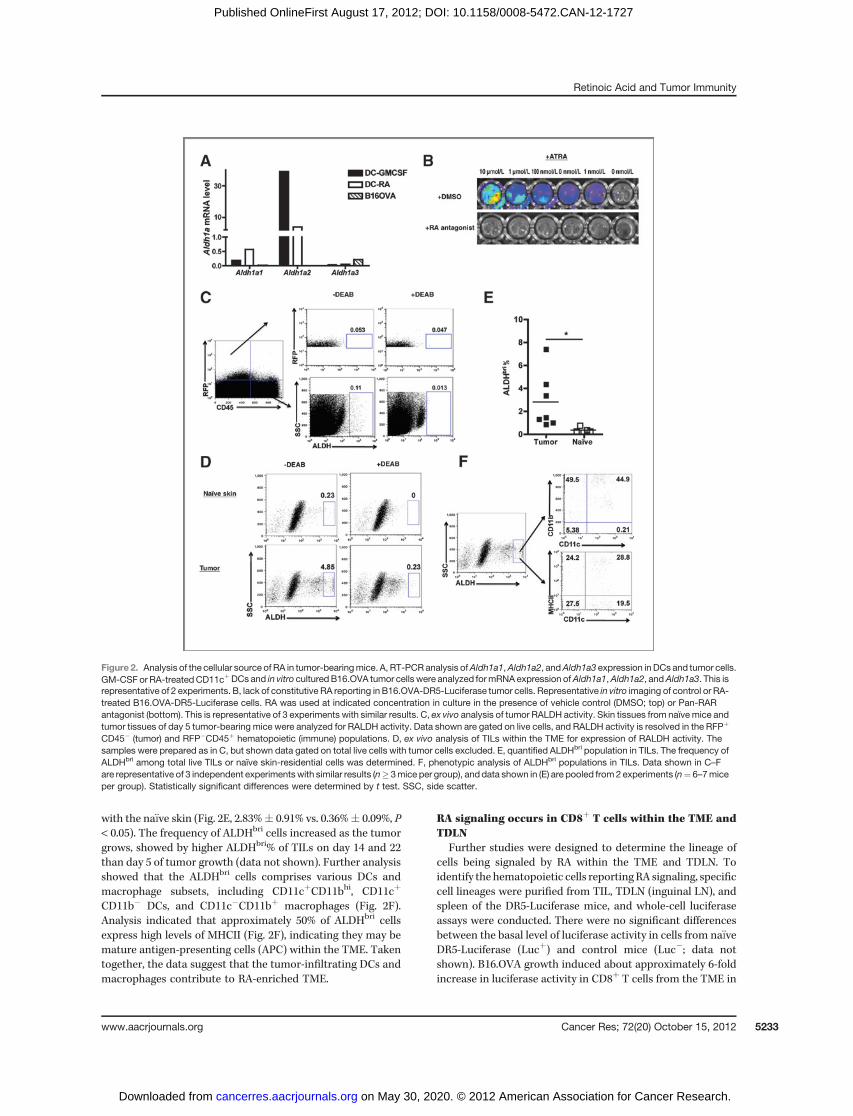
with the na€�ve skin (Fig. 2E, 2.83%� 0.91% vs. 0.36%� 0.09%, P< 0.05). The frequency of ALDHbri cells increased as the tumorgrows, showed by higher ALDHbri% of TILs on day 14 and 22than day 5 of tumor growth (data not shown). Further analysisshowed that the ALDHbri cells comprises various DCs andmacrophage subsets, including CD11cþCD11bhi, CD11cþ
CD11b� DCs, and CD11c�CD11bþ macrophages (Fig. 2F).Analysis indicated that approximately 50% of ALDHbri cellsexpress high levels of MHCII (Fig. 2F), indicating they may bemature antigen-presenting cells (APC) within the TME. Takentogether, the data suggest that the tumor-infiltrating DCs andmacrophages contribute to RA-enriched TME.
RA signaling occurs in CD8þ T cells within the TME andTDLN
Further studies were designed to determine the lineage ofcells being signaled by RA within the TME and TDLN. Toidentify the hematopoietic cells reporting RA signaling, specificcell lineages were purified from TIL, TDLN (inguinal LN), andspleen of the DR5-Luciferase mice, and whole-cell luciferaseassays were conducted. There were no significant differencesbetween the basal level of luciferase activity in cells from na€�veDR5-Luciferase (Lucþ) and control mice (Luc�; data notshown). B16.OVA growth induced about approximately 6-foldincrease in luciferase activity in CD8þ T cells from the TME in
Figure 2. Analysis of the cellular source of RA in tumor-bearingmice. A, RT-PCR analysis ofAldh1a1,Aldh1a2, andAldh1a3 expression inDCs and tumor cells.GM-CSF or RA-treatedCD11cþDCs and in vitro culturedB16.OVA tumor cells were analyzed formRNA expression ofAldh1a1,Aldh1a2, andAldh1a3. This isrepresentative of 2 experiments. B, lack of constitutive RA reporting in B16.OVA-DR5-Luciferase tumor cells. Representative in vitro imaging of control or RA-treated B16.OVA-DR5-Luciferase cells. RA was used at indicated concentration in culture in the presence of vehicle control (DMSO; top) or Pan-RARantagonist (bottom). This is representative of 3 experiments with similar results. C, ex vivo analysis of tumor RALDH activity. Skin tissues from naïve mice andtumor tissues of day 5 tumor-bearing mice were analyzed for RALDH activity. Data shown are gated on live cells, and RALDH activity is resolved in the RFPþ
CD45� (tumor) and RFP�CD45þ hematopoietic (immune) populations. D, ex vivo analysis of TILs within the TME for expression of RALDH activity. Thesamples were prepared as in C, but shown data gated on total live cells with tumor cells excluded. E, quantified ALDHbri population in TILs. The frequency ofALDHbri among total live TILs or naïve skin-residential cells was determined. F, phenotypic analysis of ALDHbri populations in TILs. Data shown in C–Fare representative of 3 independent experimentswith similar results (n� 3mice per group), and data shown in (E) are pooled from 2 experiments (n¼ 6–7miceper group). Statistically significant differences were determined by t test. SSC, side scatter.
Retinoic Acid and Tumor Immunity
www.aacrjournals.org Cancer Res; 72(20) October 15, 2012 5233
on May 30, 2020. © 2012 American Association for Cancer Research. cancerres.aacrjournals.org Downloaded from
Published OnlineFirst August 17, 2012; DOI: 10.1158/0008-5472.CAN-12-1727
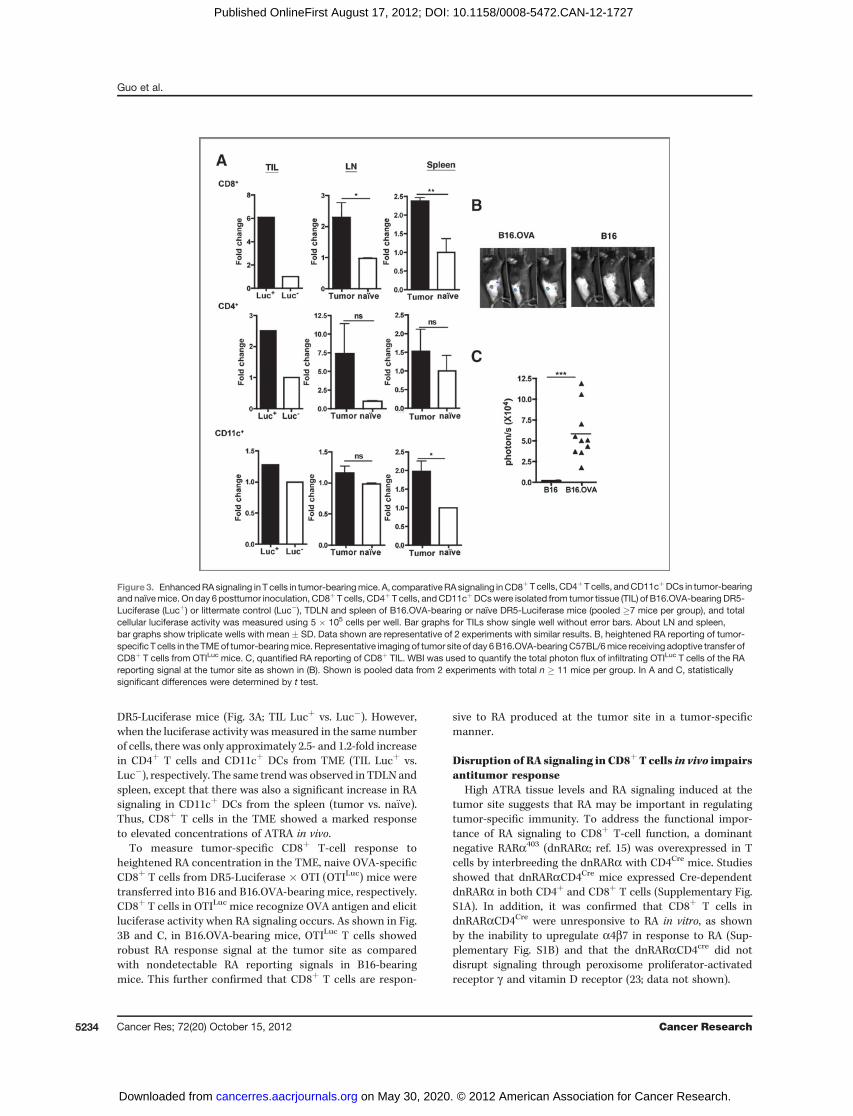
DR5-Luciferase mice (Fig. 3A; TIL Lucþ vs. Luc�). However,when the luciferase activity wasmeasured in the same numberof cells, there was only approximately 2.5- and 1.2-fold increasein CD4þ T cells and CD11cþ DCs from TME (TIL Lucþ vs.Luc�), respectively. The same trendwas observed in TDLN andspleen, except that there was also a significant increase in RAsignaling in CD11cþ DCs from the spleen (tumor vs. na€�ve).Thus, CD8þ T cells in the TME showed a marked responseto elevated concentrations of ATRA in vivo.
To measure tumor-specific CD8þ T-cell response toheightened RA concentration in the TME, naive OVA-specificCD8þ T cells from DR5-Luciferase � OTI (OTILuc) mice weretransferred into B16 and B16.OVA-bearing mice, respectively.CD8þ T cells in OTILuc mice recognize OVA antigen and elicitluciferase activity when RA signaling occurs. As shown in Fig.3B and C, in B16.OVA-bearing mice, OTILuc T cells showedrobust RA response signal at the tumor site as comparedwith nondetectable RA reporting signals in B16-bearingmice. This further confirmed that CD8þ T cells are respon-
sive to RA produced at the tumor site in a tumor-specificmanner.
Disruption of RA signaling in CD8þT cells in vivo impairsantitumor response
High ATRA tissue levels and RA signaling induced at thetumor site suggests that RA may be important in regulatingtumor-specific immunity. To address the functional impor-tance of RA signaling to CD8þ T-cell function, a dominantnegative RARa403 (dnRARa; ref. 15) was overexpressed in Tcells by interbreeding the dnRARa with CD4Cre mice. Studiesshowed that dnRARaCD4Cre mice expressed Cre-dependentdnRARa in both CD4þ and CD8þ T cells (Supplementary Fig.S1A). In addition, it was confirmed that CD8þ T cells indnRARaCD4Cre were unresponsive to RA in vitro, as shownby the inability to upregulate a4b7 in response to RA (Sup-plementary Fig. S1B) and that the dnRARaCD4cre did notdisrupt signaling through peroxisome proliferator-activatedreceptor g and vitamin D receptor (23; data not shown).
Figure3. EnhancedRAsignaling in T cells in tumor-bearingmice. A, comparativeRAsignaling inCD8þT cells, CD4þT cells, andCD11cþDCs in tumor-bearingand naïvemice. On day 6 posttumor inoculation, CD8þT cells, CD4þ T cells, andCD11cþDCswere isolated from tumor tissue (TIL) of B16.OVA-bearingDR5-Luciferase (Lucþ) or littermate control (Luc�), TDLN and spleen of B16.OVA-bearing or naïve DR5-Luciferase mice (pooled �7 mice per group), and totalcellular luciferase activity was measured using 5 � 105 cells per well. Bar graphs for TILs show single well without error bars. About LN and spleen,bar graphs show triplicate wells with mean � SD. Data shown are representative of 2 experiments with similar results. B, heightened RA reporting of tumor-specificT cells in the TMEof tumor-bearingmice. Representative imaging of tumor site of day 6B16.OVA-bearingC57BL/6mice receiving adoptive transfer ofCD8þ T cells from OTILuc mice. C, quantified RA reporting of CD8þ TIL. WBI was used to quantify the total photon flux of infiltrating OTILuc T cells of the RAreporting signal at the tumor site as shown in (B). Shown is pooled data from 2 experiments with total n � 11 mice per group. In A and C, statisticallysignificant differences were determined by t test.
Guo et al.
Cancer Res; 72(20) October 15, 2012 Cancer Research5234
on May 30, 2020. © 2012 American Association for Cancer Research. cancerres.aacrjournals.org Downloaded from
Published OnlineFirst August 17, 2012; DOI: 10.1158/0008-5472.CAN-12-1727
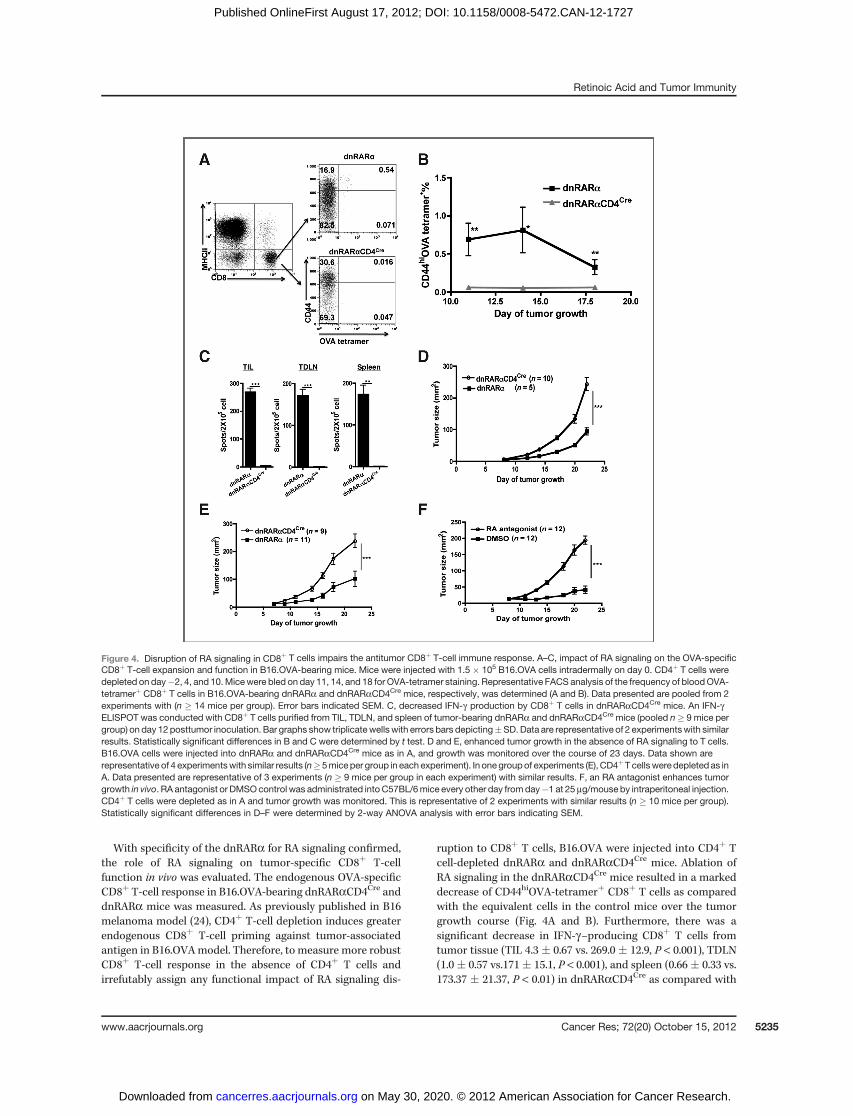
With specificity of the dnRARa for RA signaling confirmed,the role of RA signaling on tumor-specific CD8þ T-cellfunction in vivo was evaluated. The endogenous OVA-specificCD8þ T-cell response in B16.OVA-bearing dnRARaCD4Cre anddnRARa mice was measured. As previously published in B16melanoma model (24), CD4þ T-cell depletion induces greaterendogenous CD8þ T-cell priming against tumor-associatedantigen in B16.OVAmodel. Therefore, to measure more robustCD8þ T-cell response in the absence of CD4þ T cells andirrefutably assign any functional impact of RA signaling dis-
ruption to CD8þ T cells, B16.OVA were injected into CD4þ Tcell-depleted dnRARa and dnRARaCD4Cre mice. Ablation ofRA signaling in the dnRARaCD4Cre mice resulted in a markeddecrease of CD44hiOVA-tetramerþ CD8þ T cells as comparedwith the equivalent cells in the control mice over the tumorgrowth course (Fig. 4A and B). Furthermore, there was asignificant decrease in IFN-g–producing CD8þ T cells fromtumor tissue (TIL 4.3 � 0.67 vs. 269.0 � 12.9, P < 0.001), TDLN(1.0� 0.57 vs.171� 15.1, P < 0.001), and spleen (0.66� 0.33 vs.173.37 � 21.37, P < 0.01) in dnRARaCD4Cre as compared with
Figure 4. Disruption of RA signaling in CD8þ T cells impairs the antitumor CD8þ T-cell immune response. A–C, impact of RA signaling on the OVA-specificCD8þ T-cell expansion and function in B16.OVA-bearing mice. Mice were injected with 1.5 � 105 B16.OVA cells intradermally on day 0. CD4þ T cells weredepleted on day�2, 4, and 10.Micewere bled on day 11, 14, and 18 for OVA-tetramer staining. Representative FACS analysis of the frequency of bloodOVA-tetramerþ CD8þ T cells in B16.OVA-bearing dnRARa and dnRARaCD4Cre mice, respectively, was determined (A and B). Data presented are pooled from 2experiments with (n � 14 mice per group). Error bars indicated SEM. C, decreased IFN-g production by CD8þ T cells in dnRARaCD4Cre mice. An IFN-gELISPOT was conducted with CD8þ T cells purified from TIL, TDLN, and spleen of tumor-bearing dnRARa and dnRARaCD4Cre mice (pooled n� 9 mice pergroup) on day 12 posttumor inoculation. Bar graphs show triplicate wellswith errors bars depicting�SD. Data are representative of 2 experimentswith similarresults. Statistically significant differences in B and C were determined by t test. D and E, enhanced tumor growth in the absence of RA signaling to T cells.B16.OVA cells were injected into dnRARa and dnRARaCD4Cre mice as in A, and growth was monitored over the course of 23 days. Data shown arerepresentative of 4 experimentswith similar results (n�5mice per group in each experiment). In one groupof experiments (E), CD4þT cellsweredepleted as inA. Data presented are representative of 3 experiments (n � 9 mice per group in each experiment) with similar results. F, an RA antagonist enhances tumorgrowth in vivo. RA antagonist or DMSOcontrol was administrated into C57BL/6mice every other day fromday�1 at 25 mg/mouse by intraperitoneal injection.CD4þ T cells were depleted as in A and tumor growth was monitored. This is representative of 2 experiments with similar results (n � 10 mice per group).Statistically significant differences in D–F were determined by 2-way ANOVA analysis with error bars indicating SEM.
Retinoic Acid and Tumor Immunity
www.aacrjournals.org Cancer Res; 72(20) October 15, 2012 5235
on May 30, 2020. © 2012 American Association for Cancer Research. cancerres.aacrjournals.org Downloaded from
Published OnlineFirst August 17, 2012; DOI: 10.1158/0008-5472.CAN-12-1727
dnRARa mice (Fig. 4C), respectively. The fewer functionalOVA-specific CD8þ T cells in dnRARaCD4Cre mice suggeststhat RA signaling is required for tumor-specific CD8þ T-cellaccumulation and function in the TME.
Faster B16.OVA growth was observed in dnRARaCD4Cre
mice in comparison with dnRARa mice (Fig. 4D), suggestingreduced immune surveillance. The enhanced tumor growthwas independent of deficient CD4þ T cell help because thesame effect was observed when CD4þ T cells were depleted inboth groups over the entire tumor growth course (Fig. 4E).Chemical inhibition of RA signaling recapitulated the pheno-type observed in the dnRARaCD4Cre mice (Fig. 4F). In vitroculture experiments established that the pan-RAR antagonistused in this study did not inhibit B16.OVA growth over a widedose range (data not shown). In conclusion, these studies
establish that RA signaling to CD8þ T cells in vivo is criticalfor optimal suppression of tumor growth.
RA signaling is required forCD8þT-cell expansion in vivoTo gain greater insights into the underlying mechanism of
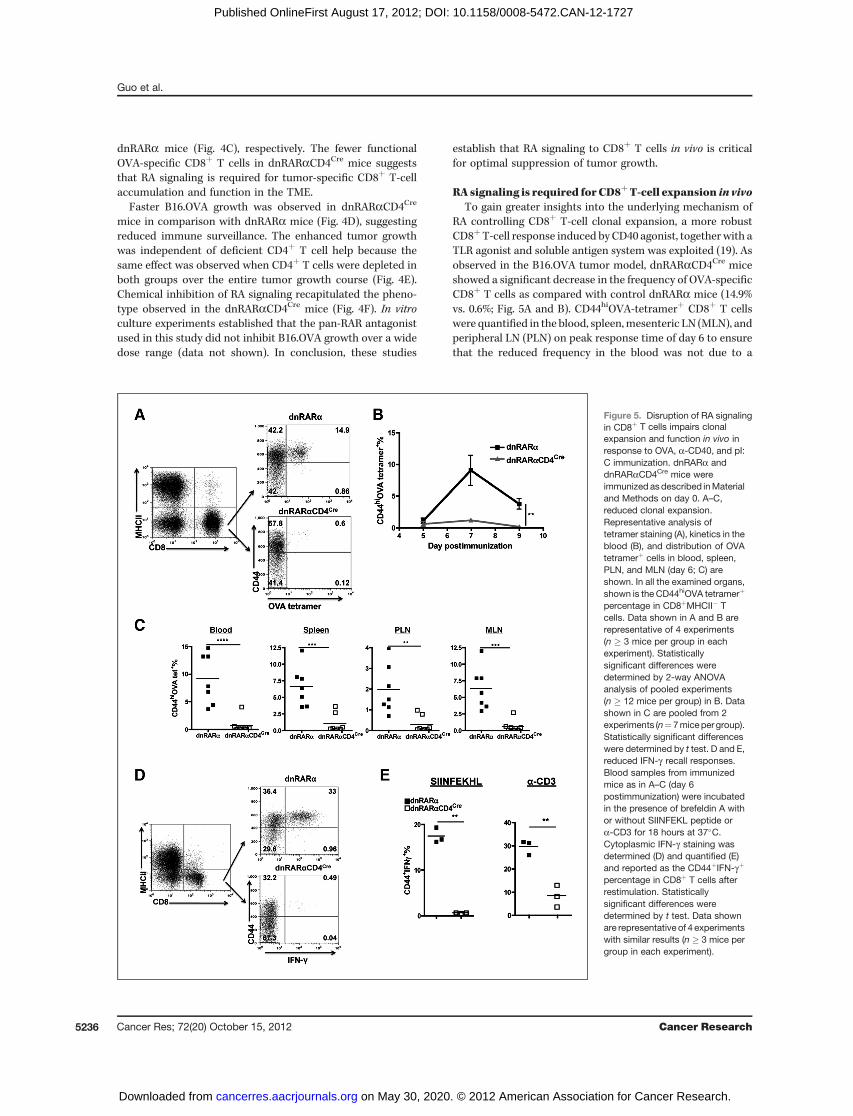
RA controlling CD8þ T-cell clonal expansion, a more robustCD8þT-cell response induced by CD40 agonist, together with aTLR agonist and soluble antigen system was exploited (19). Asobserved in the B16.OVA tumor model, dnRARaCD4Cre miceshowed a significant decrease in the frequency of OVA-specificCD8þ T cells as compared with control dnRARa mice (14.9%vs. 0.6%; Fig. 5A and B). CD44hiOVA-tetramerþ CD8þ T cellswere quantified in the blood, spleen,mesenteric LN (MLN), andperipheral LN (PLN) on peak response time of day 6 to ensurethat the reduced frequency in the blood was not due to a
Figure 5. Disruption of RA signalingin CD8þ T cells impairs clonalexpansion and function in vivo inresponse to OVA, a-CD40, and pI:C immunization. dnRARa anddnRARaCD4Cre mice wereimmunized asdescribed inMaterialand Methods on day 0. A–C,reduced clonal expansion.Representative analysis oftetramer staining (A), kinetics in theblood (B), and distribution of OVAtetramerþ cells in blood, spleen,PLN, and MLN (day 6; C) areshown. In all the examined organs,shown is the CD44hiOVA tetramerþ
percentage in CD8þMHCII� Tcells. Data shown in A and B arerepresentative of 4 experiments(n � 3 mice per group in eachexperiment). Statisticallysignificant differences weredetermined by 2-way ANOVAanalysis of pooled experiments(n � 12 mice per group) in B. Datashown in C are pooled from 2experiments (n¼7miceper group).Statistically significant differenceswere determined by t test. D and E,reduced IFN-g recall responses.Blood samples from immunizedmice as in A–C (day 6postimmunization) were incubatedin the presence of brefeldin A withor without SIINFEKL peptide ora-CD3 for 18 hours at 37�C.Cytoplasmic IFN-g staining wasdetermined (D) and quantified (E)and reported as the CD44þIFN-gþ
percentage in CD8þ T cells afterrestimulation. Statisticallysignificant differences weredetermined by t test. Data shownare representative of 4 experimentswith similar results (n � 3 mice pergroup in each experiment).
Guo et al.
Cancer Res; 72(20) October 15, 2012 Cancer Research5236
on May 30, 2020. © 2012 American Association for Cancer Research. cancerres.aacrjournals.org Downloaded from
Published OnlineFirst August 17, 2012; DOI: 10.1158/0008-5472.CAN-12-1727
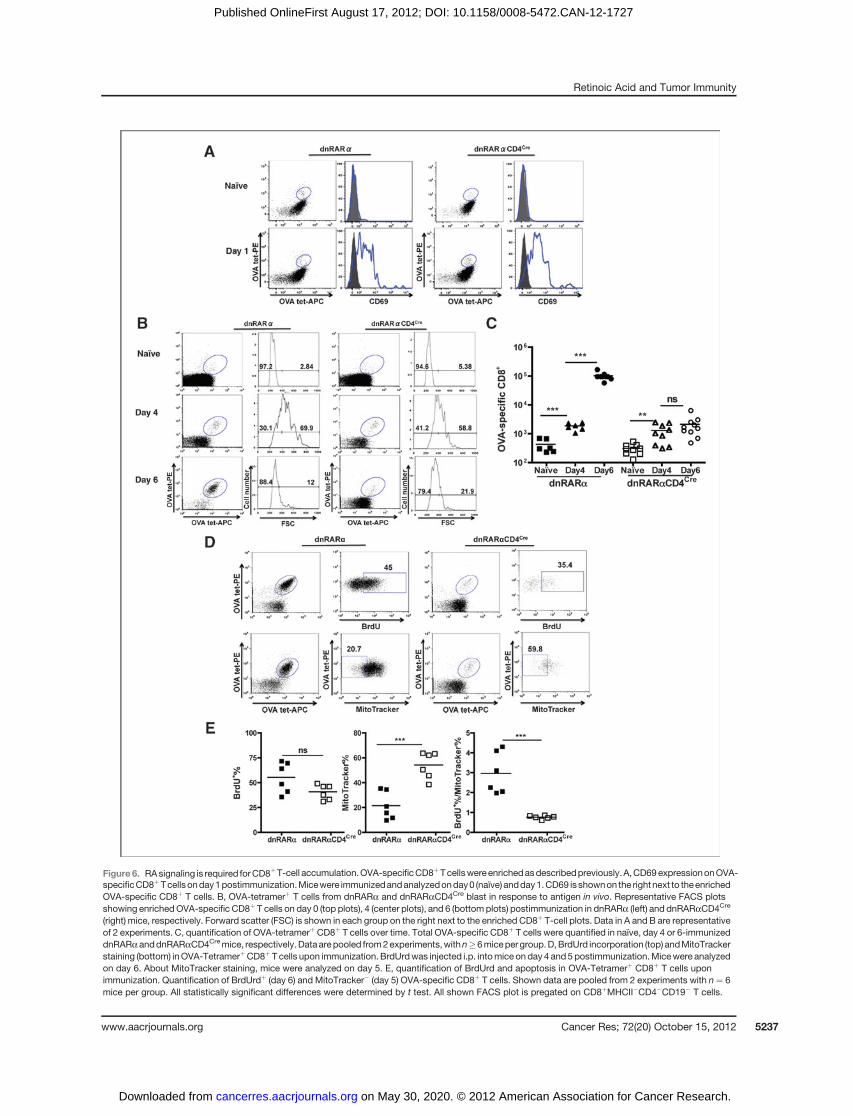
Figure 6. RAsignaling is required forCD8þT-cell accumulation.OVA-specificCD8þTcellswereenrichedasdescribedpreviously.A,CD69expressiononOVA-specificCD8þTcells onday1postimmunization.Micewere immunizedandanalyzedonday0 (naïve) andday1.CD69 is shownon the rightnext to theenrichedOVA-specific CD8þ T cells. B, OVA-tetramerþ T cells from dnRARa and dnRARaCD4Cre blast in response to antigen in vivo. Representative FACS plotsshowing enrichedOVA-specific CD8þ T cells on day 0 (top plots), 4 (center plots), and 6 (bottom plots) postimmunization in dnRARa (left) and dnRARaCD4Cre
(right) mice, respectively. Forward scatter (FSC) is shown in each group on the right next to the enriched CD8þ T-cell plots. Data in A and B are representativeof 2 experiments. C, quantification of OVA-tetramerþCD8þ T cells over time. Total OVA-specific CD8þ T cells were quantified in naïve, day 4 or 6-immunizeddnRARaanddnRARaCD4Cremice, respectively.Dataarepooled from2experiments,withn�6micepergroup.D,BrdUrd incorporation (top) andMitoTrackerstaining (bottom) inOVA-TetramerþCD8þT cells upon immunization. BrdUrdwas injected i.p. intomice onday 4 and5 postimmunization.Micewere analyzedon day 6. About MitoTracker staining, mice were analyzed on day 5. E, quantification of BrdUrd and apoptosis in OVA-Tetramerþ CD8þ T cells uponimmunization. Quantification of BrdUrdþ (day 6) and MitoTracker� (day 5) OVA-specific CD8þ T cells. Shown data are pooled from 2 experiments with n¼ 6mice per group. All statistically significant differences were determined by t test. All shown FACS plot is pregated on CD8þMHCII�CD4�CD19� T cells.
Retinoic Acid and Tumor Immunity
www.aacrjournals.org Cancer Res; 72(20) October 15, 2012 5237
on May 30, 2020. © 2012 American Association for Cancer Research. cancerres.aacrjournals.org Downloaded from
Published OnlineFirst August 17, 2012; DOI: 10.1158/0008-5472.CAN-12-1727
trafficking defect but rather was representative of the overallCD8þ T-cell response (Fig. 5C). When restimulated ex vivo bySIINFEKLpeptide ora-CD3, the frequency of IFN-g–producingCD8þ T cells in dnRARaCD4Cre was significantly lower than indnRARa mice (Fig. 5D and E). Identical results were obtainedinmice that were depleted of CD4þT cells (Supplementary Fig.S2), establishing that intrinsic RA signaling deficiency in CD8þ,but not CD4þ T cells, accounted for the defective CD8þ T-cellaccumulation.
RA is responsible for the late clonal expansion of CD8þ
T cellsTetramer enrichment allowed for the quantification of total
OVA-tetramerþCD8þTcells at very early time-points followingimmunization (21). On day 1 and 4 postimmunization, CD69expression as well as increases in forward scatter, respectively,of OVA-tetramerþ CD8þ T cells from dnRARaCD4Cre anddnRARamicewere indistinguishable (Fig. 6A andB), indicatingthat the expression of dnRARa imparts no effect on early T-cellactivation. During the initial expansion between day 0 and 4,OVA-tetramerþ CD8þ T cells in dnRARaCD4Cre mice accumu-lated to the same extent as their counterparts in dnRARamice,showed by the same approximately 4-fold increase over na€�vecontrol (Fig. 6C). However, OVA-specific CD8þ T cells failed toaccumulate further between day 4 and 6 in dnRARaCD4Cre
mice, whereas the counterparts in dnRARa mice expandedlogarithmically (�50-fold).
Analysis of proliferation of OVA-specific CD8þ T cells bybromodeoxyuridine (BrdUrd) incorporation between day 4and 6 revealed a slight but not significant decrease in OVA-tetramerþ cells incorporating BrdUrd between dnRARa anddnRARaCD4Cre (both between 40% and 50%; Fig. 6D and E). Todetermine if there was a survival deficiency of the proliferatingCD8þ T cells in dnRARaCD4Cre mice, enriched OVA-specificCD8þ T cells were stained with MitoTracker on day 5 post-immunization. Interestingly, while approximately 20% of thecells were MitoTracker-negative (undergoing apoptosis) incontrol dnRARa mice, approximately 50% of OVA-tetramerþ
CD8þ T cells were MitoTracker-negative in dnRARaCD4Cre
mice (Fig. 6D). Therefore, the abortive accumulation of OVA-specific CD8þ T cells in dnRARaCD4Cre mice between day 4and 6 postimmunization may be due to an equal number ofcells undergoing proliferation and apoptosis simultaneously(Fig. 6E). In conclusion, although early CD8þ T-cell expansionis independent of RA signaling in vivo, late CD8þ T-cell clonalaccumulation requires RA signaling tomaintain better survivalduring proliferation and effector development.
DiscussionAccumulating evidence suggests that heightened tissue
levels of RA develop at sites of inflammation (11). In thepresent study, we reported for the first time that the tumorinduces a temporally and spatially restricted production andheightened accumulation of RA within the TME. Host tissueDCs and macrophages instead of tumor cells, were majorcontributors to high-level ATRA within the TME. The markedCD8þ T-cell responses to regionally produced RA suggestedthat the host may exploit RA to facilitate the development of
CD8þ T-cell–mediated protective antitumor immunity. Thefunctional importance of RA signaling in CD8þ T cells wasconfirmed by studies in mice in which the RA signaling in Tcells was genetically impaired. RA signaling-deficient CD8þ Tcells failed to expand/accumulate and produce IFN-g , thusleading to enhanced B16.OVA tumor growth. These studiessupport the notion that the expansion, accumulation, anddifferentiation of tumor-specific CD8þ T cells are dependenton intrinsic RA signaling. An in-depth in vivo analysis of OVA-specific CD8þ T cells revealed RA signaling disruption did notimpact on upregulation of early activation markers, cellenlargement, or early in vivo expansion induced by OVAimmunization. The RA signaling-deficient CD8þ T cells pro-ceed through early rounds of division but fail to ultimatelyaccumulate due to dominant apoptosis in the late clonalexpansion. As such, RA signaling seems to render these pro-liferating cells resistant to apoptosis at the effector phase.Because previous studies have suggested that RA signalingmayinfluence IL-2 expression in activated T cells (25, 26),dnRARaCD4cre mice were treated with IL2/aIL2 complex torestore IL-2 levels. However, this did not overcome the defi-ciency in OVA-specific CD8þ T-cell expansion in immuniza-tion model (data not shown). Additional investigative studieson the molecular basis for how intrinsic RA signaling controlsCD8þ T-cell survival at the effector phase are underway.
Disclosure of Potential Conflicts of InterestR. Blomhoff and has an ownership interest (including patents) in Cgene.
E. Dmitrovsky has ownership interest (including patents) in a pending patent.R. A. Chandraratna is employed (other than primary affiliation; e.g., consulting) inIo Pharmaceuticals. He is a consultant/advisory boardmember, holds title of SABChair, and has ownership interest (including patents) in Io Pharmaceuticals. Nopotential conflicts of interest were disclosed by the other authors.
Authors' ContributionsConception and design: Y. Guo, C.A. Ahonen, E. Dmitrovsky, M.J. Turk, R.J.NoelleDevelopment ofmethodology: Y. Guo, K. Pino-Lagos, C.A. Ahonen, J.L. Napoli,R. Blomhoff, R.A. Chandraratna, E. Dmitrovsky, R.J. NoelleAcquisition of data (provided animals, acquired and managed patients,provided facilities, etc.): Y. Guo, J. Wang, J.L. Napoli, R. Blomhoff, S. Sock-anathan, R.J. NoelleAnalysis and interpretation of data (e.g., statistical analysis, biostatistics,computational analysis): Y. Guo, J.L. Napoli, R. Blomhoff, E. Dmitrovsky, R.J.NoelleWriting, review, and/or revision of the manuscript: Y. Guo, K. Pino-Lagos,E. Dmitrovsky, M.J. Turk, R.J. NoelleAdministrative, technical, or material support (i.e., reporting or orga-nizing data, constructing databases): Y. Guo, K.A. BennettStudy supervision: R.J. Noelle
AcknowledgmentsThe authors thank Dr. Pierre Chambon for insightful discussions on data and
manuscript preparation, Drs. Edward Usherwood, Victor C. de Vries, and Jose R.Conejo-Garcia for critically reading the manuscript, and Dr. Joshua J. Obar fortechnical help.
Grant SupportThis work was supported by the NIH (AT005382, AI048667, CA062275, and
CA120777), the Medical Research Council Centre for Transplantation, theBiomedical Research Council, TheWellcome Trust, and SamuelWaxmanCancerResearch Foundation.
The costs of publication of this article were defrayed in part by the payment ofpage charges. This article must therefore be hereby marked advertisement inaccordance with 18 U.S.C. Section 1734 solely to indicate this fact.
Received May 1, 2012; revised July 5, 2012; accepted July 24, 2012;published OnlineFirst August 17, 2012.
Guo et al.
Cancer Res; 72(20) October 15, 2012 Cancer Research5238
on May 30, 2020. © 2012 American Association for Cancer Research. cancerres.aacrjournals.org Downloaded from
Published OnlineFirst August 17, 2012; DOI: 10.1158/0008-5472.CAN-12-1727
References1. Casci T. Functional genomics: an array of bacterial interactions. Nat
Rev Genet 2008;9:652.2. Niederreither K, Dolle P. Retinoic acid in development: towards an
integrated view. Nat Rev Genet 2008;9:541–53.3. Iwata M, Hirakiyama A, Eshima Y, Kagechika H, Kato C, Song SY.
Retinoic acid imprints gut-homing specificity on T cells. Immunity2004;21:527–38.
4. SvenssonM, Johansson-LindbomB, Zapata F, Jaensson E, AustenaaLM, Blomhoff R, et al. Retinoic acid receptor signaling levels andantigen dose regulate gut homing receptor expression on CD8þ Tcells. Mucosal Immunol 2008;1:38–48.
5. Eksteen B, Mora JR, Haughton EL, Henderson NC, Lee-Turner L,Villablanca EJ, et al. Gut homing receptors on CD8 T cells are retinoicacid dependent and not maintained by liver dendritic or stellate cells.Gastroenterology 2009;137:320–9.
6. Mora JR, Iwata M, Eksteen B, Song SY, Junt T, Senman B, et al.Generation of gut-homing IgA-secreting B cells by intestinal dendriticcells. Science 2006;314:1157–60.
7. SunCM,Hall JA,BlankRB,BouladouxN,OukkaM,MoraJR, etal.Smallintestine lamina propria dendritic cells promote de novo generation ofFoxp3 T reg cells via retinoic acid. J Exp Med 2007;204:1775–85.
8. BensonMJ, Pino-Lagos K, Rosemblatt M, Noelle RJ. All-trans retinoicacid mediates enhanced Treg cell growth, differentiation, and guthoming in the face of high levels of co-stimulation. J Exp Med2007;204:1765–74.
9. Mucida D, Park Y, Kim G, Turovskaya O, Scott I, Kronenberg M, et al.Reciprocal TH17 and regulatory T cell differentiation mediated byretinoic acid. Science 2007;317:256–60.
10. Hall JA, Cannons JL, Grainger JR, Dos Santos LM, Hand TW, Naik S,et al. Essential role for retinoic acid in the promotion of CD4(þ) T celleffector responses via retinoic acid receptor alpha. Immunity 2011;34:435–47.
11. Pino-Lagos K, Guo Y, BrownC, Alexander MP, Elgueta R, Bennett KA,et al. A retinoic acid-dependent checkpoint in the development ofCD4þ T cell-mediated immunity. J Exp Med 2011;208:1767–75.
12. Kusmartsev S, Cheng F, Yu B, Nefedova Y, Sotomayor E, Lush RM,et al. All-trans-retinoic acid eliminates immature myeloid cells fromtumor-bearing mice and improves the effect of vaccination. CancerRes 2003;63:4441–9.
13. Mirza N, Fishman M, Fricke I, Dunn M, Neuger AM, Frost TJ, et al. All-trans-retinoic acid improves differentiation of myeloid cells andimmune response in cancer patients. Cancer Res 2006;66:9299–307.
14. Rosenberg SA, Yang JC, Restifo NP. Cancer immunotherapy: movingbeyond current vaccines. Nat Med 2004;10:909–15.
15. Rajaii F, Bitzer ZT, Xu Q, Sockanathan S. Expression of the dominantnegative retinoid receptor, RAR403, alters telencephalic progenitorproliferation, survival, and cell fate specification. Dev Biol 2008;316:371–82.
16. Wang L, Pino-Lagos K, de Vries VC, Guleria I, Sayegh MH, Noelle RJ.Programmed death 1 ligand signaling regulates the generation ofadaptive Foxp3þCD4þ regulatory T cells. Proc Natl Acad Sci U S A2008;105:9331–6.
17. Kane MA, Folias AE, Wang C, Napoli JL. Quantitative profiling ofendogenous retinoic acid in vivo and in vitro by tandem mass spec-trometry. Anal Chem 2008;80:1702–8.
18. Yokota A, Takeuchi H,MaedaN, Ohoka Y, Kato C, Song SY, et al. GM-CSF and IL-4 synergistically trigger dendritic cells to acquire retinoicacid-producing capacity. Int Immunol 2009;21:361–77.
19. Ahonen CL, Doxsee CL, McGurran SM, Riter TR, Wade WF, Barth RJ,et al. Combined TLR and CD40 triggering induces potent CD8þ T cellexpansion with variable dependence on type I IFN. J Exp Med2004;199:775–84.
20. TurkMJ, Guevara-Patino JA, RizzutoGA, EngelhornME, Sakaguchi S,Houghton AN. Concomitant tumor immunity to a poorly immunogenicmelanoma is prevented by regulatory T cells. J Exp Med 2004;200:771–82.
21. Obar JJ, Khanna KM, Lefrancois L. Endogenous naive CD8þ T cellprecursor frequency regulates primary and memory responses toinfection. Immunity 2008;28:859–69.
22. GuilliamsM, Crozat K, Henri S, Tamoutounour S, Grenot P, Devilard E,et al. Skin-draining lymph nodes contain dermis-derived CD103(�)dendritic cells that constitutively produce retinoic acid and induceFoxp3(þ) regulatory T cells. Blood 2010;115:1958–68.
23. Chambon P. A decade of molecular biology of retinoic acid receptors.FASEB J 1996;10:940–54.
24. Zhang P, Cote AL, de Vries VC, Usherwood EJ, Turk MJ. Induction ofpostsurgical tumor immunity and T-cell memory by a poorly immuno-genic tumor. Cancer Res 2007;67:6468–76.
25. Engedal N, Ertesvag A, Blomhoff HK. Survival of activated human Tlymphocytes is promoted by retinoic acid via induction of IL-2. IntImmunol 2004;16:443–53.
26. Ertesvag A, Austenaa LM, Carlsen H, Blomhoff R, Blomhoff HK.Retinoic acid inhibits in vivo interleukin-2 gene expression and T-cellactivation in mice. Immunology 2009;126:514–22.
Retinoic Acid and Tumor Immunity
www.aacrjournals.org Cancer Res; 72(20) October 15, 2012 5239
on May 30, 2020. © 2012 American Association for Cancer Research. cancerres.aacrjournals.org Downloaded from
Published OnlineFirst August 17, 2012; DOI: 10.1158/0008-5472.CAN-12-1727
2012;72:5230-5239. Published OnlineFirst August 17, 2012.Cancer Res Yanxia Guo, Karina Pino-Lagos, Cory A. Ahonen, et al.
T Cells+Survival Cues for Tumor-Specific CD8Rich Tumor Microenvironment Provides Clonal−−A Retinoic Acid
Updated version
10.1158/0008-5472.CAN-12-1727doi:
Access the most recent version of this article at:
Material
Supplementary
http://cancerres.aacrjournals.org/content/suppl/2012/08/16/0008-5472.CAN-12-1727.DC1
Access the most recent supplemental material at:
Cited articles
http://cancerres.aacrjournals.org/content/72/20/5230.full#ref-list-1
This article cites 26 articles, 12 of which you can access for free at:
Citing articles
http://cancerres.aacrjournals.org/content/72/20/5230.full#related-urls
This article has been cited by 6 HighWire-hosted articles. Access the articles at:
E-mail alerts related to this article or journal.Sign up to receive free email-alerts
Subscriptions
Reprints and
To order reprints of this article or to subscribe to the journal, contact the AACR Publications Department at
Permissions
Rightslink site. Click on "Request Permissions" which will take you to the Copyright Clearance Center's (CCC)
.http://cancerres.aacrjournals.org/content/72/20/5230To request permission to re-use all or part of this article, use this link
on May 30, 2020. © 2012 American Association for Cancer Research. cancerres.aacrjournals.org Downloaded from
Published OnlineFirst August 17, 2012; DOI: 10.1158/0008-5472.CAN-12-1727


![Tumor Microenvironment Hijacking the Immune System [Read-Only]](https://static.fdocuments.net/doc/165x107/61bf372f43ec6023e9684384/tumor-microenvironment-hijacking-the-immune-system-read-only.jpg)


