
A REPORT ON UNDERPERFORMING SECONDARY SCHOOLS IN THE ... performing schools in WC_Exploring... · A...
32
A REPORT ON UNDERPERFORMING SECONDARY SCHOOLS IN THE WESTERN CAPE REPORT 3 November 2011 Wynand Louw Amiena Bayat Ilse Eigelaar-Meets University of the Western Cape |Bellville |Cape Tow n jw [email protected] | [email protected] | [email protected] Exploring Grade Repetition at Underperforming Schools Institute for Social Development University of the Western Cape Bellville Cape Town [email protected] Department of Economics University of the Western Cape Bellville Cape Town [email protected] [email protected]
Transcript of A REPORT ON UNDERPERFORMING SECONDARY SCHOOLS IN THE ... performing schools in WC_Exploring... · A...

A REPORT ON UNDERPERFORMING SECONDARY SCHOOLS IN THE WESTERN CAPE
REPORT 3
November 2011
Wynand Louw Amiena Bayat
Ilse Eigelaar-Meets
University of the Western Cape |Bellville |Cape Tow n
jw [email protected] | [email protected] | [email protected]
Exploring Grade Repetition at Underperforming Schools
Institute for Social
Development University of the Western Cape Bellville
Cape Town [email protected]
Department of Economics
University of the Western Cape Bellville Cape Town
ii
PREFACE
As part of its drive to undo the legacy of years of race-based, inequitable development in
South Africa, the first democratically elected government embarked on an ambitious
programme of socio-economic reconstruction and redress in its quest to establish a
more fair society in South Africa. The highly unequal and racially fractured school
system was one of the first sectors that were addressed. Since 1995 the South African
educational landscape has undergone fundamental change to improve the provision of
schooling for those that were discriminated against. This included substantial
reallocation of an ever-increasing portion of the annual budget to establish new, and
improve existing, resources and services.
Although near universal access in the primary school sector has been achieved, the
quality of education in both primary and secondary schools has been disappointing.
Results from international benchmark tests show our learners are consistently out-
performed by learners from poorer countries. In the Western Cape, the location of our
research, the number of underperforming secondary schools (i.e. those with a matric
pass rate of less than 60%) has more than doubled since 2006. This study aimed to
better understand what the important reasons were/are that make these institutions
perform badly and to make suggestions as to improve the educational outcomes of
learners attending secondary schools in this province.
The research project stretched over an 18-month period and included both rural and
urban schools. The research design allowed us to investigate the research problem in
depth and breadth. We were correct in our initial assumption that a multitude of issues
and factors cause schools to perform poorly, both inside and outside of the schooling
system. We decided to present our findings according to the various pertinent themes
that gradually evolved from the study. The findings on underperforming secondary
schools are presented in five separate reports. These are:
PAPER 1: The Impact of School Level Factors on Educational Performance
PAPER 2: The Impact of Socio-economic Factors on Educational Performance
PAPER 3: Exploring Grade Repetition at Underperforming Schools

iii
PAPER 4: School Governing Bodies at Underperforming Schools: How Effective Are
They Really?
PAPER 5: Investigating WCED Interventions at Underperforming Schools
South Africa needs to solve the current crisis engulfing our schools. In order to chisel
away at the country‟s present modest economic growth and subsequent high
unemployment rate, we need to as a matter of urgency, understand the core reasons
why schools are not working and fix them. It is our moral duty to do this for the millions of
children that should receive an education that is of value to them. We owe it to them.

iv
ACKNOWLEDGEMENTS
A research project of this magnitude demands substantial commitment from team
members. The authors wish to extend their deep appreciation to the following people for
the sustained support over the last few months.
Mastoera Sadan, Nathalie Vereen and Zsa Zsa Milongo of the Programme to
Support Pro - Poor Policy Development in South Africa for their immeasurable
support in ensuring the project logistics were kept on track.
The European Union for funding the research.
Nazeema Omar, who shared her immense knowledge and experience and
played a pivotal role in the questionnaire construction, negotiating entrée to the
schools and played a central role in the execution of the fieldwork.
Caroline Poole and Francis Uys, who with Ilse Eigelaar-Meets of SOREASO
Social Research Solutions ensured the data collection process, met the highest
methodological and scientific standards.
Rudewaan Arendse who ignited the initial spark for this study as well as for his
analytical insights.
Daniel Andrews, Masters student at the Institute who conducted most of the
interviews and focus groups with SGBs.
Priscilla Kippie, Chief Administrator at ISD who from the outset worked long hours
to keep the administration on track.
Belinda du Plessis of the School of Government at UWC who was responsible for
managing the finances.
Prudence Ramnath and Belinda Cupido, Masters students at ISD and Fru Wanka
and Desmond Chisenga – Student Assistants: Department of Economics, UWC
who assisted senior researchers in a variety of ways.
Anneliese Burgess of the Story Telling Agency for her professional services.
The WCED, Principals, School Governing Bodies (SGBs), School Management
Teams (SMTs) and teachers for their willingness to participate in this study.
Wynand Louw Amiena Bayat Ilse Eigelaar November 2011

v
TABLE OF CONTENTS
1. INTRODUCTION ...........................................................................................................1
2. METHODOLOGY ..........................................................................................................2
3. FINDINGS ....................................................................................................................5
3.1 REPETITION ................................................................................................................5
3.2 FACTORS THAT IMPACT ON HIGH LEVELS OF GRADE REPETITION AT UNDERPERFORMING SCHOOLS.................................................................................9
4. POLICY CONSIDERATIONS AND RECOMMENDATIONS............................................19
4.1. OBSERVATIONS AROUND LITERATURE ...................................................................19
4.2 RECOMMENDATION TO POLICY ...............................................................................21
5. REFERENCES............................................................................................................25

vi
LIST OF TABLES
TABLE 1: QUESTIONNAIRE CATEGORIES AS FOR EACH RESPONDENT GROUP ......... 3
TABLE 2: SAMPLING FRAME.............................................................................................. 5
TABLE 3: SAMPLE............................................................................................................... 5
TABLE 4: SAMPLE REALISATION....................................................................................... 5
TABLE 5: GRADE AND CORRESPONDING NORMATIVE AGE OF LEARNER (2011) ........ 9
TABLE 6: AVERAGE LEARNER TO TEACHER RATIO FOR THE PERIOD 2008-2010 .... 15
TABLE 7: KEY ISSUES AND PROBLEMS THAT IMPACT SAFETY AND SECURITY AT UNDERPERFORMING SCHOOLS (LEARNER RESPONSES)............................. 16
TABLE 8: TRAINING RECEIVED IN THE SUBJECT TAUGHT ........................................... 17

1
1. INTRODUCTION
In its quest to achieve equity, quality and access to education in South Africa, the
government has succeeded not only in expanding access to schools for most of the
population, but also in the provision of a near universal primary school education in a
relatively short period. In 2002 the completion rate for primary education for 18 year olds
was 89.6%; by 2009 this had increased to 94% (StatsSA 2010, p. 43).
Despite these achievements, studies show that underperforming secondary schools in
South Africa face problems with poor performance (Taylor 2007a, Taylor 2007, Fleisch &
Shindler 2007). In South Africa, an underperforming school is defined as a school failing
to achieve a Grade 12 pass rate of more than 60%.
The National Strategy for Learner Attainment (NSLA) was developed in 2004, by the
National Department of Education. This programme consisted of a planned and
sustained series and set of related operations, projects, activities, strategies and
interventions with short and long term objectives of raising learner performance and
ensuring improved quality learner achievement in all schools1 . As part of this
programme three strategic priorities were identified, i.e. 1) Teachers, with a focus on
training, development and retention, 2) The provision of learning and teaching support
material (LTSM) and, 3) increasing time spent teaching. The NSLA integrated a number
of different national, provincial and local initiatives into a synergistic mission-directed
programme of comprehensive interventions to tackle under-performance. Despite this
initiative, this study, although focusing on schools in the Western Cape, strongly
suggests that very little have changed at underperforming schools.
In 2006 there were 36 underperforming schools in the Western Cape. By 2009 this
number increased to 85, accounting for almost 20% of all secondary schools within the
province. Despite the introduction of a number of interventions by the Western Cape
Education Department (WCED), with this project specifically focusing on those
introduced during 2010, the number of underperforming schools still stood at 78 at the
end of the 2010 school calendar. Most underperforming schools are located in the
townships. These schools manifest many social dysfunctionalities emanating from the
1 Power point presentation of Department of Education, Pretoria, 2007.

2
social environment in which they are rooted.
Our research was conducted in the Western Cape and focused on understanding the
underlying factors responsible for the poor performance of learners, which is manifested
amongst others in high rates of grade repetition or failure in underperforming secondary
schools. The primary aim of this paper is to explore grade repetition at under performing
schools in the Western Cape and sets out to present a set of recommendations to
address poor learner attainment at underperforming schools.
2. METHODOLOGY
This paper draws from data collected on general aspects related to school
underperformance as part of a research project initiated by The Programme to Support
Pro Poor Policy Development in South Africa (PSPPD). The unit of analysis defined for
the broader study was underperforming secondary schools in the Western Cape.
Underperforming secondary schools are defined as those schools that achieved lower
than 60% in the final National Grade 12 examinations. The sampling frame consisted of
secondary schools that achieved a lower than 60% pass rate for the 2009 final National
Grade 12 examinations and consisted of 22 secondary schools for which comprensive
data was available at the time of finalising the sampling frame and sample population.
The sampling frame thus consisted of all confirmed 22 schools from which 14 schools
were purposefully selected in order to ensure representation for both racial and location
(urban/rural) variables. For the purpose of this study, rural schools were defined as all
schools outside the Cape Metro area. Of the schools constituting the sampling frame
(N=22) 15 were from within (urban) and 7 from outside the Cape Metropolitan area
(rural). Of the 15 urban schools, 4 were classified as historically Coloured schools and
11 as historically African schools. Of the remaining 7 rural schools, 6 were classified as
historically African and 1 as a historically Coloured school. The remaining 7 schools, not
included in the sample were listed as replacements in the case of refusals.
The 14 schools that constituted the sample consisted of 9 urban and 5 rural schools. Of
the 9 urban schools 4 were classified as historically Coloured schools and 5 as
historically African schools. In the case of the 5 rural schools 3 were historically African

3
and 2 historically Coloured schools. Unfortunately access to some schools was found to
be exceedingly difficult as principals of specifically historically African schools were not
willing to partake in the study after being informed on the purpose thereof. After
exhausting the replacement list, the research team was forced to include additional
schools not part of the original sampling frame, in order to complete the fieldwork. In
spite of these measures the team had to settle with the completion of only 12 schools,
instead of the indented 14, due to time frame constraints.
The research methodology consisted of both qualitative and quantitative approaches.
Three survey instruments (questionnaires) were developed, one for completion by the
principals, one for educators and one for learners. Questionnaires were developed to
measure a range of aspects shown by literature to impact on the functionality of a school
and thus the academic performance of its learners. The table below gives a broad
account of the type of questions included in the questionnaires by indicating categories
of questions as for each respondent group.
Table 1: Questionnaire categories as for each respondent group
Questionnaire category Respondent group
Principal Teachers Learners
School profile
Individual profile
Human resource management
Staff related aspects
Learner related aspects
School facilities
Curriculum management
Curriculum implementation
Parental and other community involvement
School governance and management
General questions (testing future
perspective)
Educators were randomly selected from staff lists provided by the school, with 2
educators selected for each grade offered by the school. Learners were randomly
selected from class lists provided by the school with 8 learners selected from each

4
grade. The total numbers of questionnaires completed were: 11 principal questionnaires,
84 teacher questionnaires and 436 learner questionnaires. Semi-structured interviews
were conducted with the School Management Team (SMT) of each school and focus
group discussions were held with available members of the School Governing Bodies
(SGBs) of the selected schools. These interviews were then transcribed and analysed.
The fieldwork team consisted of four senior researchers and one research assistant.
Both principals and teachers received their questionnaires approximately a week prior to
the school visit by the fieldwork team in order to allow enough time for its completion.
During the visit, two members of the research team were responsible for the interviews
with the principal and School Management Team whilst the other two and the assistant,
were responsible for the completion of the learner and teacher questionnaires.
Interviews with SGBs were conducted by a research assistant and had to be conducted
at different time slots, often in the evening to accommodate working members.
Due to time constraints learner questionnaires were completed in a group format with
one researcher acting as the primary facilitator whilst the other together with the
research assistant, assisted individual learners as needed. In order to ensure effective
management of the process, learners were split into two groups (two sessions), with
group one consisting of Grade 8-10 learners and group two consisting of Grade 11 and
12 learners.
All questionnaires were checked for correct completion by the researchers and research
assistant before learners left the group. Data was captured in SPSS by trained data
capturers and cleaned by one of the senior researchers and research assistant before
data analysis commenced. The fieldwork was conducted in a period of 8 weeks,
commencing in February 2011 and concluded at the end of March 2011. All
questionnaires were piloted and amended during the first school visit. Given the difficulty
to negotiate access to schools, and that only minor adjustments were necessary after
the pilot, it was decided to include these interviews as part of the final dataset.

5
Table 2: Sampling frame
Area distribution Total
Historical racial classification of majority learners
African Coloured
Cape Metro 15 11 4
Cape Winelands 4 3 1
Eden & Central Karoo 1 1 0
Overberg 1 1 0
West coast 1 1 0
Total 22 17 5
Table 3: Sample
Area distribution Total
Historical racial classification of
majority learners
African Coloured
Cape Metro 9 6 3
Cape Winelands 3 2 1
Eden & Central Karoo 1 0 1
Overberg 1 1 0
West coast 0 0 0
Total 14 9 5
Table 4: Sample Realisation
Area distribution Total
Historical racial classification of majority learners
African Coloured
Cape Metro 7 3 4
Cape Winelands 3 2 1
Eden & Central Karoo 1 0 1
Overberg 1 1 0
West coast 0 0 0
Total 12 6 6
3. FINDINGS
3.1 REPETITION
This paper aims to highlight high failure and repetition rates as a characteristic of
underperforming schools. It is not at all the argument of this paper to show grade failure
as an undesirable practice, in fact it is argued later that learners get promoted too easily
with a detrimental impact on their later scholastic performance. Given the context of

6
current failure and repetition policy together with the performance of grade 12 learners at
underperforming schools it is in fact postulated that if students are held back according
to their yearly performance failure rates would indeed be higher than is currently the
case.
Although grade repetition per se is not seen as a negative practice it is still important to
understand the context within which, especially high failure rates, occur given the impact
there of on the learner, the educational system and ultimately the broader society.
Learners who fail are often ostracised and labeled by the school and their peers. They
tend to experience problems with self-confidence and develop negative attitudes toward
education and schools.
Other consequences of high failure and repetition rates are
Resources at schools are placed under pressure by high failure rates
Classrooms become overcrowded and teachers overworked with an inevitable
resultant decline in the overall quality of teaching and learning
Catering for substantially higher pupil numbers also places huge additional
pressure on the fiscus
A less tangible consequence for schools is the long-term damage high rates of
repetition can cause to the well-being of staff and the reputation of the school as
a centre of education.
3.1.1 Race and Performance
The study found that most of learners at underperforming schools were predominantly
African (66%) in a province where Coloureds are in the majority and Africans constitutes
approximately 30% of the provincial population. In contrast, only 30% of learners in
these schools were Coloured. When we compare the demographic profile of the
province with the profile of learners at underperforming schools, it becomes evident that
Coloureds are under-represented at underperforming schools.
As mentioned earlier, underperforming schools are characterised by high levels of grade
repetition. Forty one percent of all learners in underperforming schools indicated that
they had repeated one or more grades. On the face of it, the data for underperforming
schools showed no significant difference in repetition rates between African and
Coloured learners. However, further analysis revealed that Coloured learners at

7
underperforming schools are more likely to show multiple repetition rates compared to
African learners. For example 80% of Coloured learners repeated multiple grades
compared to 35% of African learners. This is somewhat of an unexpected finding as the
Coloured learners in the study show better socio-economic living environments than
their African counterparts.
One of the possible reasons for this finding emanating from the research findings, is a
seemingly difference in views regarding the importance of education between African
and Coloured learners. This finding is supported by the findings of Salo (2005) who
shows this relative disregard towards education, specifically within the Coloured youth,
as emanating from a culture deeply imbedded in social perceptions of future reality and
general teenage behaviour. The factors that suggest a „poorer‟ culture of learning
amongst Coloured learners is the higher incidence of teenage pregnancy and gang-
related activities amongst this group. This relationship between social perceptions, youth
culture and educational attainment does, however, require more in-depth research.
3.1.2 Gender and Performance
In comparing the failure rates of boy and girl learners the data show girls in general to
have greater success, with 50% of male learners indicating to have repeated a grade
compared to only 35% of female learners. This finding is consistent with previous
research done on repetition rates of male and female learners in South Africa
(Gustafsson 2011:8).
We found the differential between female and male repetition rates to be quite wide at
underperforming schools. One tentative explanation, offered by experienced teachers in
interviews, is that girls growing up in poor socio-economic conditions and working class
communities are often burdened with a raft of domestic responsibilities from a young
age. This causes them to mature earlier than their male counterparts bringing with it a
greater sense of goal directedness and resilience - qualities that might influence their
relationship with the school and their studies.
But, in impoverished areas, a strong macho culture often dominates teenage peer
groups. This finds expression in deviant and aggressive behaviour in the context of anti-
social gang formation. The underlying ethos of many of these gangs is anti-intellectual,
encourages and celebrates values, norms and behaviour focused on immediate

8
gratification (Salo, 2005). It was pointed out by teachers that teenage boys, in particular,
find it difficult to resist this potent counter culture, even while attending school. This is
often exacerbated by the absence of positive male role-models.
3.1.3 Rural versus Urban Performance
Repetition rates were higher in rural underperforming schools (51%) compared to urban
schools (40%). Historically black rural schools in South Africa, including farm schools,
struggle to shed the legacy of urban bias in socio economic development. Rural schools
are typically more under-resourced than their urban counterparts and face deeper levels
of poverty than urban areas (Bloch, 2009).
3.1.4 Back to the Primary Schools
Sixty two percent of all grade repetitions at underperforming schools occurred during
secondary school, i.e. Grades 8 and 9. Thirty one percent of repetitions of these learners
occurred at primary school level, that is, grades 1 to 7 with only 7% of learners repeating
grades in both primary and secondary school.
In measuring repetition rates of individual learners over time, the data strongly suggest
that learners struggle during the first two years of schooling that is Grades 1 and 2, with
repetition rates declining between Grades 3 and 7. From Grade 8 the data show a
steady increase in the percentage of learners falling behind, with failure rates showing a
peak in Grades 10 and 11.
During in-depth interviews with educators, principals, SMT- and SGB members a clear
and strong perception on the primary cause of repetition was communicated, firmly
placing the blame for the high failure rate evident in underperforming secondary schools
on the poor quality of education at primary school level. It was repeatedly stressed by
the participants that primary schools are failing in their duty to lay a solid educational
foundation, especially in numeracy and literacy. This results in a shaky platform from
which Grade 8 learners launch into the much more varied and demanding curriculum of
secondary school.
Given this response it would then seem that an investigation into the performance of
primary schools in township and rural areas, primarily feeding underperforming
9
secondary schools, should first and foremost be conducted in the search for an
explanation for their persistent under-performance.
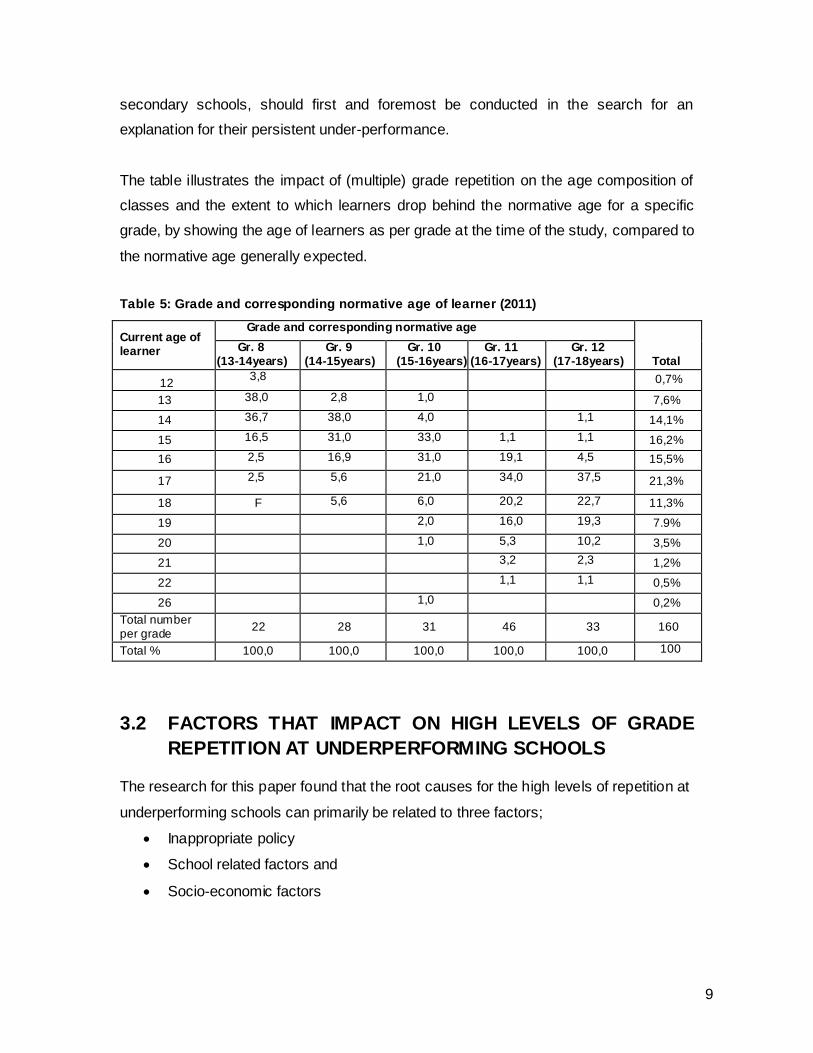
The table illustrates the impact of (multiple) grade repetition on the age composition of
classes and the extent to which learners drop behind the normative age for a specific
grade, by showing the age of learners as per grade at the time of the study, compared to
the normative age generally expected.
Table 5: Grade and corresponding normative age of learner (2011)
Current age of learner
Grade and corresponding normative age
Total Gr. 8
(13-14years) Gr. 9
(14-15years) Gr. 10
(15-16years) Gr. 11
(16-17years) Gr. 12
(17-18years)
12 3,8
0,7%
13 38,0 2,8 1,0 7,6%
14 36,7 38,0 4,0 1,1 14,1%
15 16,5 31,0 33,0 1,1 1,1 16,2%
16 2,5 16,9 31,0 19,1 4,5 15,5%
17 2,5 5,6 21,0 34,0 37,5 21,3%
18 F 5,6 6,0 20,2 22,7 11,3%
19 2,0 16,0 19,3 7.9%
20 1,0 5,3 10,2 3,5%
21 3,2 2,3 1,2%
22 1,1 1,1 0,5%
26 1,0 0,2%
Total number per grade
22 28 31 46 33 160
Total % 100,0 100,0 100,0 100,0 100,0 100
3.2 FACTORS THAT IMPACT ON HIGH LEVELS OF GRADE
REPETITION AT UNDERPERFORMING SCHOOLS
The research for this paper found that the root causes for the high levels of repetition at
underperforming schools can primarily be related to three factors;
Inappropriate policy
School related factors and
Socio-economic factors

10
3.2.1 Inappropriate Policy
Principals, SMTs and teachers agree that the most important issue that impacts on
grade repetition is of a systemic and policy nature.
Current policy states that a learner may only be “held back” once per educational phase.
This imperative forces and causes schools to promote learners to the next grade without
them having mastered the necessary subject knowledge and educational competencies
as demanded by the curriculum.
This was found to be fundamental to the under-performance of learners (and for that
matter schools) because, as one teacher at a rural school said
“...the school system is saturated with this problem, we are forced to promote mediocrity
by the system... we pass the ball on to the next teacher... as the child grows older the
problem grows bigger... when only 28% of the matriculants passes, we get the blame,
then we are told to pull up our socks, to get more involved... I have told the District office
the problem started 10 years ago, they say they know, but that we must „maak „n
plan‟...”.
A SMT member responsible for the Grade 8 learners at another rural school related her
experience:
“...last year we had 159 Grade 8s... I saw right at the beginning of the year we going to
struggle with these children... they come from a variety of rural farm schools that are
very weak... some could not read or write a sentence… I begged the District office to
keep 79 learners back; they would never make it in Grade 9... I was not allowed to do
so; it seems they are too afraid of the Head office in Cape Town...”
Teachers and SMT members interviewed felt strongly that District Offices were not
helpful in dealing with the contradictions and anomalies created by the application of this
current policy. They were of the opinion that the District Offices were often caught
between the realities of what was happening at schools and strict adherence to a set of
tight target and policy prescriptions.
The high prevalence of learners leaving the formal school system in Grades 10 and 11
should be seen as a direct consequence of the enforced promotion of educationally unfit
learners caused by, as one SMT member described it, “the indiscriminate and reckless

11
application of a mindless policy”. Another respondent described the present promotion
policy as “perverse, a cynical chase after numbers”. It was stressed that it was “a selfish
policy, designed to protect the education authorities and the school system whilst doing
an enormous disservice to the children and their parents”.
3.2.2 School Related Factors
School related factors have been extensively discussed in literature and highlight
operational areas within the schooling environment spanning teaching and learning,
leadership and management, safety and security, school culture, governance and
stakeholder participation (Christie, 2001, and Taylor, 2007, 2008).
3.2.2.1 Leadership and organisational systems
Leadership and organisational systems was shown as having a profound impact on the
quality of teaching and learning at a school. Findings from our research suggest that in
approximately 60% of underperforming schools surveyed, the relationship between the
SMT and principal could be described as tense, at best, and dysfunctional, at worst.
SMTs criticised the quality of leadership and the dedication of some principals. At one
school visited the principal was absent on both occasions the research team arrived. No
explanation for this could be given. Allegations were made by SMTs about principals not
taking action against teachers whose behaviour was undisciplined and unprofessional,
and about principals who were too afraid to discipline learners and who did not protect
teachers against abusive parents. SMT members were also dissatisfied with the quality
of communication within schools, alleging that principals withheld information as they
chose.
It was pointed out by SMT members that weak and ineffective leadership impacts
directly on the quality of teaching and learning as teachers struggle to manage classes
due to a pervasive lack of discipline; feel insecure because of the absence of clear
procedures and directives; and in some cases, feel unappreciated.
This leads to an unmotivated and demoralised teaching corps with subsequent harmful
consequences for quality teaching. From protracted interactions with SMT members
(some interviews were spread over a number of days) at the underperforming schools, it
became apparent that they were also disillusioned and lacking in enthusiasm.
12
3.2.2.2. School management teams (SMT)
Teachers were divided on the perceived contribution made by SMTs towards improving
their teaching. It was disconcerting that a significant percentage indicated that SMTs
never call meetings with teachers. Although there was broad agreement that meetings
with SMTs facilitate communication and the flow of important information that help them
deal with, what one teacher referred to as the “ever growing stack of paper work and
deadlines”, nearly 40% felt these meetings were mere talk shops with few decisions
being acted upon and implemented.
Very few teachers thought regular meetings with SMTs assisted them with curriculum
issues, specific questions around subject content, improvement of their style of teaching
or the effective management of classes. According to teachers, SMTs are not able to
add value because they lack adequate critical knowledge, technical capacity and are
weak leaders and managers. Teachers articulated a need for effective assistance,
guidance and mentoring in most aspects of teaching, but specifically around issues of
effective delivery of curricula and class management.
3.2.2.3. School governing bodies (SGB)
All schools included in the study reported to have a properly constituted SGB. School
governing bodies have the potential to make important contributions to quality teaching
and learning and to the effective functioning of schools. Whereas SGB members mostly
held positive views about their role in improving educational outcomes, principals and
teachers were less enthusiastic about their role. Virtually all principals confirmed that
SGB members where equipped in performing a number of mandatory functions, but did
not add much value in empowering the school to any significant extent, lamenting a
general lack of financial acumen or fundraising abilities with all principals lamenting the
resultant “poor man‟s educational diet” their schools have to function with.
Teachers were even more critical when evaluating the role of SGBs. Thirty eight percent
thought they made no real tangible contribution to the school, in general, and the
education of children, in particular. They felt SGBs played a strong part in the low morale
amongst both teachers and learners by criticising rather than building competencies and
self-esteem. The view that was repeatedly expressed was that members of the SGBs
were mostly from working class backgrounds and that they did not fully grasp the

13
challenges that teachers and schools faced on a daily basis, nor were they able to help
address the problems teachers encountered on a regular basis.
Teachers also felt that SGBs were often incapable of helping to apply effective
disciplinary measures, like recommending expulsion. This had a destructive impact on
the overall dynamic of a school. They were also of the opinion that SGBs did not have
the necessary knowledge to make informed decisions regarding teacher appointments.
According to teachers the lack of capacity amongst SGB members to effectively raise
funds for their schools, as one of the most important strategic functions of governing
bodies, forces teachers to divert their attention from teaching related activities to
fundraising with obvious negative consequences for the teaching and learning
programme at school.
Collectively these factors served to impact negatively on quality tuition and instruction,
partially explaining under-performance at these schools.
3.2.2.4. Absenteeism, class skipping and late coming by teachers and learners
Principals and SMTs in turn were frustrated with the high levels of absenteeism of
teachers at underperforming schools and claimed it played a significant role in failure
and repetition rates at their schools. They felt that this has a profound impact on the lack
of teaching and learning in classrooms and “time on task spent” at these schools.
Principals of schools catering for Xhosa-speaking learners singled out the serious
disruptive impact that the phenomenon of teachers attending funerals in the Eastern
Cape has on a sustainable educational programme. Present departmental policy
requires a minimum number of days of absence before a temporary replacement can be
employed. Often teachers return before replacements can be requested, leaving
learners without tuition for consecutive days. One principal referred to “the white school
with lots of money in the town” having a reservoir of highly qualified stand-by teachers
that get paid to stand in for absent teachers. Some SMT members thought that endemic
absenteeism of both teachers and learners was a result of the lack of discipline and non-
implementation of existing policies due to absent or weak leadership demonstrated by
principals.

14
Contact time between educators and learners was severely compromised not just by
high rates of absenteeism and late coming, but also by the skipping of class hours by
learners and educators alike. Eighty two percent of principals indicated that learners at
underperforming schools were “always late” whilst 36% indicated that staff members
were “always late”. Forty five percent of principals indicated that skipping class hours by
learners “always” happened, whilst 55% stated that staff members “sometimes” did. In
the case of staff members these problems are often exacerbated by the absence of an
effective policy governing such behaviour in underperforming schools. In slightly more
than 50% of the sample schools, principals indicated that there was no staff policy
governing absenteeism, late coming or the skipping of class hours. In the few schools
where such a policy was in place, it was often not effectively enforced.
3.2.2.5. Language of learning and teaching
The medium of instruction in schools, referred to as the language of learning and
teaching (LOLT), at the black underperforming schools was singled out as a serious
constraint on effective instruction and learning.
Responses relating to the language used when teaching showed that different practices
are followed, specifically amongst teachers whose mother tongue was not English or
Afrikaans. In spite of formal policy regulations stating the language of teaching and
learning as English and Afrikaans, a great number of teachers at underperforming
schools indicated to make use of mother tongue instruction. In all these cases mother
tongue referred to isiXhosa. This seemed to be mainly due to teachers as well as
learners limited proficiency in English. This was illustrated by reports by teachers from a
specific school mentioning cases of Grade 9 learners not able to answer a class test and
merely submitting the questions back as answers, effectively exhibiting zero competence
in comprehending any English.
Less than 20% of learners who repeated a grade received schooling in their mother
tongue compared to 33% who were partially schooled in their home language, and
nearly 50% who were taught in a first or second additional language. In many classes
the researchers observed how teachers switched between languages, often conversing
in Xhosa to explain subject content. If strictly applied this practice is against official
policy. A unique challenge is presented by learners migrating from the Eastern Cape,

15
who in many instances, do not even have a rudimentary proficiency in English. All
stakeholders at black schools were unanimous that the present LOLT policy was not
working and was significantly contributing to high repetition rates.
3.2.2.6. Overcrowding of classrooms and teacher to learner ratio‟s
Our research established that overcrowding impacts the classroom environment in many
ways. Overcrowding, especially in the lower grades of secondary schools, has a
negative impact on teaching and learning. Learners, who were already educationally
compromised at primary school level, are thrust into overcrowded classrooms.
With regards to the teacher to learner ratio the research found that for most
underperforming schools the ratio is 40 learners per teacher. This is higher than the
provincial average of 29 learners per teacher.
It is important to note that teaching and learning in underperforming schools has to take
place in an environment marked by both overcrowding and high learner to teacher ratios.
Clearly this type of environment is conducive to neither teaching nor learning. Teachers
complained that these conditions greatly impacts learner concentration. Overcrowded
class rooms make it impossible for teachers to move between desks and even between
the front row and the chalkboard. This, together with high learner to teacher ratios,
makes any personal assistance during classes practically impossible. In addition, large
class sizes make it extremely difficult for teachers to enforce discipline.
Table 6: Average learner to teacher ratio for the period 2008-2010
Learner Grade group
Learner to teacher ratio as reported for the
period 2008-2010
2008 2009 2010
Grade8 46/1 42/1 44/1
Grade 9 41/1 38/1 44/1
Grade 10 46/1 43/1 42/1
Grade 11 42/1 45/1 40/1
Grade 12 41/1 43/1 40/1

16
3.2.2.7. Safety and security of the school ecology
A stable, peaceful and safe school environment is conducive to successful learning. Our
findings suggest that issues around safety and security, both on the school grounds and
in the classroom have an impact on repetition rates. The data shows that incidences of
violence, intimidation, illegal possession of drugs, inappropriate sexual behaviour,
alcohol abuse and bodily injury to learners, verbal abuse and weapon possession are
high in the schools sampled. Many teachers and learners also have to deal with
intimidation, aggressive and violent behaviour in classrooms, which makes teaching and
learning difficult. Eighty seven percent of teachers indicated that disruptive learners
significantly limit the teaching and learning.
Table 7: Key issues and problems that impact safety and security at underperforming
schools (learner responses)
How often does the following happen at your school?
Aspects related to safety and security at school Always (%) Sometimes (%) Never (%)
Swearing 39,2 48,6 12,2
Vandalism 23,7 58,5 17,8
Theft 28 56,9 15,2
Intimidation or verbal abuse among learners 23,1 57 19,9
Physical or bodily injury among learners 13,9 62,2 23,9
Intimidation of verbal abuse among educators/staff 7,1 30,4 62,5
Physical or bodily injury to teaching staff 9,9 27,4 62,6
Tobacco use or possession 50,7 31,1 18,2
Alcohol abuse or possession 9,8 38,6 51,6
Illegal drug abuse or possession 19,1 41,6 39,3
Weapon use or possession 18,3 46,8 34,9
Inappropriate sexual behaviour among learners 10,5 42,4 47,1
Verbal abuse of learners by educators 10,3 43,8 45,9
Verbal abuse of educators by learners 10,5 49,2 40,3
Inappropriate relationships between learners and
teachers 19,4 24,9 55,7
The Western Cape Education Department (WCED) has responded to the lack of safety
and security at schools by launching the Safe Schools Project. Schools are given inter
alia access to security cameras, gates, fencing with razor wire. Critics have indicated

17
that the project does not assure the security of individuals but mainly that of the buildings
and equipment. A lack of funding is a serious constraint of this initiative, preventing the
project of immediately attending to urgent needs of schools.
3.2.2.8. Teacher experience as an indicator of teaching quality
Our study established that lower repetition rates were associated with longer teaching
experience (measured in terms of number of years teaching) and higher qualifications. In
addition to the above, the research findings suggests that the correspondence or
alignment between subject training and actual subject taught to have an impact on
repetition rates. The data found that a large proportion of teachers included in the study
did not teach subjects in which they were trained. For example only 33% of teachers
who specialised in Afrikaans taught Afrikaans. The absence of adequate numbers of
educators who were trained in specialist subjects like Mathematics and Physical Science
means that “non-subject specialists” often have to do stand in to teach these critical
subjects.
A seemingly common tendency amongst teachers identified by principals is coming to
class unprepared for teaching and then using tuition time for class preparation instead of
instruction, thus wasting valuable teaching time.
Table 8: Training received in the subject taught
Subject currently teaching
Percentage of teachers who received training in the
subject currently taught
Yes No
Afrikaans Home Language 80 20
Afrikaans (First Additional Language) 33 67
English Home Language 100 0
English (First Additional Language) 91 9
Physical Science 67 33
Mathematics 73 27
Mathematics Literacy 82 18
Accounting 100 0

18
3.2.3 Socio-economic Factors
The publication of the Coleman Report in the USA (1966) firmly puts the spotlight on the
effects of the physical and social environments on educational performance. The study
confirmed that high repetition rates at schools were directly related to the adverse social
and economic conditions faced by learners, but that poverty on its own was not
responsible for poor educational outcomes in all cases. This is evident in the examples
of some poorer countries in Sub-Saharan Africa that continued to outperform South
African pupils in international literacy and numeracy tests. Today, research continues to
show that school performance is directly and fundamentally impacted by socio-economic
factors such as race, gender, poverty; and neighbourhood conditions. See van der Berg
2008, and Thrupp 2006, Lee & Madyun (2009).
Our research found that most underperforming schools are located in poor communities
that also exhibited dysfunctional behaviour. According to O‟Connor (2004, p58) a
dysfunctional community can be characterised by a,
“number of social conditions/symptoms (including a state of mind in a community) such
as crime, gang activities, violence and trauma, tuberculosis, alcoholism, substance
abuse, teenage pregnancies..”
According to this author a community that is dysfunctional, as defined above, has
already internalised a dysfunctional system of beliefs, norms, values and knowledge. It is
very difficult for schools located in dysfunctional communities to counter the culture and
values of the surrounding community. Berliner (2009:29) has found that,
“Schools whose attendance boundaries include dysfunctional neighborhoods, face ...
greater challenges in nurturing student achievement than do those that draw students
from healthier neighborhoods.”
Our data shows that learners at underperforming schools very often come from families
where both the nuclear and extended family units had disintegrated. An analysis of the
primary caregivers of the learners interviewed revealed significant differences between
the caregivers of learners on the basis of race. On average local African learners are
least likely to live with both their biological parents (27%) compared to 71% of foreign
African learners and 45% of Coloured learners. The vast majority of local Africans live
with only their mother (36%) compared to 26% of Coloureds and 7% of foreign Africans.

19
Migrant learners were particularly vulnerable as only 26% of them live with both their
biological parents, 29% live with their mothers only and a staggering 14% live without
any adults in the household (compared to 3% of non-migrant learners).
The low level of educational attainment among caregivers, even in households where
both biological parents are present, suggests that parents are not able to meaningfully
assist learners with homework. For example, 48% of primary breadwinners had
completed some secondary schooling whilst only 28% had completed secondary school.
This lack of educational attainment of caregivers is of particular relevance for Grade 11
and 12 learners as it implies that these learners are often left with little or no educational
support apart from the school system.
4. POLICY CONSIDERATIONS AND RECOMMENDATIONS
The causes of high rates of grade failure and repetition are multiple and multi-layered.
This implies that a comprehensive attack on causes is required to address performance
at underperforming schools. Any solution to underperforming schools would necessarily
require interventions at both school level and domains that are external to schools.
4.1. OBSERVATIONS AROUND LITERATURE
Strong evidence exists showing that adherence to basic educational systems and
processes can have an impact on good teaching and learning. This is well-documented
by Nick Taylor (2006, 2007). His research shows that issues around the maximisation of
contact time with learners in class, the presence of both learners and teachers at school
and in class, makes a positive impact on educational performance and on the reduction
of grade failure. Much of this is achieved by good systems and discipline. Our research
has confirmed this, but also revealed that the lack of expertise at underperforming
schools meant that teachers were often required to teach subjects in which they had no
formal specialisation.
Our research found governance, management and leadership at underperforming
schools, all aspects that play a critical role at well-functioning schools, to be weak. A lack
of implementation of departmental systems is evident. One example of this is the high
20
percentage of principals not adhering to the policy guidelines governing absenteeism,
skipping of classes by teachers and learners and late-coming by learners in particular.
This results in a chronic and systemic reduction of teaching and learning in class that is
“time on task”, and subsequently contributes to high failure and repetition rates amongst
learners.
The critical role that a good foundation phase plays in the successful participation and
eventual completion of the educational career of learners is well-established. Our
research has found a relatively high percentage of learners had to repeat Grades 1 and
2, suggesting a low level of school readiness amongst six and seven year-olds in the
townships and rural areas of the Western Cape.
A policy issue interrogated by our research was the role of official language (policy) in
successful teaching and learning. Research evidence clearly points to the didactic
advantages of an appropriate LOLT (Bloch, 2002). Our findings have confirmed this.
Principals, SMT members and teachers have stressed the difficulties that already
disadvantaged learners experience with a language medium that is not their first and in
many cases not their second language of preference.
Although there is no consensus in the literature as to the impact of class size on
teaching and learning, our research suggests that teachers have difficulty managing
overcrowded classes. This is exacerbated by badly disciplined children and learners
struggling with concentration and the memorising of work due to the regular exposure to
trauma associated with domestic violence and environments saturated with social
problems. Under more ideal circumstances, that would imply a relatively safe and stable
home and community environment, as well as a functional school, class size might not
be a critical variable; however under circumstances and conditions as described above,
it does become an additional constraining and disabling variable.
The study confirmed that high repetition rates at schools were directly related to the
adverse social and economic conditions faced by learners. It found most
underperforming schools were located in poor, dysfunctional communities and that it
was difficult for them to counter the culture and values of the surrounding community
without the support of the NGO and private sectors.

21
4.2 RECOMMENDATIONS TO POLICY
These recommendations are based on research carried out in underperforming
secondary schools in the Western Cape, but are of a systemic and general nature. It
should be considered for implementation at all (underperforming) schools in South
Africa.
Recommendation 1: Cast a solid foundation
High quality educare programmes should be introduced to reach the 2-4 year olds living
in vulnerable and marginalised areas before they reach their reception year.
Our findings points to substantial failure rates in the first two years of schooling. This
proves that a high percentage of children in townships and rural areas are not ready to
participate in formal schooling at the beginning of their school careers.
The aggressive extension of Grade R by the Department of Basic Education throughout
South Africa will contribute to the improvement in the level of school readiness of the
most vulnerable cohort of the youngest learners. However, many children from
impoverished and working class urban and rural households are not yet catered for by
facilities that offer educational programmes of a high quality.
A broad consensus exists amongst educationalists that to successfully participate and
complete formal schooling, learners must be able to comfortably deal with the first two or
three years of schooling that is, the foundation phase.
Recommendation 2: Take a new look at primary schools
The quality of teaching within the primary school sector should be improved, specifically
those feeding underperforming secondary schools.
Our research found the teaching outcomes at many primary schools to not be of a level
that enables Grade 7 learners to advance successfully to Grade 8 and beyond. The high
repetition rate of particularly Grade 8 learners at underperforming secondary schools is
proof of this.
It is recommended that the National Department of Basic Education institute a
compulsory national Grade 7 assessment or examination in an effort to ensure a basic
competency for learners entering secondary schooling. This will ensure that learners are
assessed in a standardised fashion and that only those learners with the requisite skills
are allowed to advance. It is acknowledged that this gate-keeping will inevitably increase
learner numbers at primary level and measures to assist schools in managing this

22
development should be instituted simultaneously so as not to disrupt the educational
programme.
Recommendation 3: Rethink grade promotion policy
Existing policies governing the promotion of learners per learning phase should be
reconsidered.
Our research found that the current policy whereby learners are allowed to fail only a set
number of grades during a 12 year cycle is fundamentally flawed and has implications
for both the learner and school.
Many learners, who have already repeated the quota of grades allowed in the
Intermediate Phase while attending primary school, find themselves promoted to
secondary schools in the Senior phase of the General Education and Training Band. The
lack of preparedness of these learners to manage the senior phase is evident in the
large repetition rates of Grade 8 learners in entering secondary school.
This ultimately results in high levels of frustration and disillusionment with the
educational system amongst both learners and teachers at underperforming secondary
schools. Learners feel lost and disengaged and their behaviour becomes disruptive.
Teachers, in turn, feel demoralised and experience a sense of failure when large
numbers of their learners continuously fail Grade 8. This pattern seems to repeat itself in
Grade 9 and 10. Our findings suggest that the high drop-out rate in Grade 10 at
underperforming schools is, to a significant extent, a consequence of this policy.
To address this, schools must be allowed to fail learners that do not achieve the required
standard in examinations. No learner should be promoted without meeting the requisite
standard.
Recommendation 4: Reduce teacher to learner ratio
The Department of Basic Education should increase the number of classrooms and
teachers in the lower grades of secondary school significantly.
Our research established that learner to teacher ratios at underperforming secondary
schools, specifically Grades 8 to 10, were bigger than the prescribed norm.
We recommend that the Department of Basic Education significantly increase the human
resource capacity of secondary schools in order to bring down the teacher to pupil ratio
(ideally 1 to 25) to enable teachers to identify learning deficiencies and afford remedial
intervention and/or individual assistance to learners.

23
Recommendation 5: Make the language policy work for learners
The Department of Education should address the present LOLT policy with a stronger
focus on home language instruction.
The present official language policy prescribing teaching and learning to be in either
English and/or Afrikaans in South African secondary schools was found to profoundly
debilitate or constrain both the learning and teaching process at underperforming
secondary schools, which in the case of Western Cape primarily caters for Xhosa-
speaking learners.
All interviewed stakeholders stressed that the present policy is not working and creating
serious impediments to teaching and learning and that official policy was being
circumvented by different means and practices by principals, SMT members and
teachers.
Recommendation 6: Strengthen leadership and management
Principals should sign performance contracts, SMTs should be up-skilled and SGB‟s
should be differently constituted.
Shortcomings with the management and governance of underperforming schools were
found.
Due to the poor quality of principal leadership generally found at underperforming
secondary schools evidenced in poor principal accountability, it is recommended that, in
conjunction with a performance contract, a mentoring system be instituted to develop
leadership skills.
SMTs are perceived by teachers not to assist educators to become better teachers.
Teachers articulated a need for effective assistance, guidance and mentoring in most
aspects of teaching, but specifically around issues of effective delivery of curricula and
class management. Their contribution could be enhanced if they were up-skilled in their
respective subjects and freed up more by the appointment of additional teachers.
Although SGBs potentially can make meaningful contributions, their impact is seen as
limited. An important reason is the modest level of experience and skills amongst the
parents of these schools suggesting the existing model is flawed when applied to
schools located within a township and/or impoverished working class context.
A possible route to strengthen the capacity of SGBs is through the targeted nominations
of highly skilled individuals from civil society, private sector companies and academia.

24
Recommendation 7: Revisit existing official policy regulating teacher absenteeism
The current official policy that regulates absenteeism amongst teachers needs to be
critically reassessed by the relevant authorities
Principals at underperforming schools stressed the negative impact on teaching and
learning of the high prevalence of absenteeism amongst teachers. They alleged that
many teachers exploit the current policy that regulates absenteeism. In many cases the
duration of teacher absence makes it impossible for schools to access additional
assistance within the context of the current Departmental policy.
Recommendation 8: Building a bridge - acting on environmental challenges
A bridging mechanism should be developed to address both school and non-school
issues.
Our findings have established a raft of essentially non-educational variables that
influence the ability and attitude of learners to productively and optimally engage in
educational programs.
Educational authorities have limited capacity and influence and are not able to act back
at broad societal realities and challenges impacting on learners. It is important that
society recognises and acts on this.
We recommend a bridging mechanism that brings together programmes and
interventions by all stakeholders in society. Given the multi-faceted nature of variables
associated with underperformance at township and rural schools, a broad-based and
integrated response is sought that involves government, civil society, business and the
community. This is in line with a recent statement made by the Deputy Minister of Basic
Education provided below:
“The starting point for change in the education sector is with the poorest of
the poor, and the key question is how do we get the public and our
partners in the private sector to respond to this?”
(Deputy Minister of Basic Education, Mr. E Surty, 2011.)
An example of such a bridging system can be found in the Madrasati “My School”
Initiative, developed and implemented in schools in Jordan (see appendix 1 for detail on
this model). It is proposed that more such models are reviewed as positive examples of
building bridges between teachers, learners and ultimately the community.

25
5. REFERENCES
Berliner, D.C. (2009) Poverty and Potential: Out-of-School Factors and School Success.
Arizona State University: Education Policy Research Unit.
http://epicpolicy.org/publication/poverty-and-potential
Bloch, C. (2002). A case study of Xhosa and English bi-literacy in the foundation phase
versus English as a 'medium of Destruction. Perspectives in Education, Vol. 20, No. 1.
Bloch, G. (2009). The Toxic Mix. What‟s wrong with South African schools and how to fix
it. Tafelberg, Cape Town.
Bodenstein, M. (2008). What works in school development? Joint Education Trust (JET).
www.jet.org.za
Christie, P. (2001) Improving school quality in South Africa: a study of schools that have
succeeded against the odds. Journal of Education, (26):40-65.
Gustafsson, M. 2011. The when and how of leaving school: The policy implications of
new evidence on secondary schooling in South Africa. It is available at
ideas.repec.org/p/sza/wpaper/wpapers137.html.
Lee, M. and Madyun, N. (2009). The Impact of Neighborhood Disadvantage on the
Black-White Achievement Gap. Journal of Education for Students Placed at Risk
(JESPAR), Vol. 14 No. 2, pp 148-169. http://web.ebscohost.com.ezproxy.uct.ac.za
(Database: ERIC)
Muijs, D. (2007) Improving failing schools: Towards a research-based model. www.fm-
kp.si/zalozba/ISBN/978-961-6573-65-8/077-090.pdf)
O‟Connor, C.J. (2004). A review of the developmental vision and work of the City of
Cape Town‟s Community Development Department (February 1997 to December 2000 )
and its successor the department of Community Services (January 2001 to June 2003)
which was aimed at transforming socially dysfunctional communities such as
Manenberg. Masters thesis report, School of Government of the University of the
Western Cape.
Salo, E., 2005. Mans in Ma Soe: Ganging practices in Manenberg, South Africa and the
ideologies of masculinity, gender and generational relations,
http://www.csvr.org.za/wits/confpaps/salo.htm.
Statistics South Africa. (2010). Millenium Development Goals. Country Report 2010.
Pretoria

26
Thrupp, M. and Lupton, R. (2006). Taking School Contexts More Seriously: The Social
Justice Challenge. British Journal of Educational Studies, Vol. 54, No. 3, Social Justice
and Education: New and Continuing Themes, pp. 308-328.
(www.jstor.org.ezproxy.uct.ac.za)
Taylor N. (2006). Accountability and Support in School Development in South Africa.
Paper presented to the 4th Sub-regional Conference on Assessment in Education, 26-30
June 2006. Hosted by UMALUSI.
Taylor N, Fleisch B, Shindler J. (2007). Education Scenarios for 2019. Paper prepared
for the Key Driving Forces Scenarios 2019, the Office of the Presidency, 11-12 June
2007.
Taylor N. (2007a). Equity, efficiency and the development of South African schools.
Presentation to the Consortium for Research on School Quality seminar, April 2005.
Also published as Chapter 29 IN: International Handbook of School Effectiveness and
Improvement. Springer International Handbooks of Education, Vol. 17. Townsend, Tony
(Ed.). Dordrecht: Springer.
Taylor N. (2007b). How can school performance be improved? Presentation to the
Imbewu Programme Review Conference, Port Elizabeth, 25-28 June 2007.
Taylor, N. (2008). What‟s wrong with South African schools? Presentation to conference
on „What‟s working in school development‟, 28 – 29 February. JET Education Services.
Van der Berg, S (2008). How effective are Poor schools? Poverty and educational outcomes
in South Africa. Studies in Educational Evaluation 34 (2008) 145–154.


![GOVERNMENT GAZETTE STAATSKOERANT · schools, [senior secondary schools, junior] secondary schools, pri~·ary schools, [nursery] pre·primary schools, agricultural schools, vocational](https://static.fdocuments.net/doc/165x107/5f027afd7e708231d40478ca/government-gazette-staatskoerant-schools-senior-secondary-schools-junior-secondary.jpg)

