A REPORT ON HIRING ACTIVITY IN INDIA - Info Edge€¢ May 2017 Jobs index saw YOY dip in major...
12
A Naukri.com Report JOBSPEAK All rights reserved 2016 © Info Edge (India) Limited. A NAUKRI.COM MAY 2017 REPORT by: Location, Industry and Experience A REPORT ON HIRING ACTIVITY IN INDIA
Transcript of A REPORT ON HIRING ACTIVITY IN INDIA - Info Edge€¢ May 2017 Jobs index saw YOY dip in major...

A Naukri.com Report
JOBSPEAK
All rights reserved 2016 © Info Edge (India) Limited.
A NAUKRI.COM MAY 2017 REPORT
by: Location, Industry and Experience
A REPORTON HIRING ACTIVITY
IN INDIA

TABLE OF CONTENTS
2
A Report on Hiring Activitiy in India May 2017 JOBSPEAK
All rights reserved 2016 © Info Edge (India) Limited.
Executive Summary........................... 4
Sectoral Analysis ............................... 5
Functional Area Analysis ................... 6
City based scenario ...........................7
Work Experience based analysis .... 8
Methodology ................................... 9
Annexure .......................................... 10-12
Hiring trends across Top Cities
Hiring trends across functional areas
3
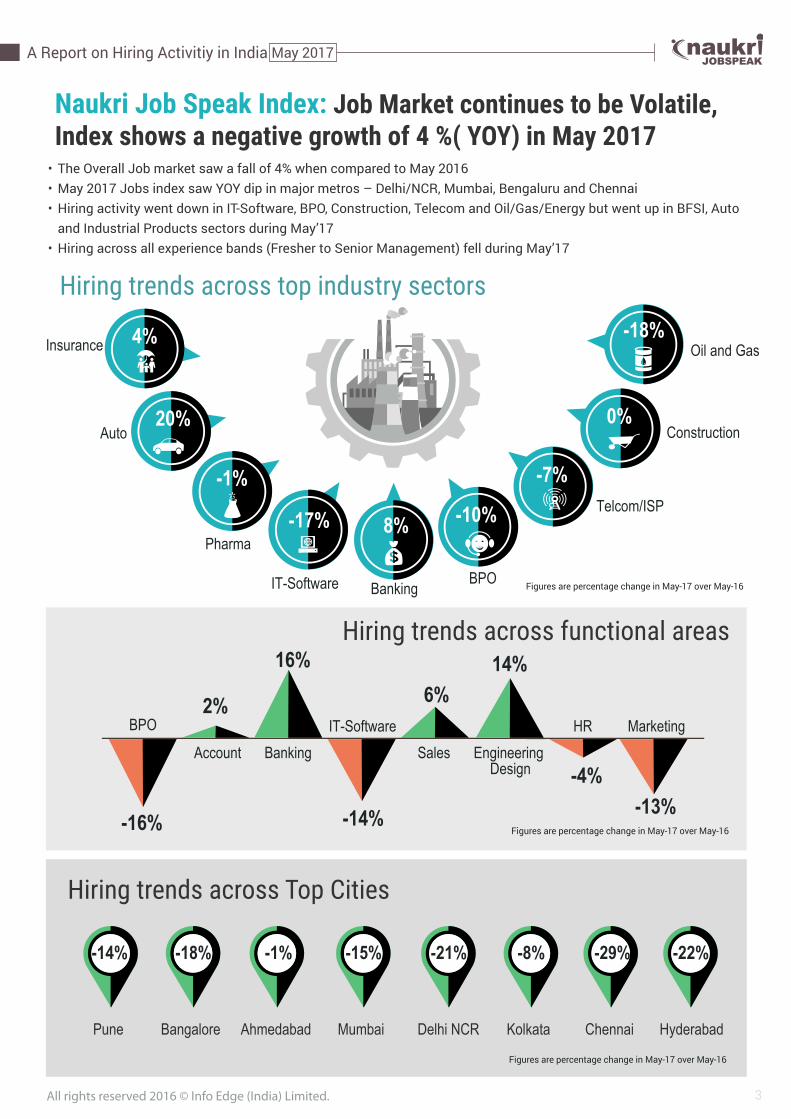
Naukri Job Speak Index: Job Market continues to be Volatile,Index shows a negative growth of 4 %( YOY) in May 2017
• The Overall Job market saw a fall of 4% when compared to May 2016• May 2017 Jobs index saw YOY dip in major metros – Delhi/NCR, Mumbai, Bengaluru and Chennai• Hiring activity went down in IT-Software, BPO, Construction, Telecom and Oil/Gas/Energy but went up in BFSI, Auto and Industrial Products sectors during May’17• Hiring across all experience bands (Fresher to Senior Management) fell during May’17
Hiring trends across top industry sectors
All rights reserved 2016 © Info Edge (India) Limited.
Mumbai Delhi NCR Kolkata HyderabadBangalorePune
A Report on Hiring Activitiy in India JOBSPEAK
Ahmedabad Chennai
Figures are percentage change in May-17 over May-16
BankingAccountHRBPO
Engineering Design -4%
2%
14%16%
Marketing
-13%
Sales
6%IT-Software
-14%-16%
-15% -8% -22%-18% -21%-14% -1% -29%
BPO
4%
20%
-1%
-17% 8%
-7%
0%
-18%
-10%
Banking
Oil and Gas
Construction
Telcom/ISP
IT-Software
Pharma
Auto
Insurance
May 2017
Figures are percentage change in May-17 over May-16
Figures are percentage change in May-17 over May-16

New Delhi, 7th June, 2017: The Naukri JobSpeak index for May’17 at 1904 is 4% down from May’16, indicating a fall in the overall new job creation scenario. IT-Software industry was hit the most during May’17 with a 17% declne in hiring as com-pared to May’16. Key industries like Telecom and BPO/ITES saw a 7% and 10% fall respectively, while Banking saw an 8% increase in hiring during May 2017 as compared to May 2016. Major metro cities recorded a YOY fall in May’17 as compared to May’16.
Commenting on the report, V. Suresh, Chief Sales Officer, Naukri.com said, “The job market continues to be volatile and there is an air of caution and uncertainty across industries and cities. The Jobspeak index for May has shown negative growth of 4%(YOY).This trend may continue for few more months before the job market starts moving north again.”
OVERALL JOB INDEX
Total no. of new jobs posted in July 2008 was scaled to 1000. Index for subsequent months is relative to Jul 08.
19601993 2129 1882 1835 1888 1580 1817 1659 1707 2073 1768 1904
May-16 Jun-16 Jul-16 Aug-16 Sep-16 Oct-16 Nov-16 Dec-16 Jan-17 Feb-17 Mar-17 Apr-17 May-17
1707
1960
2073
Overall Hiring Trends Index
4
1993
2129
1882
1835
1888
1580
May-16 Jun-16 Jul-16 Aug-16 Sep-16 Oct-16 Nov-16 Dec-16 Jan-17 Feb-17 Mar-17 Apr-17 May-17
1817
All rights reserved 2016 © Info Edge (India) Limited.
1659
A Report on Hiring Activitiy in India JOBSPEAK
1768
May 2017
1904

Industry-wise Analysis: • The IT-Software jobs saw a 17% fall in May’17as
compared to May’16• Auto and Auto Ancillary jobs saw 20% YOY
growth in May’17• Banking/Financial services and Insurance
sector saw an 8% and 4% increase respectively in May 2017 when compared to May 2016
• While the Telecom/ISP industry saw a dip of 7%, the BPO industry saw a 10% dip in May 2017 as compared to May 2016
• Oil and Gas sector recorded a 18% dip in hiring in May 2017 as compared to May 2016
• Construction and Engineering jobs remained buoyant during the same period
SECTORAL ANALYSIS
Hiring trends across top industry sectors
No. of new jobs posted in July '08 for each industry was scaled to 1000; all months have been compared with previous column
Industry Jul 08IT- Software 1000BPO and ITeS 1000Construction and Engineering 1000Auto and Auto Ancillary 1000Banking and Financial Services 1000Oil and Gas 1000Telecom 1000Insurance 1000Capital Goods 1000Pharma & Biotech 1000
23931572610100720685716307938271785
Mar-1728191791702119330369287849449792016
May-16 Jun-16 Jul-16 Aug-16 Sep-1628491891730105025498637888078421986
306319526691083231068512118758401959
23222110675115525856876968377971999
24081743686108428137117749618721916
257119876561116257069377810107962078
2092150156293522025747117137001668
Oct-16 Nov-1624841682582106025097657508187792010
Dec-162265150555291324066276567477031788
Jan-17 Feb-1726001894697124927176827098439491955
Apr-1721231703655104926977276727777911788
May-1723571702728125627417117308379951966
5All rights reserved 2016 © Info Edge (India) Limited.
JOBSPEAK
Banking 0%
-10%
4%
20%
8%
-18%
-7%
BPO
Insurance Auto
Construction Oil and GasTelcom/ISP
-1%Pharma
-17%
IT-Software
A Report on Hiring Activitiy in India May 2017
Figures are percentage change in May-17 over May-16

Functional Area Analysis:• While IT- Software jobs fell by 14% YOY, BPO jobs
saw a drop of 16% for the same time-period• Banking/Insurance and Accounts/Finance jobs
saw a growth of 16% and 2% respectively since May’16
• Sales/BD and Production, both saw an increase of 6% and 3% respectively in May’17 when compared to May’16
• Hiring in Marketing and Advertising fell by 13% since May 2016
FUNCTIONAL AREA ANALYSIS
No. of new jobs posted in July '08 for each F-Area was scaled to 1000; all months have been compared with previous column
Hiring trends across functional areas
Functional Area Jul 08IT-Software 1000Sales & Business Development 1000ITES and BPO 1000Production and Maintenance 1000Accounts and Finance 1000HR & Administration 1000Project Management 1000Marketing and Advertising 1000Banking and Insurance 1000Engineering Design 1000
223818842232952123317314921399994727
May-16 Jun-16 Jul-16 Aug-16 Sep-1627352075284311931408181262115781077862
2900215136081179149817745321674985814
23162073428611991349163952014951053796
23672079250711601370161555914041149735
24752100277211781400166957214831061779
Oct-16207916492088976119415454701319961651
Nov-1624461932239310441340177751413611151782
Dec-16219117792214915125116654751353973746
Jan-17 Feb-1725022147268011881362182455815421332862
28422164253212071541187662016491514944
Mar-17 Apr-1721142060233511011359162255114111224782
May-1723492204237712251436171861913731255981
6All rights reserved 2016 © Info Edge (India) Limited.
JOBSPEAK
BankingAccountHRBPO
Engineering Design -5%
2%
14%16%
Marketing
-13%
Sales
6%IT-Software
-14%-16%
A Report on Hiring Activitiy in India May 2017
Figures are percentage change in May-17 over May-16

City Wise Analysis
• 12 out of the 13 key cities tracked, saw a decrease in hiring activity in May’17 (YOY)
• While the index for Delhi/NCR, Mumbai, Chennai and Bangalore saw a dip of 21%, 15%, 29% and 18% respectively, Coimbatore was the only city that saw an increase of 17% as compared to May’16
CITY BASED HIRING SCENARIO
Job Trends Across Top Cities
No. of new jobs posted in July '08 for each city was scaled to 1000; all months have been compared with previous column
Delhi-NCR 1000Mumbai 1000Bangalore 1000Chennai 1000Hyderabad 1000Pune 1000Kolkata 1000
City* Jul 081773141920031480199522371528
2185174323491741248325962046
May-16 Jun-16 Jul-16 Aug-16 Sep-162553187426912175269327541981
2244168625922624226525071852
1789141319871788177119571550
1960149921331476194020951579
2285149421341473201720541616
Oct-161606973189987718671299914
Nov-161880158522791541217822891483
Dec-161772153420201277193920631456
Jan-17 Feb-172123162122401639234723321774
Mar-171880157119421392199821101811
Apr 172014159522021534209623661815
May17
Delhi
Kolkata
Pune
Ahmedabad
Mumbai
BengaluruChennai
-18% -29%
-14%
-15%
-8%
7
Hyderabad
-22%
-21%
-1%
All rights reserved 2016 © Info Edge (India) Limited.
JOBSPEAKA Report on Hiring Activitiy in India May 2017
Figures are percentage change in May-17 over May-16

• Hiring saw 11% fall in the 0-3 years’ experi-ence category since Apr’17
• Senior Management hiring fell, with jobs for 13-16 years of experience witnessing a fall of 6% when compared with Apr’17
• Hiring in Mid-Management (8-12 years of experience) and above 16 years of experi-ence, both witnessed a decrease of 6% during May’17
WORK- EX BASED SCENARIO
Experience Buckets
Composition of new jobs by experience bands
16%
26%
23%
19%
17%
0-3 yrs
4-7 yrs
8-12 yrs
13-16 yrs
>16 yrs
All rights reserved 2016 © Info Edge (India) Limited. 8
JOBSPEAKA Report on Hiring Activitiy in India May 2017

Naukri.com, India’s No. 1 job site and the flagship brand of Info Edge introduced the concept of e-recruitment in India. Since its inception in 1997, Naukri.com has seen contin-uous growth while outperforming its competi-tors in every sphere. Info Edge was the first internet Company to be listed in India. The site enjoys a traffic share of 78% as per Similarweb. Naukri.com is a recruitment platform that provides hiring-related services to corporates/ recruiters, placement agencies and to job seek-ers in India and overseas. It offers multiple products like Resume Database Access, listings and Response Management Tools. With more than 3,50,000 jobs live at any point and over 50 million CVs, Naukri.com serviced over 61,000 corporate clients in 2015-2016. The company employs over 4,000 people operating through 56 offices in 42 cities in India and over-seas offices in Dubai, Riyadh, Abu Dhabi and Bahrain.
METHODOLOGY
The index has been calculated based on job listings added to the site month on month. July 2008 has been taken as the base month with a score of 1000 and the subsequent monthly index is compared with data for July 2008. Data has been sourced from Naukri.com and it reflects of job listings and therefore hiring trends on the site. Jobs have been categorized by location, functional area, industry, experience bucket. The index has been analyzed across Cities/ Func-tional Area / Industry verticals. The report (pro-duced monthly) will show hiring trends across industry sectors, geography and functional areas. More than 60,000 national and interna-tional clients use Naukri.com, leading to high reliability of data.
DisclaimerThe data is only representative of the listings onNaukri.com. Our analytics team has used statisticaltechniques to derive insights which might beuseful for our users/stake holders/ audiences.There may be a statistical margin of error
9All rights reserved 2016 © Info Edge (India) Limited.
JOBSPEAKA Report on Hiring Activitiy in India May 2017
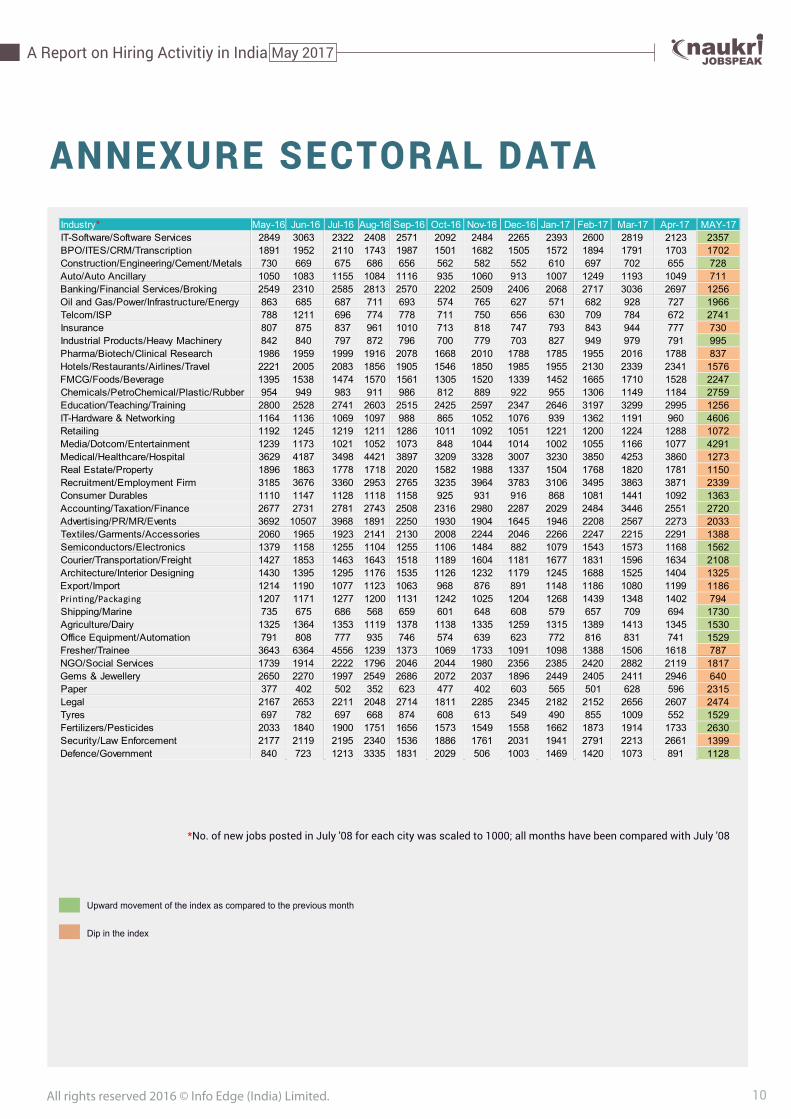
ANNEXURE SECTORAL DATA
*No. of new jobs posted in July '08 for each city was scaled to 1000; all months have been compared with July '08
Upward movement of the index as compared to the previous month
Dip in the index
10All rights reserved 2016 © Info Edge (India) Limited.
JOBSPEAK
Industry* May-16 Jun-16 Jul-16 Aug-16 Sep-16 Oct-16 Nov-16 Dec-16 Jan-17 Feb-17 Mar-17 Apr-17IT-Software/Software Services 2849 3063 2322 2408 2571 2092 2484 2265 2393 2600 2819 2123BPO/ITES/CRM/Transcription 1891 1952 2110 1743 1987 1501 1682 1505 1572 1894 1791 1703Construction/Engineering/Cement/Metals 730 669 675 686 656 562 582 552 610 697 702 655Auto/Auto Ancillary 1050 1083 1155 1084 1116 935 1060 913 1007 1249 1193 1049Banking/Financial Services/Broking 2549 2310 2585 2813 2570 2202 2509 2406 2068 2717 3036 2697Oil and Gas/Power/Infrastructure/Energy 863 685 687 711 693 574 765 627 571 682 928 727Telcom/ISP 788 1211 696 774 778 711 750 656 630 709 784 672Insurance 807 875 837 961 1010 713 818 747 793 843 944 777Industrial Products/Heavy Machinery 842 840 797 872 796 700 779 703 827 949 979 791Pharma/Biotech/Clinical Research 1986 1959 1999 1916 2078 1668 2010 1788 1785 1955 2016 1788Hotels/Restaurants/Airlines/Travel 2221 2005 2083 1856 1905 1546 1850 1985 1955 2130 2339 2341FMCG/Foods/Beverage 1395 1538 1474 1570 1561 1305 1520 1339 1452 1665 1710 1528Chemicals/PetroChemical/Plastic/Rubber 954 949 983 911 986 812 889 922 955 1306 1149 1184Education/Teaching/Training 2800 2528 2741 2603 2515 2425 2597 2347 2646 3197 3299 2995IT-Hardware & Networking 1164 1136 1069 1097 988 865 1052 1076 939 1362 1191 960Retailing 1192 1245 1219 1211 1286 1011 1092 1051 1221 1200 1224 1288Media/Dotcom/Entertainment 1239 1173 1021 1052 1073 848 1044 1014 1002 1055 1166 1077Medical/Healthcare/Hospital 3629 4187 3498 4421 3897 3209 3328 3007 3230 3850 4253 3860Real Estate/Property 1896 1863 1778 1718 2020 1582 1988 1337 1504 1768 1820 1781Recruitment/Employment Firm 3185 3676 3360 2953 2765 3235 3964 3783 3106 3495 3863 3871Consumer Durables 1110 1147 1128 1118 1158 925 931 916 868 1081 1441 1092Accounting/Taxation/Finance 2677 2731 2781 2743 2508 2316 2980 2287 2029 2484 3446 2551Advertising/PR/MR/Events 3692 10507 3968 1891 2250 1930 1904 1645 1946 2208 2567 2273Textiles/Garments/Accessories 2060 1965 1923 2141 2130 2008 2244 2046 2266 2247 2215 2291Semiconductors/Electronics 1379 1158 1255 1104 1255 1106 1484 882 1079 1543 1573 1168Courier/Transportation/Freight 1427 1853 1463 1643 1518 1189 1604 1181 1677 1831 1596 1634Architecture/Interior Designing 1430 1395 1295 1176 1535 1126 1232 1179 1245 1688 1525 1404Export/Import 1214 1190 1077 1123 1063 968 876 891 1148 1186 1080 1199Printing/Packaging 1207 1171 1277 1200 1131 1242 1025 1204 1268 1439 1348 1402Shipping/Marine 735 675 686 568 659 601 648 608 579 657 709 694Agriculture/Dairy 1325 1364 1353 1119 1378 1138 1335 1259 1315 1389 1413 1345Office Equipment/Automation 791 808 777 935 746 574 639 623 772 816 831 741Fresher/Trainee 3643 6364 4556 1239 1373 1069 1733 1091 1098 1388 1506 1618NGO/Social Services 1739 1914 2222 1796 2046 2044 1980 2356 2385 2420 2882 2119Gems & Jewellery 2650 2270 1997 2549 2686 2072 2037 1896 2449 2405 2411 2946Paper 377 402 502 352 623 477 402 603 565 501 628 596Legal 2167 2653 2211 2048 2714 1811 2285 2345 2182 2152 2656 2607Tyres 697 782 697 668 874 608 613 549 490 855 1009 552Fertilizers/Pesticides 2033 1840 1900 1751 1656 1573 1549 1558 1662 1873 1914 1733Security/Law Enforcement 2177 2119 2195 2340 1536 1886 1761 2031 1941 2791 2213 2661Defence/Government 840 723 1213 3335 1831 2029 506 1003 1469 1420 1073 891
A Report on Hiring Activitiy in India May 2017
23571702728711
125619662741730995837
157622472759125646061072429112731150233913632720203313881562210813251186794
173015301529787
1817640
231524741529263013991128
MAY-17

11All rights reserved 2016 © Info Edge (India) Limited.
ANNEXURE FUNCTIONAL AREA
*No. of new jobs posted in July '08 for each city was scaled to 1000; all months have been compared with July '08
Upward movement of the index as compared to the previous month
Dip in the index
JOBSPEAK
Functional Area* May-16 Jun-16 Jul-16 Aug-16 Sep-16 Oct-16 Nov-16 Dec-16 Jan-17 Feb-17 Mar-17 Apr-17 May-17IT-Software 2735 2900 2316 2367 2475 2079 2446 2191 2238 2502 2842 2114 2349
2204237712251436171861913731255981102992512862868509029248301176140317291720321225613323214596913551360
Sales / BD 2075 2151 2073 2079 2100 1649 1932 1779 1884 2147 2164 2060ITES / BPO / KPO / Customer Service / Operations2843 3608 4286 2507 2772 2088 2393 2214 2232 2680 2532 2335Production / Maintenance / Quality 1193 1179 1199 1160 1178 976 1044 915 952 1188 1207 1101Accounts / Finance / Tax / CS / Audit 1408 1498 1349 1370 1400 1194 1340 1251 1233 1362 1541 1359HR / Administration / IR 1812 1774 1639 1615 1669 1545 1777 1665 1731 1824 1876 1622Site Engineering / Project Management 621 532 520 559 572 470 514 475 492 558 620 551Marketing / Advertising / MR / PR 1578 1674 1495 1404 1483 1319 1361 1353 1399 1542 1649 1411Banking / Insurance 1077 985 1053 1149 1061 961 1151 973 994 1332 1514 1224Engineering Design / R&D 862 814 796 735 779 651 782 746 727 862 944 782Purchase / Logistics / Supply Chain 977 1069 969 1003 986 809 1044 797 834 944 1014 922Secretary / Front Office / Data Entry 1187 1797 2882 819 869 742 888 795 819 962 968 931IT- Hardware / Telecom / Technical Staff / Support1452 1625 1380 1400 1417 1195 1371 1155 1228 1372 1322 1202Teaching / Education 2950 2659 2646 2780 2465 2344 2591 2411 2885 3566 3775 3193Pharma / Biotech / Healthcare / Medical / R&D3590 3989 3503 4381 3794 3260 3480 3144 3282 4018 4069 4080Hotels / Restaurants 2783 2373 2586 2252 2360 2071 2581 2745 2559 2965 3085 2774Top Management 836 765 721 772 837 715 687 672 612 731 760 582Architecture / Interior Design 1193 1010 1198 1325 1278 828 1044 816 1049 1324 1157 1025Export / Import / Merchandising 1209 1209 1055 1300 1096 919 1112 1179 1242 1319 1282 1221Corporate Planning / Consulting 1430 1434 1496 1336 1409 1524 1643 1409 1406 2212 1850 1424Legal 1893 1817 1604 1595 1677 1651 1538 1739 1582 1769 2012 1628Web / Graphic Design / Visualiser 3183 3306 3164 3064 3205 2976 2929 2976 2898 3483 3698 3238Content / Journalism 2783 2727 2721 2670 2587 2192 2454 2546 2577 2814 2900 2365Ticketing / Travel / Airlines 2717 2682 3449 2775 2677 2291 2443 2428 2696 2787 3033 3934Fashion / Garments / Merchandising 1691 1560 1755 1714 1681 1440 1542 1586 1784 2085 1918 2042Guards / Security Services 1367 1866 1500 1153 1107 1122 1054 1245 1214 1209 1347 980TV / Films / Production 1371 1265 1094 1143 1468 1110 1332 1371 1339 1536 1632 1198Packaging 780 1368 961 907 1125 1487 938 979 1034 1045 1233 1163
A Report on Hiring Activitiy in India May 2017

12
ANNEXURE CITIES
*No. of new jobs posted in July '08 for each city was scaled to 1000; all months have been compared with July '08
Upward movement of the index as compared to the previous month
Dip in the index
All rights reserved 2016 © Info Edge (India) Limited.
JOBSPEAK
City* May-16 Jun-16 Jul-16 Aug-16 Sep-16 Oct-16 Nov-16 Dec-16 Jan-17 Feb-17 Mar-17 Apr-17 May-17Delhi / NCR 2553 2244 1789 1960 2285 1606 1880 1772 1773 2123 2185 1880 2014
159522021534209623661815242216722619203620763086
Mumbai 1874 1686 1413 1499 1494 973 1585 1534 1419 1621 1743 1571Bengaluru / Bangalore 2691 2592 1987 2133 2134 1899 2279 2020 2003 2240 2349 1942Chennai 2175 2624 1788 1476 1473 877 1541 1277 1480 1639 1741 1392Hyderabad / Secunderabad 2693 2265 1771 1940 2017 1867 2178 1939 1995 2347 2483 1998Pune 2754 2507 1957 2095 2054 1299 2289 2063 2237 2332 2596 2110Kolkata 1981 1852 1550 1579 1616 914 1483 1456 1528 1774 2046 1811Ahmedabad 2444 2362 1876 2206 2342 1509 2144 2111 2265 2642 2754 2631Chandigarh 2259 1765 1699 1558 1440 812 1415 1281 1326 1592 1729 1781Ernakulam / Kochi / Cochin 3369 2781 2573 2764 2220 2339 2519 2310 2349 2414 3079 2493Vadodara / Baroda 2121 1927 1671 1852 1841 1661 1818 1604 1620 1735 1914 1798Coimbatore 1780 2506 2452 1804 1428 968 1704 1396 1679 1846 2270 1694Jaipur 3854 3132 3446 3638 2737 1909 2748 2690 2666 3242 3038 2797
A Report on Hiring Activitiy in India May 2017