A Replication of Rorschach and MMPI–2 Convergent ValidityMMPI–2 and the Millon Clinical...
41
ARTICLES A Replication of Rorschach and MMPI–2 Convergent Validity Gregory J. Meyer Department of Psychology University of Alaska Anchorage Robert J. Riethmiller, Regina D. Brooks, William A. Benoit, and Leonard Handler Department of Psychology University of Tennessee We replicated prior research on Rorschach and MMPI–2 convergent validity by test- ing 8 hypotheses in a new sample of patients. We also extended prior research by de- veloping criteria to include more patients and by applying the same procedures to 2 self-report tests: the MMPI–2 and the MCMI–II. Results supported our hypotheses and paralleled the prior findings. Furthermore, 3 different tests for methodological ar- tifacts could not account for the results. Thus, the convergence of Rorschach and MMPI–2 constructs seems to be partially a function of how patients interact with the tests. When patients approach each test with a similar style, conceptually aligned con- structs tend to correlate. Although this result is less robust, when patients approach each test in an opposing manner, conceptually aligned constructs tend to be nega- tively correlated. When test interaction styles are ignored, MMPI–2 and Rorschach constructs tend to be uncorrelated, unless a sample just happens to possess a correla- tion between Rorschach and MMPI–2 stylistic variables. Remaining ambiguities and suggestions for further advances are discussed. Recently, Meyer (1997b, 1999a) hypothesized that the propensity for patients to be open, spontaneous, and engaged during the administration of the Minnesota Multiphasic Personality Inventory–2 (MMPI–2; Butcher, Dahlstrom, Graham, Tellegen, & Kaemmer, 1989), and the Rorschach (Exner, 1993) played a role in the JOURNAL OF PERSONALITY ASSESSMENT, 74(2), 175–215 Copyright © 2000, Lawrence Erlbaum Associates, Inc.
Transcript of A Replication of Rorschach and MMPI–2 Convergent ValidityMMPI–2 and the Millon Clinical...
ARTICLES
A Replication of Rorschach andMMPI–2 Convergent Validity
Gregory J. MeyerDepartment of Psychology
University of Alaska Anchorage
Robert J. Riethmiller, Regina D. Brooks,William A. Benoit, and Leonard Handler
Department of PsychologyUniversity of Tennessee
We replicated prior research on Rorschach and MMPI–2 convergent validity by test-ing 8 hypotheses in a new sample of patients. We also extended prior research by de-veloping criteria to include more patients and by applying the same procedures to 2self-report tests: the MMPI–2 and the MCMI–II. Results supported our hypothesesand paralleled the prior findings. Furthermore, 3 different tests for methodological ar-tifacts could not account for the results. Thus, the convergence of Rorschach andMMPI–2 constructs seems to be partially a function of how patients interact with thetests. When patients approach each test with a similar style, conceptually aligned con-structs tend to correlate. Although this result is less robust, when patients approacheach test in an opposing manner, conceptually aligned constructs tend to be nega-tively correlated. When test interaction styles are ignored, MMPI–2 and Rorschachconstructs tend to be uncorrelated, unless a sample just happens to possess a correla-tion between Rorschach and MMPI–2 stylistic variables. Remaining ambiguities andsuggestions for further advances are discussed.
Recently, Meyer (1997b, 1999a) hypothesized that the propensity for patients to beopen, spontaneous, and engaged during the administration of the MinnesotaMultiphasic Personality Inventory–2 (MMPI–2; Butcher, Dahlstrom, Graham,Tellegen, & Kaemmer, 1989), and the Rorschach (Exner, 1993) played a role in the
JOURNAL OF PERSONALITY ASSESSMENT,74(2), 175–215Copyright © 2000, Lawrence Erlbaum Associates, Inc.

convergent validity of scales derived from these two instruments. Drawing on evi-dence from a large sample of psychiatric patients, results supported this hypothesisand suggested that test interaction styles were important moderators of convergentvalidity. In the prior research, when test interaction styles were ignored, there wasvirtually no association between those Rorschach and MMPI–2 scales that sharedsimilar names (meanr = .03). When analyses were restricted to the subset of pa-tients who interacted with both tasks in a similar fashion, the same Rorschach andMMPI–2 scales were substantially correlated (rs≈ .40–.60). Although more equiv-ocal, results also suggested that patients who interacted with the Rorschach in onemanner (e.g., defensive constriction) and interacted with the MMPI–2 in an oppos-ing manner (e.g., exaggeration–dilation) produced negative correlations amongthese scales (rs ≈ –.20 to –.50).
To date, two different procedures have been used to define what we termtest in-teraction stylesor response–character styles.The primary procedure has beenbased on scales designed to measure the first principal component from each test;the other has been based on traditional indicators of test-taking style (i.e., usingFand K from the MMPI–2 andR and Lambdafrom the Rorschach; see Meyer,1999a, Table 1). Although these two sets of criteria select substantially differentpatients for analyses, similar results were obtained using both.
This study attempted to replicate these Rorschach and MMPI–2 associationswith an independent sample of patients. We followed the same procedures usedpreviously and tested eight hypotheses derived from the prior findings. First, weexpected scales of response–character styles on the MMPI–2 to be uncorrelatedwith scales of response–character styles on the Rorschach. Clinically, this hypoth-esis reflects our expectation that the way patients interact with one task shouldhave no bearing on their style of interacting with the other. Second, we expectedconceptually related Rorschach and MMPI–2 scales to be uncorrelated when re-sponse styles were ignored. Clinically, this reflects our expectation that each testwould generally provide distinct information that could not be obtained directlyfrom the other. Third, we expected conceptually related Rorschach and MMPI–2scales to be positively correlated when analyses were limited to those patients whohad similar test interaction styles on both methods. Clinically, this hypothesis pos-tulates a subset of patients who tend to obtain similarly elevated scores on the Ror-schach and MMPI–2 constructs. In part, this convergence is believed to result fromcongruent styles of interacting with each test, although these interaction styles areviewed as emerging from two very different sources and may reflect patients’ gen-uine characterological qualities, their deliberate efforts to manipulate the tests, orboth (see Meyer, 1997b, 1999a). Fourth, although more tentative, we expectedconceptually related MMPI–2 and Rorschach scales to be negatively correlatedwhen analyses were limited to those patients who had an opposing response–char-acter style on each method. Clinically, this hypothesis postulates a subset of pa-tients who obtain fairly different indications of pathology and health across these
176 MEYER ET AL.

two types of tests. As before, we expected that test interaction styles (emerging ei-ther from the patients’ character structure or from deliberate efforts to manipulatethe tests) contributed to these opposing impressions.
Theremaininghypothesesweredesigned tochallengeorsolidify thecoreexpecta-tions outlined previously. For our fifth hypothesis, we expected conceptually unre-latedMMPI–2andRorschachscalestoremainuncorrelatedacrossallanalyses(i.e., inthe full sample, in the analyses limited to patients with similar styles, and in the analy-ses limited to patients with opposing styles). Sixth, using a correction formula, we ex-pectedthatourobservedvaliditycorrelationswouldbelarger thanthecorrelationsonecould predict to see simply as a function of selecting certain patients for analysis (seeMeyer, 1997b, pp. 320–321). Seventh, we expected a multitrait–multimethod matrixto indicate (a) relatively differentiated Rorschach constructs but (b) relatively undif-ferentiated MMPI–2 constructs that would (c) produce weak evidence for convergentvalidity relativetodiscriminantvalidity (Meyer,1997b).Eighth,giventhegeneralhy-pothesis thatconceptuallyrelatedRorschachandMMPI–2scalesshouldbecorrelatedwhen response–character styles are correlated, we expected to see an association be-tweenconstructcorrelationsandfirst-factorcorrelationswhensmallsampleswerere-peatedly selected from the full population and the association was examined acrosssamples (see Meyer, 1999a).
In addition, to address recent criticisms (Archer & Krishnamurthy, 1999) weextended prior research in two ways. First, we modified and expanded the criteriato identify test interaction styles, and second, we developed a new strategy to ad-dress concerns about selecting particular patients for analysis. Each is discussed inturn.
In prior research, two sets of criteria have been used to define test interactionstyles: (a) traditional indicators of test-taking behavior that can be derived fromMMPI–2 or Rorschach profiles and (b) scales for assessing the first principal com-ponent from each test. As a third set of criteria for this study, we also used actualfactor scores derived from principal components analysis of the Rorschach and theMMPI–2 to measure the primary factors. Previous research (e.g., Meyer, 1999a)has been criticized because it used only a small subset of patients in the key analy-ses (Archer & Krishnamurthy, 1999). Indeed, about 45% of patients have beenclassified as having similar or opposing styles when using the factor-based scales,and only about 28% have been classified when using the profile criteria. In an ef-fort to expand the number of patients included in the key analyses, we decided toemploy a fourth, more liberal set of criteria to identify test interaction styles. Spe-cifically, we examined all those patients who were identified by any of the threecriteria sets as having a similar or an opposing test-taking style.
It is unusual to select certain patients for convergent validity analyses. Becausethese procedures are novel, it is appropriate to approach them with some caution(cf. Archer & Krishnamurthy, 1999). In particular, some may speculate that the se-lection procedures generate spurious findings. In an effort to address this question
RORSCHACH AND MMPI–2 REPLICATION 177

more thoroughly, the procedures used for the MMPI–Rorschach convergent valid-ity analyses were also applied to the data from two self-report instruments, theMMPI–2 and the Millon Clinical Multiaxial Inventory–II (MCMI–II; Millon,1987). Conducting a parallel set of analyses on two instruments from the samemethod family (i.e., self-report) should provide an important backdrop for consid-ering the cross-method Rorschach and MMPI–2 findings.
METHOD
Participants
The Tennessee sample. Data were obtained from an outpatient clinic inTennessee that serves both university students and community residents. The ini-tial sample consisted of 472 patients who voluntarily sought treatment between1991 and 1997. All tests were administered prior to treatment, and the MMPI–2 andRorschach were invariably administered within 3 weeks of one another. Of the ini-tial 472 patients, 429 completed the MMPI–2, 393 completed the Rorschach, and350 completed both the Rorschach and the MMPI–2. The 350 patients who com-pleted both instruments are the focus of this study. Data from 23 of these patientswere excluded from the analyses; 17 appeared to complete their MMPI–2 in a ran-dom fashion (i.e., [F + Fb]/2 T score > 115 andVRIN Tscore > 80), and 6 had Ror-schach protocols of questionable utility (i.e.,R< 12, orR= 12 or 13 andLambda>.50). For the remaining 327 patients, the average age was 29.9 (SD= 9.1, range =16–73), and 56.6% were female. The sample was diverse socioeconomically andpsychologically, with diagnoses that ranged from adjustment disorder to schizo-phrenia; however, the sample was racially homogenous—more than 95% of the pa-tients were White.
The Chicago sample. This sample was described in detail previously(Meyer, 1997b, 1999a). Several reanalyses of this data set were undertaken as partof this study to ensure that equivalent results were being compared across both sam-ples. Briefly, as part of a hospital-based psychological testing program, 362 pa-tients completed a valid MMPI–2 and a valid Rorschach. For the analyses usingtwo self-report instruments, data were obtained from 269 patients who completed avalid MCMI–II and a valid MMPI–2.
Measures for the Tennessee Sample
Rorschach protocols were administered and scored by doctoral students at the Uni-versity of Tennessee. At a minimum, these students were in their 2nd year of train-
178 MEYER ET AL.

ing and had completed a one-semester course in assessment with concurrentenrollment in an advanced personality assessment course. All students received 3hours per week of supervision in assessment by various faculty members. All Ror-schach protocols were entered into a computerized program for scoring (Exner, Co-hen, & McGuire, 1990), and a second computer program was used to read thesefiles into the statistical database.
All MMPI–2s were administered at roughly the same time as the Rorschach.Some of the MMPI–2s were initially computer scored by National Computer Sys-tems (NCS), and some were initially scored by hand. Because the NCS computer-ized data files were not available, all MMPI–2 items were manually entered intothe final database and then scored using computer algorithms.
Reliability of Rorschach scoring. To evaluate the reliability of Rorschachscoring, three raters (Robert J. Riethmiller, Regina D. Brooks, and William A.Benoit) each scored 43 protocols (totalR= 894). Six of these protocols were takenfrom Exner (1993), and the remaining 37 were randomly selected from the data-base. The raters scored independently, although they reviewed areas of disagree-ment after they completed the six protocols from Rorschach Workshops and alsoafter completing the first 18 protocols from the data set. To assess the key variablesof interest in this study, intraclass correlation coefficients (ICCs) were computed.The ICC is a chance-corrected reliability statistic that is equivalent to weightedkappa. Typically, values greater than .74 are considered to indicate excellent reli-ability, values from .60 to .74 are considered good, values from .40 to .59 are con-sidered fair, and values below .40 are considered poor (Cicchetti, 1994). Followingthe terminology of McGraw and Wong (1996), we used the Case 2 model and cal-culated ICC(A,1) withk = 3, which means we assumed that the three raters wererandomly selected from the population of student coders, and we determined thedegree of absolute agreement between a single rater and any other rater. Across all43 protocols, the ICC results wereR= 1.0,Lambda= .73,PureF%= .93,DEPI =.71,S–CON= .77,SCZI= .77, andHVI = .72.
Two comments should be made about the preceding figures. First, all the reli-ability values fall at the upper end of the good classification range or in the excel-lent range. Thus, they are quite respectable. Nonetheless, they are slightly lowerthan those that have been reported in the literature (Meyer et al., 1999). This ismost likely because the raters were still receiving training in the ComprehensiveSystem.
Second, the ICC forLambdais deceiving because this variable has a skeweddistribution. BecauseLambdais computed as a proportion (F / [R– F]), its distri-bution has an unstable upper tail, in which small differences inF can produce largedifferences inLambda.For instance, if one rater determines that 19 of 20 re-sponses are pure form, thenLambda= 19.0. If another rater determines thatF = 18,
RORSCHACH AND MMPI–2 REPLICATION 179
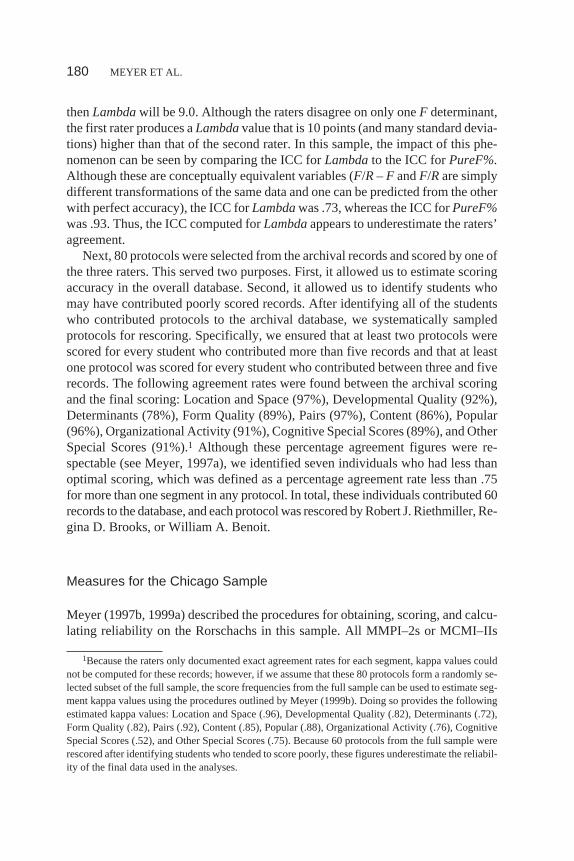
thenLambdawill be 9.0. Although the raters disagree on only oneF determinant,the first rater produces aLambdavalue that is 10 points (and many standard devia-tions) higher than that of the second rater. In this sample, the impact of this phe-nomenon can be seen by comparing the ICC forLambdato the ICC forPureF%.Although these are conceptually equivalent variables (F/R– F andF/Rare simplydifferent transformations of the same data and one can be predicted from the otherwith perfect accuracy), the ICC forLambdawas .73, whereas the ICC forPureF%was .93. Thus, the ICC computed forLambdaappears to underestimate the raters’agreement.
Next, 80 protocols were selected from the archival records and scored by one ofthe three raters. This served two purposes. First, it allowed us to estimate scoringaccuracy in the overall database. Second, it allowed us to identify students whomay have contributed poorly scored records. After identifying all of the studentswho contributed protocols to the archival database, we systematically sampledprotocols for rescoring. Specifically, we ensured that at least two protocols werescored for every student who contributed more than five records and that at leastone protocol was scored for every student who contributed between three and fiverecords. The following agreement rates were found between the archival scoringand the final scoring: Location and Space (97%), Developmental Quality (92%),Determinants (78%), Form Quality (89%), Pairs (97%), Content (86%), Popular(96%), Organizational Activity (91%), Cognitive Special Scores (89%), and OtherSpecial Scores (91%).1 Although these percentage agreement figures were re-spectable (see Meyer, 1997a), we identified seven individuals who had less thanoptimal scoring, which was defined as a percentage agreement rate less than .75for more than one segment in any protocol. In total, these individuals contributed 60records to the database, and each protocol was rescored by Robert J. Riethmiller, Re-gina D. Brooks, or William A. Benoit.
Measures for the Chicago Sample
Meyer (1997b, 1999a) described the procedures for obtaining, scoring, and calcu-lating reliability on the Rorschachs in this sample. All MMPI–2s or MCMI–IIs
180 MEYER ET AL.
1Because the raters only documented exact agreement rates for each segment, kappa values couldnot be computed for these records; however, if we assume that these 80 protocols form a randomly se-lected subset of the full sample, the score frequencies from the full sample can be used to estimate seg-ment kappa values using the procedures outlined by Meyer (1999b). Doing so provides the followingestimated kappa values: Location and Space (.96), Developmental Quality (.82), Determinants (.72),Form Quality (.82), Pairs (.92), Content (.85), Popular (.88), Organizational Activity (.76), CognitiveSpecial Scores (.52), and Other Special Scores (.75). Because 60 protocols from the full sample wererescored after identifying students who tended to score poorly, these figures underestimate the reliabil-ity of the final data used in the analyses.

were administered at roughly the same time as the Rorschach, and they were com-puter scored by NCS. Scores for these tests were obtained from the NCS files, ex-cept for four patients who only had MMPI–2 profile sheets available.
Defining Test Interaction Styles
As discussed earlier, test interaction styles (or response–character styles) have beendefined in the past using two separate sets of criteria: one based on factor-derivedscales and the other based on traditional scores readily available from an MMPI–2or Rorschach summary profile. In this study, we extended previous research by in-cluding two additional criteria, one based on actual factor scores for the unrotatedprincipal component from each test and one that combined cases identified by allthree sets of criteria. These four methods of classification are described below.
Criteria using factor-based scales. The procedures for defining response–character styles using the first principal components from the Rorschach and theMMPI–2 were discussed in detail by Meyer (1997b). Because Welsh’s Anxiety(A) scale was designed to quantify the first principal component of the MMPI–2,it has served as the key variable for measuring the first factor of the MMPI–2. Pa-tients were selected for analysis if they fell in the upper or lower third of theAscale distribution. To assess its adequacy in this sample, we conducted a principalcomponents analysis of theA scale along with the MMPI–2 basic, validity, andcontent scales. Using the 408 patients with valid MMPI–2s, the first unrotatedcomponent accounted for 48.3% of the total variance; the second, third, fourth,and fifth components accounted for 10.4, 5.7, 4.4, and 3.5% of the total variance,respectively. As expected, this dimension was defined by theAscale, which had aloading of .93. These findings indicate thatA is a good measure of the huge firstfactor of the MMPI–2.
The first unrotated principal component from the Rorschach has been termedRe-sponse–Engagement(R–Engagement) orResponse–Complexity(Meyer, 1997b).The formula to compute the R–Engagement scale was derived from a large sampleof college students (Meyer, 1992), and it is calculated usingzscores with the fol-lowing weights: .436(Color Shading Blends) + .372(FY) + .325(FC´) + .3(FC) +.3(CF + C) + .29(Shading Blends) + .29(m) + .29(R) + .27(S) + .24(FM) + .22(FV)+ .21(W) + .19(MOR) + .18(M) – .24(Lambda). Because the program we used totranslate Rorschach scoring files into our statistical database did not calculateshading blends, this variable was omitted from the R–Engagement scale in thissample. Nonetheless, to assess the adequacy of the R–Engagement scale in thissample, we conducted a principal components analysis of this variable along withother nonredundant scores for Location, Developmental Quality, Determinants,
RORSCHACH AND MMPI–2 REPLICATION 181
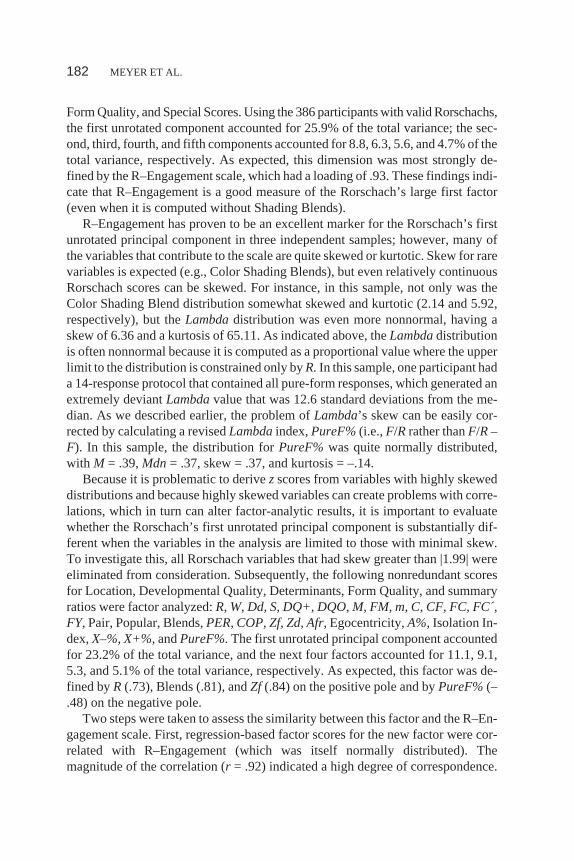
Form Quality, and Special Scores. Using the 386 participants with valid Rorschachs,the first unrotated component accounted for 25.9% of the total variance; the sec-ond, third, fourth, and fifth components accounted for 8.8, 6.3, 5.6, and 4.7% of thetotal variance, respectively. As expected, this dimension was most strongly de-fined by the R–Engagement scale, which had a loading of .93. These findings indi-cate that R–Engagement is a good measure of the Rorschach’s large first factor(even when it is computed without Shading Blends).
R–Engagement has proven to be an excellent marker for the Rorschach’s firstunrotated principal component in three independent samples; however, many ofthe variables that contribute to the scale are quite skewed or kurtotic. Skew for rarevariables is expected (e.g., Color Shading Blends), but even relatively continuousRorschach scores can be skewed. For instance, in this sample, not only was theColor Shading Blend distribution somewhat skewed and kurtotic (2.14 and 5.92,respectively), but theLambdadistribution was even more nonnormal, having askew of 6.36 and a kurtosis of 65.11. As indicated above, theLambdadistributionis often nonnormal because it is computed as a proportional value where the upperlimit to the distribution is constrained only byR.In this sample, one participant hada 14-response protocol that contained all pure-form responses, which generated anextremely deviantLambdavalue that was 12.6 standard deviations from the me-dian. As we described earlier, the problem ofLambda’s skew can be easily cor-rected by calculating a revisedLambdaindex,PureF%(i.e.,F/Rrather thanF/R–F). In this sample, the distribution forPureF%was quite normally distributed,with M = .39,Mdn= .37, skew = .37, and kurtosis = –.14.
Because it is problematic to derivezscores from variables with highly skeweddistributions and because highly skewed variables can create problems with corre-lations, which in turn can alter factor-analytic results, it is important to evaluatewhether the Rorschach’s first unrotated principal component is substantially dif-ferent when the variables in the analysis are limited to those with minimal skew.To investigate this, all Rorschach variables that had skew greater than |1.99| wereeliminated from consideration. Subsequently, the following nonredundant scoresfor Location, Developmental Quality, Determinants, Form Quality, and summaryratios were factor analyzed:R, W, Dd, S, DQ+, DQO, M, FM, m, C, CF, FC, FC´,FY,Pair, Popular, Blends,PER, COP, Zf, Zd, Afr,Egocentricity,A%,Isolation In-dex,X–%, X+%,andPureF%.The first unrotated principal component accountedfor 23.2% of the total variance, and the next four factors accounted for 11.1, 9.1,5.3, and 5.1% of the total variance, respectively. As expected, this factor was de-fined byR (.73), Blends (.81), andZf (.84) on the positive pole and byPureF%(–.48) on the negative pole.
Two steps were taken to assess the similarity between this factor and the R–En-gagement scale. First, regression-based factor scores for the new factor were cor-related with R–Engagement (which was itself normally distributed). Themagnitude of the correlation (r = .92) indicated a high degree of correspondence.
182 MEYER ET AL.

Next, the R–Engagement scale was entered into a factor analysis along with thenormally distributed variables listed above. R–Engagement was the best markerfor the underlying factor, having a loading of .94 on this dimension.
Thus, although the initial factor analysis that created the R–Engagement scale(Meyer, 1992) was conducted with skewed variables and although the R–Engage-ment scale continues to be calculated from skewed variables, the scale itself is nor-mally distributed and is the best marker for the Rorschach’s first unrotated principalcomponent—even when the factor input is limited to normally distributed Ror-schach variables. Given this, we proceeded with the analysis, employing the origi-nal R–Engagement scale.
Conceptually, one end of the first principal component from the Rorschach andthe MMPI–2 is characterized by defensive withdrawal, cognitive–emotional sim-plicity, or denial. The other pole is characterized by excessive engagement, height-ened sensitivity, or overreporting of problems (see Meyer, 1999a, Table 1). For thesake of simplicity, these poles are termedconstrictedanddilated,respectively.
Following previous conventions, constricted and dilated styles were initiallydefined by the upper and lower thirds of the R–Engagement scale and theA scale.For this sample, these criteria were operationally defined with cut-points of lessthan 18 and less than 25 for the MMPI–2A scale. As a result, 118 patients wereclassified as constricted and 120 were classified as dilated (because 4.3% of thesample had scores of 17 and 4.6% had scores of 26, slightly more than one third ofthe patients fell in each tail). The cut points for the Rorschach R–Engagementscale were less than –.930 and greater than .64, which resulted in 109 patients be-ing classified as constricted and 109 being classified as dilated.
Examining test interaction styles across methods, these criteria identified 80participants (24.5%) as having similar styles on both the MMPI–2 and Rorschach(i.e., dilated on both [n= 39] or constricted on both [n= 41]), and they identified 76participants (23.2%) as having discordant or opposing response styles acrossmethods (dilated Rorschach and constricted MMPI–2 [n = 33] or constricted Ror-schach and dilated MMPI–2 [n = 43]).
Criteria using profile scores. Following Meyer (1999a), patients were alsoclassified by scales commonly interpreted as indicators of test-taking style. Fromthe Rorschach,RandLambdawere used for this purpose, andF andK were usedfrom the MMPI–2. To classify patients as dilated or constricted, we employed thesame cutoff values that had been used in the prior research. These values wereR=21,Lambda= .55,F T score = 58, andK T score = 50. The median values for thissample were similar (R= 20,Lambda= .55,F = 61, andK = 45). As before, patientswere classified as constricted on the Rorschach ifRwas less than 21 andLambdawas greater than .55. Patients were classified as dilated ifRwas greater than 21 andLambdawas less than .55. Parallel determinations were made using the MMPI–2
RORSCHACH AND MMPI–2 REPLICATION 183

scales. Dilated patients hadF greater than 58 andK less than 50, and constricted pa-tients hadF less than 58 andK greater than 50.
Examining test interaction styles across methods according to the precedingcriteria, 45 patients (13.8%) adopted similar styles on the MMPI–2 and the Ror-schach (i.e., dilated on both [n = 28] or constricted on both [n = 17]), and 48 pa-tients (14.7%) adopted discordant styles across methods (dilated Rorschach andconstricted MMPI–2 [n = 10] or constricted Rorschach and dilated MMPI–2 [n =38]).
Criteria using factor scores. Although the criteria listed above are thesame as those used in prior research, for a variety of reasons, these criteria are im-perfect measures of test interaction styles. R–Engagement andAhave been used toestimate patients’ standing on the first unrotated principal component from eachtest; however, the actual first factors have not been used to identify test interactionstyles, although it would be reasonable to do so. To extend the previous research(Meyer, 1997b, 1999a), the factor-analytic results described above were used togenerate factor scores to quantify each patient’s location on the first unrotated prin-cipal component. These scores were then used to form a third set of criteria for se-lecting test interaction styles. As with R–Engagement andA, the MMPI–2 andRorschach factor score criteria selected patients falling in the upper and lowerthirds of each distribution. For this sample, these criteria were operationally de-fined with MMPI–2 factor score cut points of less than or equal to –.52 and greaterthan or equal to .53. These cutoffs resulted in 110 patients who were classified asconstricted and 110 who were classified as dilated. The cut points for the Rorschachfirst principal component (derived from the normally distributed variables) wereless than or equal to –.48 and greater than or equal to .287. These cutoffs resulted in109 patients who were classified as constricted and 109 who were classified asdilated.
When we examined test interaction styles across methods, the factor score cri-teria identified 73 patients (22.3%) as having similar styles on both the MMPI–2and Rorschach (i.e., dilated on both [n = 36] or constricted on both [n = 37]), andthey identified 71 patients (21.7%) as having discordant or opposing responsestyles across methods (dilated Rorschach and constricted MMPI–2 [n= 33] or con-stricted Rorschach and dilated MMPI–2 [n = 38]).
Criteria using the combination of factor scales, factor scores, and profilescores. To maximize the sample sizes included in our analyses, we also em-ployed a fourth, more liberal set of criteria to identify test interaction styles. Spe-cifically, we looked at all three criteria sets in combination. Any patient identifiedas having a similar style by factor scales (i.e., R–Engagement andA), by factor
184 MEYER ET AL.

scores (i.e., regression method estimates of the first principal component), or byprofile criteria was considered to have a similar style across methods. Simulta-neously, any patient identified as having an opposing style by factor scale criteria,by factor score criteria, or by profile criteria was considered to have an opposingstyle across methods.
One complication arose in implementing these combined criteria. Two caseshad been identified by the profile criteria as having opposing styles and by the fac-tor scale criteria as having similar styles. These two cases were considered ambigu-ous and were excluded from the subsequent analyses. Ultimately, the combinationcriteria identified 109 patients (33.3%) as having similar styles on the tests and 109(33.3%) as having opposing styles. Thus, the combination criteria employed twothirds of the initial sample, which is a substantially larger proportion than has beenused in prior research.
Correspondence Among the Criteria forDefining Response–Character Styles
Table 1 reports the extent of agreement, indexed by Cohen’s kappa, among the fourcriteria sets in terms of final classifications. For each set of criteria, the overall re-sults are formed from the conjunction of Rorschach and MMPI–2 data in which pa-tients were classified into one of three categories: (a) similar style on both methods,(b) opposing style across methods, or (c) undefined style on at least one method.The table indicates that there is a fair amount of “play” in the various classificationschemes; many patients identified by one set of criteria differ from those identifiedby another set of criteria. As might be expected, however, the two sets of criteriabased on the first principal component from each test (i.e., the factor scales and the
RORSCHACH AND MMPI–2 REPLICATION 185
TABLE 1Overall Classification Agreement (κ) Between the Four Procedures for
Classifying Test Interaction Styles on the Rorschach and MMPI–2
Criteria
CriteriaFactor Scales:
R–Engagement and A Factor Scores Profile Factor or Profile
Factor scores —Factor scores .56 —Profile .27 .31 —Factor or profile .72 .67 .42 —
Note. N= 327. MMPI–2 = Minnesota Multiphasic Personality Inventory–2. For each set of criteria,the overall results are formed from the conjunction of Rorschach and MMPI–2 data in which patientswere classified as having a similar style on both methods (1), an opposing style across methods (–1), oran undefined style on at least one method (0). All coefficients are statistically significant.

factor scores) showed the highest degree of correspondence (κ = .56). Previously,Meyer (1999a) reported a kappa value of .31 between the factor scale criteria andthe profile criteria, which closely matches the result in this study (κ = .27).
Target Constructs
Variables related to three psychological constructs, namely, affective distress, psy-chotic processes, and interpersonal suspiciousness or wariness, were used to assessconvergent validity between the MMPI–2 and the Rorschach. Rorschach measuresof emotional distress included the DEPI and the Suicide Constellation (S-CON).MMPI–2 variables included Scales2and7,Depression (DEP), Anxiety (ANX), andthe Negative Emotionality/Neuroticism scale from the Personality Psychopatholo-gy Five (PSY–5–Neg;Harkness, McNulty, & Ben-Porath, 1995). The Rorschachmeasure of psychotic processes was the Schizophrenia Index (SCZI), and MMPI–2measures included Scale8, Bizarre Mentation (BIZ), and the Psychoticism scalefrom thePSY–5(PSY–5–Psy;Harkness et al., 1995). The Rorschach measure of in-terpersonal wariness was the Hypervigilance Index (HVI), and the MMPI–2 scalesincluded Scale6, Cynicism (CYN), Social Discomfort (SOD), and the Inability toDisclosecomponentof theNegativeTreatment IndicatorsScale (TRT2;Ben-Porath& Sherwood, 1993). These variables were the same as those used in the priorresearch.
In addition to examining each of these variables individually, all of the scalestargeting a common construct were transformed tozscores and then aggregated toform composite measures (for research documenting the importance of aggrega-tion in personality research, see Cheek, 1982; Cole, Howard, & Maxwell, 1981;Cook & Campbell, 1979; Epstein, 1983; Overholser, 1992; Rushton, Brainerd, &Pressley, 1983; Tsujimoto, Hamilton, & Berger, 1990). Thus, the two Rorschachmeasures of negative affect were aggregated, as were the various MMPI–2 scalestargeting each of the three general constructs. Because the Rorschach measuredpsychosis and wariness with a single scale (i.e.,SCZIandHVI, respectively), onlythe individual scale was used in the composite analyses.
Total scores were used for Rorschach scales, and non-K-corrected raw scoreswere used for MMPI–2 scales. Rorschach distributions were approximately nor-mal. No scales had skew or kurtosis values greater than |0.66|. Two MMPI–2 vari-ables had values greater than |1.0| (SODkurtosis = –1.06;BIZskew = 1.21 andBIZkurtosis = 1.54), but departures from normality were minimal and all variableswere retained for the correlational analysis.
Corrections for Potential Methodological Artifacts
Conceptually unrelated variable pairs (CUVPs). As one way to evaluatethe extent of bias that may be introduced into our results from the process of select-
186 MEYER ET AL.

ing particular patients for analysis, we examined variables that bore little concep-tual relationship to each other. Following Meyer (1999a), two sets of unrelatedvariables were considered. In both sets, each of the Rorschach scores were expectedto be uncorrelated with each of the MMPI–2 scales. For the first set, all Rorschachvariables correlated positively with the Rorschach’s first factor and all MMPI–2variables correlated positively with the first factor of the MMPI–2. Thirteen Ror-schach scores were used: Whole Locations (W), Detail Locations (D), OrdinaryDevelopmental Quality (DQo), Ordinary Form Quality (FQo), Animal Movement(FM), Pairs, the Sum of All Human Content, Whole Human Content (H), WholeAnimal Content (A), Idiographic Content (Id), Passive Movement (p), Personal-ized Responses (PER), and Cooperative Movement (COP). These variables had anaverage correlation of .36 with the R–Engagement scale and .43 with the factorscores. These results were fairly close to the average correlations found with thefour Rorschach variables used in the meaningful convergent validity analyses (i.e.,DEPI, S–CON, SCZI,andHVI), which had meanrs of .45 with the R–Engagementscale and .44 with the factor scores. These findings closely replicated prior results.Comparable correlations from Meyer (1999a) were .38 and .46 for the CUVPs withR–Engagement and with factor scores, respectively, and .49 and .48 for the mean-ingful variables with R–Engagement and with factor scores,2 respectively.
Eleven MMPI–2 variables were also used: Scale1, Scale3, Somatic Com-plaints (Hy4), Ego Inflation (Ma4), Generalized Fearfulness (FRS1), Health Con-cerns (HEA), Gastrointestinal Symptoms (HEA1), Explosive Behavior (ANG1),Addiction Admission (AAS), Antisocial Behavior (ASP2), and Aggression (PSY–5–Agg). These variables had an average correlation of .35 withA and .45 with thefirst-factor scores of the MMPI–2. The average correlations for the 12 variablesused in the meaningful convergent analyses (i.e., Scale2, Scale7, Scale8, etc.)were .69 and .74, respectively. These results replicated prior findings. The Chi-cago sample obtained correlations of .43 and .51 for the CUVPs withA and withfactor scores, respectively, and .74 and .78 for the meaningful variables withAandwith factor scores, respectively.3
RORSCHACH AND MMPI–2 REPLICATION 187
2Meyer (1999a) did not calculate Rorschach first-factor scores from all normally distributed vari-ables. To parallel this research, this factor was created in his data set using the same normally distrib-uted scores listed earlier. Results using this new scale are referred to throughout this article.
3These results differ slightly from those reported by Meyer (1999a). In the process of double check-ing Meyer’s analyses, an error was discovered with anA scale score. Although all MMPI–2s for theChicago patients had been computer scored through NCS, only the summary profiles were available forfour patients. As such, the data for these patients could not be read by a computer program and had to beentered by hand. During manual entry of scores, one patient’sT score on ScaleA had been erroneouslyinserted as his raw score. This error was corrected for analyses reported in this article with the Chicagodata. Note that this data entry error did not affect the classification of any patient, and thus it did not af-fect any of Meyer’s primary analyses.
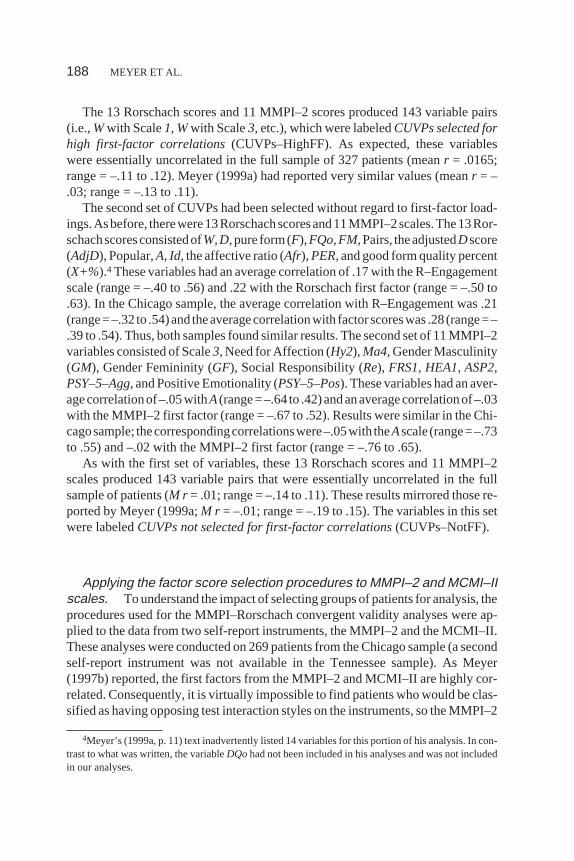
The 13 Rorschach scores and 11 MMPI–2 scores produced 143 variable pairs(i.e.,Wwith Scale1, Wwith Scale3,etc.), which were labeledCUVPs selected forhigh first-factor correlations(CUVPs–HighFF). As expected, these variableswere essentially uncorrelated in the full sample of 327 patients (meanr = .0165;range = –.11 to .12). Meyer (1999a) had reported very similar values (meanr = –.03; range = –.13 to .11).
The second set of CUVPs had been selected without regard to first-factor load-ings.Asbefore, therewere13Rorschachscoresand11MMPI–2scales.The13Ror-schachscoresconsistedofW,D,pure form(F),FQo,FM,Pairs, theadjustedDscore(AdjD), Popular,A, Id,the affective ratio (Afr),PER,and good form quality percent(X+%).4 These variables had an average correlation of .17 with the R–Engagementscale (range = –.40 to .56) and .22 with the Rorschach first factor (range = –.50 to.63). In the Chicago sample, the average correlation with R–Engagement was .21(range=–.32 to .54)and theaveragecorrelationwith factorscoreswas .28(range=–.39 to .54). Thus, both samples found similar results. The second set of 11 MMPI–2variables consisted of Scale3,Need for Affection (Hy2),Ma4,Gender Masculinity(GM), Gender Femininity (GF), Social Responsibility (Re), FRS1, HEA1, ASP2,PSY–5–Agg,and Positive Emotionality (PSY–5–Pos). These variables had an aver-agecorrelationof–.05withA(range=–.64 to .42)andanaveragecorrelationof–.03with the MMPI–2 first factor (range = –.67 to .52). Results were similar in the Chi-cagosample; thecorrespondingcorrelationswere–.05with theAscale (range=–.73to .55) and –.02 with the MMPI–2 first factor (range = –.76 to .65).
As with the first set of variables, these 13 Rorschach scores and 11 MMPI–2scales produced 143 variable pairs that were essentially uncorrelated in the fullsample of patients (M r = .01; range = –.14 to .11). These results mirrored those re-ported by Meyer (1999a;M r = –.01; range = –.19 to .15). The variables in this setwere labeledCUVPs not selected for first-factor correlations(CUVPs–NotFF).
Applying the factor score selection procedures to MMPI–2 and MCMI–IIscales. To understand the impact of selecting groups of patients for analysis, theprocedures used for the MMPI–Rorschach convergent validity analyses were ap-plied to the data from two self-report instruments, the MMPI–2 and the MCMI–II.These analyses were conducted on 269 patients from the Chicago sample (a secondself-report instrument was not available in the Tennessee sample). As Meyer(1997b) reported, the first factors from the MMPI–2 and MCMI–II are highly cor-related. Consequently, it is virtually impossible to find patients who would be clas-sified as having opposing test interaction styles on the instruments, so the MMPI–2
188 MEYER ET AL.
4Meyer’s (1999a, p. 11) text inadvertently listed 14 variables for this portion of his analysis. In con-trast to what was written, the variableDQohad not been included in his analyses and was not includedin our analyses.

and MCMI–II analyses were limited to selecting patients with similar styles on thetests. In addition, because profile criteria have not been developed for the MCMI–IIand because we wished to simplify the presentation of this data, we only examinedpatients selected on the basis of factor scores from the first unrotated principal com-ponent of each test.
For the MCMI–II, a factor analysis was conducted of the clinical and validityscales (using raw scores). The first unrotated principal component accounted for54.4% of the total variance; the second, third, fourth, and fifth components ac-counted for 19.4, 8.1, 6.9, and 3.1% of the total variance, respectively. Thus, aswith the MMPI–2, the first factor of the MCMI–II is about twice as large as that ofthe Rorschach. Regression-based factor scores were used to indicate each patient’splacement on the MCMI–II first factor. The MCMI–II and MMPI–2 factor scoreshad a correlation of .83 (N = 269,p < .001). The MCMI–II validity scale Disclo-sure was by far the best marker for the first factor of the MCMI–II, with a loadingof .97 on this dimension. The correlation between Disclosure and the MMPI–2Ascale was .73 (N = 269,p < .001).
Using factor scores from the MMPI–2 and MCMI–II, 139 patients (51.7%)were classified as having a similar test interaction style across tests. More specifi-cally, 72 patients fell in the upper third of the first-factor distributions on both tests,and 67 patients fell in the lower third of the first-factor distributions on both tests.
The same three constructs targeted in the Rorschach–MMPI analyses were usedagain for the MCMI–MMPI analyses. For the MMPI–2, negative affect, psychoticprocesses, and interpersonal wariness were measured by the variables describedabove. For the MCMI–II, negative affect was measured by the Dysthymia, MajorDepression, and Anxiety scales; psychotic processes were measured by theThought Disorder, Schizotypal, and Borderline scales, and interpersonal warinesswas measured by the Schizoid, Avoidant, and Paranoid personality disorderscales. As in the prior analyses, these individual scales were aggregated to formcomposite measures of each construct (by summingz scores for each scale).
Estimating a lower boundary for construct convergence. As another strat-egy for assessing potential methodological artifacts, a formula for estimating alower boundary of construct convergence was used. Even though the first factorfrom the MMPI–2 and the first factor from the Rorschach are expected to beuncorrelated, selecting the upper and lower thirds on these dimensions forces theprimary factors to be correlated in the selected sample. It also forces any scales thatare correlated with these dimensions to be correlated in the selected sample. In aneffort to estimate the degree of correlation that resulted from selecting patients onthe upper and lower thirds of each first factor, a formula from the factor-analytic lit-erature was recommended by James M. Wood for this purpose (see Meyer, 1997b,pp. 320–321). The formula provides the expected correlation for two variables,
RORSCHACH AND MMPI–2 REPLICATION 189

each of which loads separately on two correlated factors. The formula relies onthree correlations: (a) the correlation between an MMPI–2 scale and the MMPI–2first factor (e.g., Scale2 with MMPI–2 first-factor scores), (b) the correlation be-tween a Rorschach scale and the Rorschach first factor (e.g.,DEPIwith Rorschachfirst-factor scores), and (c) the correlation between the MMPI–2 and Rorschachfirst factors in the selected sample (e.g., in those patients with similar styles as de-fined by factor scores). Once these correlations are obtained, the three values aremultiplied. The product indicates the expected correlation for the MMPI–2 andRorschach scales in the selected sample (e.g., the expected correlation of Scale2with DEPI in the group of patients with similar styles as defined by factor scores).
Once the predicted degree of correlation between each MMPI–2 variable andeach Rorschach variable has been calculated, the predicted value can be subtractedfrom the observed correlation to obtain a residual. This residual correlation reflectsthe extent of construct overlap that remains after first-factor variance is removed.
There would not be a complication with this correction procedure if one couldconfidently attribute all first-factor variance to nonmeaningful forms of bias ratherthan to actual trait variance. In other words, if patients only obtained low scores onthe Rorschach and MMPI–2 first factors because they were deliberately defensive(i.e., Style 1 in Meyer’s, 1999a [Table 1], schematic representation) and only ob-tained high scores on the first factors because they were deliberately exaggeratingdisturbance (i.e., Style 4), then this correction formula would work accurately;however, patients are not high and low on the first factors simply because of delib-erate efforts to manipulate the test data. For instance, many patients can obtainhigh scores on the first factor of each test because they have genuine and severeforms of psychopathology, particularly in the areas of affective distress and psy-chotic processes. Thus, to some extent, the formula overcorrects the observed cor-relations in the selected samples because it assumes that all the first-factorvariance among the selected patients has to do with meaningless sources of influ-ence rather than with genuine elements of affective distress, psychotic processes,and interpersonal wariness. Because this assumption is not true, the residual corre-lations provide an underestimate of Rorschach and MMPI–2 construct overlap.Nonetheless, if the residual correlations are interpreted as an estimated lowerboundary or floor value, they provide a better coefficient for bracketing the trueextent of construct overlap than do the coefficients obtained when response stylesare ignored.
In the analyses presented here, formula-based corrections were applied to theRorschach and MMPI–2 results derived from the Tennessee and Chicago samples.In addition, the corrections were applied to the MCMI–II and MMPI–2 convergentvalidity results. For the sake of uniformity across data sets, corrections were onlyapplied to findings derived from factor score criteria (i.e., individual scales werecorrelated with factor scores, and corrections were applied to samples selected byfactor scores).
190 MEYER ET AL.

Repeatedly drawing randomly selected samples from the full population.As a final way to check for sources of bias, convergent validity was assessed with-out selecting any patients on the basis of their test interaction styles. Instead, be-cause small samples produce fluctuating or imprecise results (Meyer, 1999a),sample-to-sample fluctuations were used to evaluate the general relationship be-tween test interaction styles and the convergence of Rorschach and MMPI–2 con-structs. Specifically, by repeatedly drawing smaller samples from the population of327 patients, the association between Rorschach and MMPI–2 first factors shouldfluctuate from one sample to the next. In turn, the correlations between Rorschachand MMPI–2 constructs should fluctuate across samples in tandem with the firstfactors.
To test this hypothesis, 300 patient samples were created by taking 300 randomdraws from the full population of 327 patients. On each draw, two variables werecreated. Variable A consisted of the correlation between the Rorschach andMMPI–2 first factors, and Variable B was created by correlating each of the 17conceptually meaningful Rorschach and MMPI–2 construct pairs (i.e., Scale2with DEPI, Scale2 with S–CON,Scale7 with DEPI, etc.) and then averaging the17 correlations to obtain a summary index of convergent validity among constructs.The correlation between Variable A and Variable B was then calculated across the300 subsamples, treating each subsample as a single observation.
Following prior research, these analyses were conducted twice. On the first oc-casion, samples of 30 patients were randomly selected on each of the 300 draws.These samples were small enough to ensure substantial variability in the extent towhich the first factors were (i.e., appeared to be) correlated in the 300 samples. Onthe second occasion, samples of 75 patients were randomly selected on each of the300 draws. Although of moderate size, samples this large should show less randomvariation in first-factor correlations.
Finally, it should be noted that this study only examined the selection criteriaand variables described previously. Findings were not culled from a larger array ofresults that may have led to different conclusions.
RESULTS
Convergence of Scales to Assess Test Interaction Styles
Table 2 reports the associations between Rorschach and MMPI–2 indicators of testinteraction styles. Although there are a few statistically significant correlations,they are generally of small magnitude. The results in Table 2 closely mirror thosereported by Meyer (1997b). In the Chicago sample, the same Rorschach scales hadcorrelations from .02 to .09 with the MMPI–2 first factor, .05 to .10 withA,–.09 to.06 withF, .01 to .08 withFb, –.10 to .09 withL, and –.11 to .04 withK.
RORSCHACH AND MMPI–2 REPLICATION 191
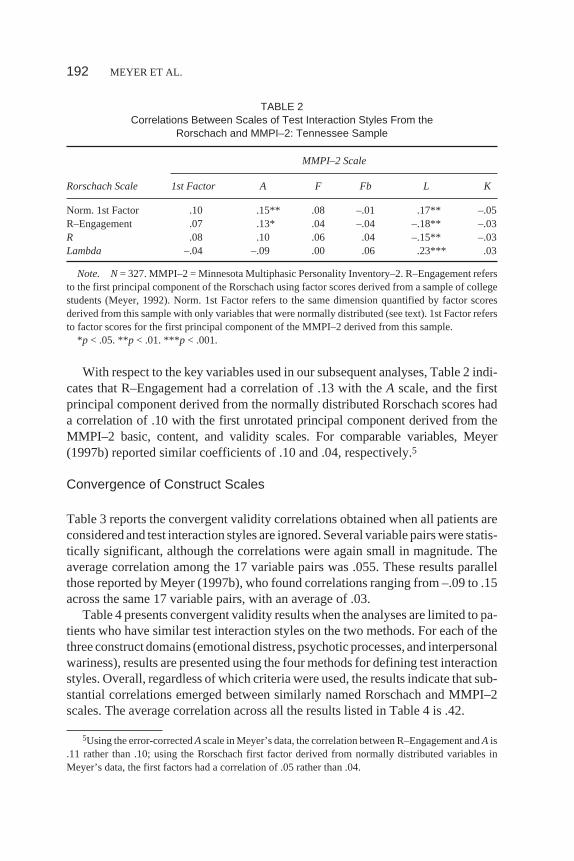
With respect to the key variables used in our subsequent analyses, Table 2 indi-cates that R–Engagement had a correlation of .13 with theA scale, and the firstprincipal component derived from the normally distributed Rorschach scores hada correlation of .10 with the first unrotated principal component derived from theMMPI–2 basic, content, and validity scales. For comparable variables, Meyer(1997b) reported similar coefficients of .10 and .04, respectively.5
Convergence of Construct Scales
Table 3 reports the convergent validity correlations obtained when all patients areconsidered and test interaction styles are ignored. Several variable pairs were statis-tically significant, although the correlations were again small in magnitude. Theaverage correlation among the 17 variable pairs was .055. These results parallelthose reported by Meyer (1997b), who found correlations ranging from –.09 to .15across the same 17 variable pairs, with an average of .03.
Table 4 presents convergent validity results when the analyses are limited to pa-tients who have similar test interaction styles on the two methods. For each of thethree construct domains (emotional distress, psychotic processes, and interpersonalwariness), results are presented using the four methods for defining test interactionstyles. Overall, regardless of which criteria were used, the results indicate that sub-stantial correlations emerged between similarly named Rorschach and MMPI–2scales. The average correlation across all the results listed in Table 4 is .42.
192 MEYER ET AL.
5Using the error-correctedAscale in Meyer’s data, the correlation between R–Engagement andA is.11 rather than .10; using the Rorschach first factor derived from normally distributed variables inMeyer’s data, the first factors had a correlation of .05 rather than .04.
TABLE 2Correlations Between Scales of Test Interaction Styles From the
Rorschach and MMPI–2: Tennessee Sample
MMPI–2 Scale
Rorschach Scale 1st Factor A F Fb L K
Norm. 1st Factor .10 .15** .08 –.01 .17** –.05R–Engagement .07 .13* .04 –.04 –.18** –.03R .08 .10 .06 .04 –.15** –.03Lambda –.04 –.09 .00 .06 .23*** .03
Note. N= 327. MMPI–2 = Minnesota Multiphasic Personality Inventory–2. R–Engagement refersto the first principal component of the Rorschach using factor scores derived from a sample of collegestudents (Meyer, 1992). Norm. 1st Factor refers to the same dimension quantified by factor scoresderived from this sample with only variables that were normally distributed (see text). 1st Factor refersto factor scores for the first principal component of the MMPI–2 derived from this sample.
*p < .05. **p < .01. ***p < .001.

TABLE 3Correlations Between Rorschach and MMPI–2 Scales in Three Content
Areas When Response Styles Are Ignored: Tennessee Sample
Affective Distress Psychotic Processes Interpersonal Wariness
MMPI–2Scale
RorschachDEPI
RorschachS–CON
MMPI–2Scale
RorschachSCZI
MMPI–2Scale
RorschachHVI
Scale2 .07 –.01 Scale8 .10 Scale6 –.04Scale7 .13* .08 BIZ .06 CYN –.02DEP .13* .05 PSY–5–Psy .01 SOD –.03ANX .17** .06 TRT2 –.02PSY–5–Neg .15** .05
Note. N= 327. MMPI–2 = Minnesota Multiphasic Personality Inventory–2;DEPI = DepressionIndex; S–CON= Suicide Constellation;SCZI= Schizophrenia Index;HVI = Hypervigilance Index;DEP= Depression;ANX= Anxiety,PSY–5–Neg= Negative Emotionality/Neuroticism;BIZ = BizarreMentation;PSY–5–Psy= Psychoticism;CYN= Cynicism;SOD= Social Discomfort;TRT2= Inabilityto Disclose.
*p < .05. **p < .01.
TABLE 4MMPI–2 and Rorschach Convergent Validity for Three Constructs Using the Four Criteria Sets to
Define Patients With Similar Response–Character Styles: Tennessee Sample
Response–Character Styles Defined By:
ConstructFactor Scales
(R–Engagement and A)a Factor Scoresb ProfilecFactor orProfiled
Affective Distress DEPI S–CON DEPI S–CON DEPI S–CON DEPI S–CON
Scale2 .40*** .23* .25* .11 .52*** .34* .29** .17Scale7 .52*** .45*** .36** .33** .61*** .51*** .43*** .35***Depression .58*** .48*** .38** .29* .59*** .41** .43*** .33**Anxiety .51*** .44*** .41*** .29* .65*** .39** .46*** .33***PSY–5–Neg .48*** .36** .34** .26* .56*** .27 .40*** .26**
Psychotic Processes SCZI SCZI SCZI SCZI
Scale8 .65*** .66*** .60*** .55***Bizarre Mentation .49*** .53*** .48** .43***PSY–5–Psy .47*** .53*** .45** .40***
Interpersonal Wariness HVI HVI HVI HVI
Scale6 .44*** .46*** .34* .40***Cynicism .37** .53*** .36* .36***Social Discomfort .48*** .49*** .31* .44***Inability to Disclose .45*** .38** .01 .33**
Note. See Table 3 for an explanation of abbreviations.an = 80.bn = 73.cn = 45.dn = 109.*p < .05. **p < .01. ***p < .001.
193

Table 5 presents construct correlations for those analyses that were limited topatients who had an opposing style of interacting on the tests. The expectation thatscales would be negatively correlated under these circumstances was generallysupported. The average correlation across the results presented in Table 5 is –.26;however, the scales for negative affect were, on average, less highly correlated (M= –.17) than were the scales for psychosis (M = –.36) or for wariness (M = –.41).These results are in contrast to those found by Meyer (1997b, 1999a), who re-ported that the strongest negative correlations emerged for the construct of nega-tive affect.
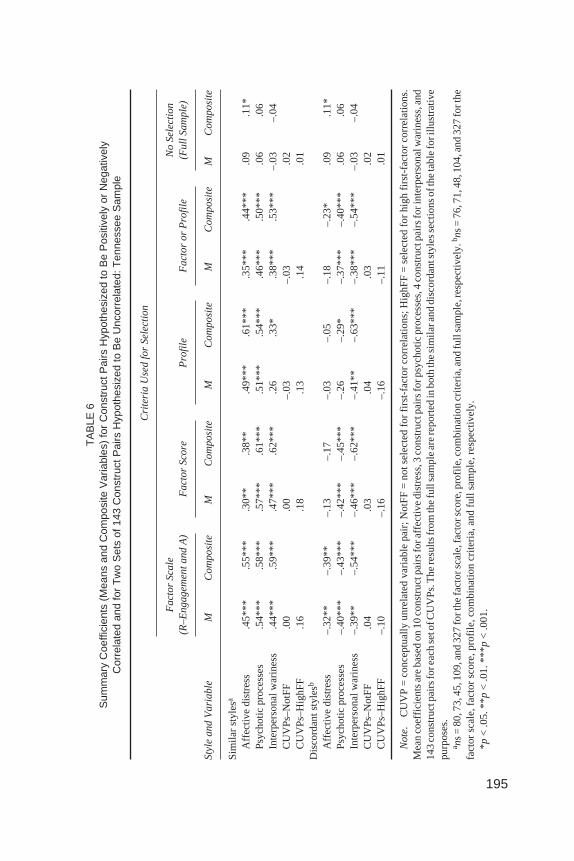
Table 6 presents summary information derived from Tables 3, 4, and 5. The av-erage correlation for each construct under each of the selection conditions is pre-sented, along with the average results in the full sample. Table 6 also lists theresults for the composite variables. As expected, the composite variables demon-strate how aggregation reduces error. The composite scales produced validity co-
194 MEYER ET AL.
TABLE 5MMPI–2 and Rorschach Convergent Validity for Three Constructs Using the Four Criteria Sets to
Define Patients With Opposing Response–Character Styles: Tennessee Sample
Response–Character Styles Defined By:
ConstructFactor Scales (R–
Engagement and A)a Factor Scoresb Profilec Factor or Profiled
Affective Distress DEPI S–CON DEPI S–CON DEPI S–CON DEPI S–CON
Scale2 –.24* –.33** –.07 –.28* –.05 –.24 –.13 –.24*Scale7 –.29* –.42*** –.03 –.23 –.00 –.06 –.15 –.27**Depression –.23* –.44*** –.01 –.37** .04 –.23 –.11 –.36***Anxiety –.28* –.41*** –.00 –.24* .04 –.08 –.10 –.26**PSY–5–Neg –.20 –.33** .08 –.19 .17 .12 –.03 –.18
Psychotic Processes SCZI SCZI SCZI SCZI
Scale8 –.42*** –.48*** –.33* –.40***Bizarre Mentation –.35** –.35** –.13 –.32**PSY–5–Psy –.43*** –.43*** –.31* –.39***
Interpersonal Wariness HVI HVI HVI HVI
Scale6 –.41*** –.56*** –.33* –.42***Cynicism –.38** –.45*** –.48** –.41***Social Discomfort –.41*** –.44*** –.39** –.38***Inability to Disclose –.34** –.37** –.44** –.32**
Note. See Table 3 for an explanation of abbreviations.an = 76.bn = 71.cn = 48.dn = 104.*p < .05. **p < .01. ***p < .001.
195
TA
BLE
6S
umm
ary
Coe
ffici
ents
(M
eans
and
Com
posi
te V
aria
bles
) fo
r C
onst
ruct
Pai
rs H
ypot
hesi
zed
to B
e P
ositi
vely
or
Neg
ativ
ely
Cor
rela
ted
and
for
Tw
o S
ets
of 1
43 C
onst
ruct
Pai
rs H
ypot
hesi
zed
to B
e U
ncor
rela
ted:
Ten
ness
ee S
ampl
e
Crite
ria
Use
d f
or
Se
lect
ion
Fa
cto
r S
cale
(R–
En
ga
ge
me
nt
an
d A
)F
act
or
Sco
reP
rofil
eF
act
or
or
Pro
file
No
Se
lect
ion
(Fu
ll S
am
ple
)
Sty
le a
nd
Va
ria
ble
MC
om
po
site
MC
om
po
site
MC
om
po
site
MC
om
po
site
MC
om
po
site
Sim
ilar
styl
esa
Affe
ctiv
e di
stre
ss.4
5***
.55*
**.3
0**
.38*
*.4
9***
.61*
**.3
5***
.44*
**.0
9.1
1*P
sych
otic
pro
cess
es.5
4***
.58*
**.5
7***
.61*
**.5
1***
.54*
**.4
6***
.50*
**.0
6.0
6In
terp
erso
nal w
arin
ess
.44*
**.5
9***
.47*
**.6
2***
.26
.33*
.38*
**.5
3***
–.03
–.04
CU
VP
s–N
otF
F.0
0.0
0–.
03–.
03.0
2C
UV
Ps–
Hig
hFF
.16
.18
.13
.14
.01
Dis
cord
ant s
tyle
sb
Affe
ctiv
e di
stre
ss–.
32**
–.39
**–.
13–.
17–.
03–.
05–.
18–.
23*
.09
.11*
Psy
chot
ic p
roce
sses
–.40
***
–.43
***
–.42
***
–.45
***
–.26
–.29
*–.
37**
*–.
40**
*.0
6.0
6In
terp
erso
nal w
arin
ess
–.39
**–.
54**
*–.
46**
*–.
62**
*–.
41**
–.63
***
–.38
***
–.54
***
–.03
–.04
CU
VP
s–N
otF
F.0
4.0
3.0
4.0
3.0
2C
UV
Ps–
Hig
hFF
–.10
–.16
–.16
–.11
.01
No
te.
CU
VP
=co
ncep
tual
lyun
rela
ted
varia
ble
pair;
Not
FF
=no
tsel
ecte
dfo
rfir
st-f
acto
rco
rrel
atio
ns;H
ighF
F=
sele
cted
for
high
first
-fac
tor
corr
elat
ion
s.M
ean
coef
ficie
nts
are
base
don
10co
nstr
uctp
airs
fora
ffect
ive
dist
ress
,3co
nstr
uctp
airs
forp
sych
otic
proc
esse
s,4
cons
truc
tpai
rsfo
rint
erpe
rson
alw
arin
ess,
and
143
cons
truc
tpai
rsfo
reac
hse
tofC
UV
Ps.
The
resu
ltsfr
omth
efu
llsa
mpl
ear
ere
port
edin
both
the
sim
ilara
nddi
scor
dant
styl
esse
ctio
nsof
the
tabl
ef
orill
ustr
ativ
epu
rpos
es.
a ns
=80
,73,
45,1
09,a
nd32
7fo
rthe
fact
orsc
ale,
fact
orsc
ore,
prof
ile,c
ombi
natio
ncr
iteria
,and
full
sam
ple,
resp
ectiv
ely.
b ns
=76
,71,
48,1
04,a
nd32
7fo
rthe
fact
or s
cale
, fac
tor
scor
e, p
rofil
e, c
ombi
natio
n cr
iteria
, and
full
sam
ple,
res
pect
ivel
y.*p
< .0
5. *
*p<
.01.
***
p<
.001
.

efficients that were higher than the average of the individual coefficients whenassociations were clearly evident in the data (e.g., for negative affect using factorscales to define similar styles,rs = .55 vs. .45), although the composite scales alsoindicated a lack of association when this conclusion was appropriate (e.g., in thefull sample). Paralleling the results reported by Meyer (1999a), Table 6 suggeststhat the profile criteria are somewhat less effective than the factor criteria for pro-ducing the theoretically expected convergent associations.
Table 6 also presents results for the two sets of 143 variable pairs expected toremain uncorrelated after selecting patients on the basis of response–characterstyles. As anticipated, for each of the eight selection conditions, the average coeffi-cients for both sets of 143 CUVPs were not large enough to be statistically signifi-cant. Also as expected, the CUVPs that were selected because they had highloadings on each method’s first factor tended to track the first-factor correlations.When patients with similar styles were examined, the average of the CUVPs–HighFF variables had a positive sign (.13–.18). When patients with opposingstyles were examined, the average of the CUVPs–HighFF variables had a negativesign (–.10 to –.16). Finally, as anticipated, the average correlations among theCUVPs that were selected without regard to first-factor loadings (CUVPs–NotFF)tended to hover near zero (–.03 to .04), and they often had a sign that was oppositeto that which was expected for the meaningful variable pairs.
For patients with similar test interaction styles, all four sets of selection criteriaproduced convergent correlations for the meaningful variable pairs that were sub-stantially larger than those produced by either set of CUVPs. All the meaningfulconstructs had meanrs greater than .30 and composite scalers greater than .38,whereas all the CUVPs had meanrs less than .19. Thus, when various criteria areused to identify similar test interaction styles across methods, Rorschach andMMPI–2 constructs will tend to converge. This construct convergence does notappear to be caused by the simple alignment of methodological artifacts, becauseneither set of 143 CUVPs produced similarly large correlations.
For patients with opposing test interaction styles, all four criteria sets producednegative convergent validity coefficients for psychosis and wariness that weresubstantially larger than either set of CUVPs (i.e., the minimum compositer forthe meaningful variables was –.29, and the maximum average for the meaninglessvariables was –.16). However, the results for negative affect were different. As ex-pected, these scales were negatively correlated when using the factor scales of R–Engagement andA to define response–character styles (M = –.32, composite = –.39), but when using the other selection criteria, the correlations were no longerstatistically significant and no longer capable of being differentiated from theCUVPs–HighFF variables.
ThestructureofTable7duplicates thatofTable6;however, the results inTable7are for theChicagosample.Previously,Meyer (1999a)hadcalculatedandpresentedresults for two of the four sets of selection criteria listed in Table 7 (i.e., factor scales
196 MEYER ET AL.

197
TA
BLE
7S
umm
ary
Coe
ffici
ents
(M
eans
and
Com
posi
te V
aria
bles
) fo
r C
onst
ruct
Pai
rs H
ypot
hesi
zed
to B
e P
ositi
vely
or
Neg
ativ
ely
Cor
rela
ted
and
for
Tw
o S
ets
of 1
43 C
onst
ruct
Pai
rs H
ypot
hesi
zed
to B
e U
ncor
rela
ted:
Chi
cago
Sam
ple
Crite
ria
Use
d f
or
Se
lect
ion
Fa
cto
r S
calea
(R–
En
ga
ge
me
nt
an
d A
)F
act
or
Sco
reP
rofil
ea
Fa
cto
r o
r P
rofil
eN
o S
ele
ctio
n(F
ull
Sa
mp
le)
Sty
le a
nd
Va
ria
ble
MC
om
po
site
MC
om
po
site
MC
om
po
site
MC
om
po
site
MC
om
po
site
Sim
ilar
styl
esb
Affe
ctiv
e di
stre
ss.5
9***
.71*
**.4
8***
.57*
**.4
4***
.51*
**.4
4***
.53*
**–.
01–.
01P
sych
otic
pro
cess
es.4
9***
.53*
**.5
0***
.53*
**.4
5***
.49*
**.4
6***
.49*
**.1
1*.1
1In
terp
erso
nal w
arin
ess
.37*
**.5
0***
.45*
**.5
9***
.38*
*.5
0***
.36*
**.5
0***
.05
.07
CU
VP
s–N
otF
F–.
03–.
02.0
2–.
03–.
03C
UV
Ps–
Hig
hFF
.03
.10
.18
.07
–.01
Dis
cord
ant s
tyle
sc
Affe
ctiv
e di
stre
ss–.
54**
*–.
63**
*–.
38**
–.45
***
–.26
–.32
*–.
41**
*–.
49**
*–.
01–.
01P
sych
otic
pro
cess
es–.
19–.
20–.
42**
*–.
44**
*–.
16–.
18–.
15–.
16.1
1*.1
1In
terp
erso
nal w
arin
ess
–.28
*–.
34**
–.38
**–.
47**
*–.
24–.
32*
–.29
**–.
37**
*.0
5.0
7C
UV
Ps–
Not
FF
.01
.01
.02
.01
–.03
CU
VP
s–H
ighF
F–.
18–.
26–.
25–.
17–.
01
No
te.
CU
VP
=co
ncep
tual
lyun
rela
ted
varia
ble
pair;
Not
FF
=no
tsel
ecte
dfo
rfir
st-f
acto
rco
rrel
atio
ns;H
ighF
F=
sele
cted
for
high
first
-fac
tor
corr
elat
ion
s.M
ean
coef
ficie
nts
are
base
don
10co
nstr
uctp
airs
fora
ffect
ive
dist
ress
,3co
nstr
uctp
airs
forp
sych
otic
proc
esse
s,4
cons
truc
tpai
rsfo
rint
erpe
rson
alw
arin
ess,
and
143
cons
truc
tpai
rsfo
reac
hse
tofC
UV
Ps.
The
resu
ltsfr
omth
efu
llsa
mpl
ear
ere
port
edin
both
the
sim
ilara
nddi
scor
dant
styl
esse
ctio
nsof
the
tabl
ef
orill
ustr
ativ
epu
rpos
es.
a The
resu
ltsin
thes
etw
ose
tsof
colu
mns
wer
epr
evio
usly
repo
rted
byM
eyer
(199
9a)a
ndar
epr
esen
ted
here
forc
ompl
eten
ess.
b ns
=87
,85,
54,1
11,a
nd36
2fo
rth
efa
ctor
scal
e,fa
ctor
scor
e,pr
ofile
,com
bina
tion
crite
ria,a
ndfu
llsa
mpl
e,re
spec
tivel
y.c n
s=
78,7
6,51
,113
,and
362
fort
hefa
ctor
scal
e,fa
ctor
scor
e,pr
ofile
,co
mbi
natio
n cr
iteria
, and
full
sam
ple,
res
pect
ivel
y.*p
< .0
5. *
*p<
.01.
***
p<
.001
.

andprofilecriteria);however,hehadnotcalculatedresultsusing the factorscorecri-teriaor thecombinedcriteria.Theseanalysesweregenerated6for thisarticle topres-ent exactly matching analyses across the two independent data sets.7
In general, it can be seen that the results are quite similar in both samples. Themost notable disparities emerge with the discordant test interaction styles. TheChicago patients tended to produce larger negative convergent correlations for thenegative affect construct than did the Tennessee patients. In contrast, the Chicagopatients tended to produce lower correlations for the constructs of psychosis andwariness than did the Tennessee patients (except when the factor score criteriawere applied to the Chicago sample).
Multitrait–Multimethod Matrices
Following Meyer (1997b), Table 8 presents a multitrait–multimethod matrix forthe three Rorschach and MMPI–2 constructs. Composite scales were used in theseanalyses. Rather than presenting a separate table for each of the four selection crite-ria, to facilitate generalization only the results from the combined factor and profilecriteria are presented (these criteria selected the largest number of patients withsimilar and opposing styles). In Table 8, results for the Tennessee sample are givenabove the diagonals and results for the Chicago sample are given below the diago-nals. These specific findings for the Chicago sample had not been generated or re-ported previously. The first section of Table 8 reports results for all patients,whereas the second and third sections report results for patients selected to havesimilar and opposing styles, respectively.
Given that Tables 6 and 7 already presented the relevant data on cross-methodconvergent validity, the primary purpose of Table 8 is to consider cross-methodconvergent validity relative to cross-method discriminant validity. Before turningattention to this issue, however, it is important to consider the evidence on within-method discriminant validity. As expected, in each set of analyses (i.e., all pa-tients, similar styles, and opposing styles) and in both samples, the MMPI–2 scalesfor the three different constructs are very highly correlated. These heterotrait–monomethod correlations had an average value of .79 across analyses and sam-ples. In contrast, but also as expected, the same heterotrait–monomethod correla-tions among the three Rorschach constructs were much lower, averaging just .32
198 MEYER ET AL.
6For four of the Chicago patients, MMPI–2 first-factor scores were estimated using a regressionequation based on the 13 basic and validity scales. This equation had a near-perfect ability to predictfirst-factor scores (R= .9948).
7When rechecking Meyer’s (1999a) analyses, a typographical error was found in the statistical syn-tax for computing the MMPI–2 negative affect composite variable. When this error was corrected,three of the four composite correlations increased by .01 in the theoretically expected direction. Thecorrected results are reported in Table 7.

TABLE 8Summary Multitrait–Multimethod Matrix of Associations Between Rorschach and MMPI–2
Composite Scales Using the Combined Factor or Profile Criteria to Select Patients:Chicago Sample (Below the Diagonals) and Tennessee Sample (Above the Diagonals)
Rorschach Scale MMPI–2 Scale
Distress Psychosis Wariness Distress Psychosis Wariness
All patientsa
Rorschach1. Distress — .24b,*** .21 b,*** .11 c,* .11d,* .10d
2. Psychosis .27b,*** — .34 b,*** .08 d .06c .07d
3. Wariness .38b,*** .43 b,*** — .10 d .04d –.04c
MMPI–24. Distress –.01c .12d,* .11d,* — .72b,*** .78 b,***5. Psychosis –.03d .11c,* .02d .74b,*** — .77 b,***6. Wariness .01d .12d,* .07c .82b,*** .80 b,*** —
Similar stylese
Rorschach1. Distress — .37b,*** .33 b,*** .44 c,*** .39 d,*** .42 d,***2. Psychosis .43b,*** — .41 b,*** .54 d,*** .50 c,*** .50 d,***3. Wariness .47b,*** .45 b,*** — .65 d,*** .48 d,*** .53 c,***
MMPI–24. Distress .53c,*** .50 d,*** .57 d,*** — .72 b,*** .82 b,***5. Psychosis .46d,*** .49 c,*** .37 d,*** .77 b,*** — .81 b,***6. Wariness .59d,*** .52 d,*** .50 c,*** .83 b,*** .84 b,*** —
Opposing stylesf
Rorschach1. Distress — .16b .11b –.23c,* –.11d –.17d
2. Psychosis .17b — .32b,** –.42*** –.40 c,*** –.33 d,**3. Wariness .30b,** .37b,*** — –.49 d,*** –.41 d,*** –.54 c,***
MMPI–24. Distress –.49c,*** –.17 d –.43*** — .78b,*** .80 b,***5. Psychosis –.42d,*** –.16 c –.34d,*** .78 b,*** — .78 b,***6. Wariness –.47d,*** –.18 d –.37c,*** .88 b,*** .84 b,*** —
Note. MMPI–2 = Minnesota Multiphasic Personality Inventory–2. Coefficients are from the compositevariables.
aNs = 362 and 327 for the Chicago and Tennessee samples, respectively.bHeterotrait–monomethoddiscriminant validity correlation.cConvergent validity correlation (monotrait–heteromethod).dHeterotrait–heteromethod discriminant validity correlation.ens = 111 and 109 for the Chicago and Tennesseesamples, respectively.fns = 113 and 104 for the Chicago and Tennessee samples, respectively.
*p < .05. **p < .01. ***p < .001.
199

across analyses and samples. Thus, the MMPI–2 constructs were less differenti-ated than the Rorschach constructs. When patients were elevated on one type ofscale from the MMPI–2 (e.g., negative affect), they were quite likely to be elevatedon the other two types of scales as well (e.g., psychosis and wariness). With theRorschach, this was much less likely to happen.
These within-method discriminant validity correlations also are consistent withthe factor-analytic results reported in the Methods section. Recall that the firstprincipal component of the MMPI–2 explained 48.3% of the total test variance,whereas the first principal component of the Rorschach explained a more modest25.9% of the total variance. Both the factor-analytic findings and the heterotrait–monomethod findings in Table 8 indicate that test interaction styles of guarded de-fensiveness versus openness or exaggerated dilation have a stronger impact onMMPI–2 results than they do on Rorschach results. Consequently, the Rorschachhas a better potential to measure unique or differentiated elements of personalitythan does the MMPI–2 (though whether the Rorschach actually does this is a sepa-rate question).
Returning to Table 8, a basic pattern of convergent and discriminant validitywould be indicated when the cross-method convergent correlation for a constructexceeds the cross-method discriminant correlations from the column and row thatintersect at that construct (Campbell & Fiske, 1959). For instance, when consider-ing the Tennessee patients with similar styles, the Rorschach and MMPI–2 nega-tive affect scales should correlate more highly with each other (.44) than with anyalternative cross-method construct (i.e., Rorschach negative affect with MMPI–2psychosis [.39] and with MMPI–2 wariness [.42]; MMPI–2 negative affect withRorschach psychosis [.54] and with Rorschach wariness[.65]). Across all threesections of Table 8, the results do not demonstrate such a pattern of convergent anddiscriminant validity. This is true for both the Chicago sample and the Tennesseesample.
In addition to the pattern just described, convergent and discriminant validitycan also be demonstrated when a variable’s convergent correlation exceeds itsown within-method discriminant correlations (see Campbell & Fiske, 1959). Forinstance, when considering the Tennessee patients with similar styles, the cross-method psychosis correlation (.50) should exceed the psychosis–negative affectand psychosis–wariness correlations that emerge within the Rorschach method(.37 and .41, respectively) and within the MMPI–2 method (.72 and .81, respec-tively). This pattern is not evident in any of the sections of Table 8 for either sam-ple. However, Table 8 does provide some evidence for a weaker form ofconvergent and discriminant validity. Specifically, for patients identified as hav-ing similar test interaction styles, all the Rorschach scales demonstrated cross-method convergent validity coefficients that were higher than the Rorschach’scorresponding within-method discriminant validity coefficients. Thus, the Ror-schach composite scale of negative affect correlated more highly with the MMPI–
200 MEYER ET AL.

2 scale of negative affect than it did with the Rorschach scales of psychotic pro-cesses and wariness. Similarly, the Rorschach scale of psychosis correlated morehighly with the MMPI–2 scale of psychosis than it did with the Rorschach scales ofnegative affect and wariness. In turn, the Rorschach scale of wariness correlatedmore highly with the MMPI–2 scale of wariness than it did with the Rorschachscales of negative affect or psychosis. This pattern was evident in both the Chicagoand Tennessee samples.
For patients with opposing styles, the previous pattern was less consistentacross samples. For the Tennessee patients, all three constructs displayed this pat-tern when considering the absolute value of the convergent correlation. Spe-cifically, the Rorschach scale for distress had a convergent correlation of .23, andthis cross-method correlation was larger than the corresponding within-methoddiscriminant correlations (i.e., .16 with psychosis and .11 with wariness). For theRorschach scale of psychosis, the cross-method convergent correlation was .40,and this was larger than both within-method discriminant correlations (.16 and.32). The Rorschach wariness scale had a convergent correlation of .54 with theMMPI–2, which exceeded both of the corresponding within-method Rorschachdiscriminant correlations (.11 and .32). In the Chicago sample, the Rorschachscale of negative affect correlated more highly with the MMPI–2 scale of negativeaffect (.49) than it did with the Rorschach scales of psychosis (.17) and wariness(.30). The Rorschach scale of wariness correlated more highly with the MMPI–2scale of wariness (.37) than it did with the Rorschach scales of negative affect(.30), although it was equally correlated with the Rorschach scale for psychosis(.37). The Chicago results were least supportive of the Rorschach scale of psycho-sis. For this scale, the convergent correlation (.16) was actually smaller than bothof its discriminant correlations (.17 and .37).
The MMPI–2 scales never showed a pattern of weak convergent–discriminantvalidity like that described for the Rorschach. In all analyses, the MMPI–2 scalefor negative affect was more highly correlated with the MMPI–2 scales for psy-chosis and wariness than it was with the Rorschach scale for negative affect. In likefashion, the MMPI–2 scale for psychosis was always more highly correlated withthe MMPI–2 scales for negative affect and wariness than it was with the Rorschachscale for psychosis, and the MMPI–2 wariness scale was always more highly cor-related with the MMPI–2 scales for negative affect and psychosis than it was withthe Rorschach wariness scale.
MCMI–II and MMPI–2 Correlations UsingPatients Selected by Test Interaction Styles
Table 9 presents a multitrait–monomethod matrix that summarizes the results ofthe analyses conducted on the MCMI–II and MMPI–2. Only results for the com-
RORSCHACH AND MMPI–2 REPLICATION 201
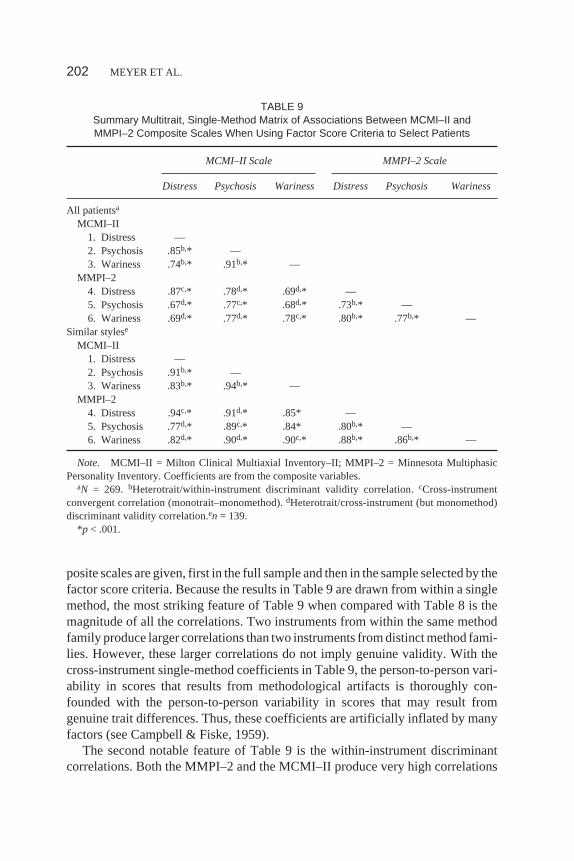
posite scales are given, first in the full sample and then in the sample selected by thefactor score criteria. Because the results in Table 9 are drawn from within a singlemethod, the most striking feature of Table 9 when compared with Table 8 is themagnitude of all the correlations. Two instruments from within the same methodfamily produce larger correlations than two instruments from distinct method fami-lies. However, these larger correlations do not imply genuine validity. With thecross-instrument single-method coefficients in Table 9, the person-to-person vari-ability in scores that results from methodological artifacts is thoroughly con-founded with the person-to-person variability in scores that may result fromgenuine trait differences. Thus, these coefficients are artificially inflated by manyfactors (see Campbell & Fiske, 1959).
The second notable feature of Table 9 is the within-instrument discriminantcorrelations. Both the MMPI–2 and the MCMI–II produce very high correlations
202 MEYER ET AL.
TABLE 9Summary Multitrait, Single-Method Matrix of Associations Between MCMI–II andMMPI–2 Composite Scales When Using Factor Score Criteria to Select Patients
MCMI–II Scale MMPI–2 Scale
Distress Psychosis Wariness Distress Psychosis Wariness
All patientsa
MCMI–II1. Distress —2. Psychosis .85b,* —3. Wariness .74b,* .91b,* —
MMPI–24. Distress .87c,* .78d,* .69d,* —5. Psychosis .67d,* .77c,* .68d,* .73b,* —6. Wariness .69d,* .77d,* .78c,* .80b,* .77b,* —
Similar stylese
MCMI–II1. Distress —2. Psychosis .91b,* —3. Wariness .83b,* .94b,* —
MMPI–24. Distress .94c,* .91d,* .85* —5. Psychosis .77d,* .89c,* .84* .80b,* —6. Wariness .82d,* .90d,* .90c,* .88b,* .86b,* —
Note. MCMI–II = Milton Clinical Multiaxial Inventory–II; MMPI–2 = Minnesota MultiphasicPersonality Inventory. Coefficients are from the composite variables.
aN = 269. bHeterotrait/within-instrument discriminant validity correlation.cCross-instrumentconvergent correlation (monotrait–monomethod).dHeterotrait/cross-instrument (but monomethod)discriminant validity correlation.en = 139.
*p < .001.

among these three presumably distinct constructs. Thus, both instruments are rela-tively hampered in their ability to discriminate among distinct constructs.
Table 9 also indicates that all correlations tend to increase when moving from thefull sample to the sample of patients selected on the basis of similar test interactionstyles.However, thechangesarenotnearlyasdramaticasthosefoundinTable8.
When considering convergent and discriminant validity, Table 9 indicates thatthe MCMI–II and MMPI–2 results do not differ from the Rorschach and MMPI–2results. Specifically, there is not a pattern of basic convergent and discriminant va-lidity. The cross-instrument convergent correlations do not clearly or uniformlyexceed the cross-instrument discriminant correlations from within the intersectingcolumn and row. When considering all patients, neither the MMPI–2 nor theMCMI–II showed evidence of the weaker form of convergent and discriminant va-lidity that had been displayed by the Rorschach in Table 8. However, this weakform of convergence and discrimination was evident for the MMPI–2 when pa-tients with similar styles were examined. Under these selection conditions, theMMPI–2 scales correlated more highly with their corresponding MCMI–II scalesthan with MMPI–2 scales measuring alternative constructs.
Estimating a Lower Boundary for Construct Convergence
Table 10 presents the results that were obtained when calculating lower bound esti-mates of convergent validity. Six sets of analyses are presented. In the top section ofthe table, the Rorschach and MMPI–2 findings are presented for the Tennesseesamples selected on the basis of similar and opposing styles. The middle section ofthe table presents the corresponding data using the Chicago sample. The final sec-tion of the table presents the MCMI–II and MMPI–2 analyses for all patients andfor those identified as having similar styles. As indicated previously, to ensure uni-formity across analyses, these findings were limited to stylistic patterns identifiedby the factor score criteria. For each set of analyses, two separate correction resultsare presented, one addressing the mean results for individual scales and the otheraddressing the composite scales. For each correction analysis, three values are re-ported: (a) the observed correlation, (b) the correlation predicted as a result of first-factor correlations, and (c) the residual correlation, calculated as the observed cor-relation minus the predicted correlation.
With one exception, the meaningfully related Rorschach and MMPI–2 vari-ables had residual correlations that are in the expected direction (i.e., positive inthe patients with similar styles and negative in the patients with opposing styles).The exception occurred with the construct of affective distress in the Tennesseepatients with opposing styles. Here, the correlations were predicted to be larger (ina negative direction) than they actually were. In general, the data also indicate thatthe residual correlations were more substantial for patients with similar test inter-
RORSCHACH AND MMPI–2 REPLICATION 203
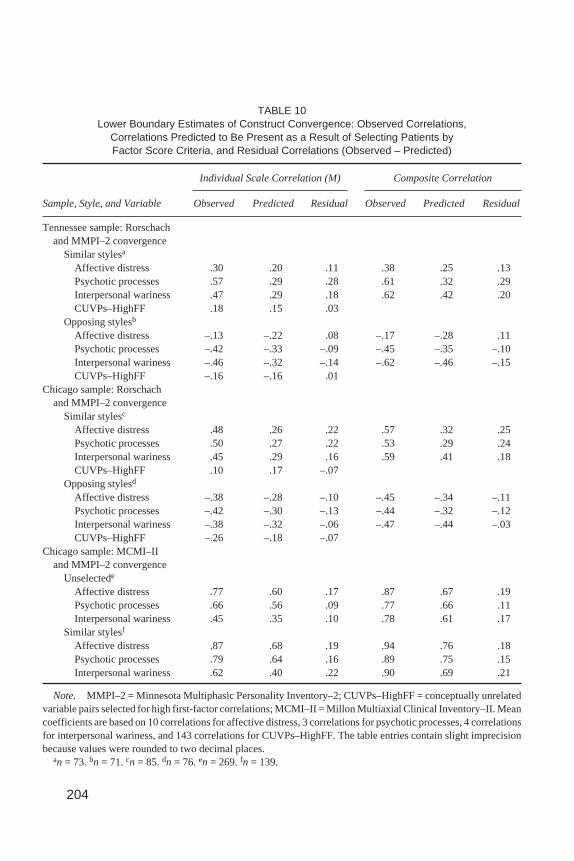
TABLE 10Lower Boundary Estimates of Construct Convergence: Observed Correlations,
Correlations Predicted to Be Present as a Result of Selecting Patients byFactor Score Criteria, and Residual Correlations (Observed – Predicted)
Individual Scale Correlation (M) Composite Correlation
Sample, Style, and Variable Observed Predicted Residual Observed Predicted Residual
Tennessee sample: Rorschachand MMPI–2 convergence
Similar stylesa
Affective distress .30 .20 .11 .38 .25 .13Psychotic processes .57 .29 .28 .61 .32 .29Interpersonal wariness .47 .29 .18 .62 .42 .20CUVPs–HighFF .18 .15 .03
Opposing stylesb
Affective distress –.13 –.22 .08 –.17 –.28 .11Psychotic processes –.42 –.33 –.09 –.45 –.35 –.10Interpersonal wariness –.46 –.32 –.14 –.62 –.46 –.15CUVPs–HighFF –.16 –.16 .01
Chicago sample: Rorschachand MMPI–2 convergence
Similar stylesc
Affective distress .48 .26 .22 .57 .32 .25Psychotic processes .50 .27 .22 .53 .29 .24Interpersonal wariness .45 .29 .16 .59 .41 .18CUVPs–HighFF .10 .17 –.07
Opposing stylesd
Affective distress –.38 –.28 –.10 –.45 –.34 –.11Psychotic processes –.42 –.30 –.13 –.44 –.32 –.12Interpersonal wariness –.38 –.32 –.06 –.47 –.44 –.03CUVPs–HighFF –.26 –.18 –.07
Chicago sample: MCMI–IIand MMPI–2 convergence
Unselectede
Affective distress .77 .60 .17 .87 .67 .19Psychotic processes .66 .56 .09 .77 .66 .11Interpersonal wariness .45 .35 .10 .78 .61 .17
Similar stylesf
Affective distress .87 .68 .19 .94 .76 .18Psychotic processes .79 .64 .16 .89 .75 .15Interpersonal wariness .62 .40 .22 .90 .69 .21
Note. MMPI–2 = Minnesota Multiphasic Personality Inventory–2; CUVPs–HighFF = conceptually unrelatedvariable pairs selected for high first-factor correlations; MCMI–II = Millon Multiaxial Clinical Inventory–II. Meancoefficients are based on 10 correlations for affective distress, 3 correlations for psychotic processes, 4 correlationsfor interpersonal wariness, and 143 correlations for CUVPs–HighFF. The table entries contain slight imprecisionbecause values were rounded to two decimal places.
an = 73.bn = 71.cn = 85.dn = 76.en = 269.fn = 139.
204

action styles than for patients with opposing styles. Across both the Chicago andTennessee samples, the average residual correlations were .21 for similar stylesand –.07 for opposing styles.
Although the corrected Rorschach and MMPI–2 coefficients are substantiallylower than those initially observed, what is most revealing is the comparable im-pact that the correction equation had on the MCMI–II and MMPI–2 coefficients.Across all results, the residual MCMI–MMPI correlations averaged .16. For thosepatients who were selected on the basis of similar styles, the residual MCMI–MMPI correlations averaged .19. Both of these values were less than the averageresidual that was found for Rorschach and MMPI–2 convergent validity when pa-tients were selected for similar styles (.21). Thus, despite the limitations that maybe possessed by these residual lower bound estimates of construct convergence,the data indicate that for patients with a similar test interaction style, Rorschachand MMPI–2 construct convergence is at least as strong as MCMI–II and MMPI–2construct convergence.
Response–Character Styles as GeneralModerators of Construct Convergence
The final set of analyses did not deliberately select any particular groups of pa-tients. Instead, they capitalized on the random variation that emerges when takingsamples from a population as a way to test the basic postulate that test interactionstyles promote construct convergence. Samples were randomly drawn from the fullpopulation 300 times, and each time, two variables were computed: Variable Aconsisted of the correlation between Rorschach and MMPI–2 first factors, andVariable B consisted of the average correlation among the relevant Rorschach andMMPI–2 construct pairs. The correlation between Variable A and Variable B wasthen calculated across the 300 subsamples. This procedure was done twice, firstwith 300 random samples of 30 patients each and then with 300 random samples of75 patients each.
When 30 patients were selected on each draw, the correlation between factorscore correlations and construct correlations was .62 (N = 300,p < .001). Whenfactor scales (i.e., R–Engagement and the MMPI–2A scale) were used instead offactor scores for Variable A, the relevant correlation was .67 (N = 300,p < .001).The Chicago sample produced very similar correlations of .58 and .66, respec-tively (when using the first factor from the normally distributed Rorschach vari-ables and the correctedA scale; see Footnotes 2 and 3). Finally, when the threepairs of composite scales were used for Variable B in the Tennessee sample, thecorrelations were .70 and .64 (N= 300,p< .001) for factor scores and factor scales,respectively.
RORSCHACH AND MMPI–2 REPLICATION 205
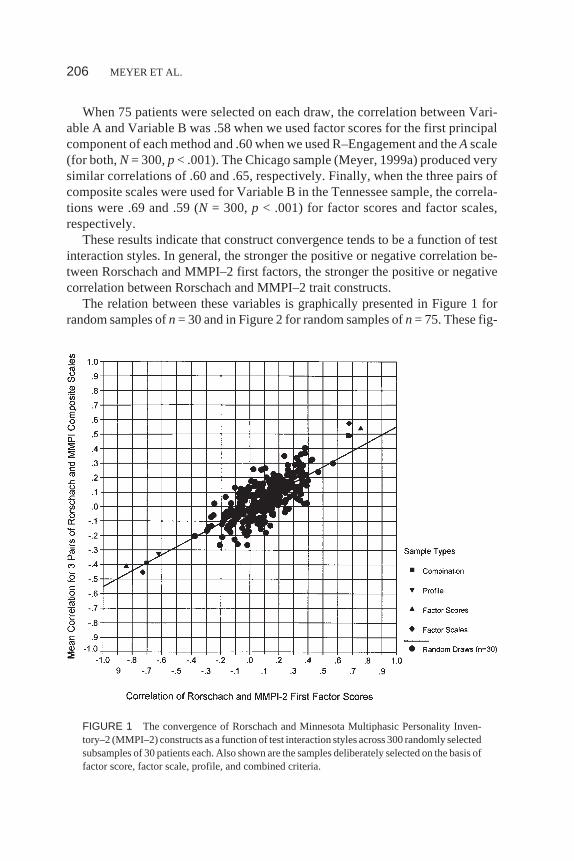
When 75 patients were selected on each draw, the correlation between Vari-able A and Variable B was .58 when we used factor scores for the first principalcomponent of each method and .60 when we used R–Engagement and theAscale(for both,N = 300,p < .001). The Chicago sample (Meyer, 1999a) produced verysimilar correlations of .60 and .65, respectively. Finally, when the three pairs ofcomposite scales were used for Variable B in the Tennessee sample, the correla-tions were .69 and .59 (N = 300,p < .001) for factor scores and factor scales,respectively.
These results indicate that construct convergence tends to be a function of testinteraction styles. In general, the stronger the positive or negative correlation be-tween Rorschach and MMPI–2 first factors, the stronger the positive or negativecorrelation between Rorschach and MMPI–2 trait constructs.
The relation between these variables is graphically presented in Figure 1 forrandom samples ofn= 30 and in Figure 2 for random samples ofn= 75. These fig-
206 MEYER ET AL.
FIGURE 1 The convergence of Rorschach and Minnesota Multiphasic Personality Inven-tory–2 (MMPI–2) constructs as a function of test interaction styles across 300 randomly selectedsubsamples of 30 patients each. Also shown are the samples deliberately selected on the basis offactor score, factor scale, profile, and combined criteria.

ures use factor scores to quantify each first factor and the average of the three pairsof composite scales to quantify construct convergence. In both figures, the resultsfrom each of the 300 randomly drawn samples are represented by a circle. For ref-erence purposes, results are also presented for the samples deliberately selected byeach of the four selection criteria.8 Samples selected by the factor scale criteria areindicated by diamonds, the factor score criteria are indicated by upward pointingtriangles, the profile criteria are indicated by downward pointing triangles, and thecombined criteria are indicated by squares.
When considering these figures, it should be recalled that the population con-sisted of all 327 patients with MMPI–2 and Rorschach data. In the population,Variable A, the correlation between Rorschach and MMPI–2 first factor scores,had a value ofr = .10 (see Table 2), and Variable B, the average correlation among
RORSCHACH AND MMPI–2 REPLICATION 207
FIGURE 2 The convergence of Rorschach and Minnesota Multiphasic Personality Inven-tory–2 (MMPI–2) constructs as a function of test interaction styles using 300 randomly selectedsubsamples of 75 patients each. Also shown are the samples deliberately selected on the basis offactor score, factor scale, profile, and combined criteria.
8When these other data points are taken into account, the correlation across samples becomes .78for n = 30 and .86 forn = 75.

the three pairs of composite scales, had a value ofr = .04 (see Table 6). Thus, theo-retically, for every sample obtained on one of the 300 random draws, Variable Ashould have a value of .10 and Variable B should have a value of .04. This does nothappen, however, because random sampling error affects each draw, such that theresults in each sample only approximate the population parameters. Smaller sam-ples produce more sampling error than do larger samples. Consequently, as seenby the degree of dispersion in Figure 1 when compared with Figure 2, 300 draws of30 patients at a time produce more widely disparate values for Variable A andVariable B than do 300 draws of 75 patients.
Statistical theory predicts that the average of the values observed across ran-domly selected samples should converge on the population parameter (Hays,1981). Across the 300 samples, the average value for Variable A should be .10, andthe average value for Variable B should be .04. This was the pattern obtained. InFigure 1, the average values are .09 and .05 for Variables A and B, respectively. InFigure 2, the values are .09 and .04, respectively.
Inaddition tosupporting thehypothesesbehind this lineof research,Figure1alsounderscores how relatively small samples can produce results that differ dramati-cally from one investigator to another. Due to natural fluctuations in sampling error,some samples will find Rorschach and MMPI–2 first factors that are positively cor-related, whereas others will find that they are negatively correlated or uncorrelated.Similarly, some samples will find Rorschach and MMPI–2 construct pairs that hap-pen tobepositivelycorrelated,whereasothersampleswill find thesamevariables tobe uncorrelated or negatively correlated.
Figures 1 and 2 also demonstrate that the samples deliberately selected on thebasis of test interaction styles anchor the tails of each scattergram. Because thesedeliberately selected samples each contain a relatively large number of patients,Figure 2 provides the best indication of how they differ from randomly selectedsamples. Selecting patients on the basis of these styles is one way to produce posi-tive (or negative) convergent validity coefficients between Rorschach and MMPI–2 constructs.
At the same time, however, Figures 1 and 2 demonstrate how the relation be-tween first-factor correlations and construct correlations is far from perfect. For in-stance, Figure 1 illustrates how two relatively small samples can find the samemoderately high degree of first-factor correlations, yet still observe very differentresults when it comes to the average degree of construct convergence. This can beseen by looking at the section of the figure where first-factor correlations fall in therange between .30 and .40. Within this column of data in the graph, it can be seenthat the average degree of construct convergence can range anywhere from .00 to.40. Thus, variables other than test interaction styles also contribute to the conver-gence and divergence of Rorschach and MMPI data.
As found previously (Meyer, 1999a), the extent to which Rorschach andMMPI–2 first factors are correlated also helps to determine the extent to which
208 MEYER ET AL.
there is a correlation among the CUVPs selected for high first-factor loadings(CUVPs–HighFF). Table 6 reveals that these meaningless variable pairs alsotended to track first-factor alignment. As a result, when the average of the CUVPs–HighFF was used as Variable B and the random draw analyses were repeated,there continued to be a correlation between first-factor alignment and the revisedVariable B. This was true for samples of 30 patients (r = .38 with factor scales;r =.57 with factor scores; for both,N = 300,p < .001) and for samples of 75 (r = .38with factor scales;r = .62 with factor scores; for both,N = 300,p < .001). The keydistinction between these analyses and those reported in Figures 1 and 2 was in themagnitude of the Variable B correlations; genuine construct pairs produced largercoefficients than did meaningless construct pairs. Replicating Meyer (1999a), asimilar process was not evident for the CUVPs–NotFF set. When these variablepairs were used as Variable B and the random draws were repeated, there tended tobe a negative correlation between first-factor alignment and the revised Variable B(for 30 patients,r = –.05 with factor scales,r = –.04 with factor scores; for 75 pa-tients,r = –.10 with factor scales,r = –.13 with factor scores). Taken together,these results indicate that when Rorschach and MMPI–2 first factors are aligned ina sample, there will tend to be a correlation between any variable pairs so long asboth members of the pair are highly correlated with their first factors. However, asseen in Table 6, the magnitude of the convergent correlations is most pronouncedwith conceptually meaningful variable pairs.
DISCUSSION
This article has presented a long and detailed series of analyses related to Ror-schach and MMPI–2 convergent validity. Overall, results with a large sample ofoutpatients from Tennessee closely paralleled previous findings that relied on alarge sample of inpatient and outpatients from Chicago. In addition, analyses usingnew and more liberal procedures to identify test interaction styles extended the pre-vious results. In combination, the replicated and extended findings add credence tothe idea that the convergence of Rorschach and MMPI–2 constructs is partially afunction of how patients interact with the tests. When patients approach each testwith a similar style, conceptually aligned constructs tend to correlate. Although aless robust finding, when patients approach each test in an opposing manner, con-ceptually aligned constructs tend to be negatively correlated. When test interactionstyles are ignored, MMPI–2 and Rorschach constructs tend to be uncorrelated. Anexception to the last conclusion occurs when a sample just happens to have a corre-lation between Rorschach and MMPI first factors. Under these conditions, therewill also tend to be a parallel correlation among Rorschach and MMPI constructs.
Our general findings nicely replicate and extend the results of previous re-search. Nonetheless, it is still possible that unrecognized methodological artifacts
RORSCHACH AND MMPI–2 REPLICATION 209

have influenced the results from both samples of data. This prospect is minimizedby the fact that we used three separate strategies to test for methodological arti-facts, and none of them could account for the findings. First, as demonstrated inFigures 1 and 2, the pattern of Rorschach and MMPI–2 convergent validity holdswhen no selection criteria are imposed on the patient samples. Second, when selec-tion criteria are imposed, convergent validity correlations for meaningful pairs ofRorschach and MMPI–2 scales consistently exceed the correlations found for con-ceptually meaningless variable pairs (see Tables 6 and 7). This was particularlytrue for those patients with similar test interaction styles. Finally, when we calcu-lated lower bound estimates of construct convergence that corrected for our selec-tion procedures, we saw that our observed correlations were consistently largerthan those predicted on the basis of our selection methodology. In fact, as the datain Table 10 indicate, when the same selection procedures were applied to scoresfrom two self-report tests, we found that Rorschach and MMPI–2 convergent va-lidity correlations were slightly larger than MCMI–II and MMPI–2 convergent va-lidity correlations.
Although our results could not be explained by the methodological challengeswe tested, it is still possible that we have misunderstood some of the factors thatappear to govern Rorschach and MMPI–2 convergent validity. As such, it wouldbe optimal if other thoughtful methodological challenges were put forward andtested against the evidence.
In addition, although very similar findings have emerged from two large and in-dependent data sets, further efforts at replication are warranted. To gain certaintyabout the generalizability of the findings and the processes that produce them, itwould be optimal for other researchers to repeat the analyses on large data sets us-ing the same procedures and variables reported here. If the general findings arereplicated, it would then seem warranted to extend the analyses in new ways (e.g.,to additional pairs of conceptually aligned MMPI–2 and Rorschach variables andto self-report tests other than the MMPI–2). One way in which these analysescould be extended would be to apply the same procedures to an adolescent popula-tion. Although Krishnamurthy, Archer, and House (1996) reported no evidence forthe convergence of Rorschach and MMPI–2 constructs in an adolescent sampleand Archer and Krishnamurthy (1999) more recently criticized elements in thisgeneral line of research, a direct attempt at replication has not yet been tried withtheir adolescent data (see Meyer, 1999a).
Because the analyses described previously are complex and involve numeroussteps, they are prone to errors (e.g., Footnotes 3 and 7; cf. Meyer, 1998). Also, re-searchers attempting to replicate the design may have questions about explicit pro-cedures that go beyond the information described in the Method section of thisarticle. To facilitate the work of other researchers, several SPSS syntax files havebeen prepared that detail the steps and commands used for the analyses. These syn-tax files can be obtained by contacting Gregory J. Meyer.
210 MEYER ET AL.
Despite the generally remarkable degree of replication across samples, someambiguities remain. In particular, it is unclear how one should understand some ofthe discrepancies that have emerged for patients with opposing test interactionstyles. Meyer’s (1997b, 1999a) original analyses found strong convergence fornegative affect scales but only mild convergence for scales of psychotic processesand wariness. In a new analysis of his data (see Table 7), strong convergence wasfound for all three trait constructs when factor scores were used to identify test in-teraction styles. In contrast, the Tennessee sample found strong convergence forpsychotic processes and wariness but relatively little evidence of convergence fornegative affect,9 except when factor scales were used to identify stylistic patterns.
In combination, these results indicate that there is a greater degree of instabilityassociated with discordant test interaction styles than with similar test interactionstyles. This instability may be a function of general sampling error, or it may indi-cate that the results are quite sensitive to initial sampling conditions in which rela-tively small differences in the patients selected for analysis have a large impact onthe final results. Alternatively, given the (limited) data that has been presented onpatients with opposing test interaction styles (see Meyer, 1997b, pp. 323–326), thesomewhat inconsistent findings may point to particular dynamics and defensiveoperations in the kinds of patients classified by the various criteria or in the kindsof patients seen in the Chicago setting versus the Tennessee setting.
Another ambiguity associated with this line of research has to do with the crite-ria for defining styles. The profile criteria were fixed across both samples, with thesame cutoff scores being employed for each. Because normative data are availablefor each of the profile scores, a fixed set of criteria has seemed appropriate.However, the factor criteria have been relative rather than fixed. As such, patientshave been selected for analysis using the upper and lower thirds of the scale distri-butions, rather than using fixed values to define high and low scores. Because nor-mative data are not available for the factor score criteria, reliance on relativisticcriteria has seemed appropriate. However, it would be worthwhile to explore theextent to which these findings can be replicated using fixed criteria for the factors.
A final ambiguity relates to the multitrait–multimethod matrices. These matri-ces did not provide clear evidence of convergent validity relative to discriminantvalidity. This was true when Rorschach and MMPI–2 scales were evaluated in atraditional multitrait–multimethod matrix, but it was also true when MCMI–II andMMPI–2 scales were evaluated in a multitrait–monomethod matrix. At best, therewas evidence for a weak form of convergence and discrimination. However, thispattern was only present for the Rorschach when considering the Rorschach–MMPI–2 correlations, and it was only present for the MMPI–2 when considering
RORSCHACH AND MMPI–2 REPLICATION 211
9In the Tennessee sample, scatter plots suggested a more curvilinear relation to the data, such thatRorschach indicators of affective distress were lower when MMPI–2 indicators of affective distresswere either very low or very high.

the MCMI–MMPI correlations. Although these results are discouraging, the ma-trices in Tables 8 and 9 are fairly typical of what is found in the literature. For in-stance, in their classic work, Campbell and Fiske (1959) reported 11 tables ofmultitrait–multimethod correlations. Because some tables relied on three or fourdistinct methods of assessment, there was a total of 24 cross-method comparisoncells. Only one (4.2%) displayed the basic pattern of expected convergent anddiscriminant validity. In the same article, there were 48 instances when cross-method convergent correlations could be compared to within-method discriminantcorrelations. Only three examples (6.3%) showed the weak pattern of convergenceand discrimination we observed. Findings similar to those in Tables 8 and 9 can befound in recent large-scale studies (e.g., Cole, Truglio, & Peeke, 1997) and inAchenbach, McConaughy, and Howell’s (1987) meta-analytic review (but seeCosta & McCrae, 1992, for more promising results).
With respect to clinical practice, one implication that should be obvious is thatthe Rorschach and the MMPI–2 are distinct assessment methods. Globally, the re-sults of one test are independent of the results of the other. Because of this, clini-cians should use both measures when they are interested in obtaining a broadunderstanding of their patients’ personalities. Each method alone is incompleteand may provide a limited degree of information.
With the global independence of Rorschach and MMPI–2 scores as our launch-ing point, the goal of the analyses detailed here was simply to demonstrate that thisindependence can be altered to produce cross-method correlations if researcherstake into account the manner in which patients interact with these two testingtasks. Clinicians can anticipate a greater degree of correspondence between Ror-schach and MMPI–2 findings related to affective distress, psychosis, and interper-sonal wariness when patients display a similar style of interacting with each task.Conversely, clinicians can anticipate that these Rorschach and MMPI–2 con-structs will show a greater degree of disagreement when patients approach eachtask in a very different manner (i.e., a constricted style on one test and a dilatedstyle on the other).
Unfortunately, knowing about these cross-method correlations does not trans-late into direct or easy implications for clinical practice. In part, this is because theeffects under consideration, although of substantial magnitude, do not apply toeach and every patient. Some patients with similar test interaction styles still pro-duce rather different looking Rorschach and MMPI–2 scores, whereas some pa-tients with opposing test interaction styles still produce fairly similar test scores. Asecond complicating factor is that test interaction styles do not emerge from uni-form patient characteristics. Rather, very different factors may give rise to a con-stricted style or a dilated style on these tests. For instance, an MMPI protocol and aRorschach protocol may substantially agree with each other, showing either rela-tively few or many signs of disturbance; however, this agreement may be the resultof a patient’s deliberate efforts to distort the data obtained from each test. Alterna-
212 MEYER ET AL.
tively, the same pattern of agreement may reflect the patient’s genuine limitationsand difficulties. Obviously, given these alternatives, a clinician could interpret thevery same pattern of test results in vastly different ways. Unfortunately, test scoresalone do not seem capable of providing the clinician with sufficient clues abouthow the results should be interpreted. Rather, test scores have to be considered inconjunction with other information from referral sources, significant others, his-tory, and observed behavior, as well as the general context of the evaluation, to de-termine which of these very different alternatives (distorted vs. genuine results)should be given credence. These are interpretive complications that readily arisewhen the Rorschach and MMPI generally agree with each other. Different fac-tors come to the forefront when considering Rorschach and MMPI scores thatdisagree with each other. Under these circumstances, the clinician not only needsto consider the preceding factors but must also take into account the strengthsand limitations of both tests, the sensitivity of each method to different elementsof personality, and the legitimate personality dynamics that may produce a patternof opposing test scores.
Currently, there is more theorizing than hard data available to understand thetypes of patients and processes that produce discrepant MMPI–2 and Rorschachresults. However, clinically informed reasoning has provided useful suggestionsfor conceptualizing these test patterns (e.g., Finn, 1996; Meyer, 1996, 1997b,1999a), and preliminary research has documented strong, expected associationsbetween discrepant Rorschach–MMPI findings and criterion diagnoses that indi-cated that conscious awareness was being protected from underlying emotionaldistress (Meyer, 1997b). It will be useful for future research to explore and docu-ment in more detail the characteristics of the patients who produce each of the fourbasic cross-method patterns (i.e., constricted on both methods, dilated on bothmethods, constricted on the Rorschach and dilated on the MMPI–2, and con-stricted on the MMPI–2 and dilated on the Rorschach). Given that each pattern canemerge from quite different personality characteristics and motivational states, itmay be best to begin the analyses by identifying groups of patients who have thepersonality traits or motivational states that should lead to a particular cross-method pattern and then examine the test data to see if the expected patternemerges. All in all, there is much more to be learned and documented about thecombined use of the Rorschach and MMPI–2 in clinical practice. Clinically in-formed qualitative methods and fine-grained, multimethod criterion measures ofpersonality should serve us well as we pursue these goals.
REFERENCES
Achenbach, T. M., McConaughy, S. H., & Howell, C. T. (1987). Child/adolescent behavioral and emo-tional problems: Implications of cross-informant correlations for situational specificity.Psycholog-ical Bulletin, 101,213–232.
RORSCHACH AND MMPI–2 REPLICATION 213

Archer, R. P., & Krishnamurthy, R. (1999). Reply to Meyer on the convergent validity of the MMPI andRorschach.Journal of Personality Assessment, 73,319–321.
Ben-Porath, Y. S., & Sherwood, N. E. (1993).The MMPI–2 content component scales: Development,psychometric characteristics, and clinical application.Minneapolis: University of MinnesotaPress.
Butcher, J. N., Dahlstrom, W. G., Graham, J. R., Tellegen, A., & Kaemmer, B. (1989).Manual for therestandardized Minnesota Multiphasic Personality Inventory: MMPI–2. An administrative and in-terpretive guide.Minneapolis: University of Minnesota Press.
Campbell, D. T., & Fiske, D. W. (1959). Convergent and discriminant validation by the multitrait–multimethod matrix.Psychological Bulletin, 56,81–105.
Cheek, J. M. (1982). Aggregation, moderator variables, and the validity of personality tests: A peer-rat-ing study.Journal of Personality and Social Psychology, 43,1254–1269.
Cicchetti, D. V. (1994). Guidelines, criteria, and rules of thumb for evaluating normed and standardizedassessment instruments in psychology.Psychological Assessment, 6,284–290.
Cole, D. A., Howard, G. S., & Maxwell, S. E. (1981). Effects of mono- versus multiple-operation-alization in construct validation efforts.Journal of Consulting and Clinical Psychology, 49,395–405.
Cole, D. A., Truglio, R., & Peeke, L. (1997). Relation between symptoms of anxiety and depression inchildren: A multitrait–multimethod–multigroup assessment.Journal of Consulting and ClinicalPsychology, 65,110–119.
Cook, T. D., & Campbell, D. T. (1979).Quasi-experimentation: Design & analysis issues for field set-tings.Boston: Houghton Mifflin.
Costa, P. T., Jr., & McCrae, R. R. (1992).Revised NEO Personality Inventory: Professional manual.Odessa, FL: Psychological Assessment Resources.
Epstein, S. (1983). Aggregation and beyond: Some basic issues on the prediction of behavior.Journal ofPersonality, 51,360–392.
Exner, J. E., Jr. (1993).The Rorschach: A comprehensive system: Vol. 1. Basic foundations(3rd ed.).New York: Wiley.
Exner, J. E., Jr., Cohen, J. B., & McGuire, H. (1990).RIAP Version 2: Rorschach Interpretation Assis-tance Program.Asheville, NC: Rorschach Workshops.
Finn, S. E. (1996). Assessment feedback integrating MMPI–2 and Rorschach findings.Journal of Per-sonality Assessment, 67,543–557.
Harkness, A., McNulty, J., & Ben-Porath, Y. (1995). The Personality Psychopathology Five (PSY–5):Constructs and MMPI–2 scales.Psychological Assessment, 7,104–114.
Hays, W. L. (1981).Statistics(3rd ed.). New York: Holt, Rinehart & Winston.Krishnamurthy, R., Archer, R. P., & House, J. J. (1996). The MMPI–A and Rorschach: A failure to es-
tablish convergent validity.Assessment, 3,179–191.McGraw, K. O., & Wong, S. P. (1996). Forming inferences about some intraclass correlation coeffi-
cients.Psychological Methods, 1,30–46.Meyer, G. J. (1992). The Rorschach’s factor structure: A contemporary investigation and historical re-
view. Journal of Personality Assessment, 59,117–136.Meyer, G. J. (1996). The Rorschach and MMPI: Toward a more scientifically differentiated understand-
ing of cross-method assessment.Journal of Personality Assessment, 67,558–578.Meyer, G. J. (1997a). Assessing reliability: Critical corrections for a critical examination of the Ror-
schach Comprehensive System.Psychological Assessment, 9,480–489.Meyer, G. J. (1997b). On the integration of personality assessment methods: The Rorschach and
MMPI–2. Journal of Personality Assessment, 68,297–330.Meyer, G. J. (1998). Error in research and assessment data with an erratum for Meyer (1993).Journal of
Personality Assessment, 71,195–211.
214 MEYER ET AL.
Meyer, G. J. (1999a). The convergent validity of MMPI and Rorschach scales: An extension using pro-file scores to define response–character styles on both methods and a re-examination of simple Ror-schach response frequency.Journal of Personality Assessment, 72,1–35.
Meyer, G. J. (1999b). Simple procedures to estimate chance agreement and kappa for the interrater reli-ability of response segments using the Rorschach Comprehensive System.Journal of PersonalityAssessment, 72,230–255.
Meyer, G. J., Baxter, D., Exner, J. E., Jr., Fowler, J. C., Hilsenroth, M. J., Piers, C. C., & Resnick, J.(1999).An examination of interrater reliability for scoring the Rorschach Comprehensive System infive data sets.Manuscript submitted for publication.
Millon, T. (1987).Millon Clinical Multiaxial Inventory–II: Manual for the MCMI–II(2nd ed.). Minne-apolis, MN: National Computer Systems.
Overholser, J. C. (1992). Aggregation of personality measures: Implications for personality disorder re-search.Journal of Personality Disorders, 6,267–277.
Rushton, J. P., Brainerd, C. J., & Pressley, M. (1983). Behavioral development and construct validity:The principle of aggregation.Psychological Bulletin, 94,18–38.
Tsujimoto, R. N., Hamilton, M., & Berger, D. E. (1990). Averaging multiple judges to improve validity:Aid to planning cost-effective clinical research.Psychological Assessment, 2,432–437.
Gregory J. MeyerDepartment of PsychologyUniversity of Alaska Anchorage3211 Providence DriveAnchorage, AK 99508E-mail: [email protected]
Received June 22, 1999Revised November 15, 1999
RORSCHACH AND MMPI–2 REPLICATION 215