A Real Time Quality Monitoring System for the Lighting Industry: A ...
8
A Real Time Quality Monitoring System for the Lighting Industry: A Practical and Rapid Approach Using Computer Vision and Image Processing (CVIP) Tools Regular Paper C.K. Ng 1 , C.H. Wu 1* , W.H. Ip 1 , C.Y. Chan 1 and G.T.S Ho 1 1 Dept. of Industrial and Systems Engineering, The Hong Kong Polytechnic University, Hong Kong * Corresponding author email: [email protected] Received 10 Oct 2011; Accepted 21 Dec 2011 Abstract In China, the manufacturing of lighting products is very labour intensive. The approach used to check quality and control production relies on operators who test using various types of fixtures. In order to increase the competitiveness of the manufacturer and the efficiency of production, the authors propose an integrated system. This system has two major elements: a computer vision system (CVS) and a real‐time monitoring system (RTMS). This model focuses not only on the rapid and practical application of modern technology to a traditional industry, but also represents a process innovation in the lighting industry. This paper describes the design and development of the prototyped lighting inspection system based on a practical and fast approach using computer vision and imaging processing (CVIP) tools. LabVIEW with IMAQ Vision Builder is the chosen tool for building the CVS. Experimental results show that this system produces a lower error rate than humans produce in the quality checking process. The whole integrated manufacturing strategy, aimed at achieving a better performance, is most suitable for a China and other labour intensive environments such as India. Keywords Integrated manufacturing; Computer vision and image processing; Real‐time monitoring system; LabVIEW; IMAQ vision builder. 1. Introduction This paper presents the use of an integrated approach, combining a computer vision system (CVS) and a real‐time management system (RTMS), to solve quality control problems in the manufacturing of lighting products. Recently, the light industry has become prosperous in Mainland China. The rapid progress of Chinaʹs light industry has attracted many foreign investors and it now has over 20,000 foreign‐funded enterprises. In 2000‐2010, the lighting industry sector progressed to a new stage. In this stage, the output of many products such as incandescent light bulbs, light emitting diodes, halogen light bulbs, fluorescent lights, neon lights, high‐intensity discharge lamps has greatly expanded. This growth in quantity has been accompanied by an advance in quality. All the manufacturers are facing serious competition from each other. In order to retain a www.intechweb.org www.intechopen.com Int. j. eng. bus. manag., 2011, Vol. 3, No. 4, 14-21
Transcript of A Real Time Quality Monitoring System for the Lighting Industry: A ...
A Real Time Quality Monitoring System for the Lighting Industry: A Practical and Rapid Approach Using Computer Vision and Image Processing (CVIP) Tools
Regular Paper
C.K. Ng1, C.H. Wu1*, W.H. Ip1, C.Y. Chan1 and G.T.S Ho1 1 Dept. of Industrial and Systems Engineering, The Hong Kong Polytechnic University, Hong Kong * Corresponding author email: [email protected] Received 10 Oct 2011; Accepted 21 Dec 2011
Abstract In China, the manufacturing of lighting products is very labour intensive. The approach used to check quality and control production relies on operators who test using various types of fixtures. In order to increase the competitiveness of the manufacturer and the efficiency of production, the authors propose an integrated system. This system has two major elements: a computer vision system (CVS) and a real‐time monitoring system (RTMS). This model focuses not only on the rapid and practical application of modern technology to a traditional industry, but also represents a process innovation in the lighting industry. This paper describes the design and development of the prototyped lighting inspection system based on a practical and fast approach using computer vision and imaging processing (CVIP) tools. LabVIEW with IMAQ Vision Builder is the chosen tool for building the CVS. Experimental results show that this system produces a lower error rate than humans produce in the quality checking process. The whole integrated manufacturing strategy, aimed at achieving a better performance, is most suitable for a China and other labour intensive environments such as India.
Keywords Integrated manufacturing; Computer vision and image processing; Real‐time monitoring system; LabVIEW; IMAQ vision builder.
1. Introduction This paper presents the use of an integrated approach, combining a computer vision system (CVS) and a real‐time management system (RTMS), to solve quality control problems in the manufacturing of lighting products. Recently, the light industry has become prosperous in Mainland China. The rapid progress of Chinaʹs light industry has attracted many foreign investors and it now has over 20,000 foreign‐funded enterprises. In 2000‐2010, the lighting industry sector progressed to a new stage. In this stage, the output of many products such as incandescent light bulbs, light emitting diodes, halogen light bulbs, fluorescent lights, neon lights, high‐intensity discharge lamps has greatly expanded. This growth in quantity has been accompanied by an advance in quality. All the manufacturers are facing serious competition from each other. In order to retain a
Int. j. eng. bus. manag., 2011, Vol. 3, No. 4, 14-2114 www.intechweb.orgwww.intechopen.com
Int. j. eng. bus. manag., 2011, Vol. 3, No. 4, 14-21

market share in the lamp manufacturing business, manufacturers need to increase their competitiveness by achieving higher quality and greater productivity. However, the production processes are labour‐intensive, especially the quality control process which is highly dependent on the skills of the employees. In this case study of the production line of a lighting product, the incandescent light bulb was chosen to demonstrate how to improve the quality control process. The reason for choosing the incandescent light bulb was that it is still in great demand. Although it is an enormously inefficient method to convert electrons into photons, over nine billion incandescent light bulbs are sold in the world per year with two billion bulbs sold every year in the EU alone according to Philips [1]. 1.1 Problem statement and the proposed solution Normally, the quality control of this lighting product is carried out manually by visually checking the existence and quality of the filament inside the light bulb after production. Quality controllers check the quality of the filament of the products and record the results to report if the desired production quality is achieved or not. This manual inspection of the lighting products is time consuming and subject to human error. To solve this problem, it is necessary to consider automating the quality control of the products by using computer vision and imaging processing (CVIP) tools and real‐time management (RTM) technology. The process of measuring the quality of the light bulbs can be outlined as follows: Firstly, the existence of the filament after production needs to be confirmed. Secondly, the quality control operator needs to check the shape and the status of the filament based on a model the operator learnt during the training period. If the difference is minor, then the product qualifies as a ‘pass’, otherwise it is off‐standard. Thirdly, each operator is required to record the number of items checked as well as the number of failed products. There are two main problems in the existing process. The products are mostly checked by human operators using hand‐held tools. This is extremely tedious work. Manually inspection every final product in the assembly line is also inefficient and not cost effective. Secondly, the records kept by the operators are collected and inputted into a personal computer with MS‐OfficeTM and MS‐Visual StudioTM based software at the end of each daily shift, therefore the production manager can only review the overall record in the computer after each shift, not ‘anytime or anywhere’. The first problem can be solved by using CVIP tools. Computer vision is a technology for acquiring and analyzing a digital image to obtain information or to
control processes. It has been reported that computer vision with applications ranging from routine inspection to complex vision monitoring can be a successful tool for the real‐time measurement of a wide range of products and can be used to check product quality in the lamp making industry [2, 3]. It enables users to extract the region of interest (ROI) of the light bulb—the filament—as a digital picture with a format of 1024 pixels x 768 pixels. Usually, there is no professional programmer employed in the manufacturing plant. Asking in‐house engineers to either build up the whole CVS by writing a program or to modify commercial vision software packages to suit a specific purpose is almost impossible. The real difficulty lies in how the engineers can create an inspection system easily and quickly. The most effective technology for simplifying the development of the system is by graphical programming using LabVIEW. The second part of the problem, reviewing the data, was addressed by an idea taken from Costa et al. [4] which uses a RTM approach to speed up the flow of information and avoid delays between the quality check and corrective action. The RTM system has two main modules to it: the plant control module and the office‐monitoring module. 1.2 Existing quality checking procedure for lamps This paper focuses on the completion of the whole manufacturing process of the light bulbs. In order to achieve testing results within a short period of time, all light bulbs will undergo a simple visual test manually to ensure there are no missing or broken filaments before being packed into cartons. Only selected light bulbs were fitted into a life test fixture and lit at far more demanding levels than during their normal usage; hence an accurate reading of how long the bulb will last under normal conditions can be determined. This specific test for lamp life and strength is performed at the manufacturing plant itself or at some independent laboratory. 2 Computer vision system for light bulbs The computer vision system is the key to reducing the time‐consuming inspection process. Lin and Chan [5] point out that it is feasible to carry out an inspection of light bulb filaments by using two‐dimensional input pictures. McLeod reports on an automatic visual inspection system for light bulbs [6]. However, the system was complicated and a lot of accurate data were needed from the image captured. In order to achieve a practical and rapid approach to building up the CVS, an image processing technique, pattern matching, needs to be applied. This was shown by Mulliner [7] who points out that pattern matching can give a 100% successful automotive inspection of alignment and gauging.
Int. j. eng. bus. manag., 2011, Vol. 3, No. 4, 14-2115 www.intechweb.orgwww.intechopen.com
Pattern matching, also called ‘correlation’, ‘pattern recognition’ or ‘template matching’—is a mathematical process for identifying the region in an image that looks most like a given reference sub‐image [8]. It invariably includes a learning process as it requires a ‘master piece’ to create a template. A score is usually generated depending on how well the object or feature under inspection matches the template. In this case study, one of the main objectives was to build up a practical CVS quickly and that is the reason why LabVIEW with IMAQ was chosen. The techniques used in pattern matching with IMAQ Vision Builder are based on normalized cross correlation as well as on a much more advanced method that incorporates image understanding techniques to interpret the template information and then uses the results to find the template in the image. The techniques include a non‐uniform sampling of images, geometric modeling of images, and extraction of template information that is rotation independent and scale independent. These techniques reduce the processing time by reducing the amount of information needed to fully characterize the image or pattern and remove noise. In addition, one more technique enabled by IMAQ Vision Builder, non‐uniform sampling, is applied in the CVS. Through this technique, the speed and accuracy of the pattern matching can be improved by sampling the image and extracting a few points that represent the overall content of the image. Particularly, it uses the image’s edge information to provide significant data about the structure of the image. It can process the edge image further to extract higher‐level geometric information about the image, for example, the number of straight lines or circles present in the image. Pattern matching performed by IMAQ Vision Builder is able to locate objects where they vary in size (±5%) and orientation (0 degree‐360 degree) even if their appearances are degraded. 2.1 The reason for choosing LabVIEW To apply computer vision in every application, three processes are involved: image acquisition, image processing and communication of the result. The top vision software packages in the market today will usually support the camera for the different applications. Also, all of them feature more or less similar algorithms for image processing. The major algorithms are essentially interchangeable between them in terms of speed and accuracy. This paper does not compare the differences or discuss their advantages. The main focus here is to explore how in‐house engineers in the light bulb manufacturing plant can make use of the algorithms to develop a CVS and communicate the results easily.
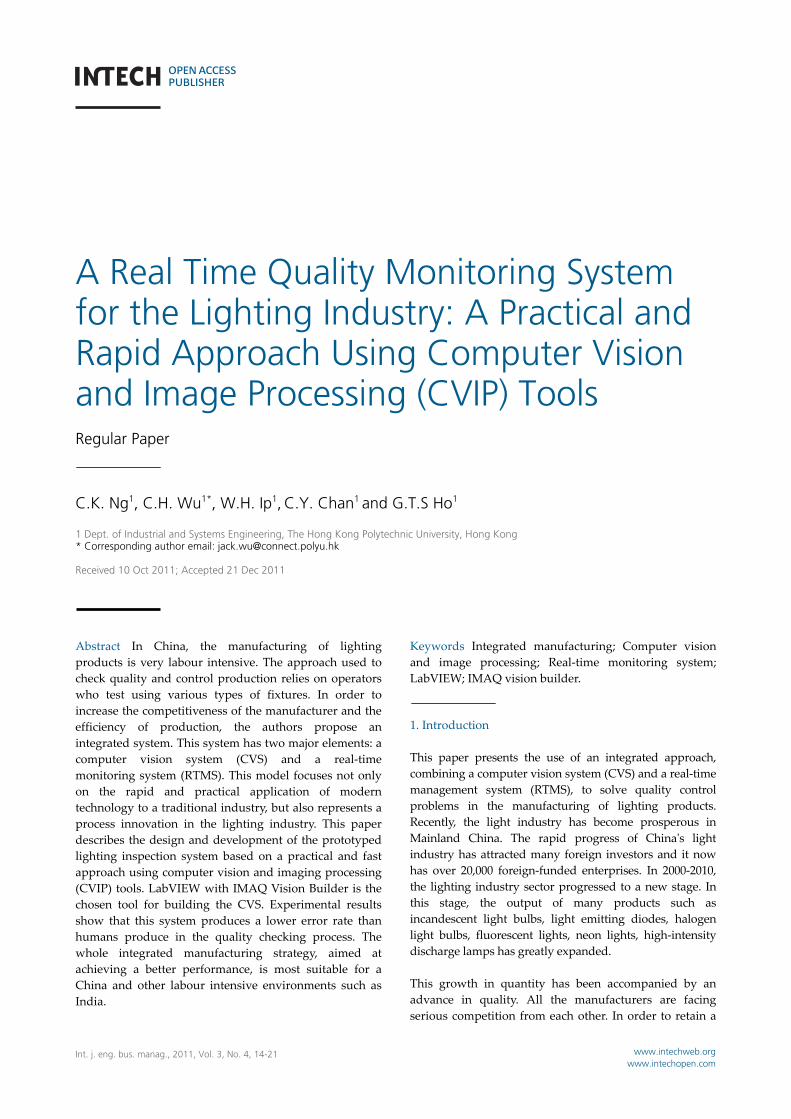
LabVIEW is a software tool used to assemble software constructions called virtual instruments (VIs). They look and act like real physical instruments [9]. A VI display on a computer screen in a front panel shows controls, such as knobs and switches, indicators, meters and lights. Everything in LabVIEW is graphically represented by icons with input and output terminals. To show connections, each icon is connected by wires created by using a mouse to indicate the flow of the data and to define the execution order of the subVIs. There are a number of pick‐and‐use subVIs in the drag‐and‐drop libraries that can be used for data acquisition, hardware communication, digital signal processing, numerical and statistical analysis [10]. LabVIEW also affords engineers an application prototyping workplace with a menu‐driven interface. Engineers can explore ‘what‐if’ conditions on images before building codes. Such graphical dataflow language enables them to complete the application by generating ready‐to‐execute C, C++ and Visual Basic codes. It is an ideal choice for engineers conducting a CVS project. They can use their valuable experience in order to create an inspection system which can be fully applied to shorten operation time and increase operational efficiency. 2.2 Design of a computer vision system (CVS) In the CVS, there are three modules: a pattern‐matching module, a decision‐making module and a motion module. The pattern‐matching module consists of two phases, a learning phase and a matching phase. The learning phase allows the system to learn the features present in an image; for example, it learns the geometric information and information extracted from the template. The selection of a good image as a template plays a critical part in obtaining good results. It ensures that all the important and unique characteristics of the pattern are well defined so that the template can be used to test whether a filament has a desired structure and to find relevant structures. In the template, the characteristics of the filament inside the light bulb must be viewed clearly and without the blur which can be caused by incorrect focus or miscalculated depth of view. The filament must be in good condition. Fig. 1 shows an image correctly focused with a filament distinct enough to act as the template for learning and matching.
Figure 1. Example of a template
C.K. Ng, C.H. Wu, W.H. Ip, C.Y. Chan and G.T.S Ho: A Real Time Quality Monitoring System for the Lighting Industry: A Practical and Rapid Approach Using Computer Vision and Image Processing (CVIP) Tools
16www.intechweb.orgwww.intechopen.com
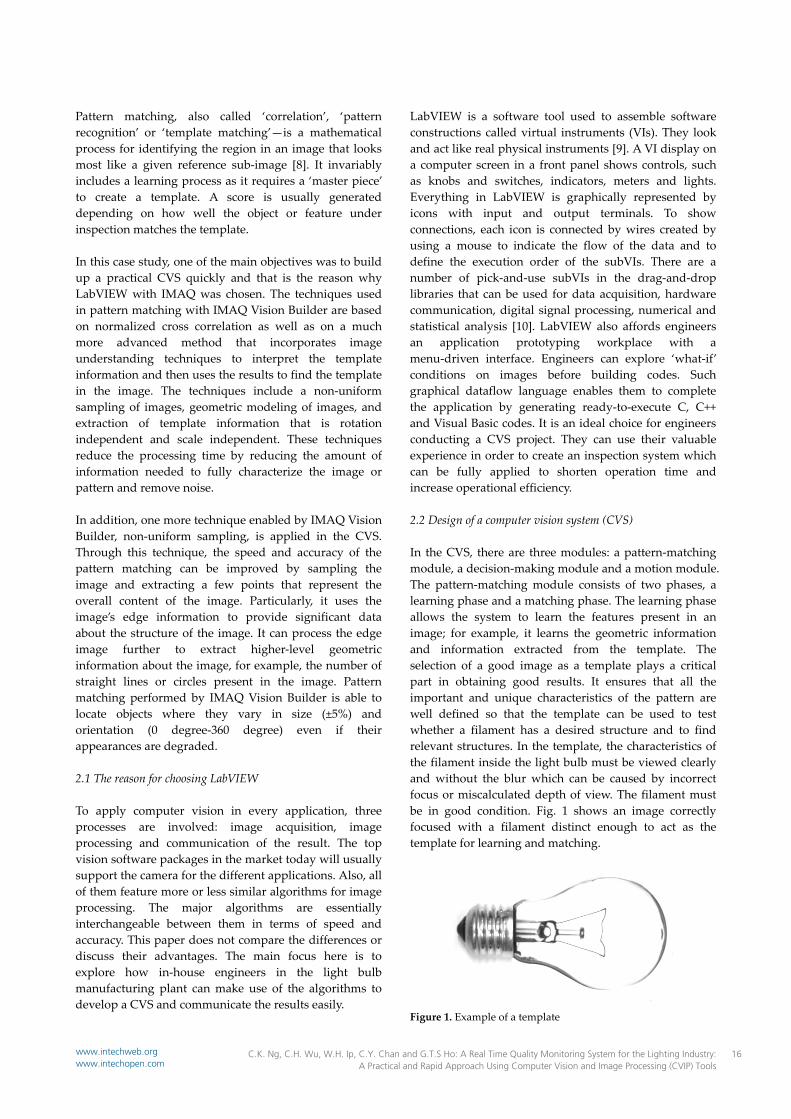
A preliminary step to the learning phase is to create a region of interest (ROI). Since only certain features (a subset of the image) are essential in the image, extraction of the subset can greatly reduce the memory size of the template and the time for learning. That is why the ROI must be specified before the learning phase. Fig. 2 demonstrates the extracted template created by a specified ROI in an image. Although the default values of the parameters used in the pattern matching algorithm enabled by IMAQ can work for a high percentage of the applications, there may be some applications in which the defaults are not optimal; therefore, there are some adjustable pattern matching parameters for users in the user‐interface. The parameters include minimum contrast, match mode and sub‐pixel accuracy. Minimum contrast is the minimum difference between the smallest and largest pixel values in a region, and it can be used for filtering. The value of the minimum contrast is set to 50, which implies that the pattern matching tool ignores all image regions where contrast values fall below 50. Thus, to obtain a high minimum contrast value means excluding all areas in the image with low contrast. This can also potentially increase matching speed by ignoring irrelevant areas with low contrast value and make the important features more distinct. ‘Match Mode’ specifies the invariance technique to use when looking for the template image in the inspection image. There are two modes for matching: shift invariant and rotation invariant. ‘Sub‐pixel Accuracy’ determines whether or not to return the match results with sub‐pixel accuracy.
Figure 2. Example of extracted template After the user has defined all the pattern‐matching parameters, he is required to input the accepted minimum score and synchronized rate. The score can be understood as ‘similarity of pixel by pixel’. The maximum score in this case is 1000 which means the light bulb under inspection matches (i.e. the same as) the template 100%; hence the existence, the shape and the status of the filament exactly match the one set by the manufacturer. For the synchronized rate, the image‐capture timing is synchronized with the conveyor speed. All the settings will be passed to the decision‐making module in order to set the criteria for passing or failing a light bulb. It is, above all, a rule‐based decision‐making process. For an image captured, the
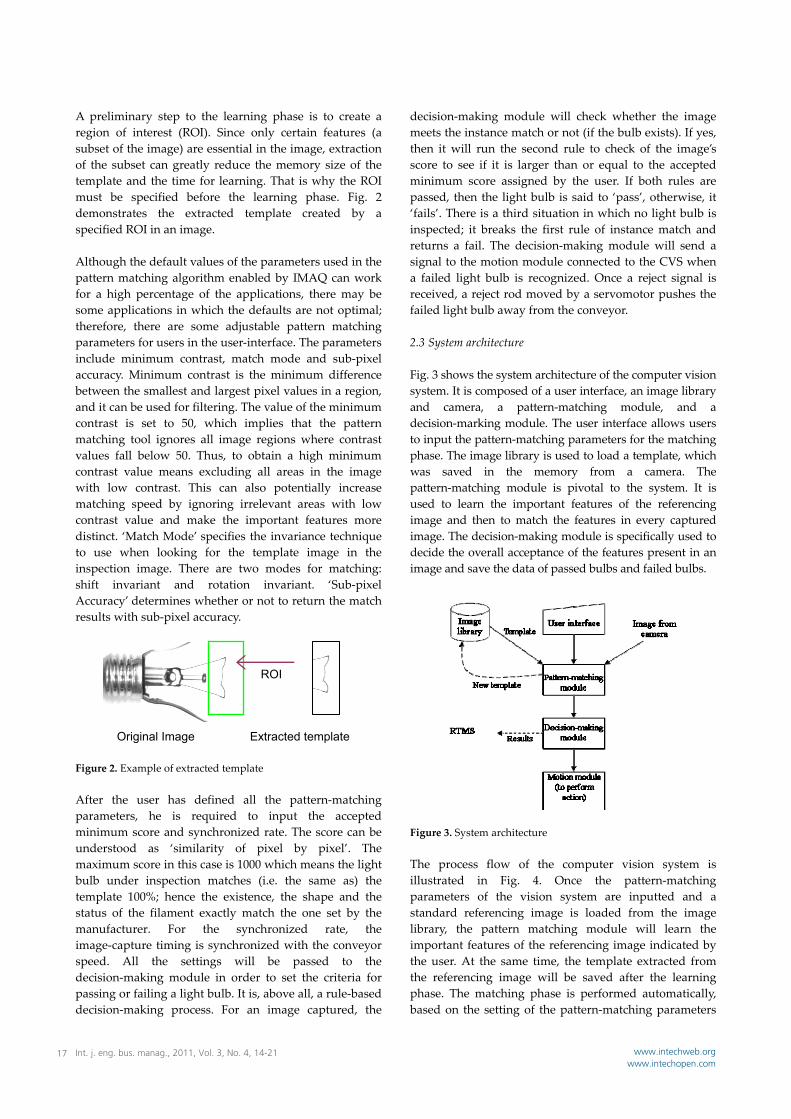
decision‐making module will check whether the image meets the instance match or not (if the bulb exists). If yes, then it will run the second rule to check of the image’s score to see if it is larger than or equal to the accepted minimum score assigned by the user. If both rules are passed, then the light bulb is said to ‘pass’, otherwise, it ‘fails’. There is a third situation in which no light bulb is inspected; it breaks the first rule of instance match and returns a fail. The decision‐making module will send a signal to the motion module connected to the CVS when a failed light bulb is recognized. Once a reject signal is received, a reject rod moved by a servomotor pushes the failed light bulb away from the conveyor. 2.3 System architecture Fig. 3 shows the system architecture of the computer vision system. It is composed of a user interface, an image library and camera, a pattern‐matching module, and a decision‐marking module. The user interface allows users to input the pattern‐matching parameters for the matching phase. The image library is used to load a template, which was saved in the memory from a camera. The pattern‐matching module is pivotal to the system. It is used to learn the important features of the referencing image and then to match the features in every captured image. The decision‐making module is specifically used to decide the overall acceptance of the features present in an image and save the data of passed bulbs and failed bulbs.
Figure 3. System architecture The process flow of the computer vision system is illustrated in Fig. 4. Once the pattern‐matching parameters of the vision system are inputted and a standard referencing image is loaded from the image library, the pattern matching module will learn the important features of the referencing image indicated by the user. At the same time, the template extracted from the referencing image will be saved after the learning phase. The matching phase is performed automatically, based on the setting of the pattern‐matching parameters
Original Image Extracted template
ROI
Int. j. eng. bus. manag., 2011, Vol. 3, No. 4, 14-2117 www.intechweb.orgwww.intechopen.com
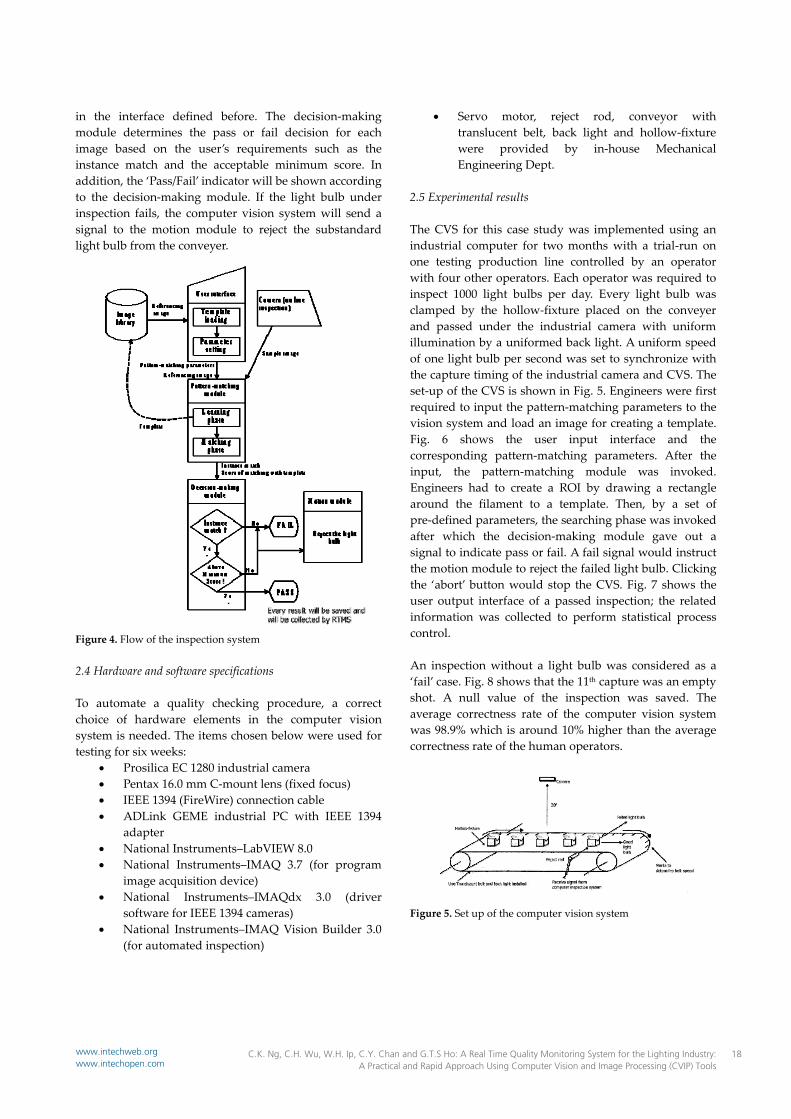
in the interface defined before. The decision‐making module determines the pass or fail decision for each image based on the user’s requirements such as the instance match and the acceptable minimum score. In addition, the ‘Pass/Fail’ indicator will be shown according to the decision‐making module. If the light bulb under inspection fails, the computer vision system will send a signal to the motion module to reject the substandard light bulb from the conveyer.
Figure 4. Flow of the inspection system 2.4 Hardware and software specifications To automate a quality checking procedure, a correct choice of hardware elements in the computer vision system is needed. The items chosen below were used for testing for six weeks:
Prosilica EC 1280 industrial camera Pentax 16.0 mm C‐mount lens (fixed focus) IEEE 1394 (FireWire) connection cable ADLink GEME industrial PC with IEEE 1394
adapter National Instruments–LabVIEW 8.0 National Instruments–IMAQ 3.7 (for program
image acquisition device) National Instruments–IMAQdx 3.0 (driver
software for IEEE 1394 cameras) National Instruments–IMAQ Vision Builder 3.0
(for automated inspection)
Servo motor, reject rod, conveyor with translucent belt, back light and hollow‐fixture were provided by in‐house Mechanical Engineering Dept.
2.5 Experimental results The CVS for this case study was implemented using an industrial computer for two months with a trial‐run on one testing production line controlled by an operator with four other operators. Each operator was required to inspect 1000 light bulbs per day. Every light bulb was clamped by the hollow‐fixture placed on the conveyer and passed under the industrial camera with uniform illumination by a uniformed back light. A uniform speed of one light bulb per second was set to synchronize with the capture timing of the industrial camera and CVS. The set‐up of the CVS is shown in Fig. 5. Engineers were first required to input the pattern‐matching parameters to the vision system and load an image for creating a template. Fig. 6 shows the user input interface and the corresponding pattern‐matching parameters. After the input, the pattern‐matching module was invoked. Engineers had to create a ROI by drawing a rectangle around the filament to a template. Then, by a set of pre‐defined parameters, the searching phase was invoked after which the decision‐making module gave out a signal to indicate pass or fail. A fail signal would instruct the motion module to reject the failed light bulb. Clicking the ‘abort’ button would stop the CVS. Fig. 7 shows the user output interface of a passed inspection; the related information was collected to perform statistical process control. An inspection without a light bulb was considered as a ‘fail’ case. Fig. 8 shows that the 11th capture was an empty shot. A null value of the inspection was saved. The average correctness rate of the computer vision system was 98.9% which is around 10% higher than the average correctness rate of the human operators.
Figure 5. Set up of the computer vision system
C.K. Ng, C.H. Wu, W.H. Ip, C.Y. Chan and G.T.S Ho: A Real Time Quality Monitoring System for the Lighting Industry: A Practical and Rapid Approach Using Computer Vision and Image Processing (CVIP) Tools
18www.intechweb.orgwww.intechopen.com
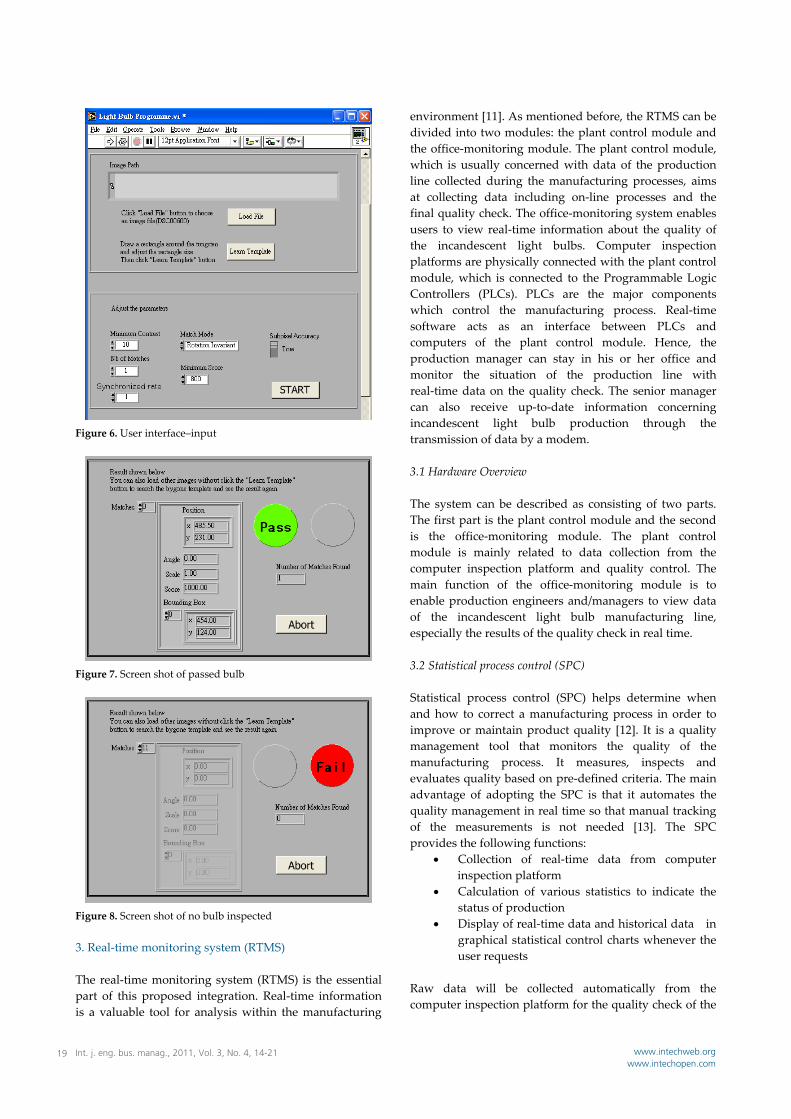
Figure 6. User interface–input
Figure 7. Screen shot of passed bulb
Figure 8. Screen shot of no bulb inspected 3. Real‐time monitoring system (RTMS) The real‐time monitoring system (RTMS) is the essential part of this proposed integration. Real‐time information is a valuable tool for analysis within the manufacturing
environment [11]. As mentioned before, the RTMS can be divided into two modules: the plant control module and the office‐monitoring module. The plant control module, which is usually concerned with data of the production line collected during the manufacturing processes, aims at collecting data including on‐line processes and the final quality check. The office‐monitoring system enables users to view real‐time information about the quality of the incandescent light bulbs. Computer inspection platforms are physically connected with the plant control module, which is connected to the Programmable Logic Controllers (PLCs). PLCs are the major components which control the manufacturing process. Real‐time software acts as an interface between PLCs and computers of the plant control module. Hence, the production manager can stay in his or her office and monitor the situation of the production line with real‐time data on the quality check. The senior manager can also receive up‐to‐date information concerning incandescent light bulb production through the transmission of data by a modem. 3.1 Hardware Overview The system can be described as consisting of two parts. The first part is the plant control module and the second is the office‐monitoring module. The plant control module is mainly related to data collection from the computer inspection platform and quality control. The main function of the office‐monitoring module is to enable production engineers and/managers to view data of the incandescent light bulb manufacturing line, especially the results of the quality check in real time. 3.2 Statistical process control (SPC) Statistical process control (SPC) helps determine when and how to correct a manufacturing process in order to improve or maintain product quality [12]. It is a quality management tool that monitors the quality of the manufacturing process. It measures, inspects and evaluates quality based on pre‐defined criteria. The main advantage of adopting the SPC is that it automates the quality management in real time so that manual tracking of the measurements is not needed [13]. The SPC provides the following functions:
Collection of real‐time data from computer inspection platform
Calculation of various statistics to indicate the status of production
Display of real‐time data and historical data in graphical statistical control charts whenever the user requests
Raw data will be collected automatically from the computer inspection platform for the quality check of the
Int. j. eng. bus. manag., 2011, Vol. 3, No. 4, 14-2119 www.intechweb.orgwww.intechopen.com

incandescent light bulbs. In order to perform the functions mentioned above, a number of computations of raw data will be required:
X‐bar chart using standard deviation calculation with labeling of points
R chart using range calculation with labeling of points
S chart using standard deviation calculation with labeling of points
CuSum chart using standard deviation calculation with labeling of points
Mean value of a group of data collected Standard deviation of a group of data collected Range of a group of data collected Population symmetry on each side of the mean
value of each group of data 4. The integrated system features The final visual check of the light bulb is carried out automatically by the CVS (replacing the original manual visual quality check stations). The evaluation of the performance of the CVS depends on how much time is spent. In total, there are two types of data which are measured under this system: the first one is the time spent on the inspection process per light bulb; the second one is the result of the quality check of every light bulb by the CVS. Similarly, a report of the life test of the light bulbs needs to be input into the server (host computer) once it is written. However, the content of the report is far more complicated than just the binary signal sent from the computer vision system. All the devices are connected by a parallel data bus to the server through a special buffer interface. The configuration of the system is shown in Fig. 9. The system is configured by the server (Pentium‐4 grade computer). After the raw data are received, it will process all the data and update all the graphs, which are accessed by all approved computers in the plant and in the office. Also, if the data are found to have failed while undergoing the SPC, an alarm can be set to go off as an audible signal or an instant e‐mail can be sent.
Figure 9. Configuration of the monitoring system
5. Discussion and conclusion This paper proposes an integrated system combining a computer vision system (CVS) and a real‐time monitoring system (RTMS) aimed at solving problems found in the existing quality control of light bulb production. As every workstation is monitored, immediate correction can be made. The scrap rate of the testing production line was lowered, as shown in Fig. 10, during a six‐week testing period. The system demonstrates the feasibility of automated inspection of light bulbs. It showed how data can be collected to perform statistical process control (SPC) and real‐time monitoring (RTM) with data collected from other workstations. The effectiveness of the whole system depends on the accuracy and speed of the computer vision system and other workstations. The accuracy also depends on the parameters set by the engineers.
Scrap Rate of Testing Production Line
14.00%
15.00%
16.00%
17.00%
1 2 3 4 5 6Week
Scar
p R
ate
Figure 10. The scrap rate of the testing production line for six weeks It is difficult to choose CVIP tools which are efficient in programming a specific application, but also provide a fast, flexible and efficient way to perform the modification required by the change of the object. As manufacturing engineers are generally not familiar with Visual Basic, C and C++ languages are commonly used for programming control or measurement applications. LabVIEW and a graphical programming platform would therefore be a good choice. Such a platform can provide a graphical user interface (GUI) that would let the engineers interact with the quality checking procedures as they would have done using traditional methods. The target of this integrative approach is to enhance the efficiency and the mind‐set as well as the motivation of the workers in the production line by reducing tedious manual operations. The system can also act as a driving force in inculcating the essence of the company culture. It gets everybody in the company involved in the adoption of “high‐tech” manufacturing technology, hence ensuring product quality and increasing productivity. By following the direction of the manufacturing strategy in China mentioned by Costa [4] this integrated approach takes management and technology to the level of manufacturing in a global competitive environment.
C.K. Ng, C.H. Wu, W.H. Ip, C.Y. Chan and G.T.S Ho: A Real Time Quality Monitoring System for the Lighting Industry: A Practical and Rapid Approach Using Computer Vision and Image Processing (CVIP) Tools
20www.intechweb.orgwww.intechopen.com
6. Acknowledgments The authors wish to thank Research Committee and Learning & Teaching Committee (Project no. 2005‐08/LTG/SS2/ISE3) of The Hong Kong Polytechnic University for their support. 7. References [1] EEP European Environmental Press, Philips to
replace usual incandescent lamp, Germany: Umwelt Magazine, Jan 2007.
[2] Pandit, R.B., Tang, J., Liu, F. & Pitts, M., Development of A Novel Approach to Determine Heating Pattern Using Computer Vision And Chemical Marker (M‐2) Yield, Journal of Food Engg. 78, 522‐528, 2005.
[3] Li, J., A Vision Control System of HID Lamp Finishing Process, Proceedings of the American Control Conference, Arlington, AACC: pp. 4638‐4643, 2001.
[4] Costa, P.R., Pereira, M.A.G., Furquim, T.A.C., Nersissian, D.Y., Lammoglia, P., Yamamoto, R.J., Neto, E.R., Camargo, R., Silva, B.M.d., Herdade, S.B., Rossi, C., Schwartz, R. & Belfe, A., Development of A Real‐time Management System for Quality Assurance Programmes in Imaging Diagnostic Departments, Proceedings of the 22nd Annual EMBS International Conference, Chicago IL.: IEEE, pp. 2522‐2525, 2000.
[5] Lin, C.W. & Chan, C.F., Feasibility Study of Automatic Assembly and Inspection of Light Bulb Filaments, Proceedings of the IEEE 63(10), pp. 1437‐1445, 1975.
[6] McLeod, A., Dahle, O. & Dale, S., Automatic Visual Inspection of Lightbulbs, Conference Proceedmgs of Vision 89, Chicago IL.: SME, pp.1‐25, 1987.
[7] Mulliner, J., PC‐Based Software for Pattern, Color, And Color Pattern Matching, NASA Tech Briefs, NI0603, 2003.
[8] Zuech, N., Understanding and applying machine vision, New York, U.S.A.: Marcel Dekker, Inc, pp.205‐210, 2000.
[9] Kodosky, J. & Dye, R., Programming with Pictures, Comp. Language, Jan. issue, 61‐69, 1989.
[10] Poindessault, J.P., Beauquin, C. & Gaillard, F., Stimulation, data acquisition, spikes detection and time/rate analysis with a graphical programming system: an application to vision studies, Journal of neuroscience methods 59(2), 225‐235, 1995.
[11] Levi, S.T., Real‐time System Design, New York, U.S.A.: McGraw‐Hill, Inc., pp. 200‐210, 1990.
[12] Strizhkov, S. A., Statistical Process Control in IC Manufacture, Russian Microelectronics 31(1), 21‐26, 2004.
[13] Tseng, H.C., Ip W.H. & Ng K.C., A Model for An Integrated Manufacturing System Implementation in China: A Case Study, J. Eng. Technol. Mange. 16, 83‐101, 1999.
Int. j. eng. bus. manag., 2011, Vol. 3, No. 4, 14-2121 www.intechweb.orgwww.intechopen.com