A RAPID ASSESSMENT TOOL TO ASSESS FACTORY SUSTAINABILITY
140
University of Rhode Island University of Rhode Island DigitalCommons@URI DigitalCommons@URI Open Access Master's Theses 2013 A RAPID ASSESSMENT TOOL TO ASSESS FACTORY A RAPID ASSESSMENT TOOL TO ASSESS FACTORY SUSTAINABILITY SUSTAINABILITY Nadine Madanchi University of Rhode Island, [email protected] Follow this and additional works at: https://digitalcommons.uri.edu/theses Recommended Citation Recommended Citation Madanchi, Nadine, "A RAPID ASSESSMENT TOOL TO ASSESS FACTORY SUSTAINABILITY" (2013). Open Access Master's Theses. Paper 133. https://digitalcommons.uri.edu/theses/133 This Thesis is brought to you for free and open access by DigitalCommons@URI. It has been accepted for inclusion in Open Access Master's Theses by an authorized administrator of DigitalCommons@URI. For more information, please contact [email protected].
Transcript of A RAPID ASSESSMENT TOOL TO ASSESS FACTORY SUSTAINABILITY

University of Rhode Island University of Rhode Island
DigitalCommons@URI DigitalCommons@URI
Open Access Master's Theses
2013
A RAPID ASSESSMENT TOOL TO ASSESS FACTORY A RAPID ASSESSMENT TOOL TO ASSESS FACTORY
SUSTAINABILITY SUSTAINABILITY
Nadine Madanchi University of Rhode Island, [email protected]
Follow this and additional works at: https://digitalcommons.uri.edu/theses
Recommended Citation Recommended Citation Madanchi, Nadine, "A RAPID ASSESSMENT TOOL TO ASSESS FACTORY SUSTAINABILITY" (2013). Open Access Master's Theses. Paper 133. https://digitalcommons.uri.edu/theses/133
This Thesis is brought to you for free and open access by DigitalCommons@URI. It has been accepted for inclusion in Open Access Master's Theses by an authorized administrator of DigitalCommons@URI. For more information, please contact [email protected].

A RAPID ASSESSMENT TOOL TO ASSESS FACTORY
SUSTAINABILITY
BY
NADINE MADANCHI
A THESIS SUBMITTED IN PARTIAL FULFILLMENT OF THE
REQUIREMENTS FOR THE DEGREE OF
MASTER OF SCIENCE
IN
SYSTEMS ENGINEERING
UNIVERSITY OF RHODE ISLAND
2013

MASTER OF SCIENCE THESIS
OF
NADINE MADANCHI
APPROVED:
Thesis Committee:
Major Professor : Manbir Sodhi Constantine Anagnostopoulos
Peter Swaszek Nasser H. Zawia
UNIVERSITY OF RHODE ISLAND
2013

ABSTRACT
Over the last decades, there has been an increased interest in sustainability and
it has become an important issue in production and manufacturing research. To use
the traditional definition provided by the Brundtland Commission, sustainable
development is “development that meets the needs of the present without
compromising the ability of future generations to meet their own needs” (Brundtland
p.43). This concept of sustainability might be understood intuitively, but to express and
assess specific goals poses an important challenge. As a result sustainability
assessment is becoming a rapidly developing area with a growing number of
frameworks and tools. However, most of the sustainability assessment tools focus on
a national, regional or community level. At this point, the company level has not been
considered sufficiently and those tools that are actually used within industry focus
mainly on a product level within the organization (Labuschagne et al. 2005).
Furthermore, the existing tools require a lot of effort and insight data in order to be
completed.
This study presents a tool that overcomes this issues and aims to fill the gap of a
missing factory assessment tool. Based on existing integrated sustainability
assessment tools a set of indicators is compiled and integrated into a framework that
calculates an overall composite index. The developed tool distinguishes itself from
other tools, because it is constructed as a user-friendly software that allows the
assessment of a factory’s overall sustainability with a minimal time effort. It can be used
from an external as well as from an internal perspective and considers the differences
between industries. Furthermore, it provides the possibility to compare different
alternatives and to assess a factory’s development over time.

iii
ACKNOWLEDGMENTS
It has been a wonderful and unforgettable experience spending the exchange year
on completing my Master’s thesis in the Department of Industrial and Systems
Engineering, University of Rhode Island.
First of all, I would like to thank Dr. Manbir Sodhi for his continuous guidance,
encouragement and support in professional as well as personal situations. It has been
a real pleasure to work with him.
I would also like to thank Sebastian Thiede who supported me on the German side
at the Technical University of Braunschweig for the continuous support independent on
large distance.
Thank you to the committee members Dr. Swaszek and Dr. Anagnostopoulos for
reviewing and evaluating my thesis.
Finally, I wish to thank my parents Annegret Madanchi and Habib Madanchi.
Without their enduring love, care and support in any situations of my life I could not
have gone this path and reached the point where I am today.

iv
TABLE OF CONTENTS
ABSTRACT ................................................................................................................ ii
ACKNOWLEDGMENTS ............................................................................................ iii
TABLE OF CONTENTS ............................................................................................. iv
LIST OF TABLES ..................................................................................................... vii
LIST OF FIGURES .................................................................................................. viii
LIST OF ABBREVIATIONS ........................................................................................ xi
LIST OF SYMBOLS .................................................................................................. xii
CHAPTER 1 – INTRODUCTION ................................................................................. 1
1.1 Background and Motivation ......................................................................... 1
1.2 Objectives and Procedure ........................................................................... 2
CHAPTER 2 - SUSTAINABILITY ASSESSMENT ....................................................... 4
2.1 Basics of Sustainability ............................................................................... 4
2.1.1 Background of Sustainability ........................................................... 4
2.1.2 Sustainability and Sustainable Development ................................... 6
2.1.3 Sustainable Manufacturing .............................................................. 8
2.2 Categorization of Sustainability Assessment Tools and Indicators .............. 8
2.2.1 Review of Current Non-Integrated Indicators ................................. 10
2.2.2 Review of Current Integrated Tools ................................................ 12
CHAPTER 3 - FACTORIES AND INDUSTRIAL SECTORS ...................................... 22
3.1 Basics of Factories .................................................................................... 22
3.2 Impact of Factories on their Environment .................................................. 24
3.3 Classification of Industrial Sectors ............................................................ 27
3.4 Needs of an Individual Tool at Factory-Level ............................................ 29
CHAPTER 4 – DEVELOPMENT OF A FRAMEWORK ............................................. 30
4.1 Purpose of the Tool ................................................................................... 31
4.2 Criteria of Sustainability Performance Indicators ....................................... 32
v
4.3 Identifying and Grouping of Sustainability Performance Indicators ............ 34
4.3.1 Themes for Environmental Sustainability ....................................... 35
4.3.2 Themes for Social Sustainability .................................................... 36
4.3.3 Themes for Economic Sustainability .............................................. 37
4.3.4 Sustainability Performance Indicators ............................................ 40
4.4 Judging of Sustainability Performance Indicators ...................................... 56
4.5 Normalizing of Sustainability Performance Indicators ................................ 57
4.5.1 Normalization Methods .................................................................. 57
4.5.2 Evaluation of Normalizing Method for Factory Sustainability .......... 59
4.5.3 Implementation within the Framework ........................................... 59
4.6 Weighting of Sustainability Performance Indicators ................................... 60
4.6.1 Weighting Methods ........................................................................ 61
4.6.2 Evaluation of Weighting Method for Factory Sustainability ............. 66
4.6.3 Implementation within the Framework ........................................... 68
4.7 Calculating the Sub-Indices ...................................................................... 71
4.8 Combining the Sub-Indices into the Composite Index ............................... 72
4.9 Final Framework of the Factory Sustainability Assessment Tool ............... 73
CHAPTER 5 – IMPLEMENTATION OF THE TOOL .................................................. 75
5.1 Characteristics of Visual Basic for Application ........................................... 75
5.2 Implementation of the Tool ........................................................................ 76
5.2.1 Implementation of the Data Input ................................................... 78
5.2.2 Implementation of the Data Processing ......................................... 80
CHAPTER 6 - CASE STUDY: AUTOMOTIVE INDUSTRY ........................................ 86
6.1 Comparison of different Factories ............................................................. 86
6.2 Assessment of a Factory over Time .......................................................... 91
6.3 Results of the Case Study ......................................................................... 96
CHAPTER 7 - VERIFICATION OF THE USABILITY ................................................. 98
7.1 Developing a Usability Questionnaire ........................................................ 98
7.1.1 Usability and ISO Norm 9241 ........................................................ 98

vi
7.1.2 Structure and Layout of the Questionnaire .................................... 99
7.2 Testing the Factory Assessment Tool ..................................................... 100
7.3 Outcome of the Test ............................................................................... 101
CHAPTER 8 - SUMMARY AND CONCLUSIONS ................................................... 103
CHAPTER 9 – RECOMMENDATIONS FOR FUTURE RESEARCH ....................... 107
9.1 Usability of the Tool ................................................................................ 107
9.2 Assessment Framework of the Tool ........................................................ 107
APPENDICES ......................................................................................................... 109
BIBLIOGRAPHY ..................................................................................................... 118

vii
LIST OF TABLES
Table 4.1: Overview of existing frameworks and derivation of a new framework ...39
Table 4.2: Key performance indicators of factory sustainability .............................41
Table 4.3: Identifying weighting factors for material use (Kölsch 2011) ..................44
Table 4.4: Identifying weighting factors for emissions (Kölsch 2011) .....................47
Table 4.5: Judging of key performance indicators .................................................56
Table 4.6: Evaluation of weighting methods ..........................................................67
Table 4.7: Pair-wise comparison matrix for evaluation of estimated weights of
environmental indicators .......................................................................69
Table 4.8: Normalized values of environmental indicators .....................................70
Table 6.1: Sub-indices and overall index for the comparison of the production sites
Dingolfing and Sindelfingen ..................................................................90
Table 6.2: Sub-indices and overall index for the comparison of BMW from 2012 to
2010 .....................................................................................................95

viii
LIST OF FIGURES
Figure 1.1: Overall procedure of the study ............................................................... 3
Figure 2.1: Timeline of Sustainability ....................................................................... 5
Figure 2.2: Three dimensions of sustainability ......................................................... 7
Figure 2.3: Categorization of assessment tools ......................................................10
Figure 2.4: Hierarchical structure of sustainability assessment tools ......................12
Figure 2.5: Hierarchical structure of the OECD-CEI ...............................................13
Figure 2.6: Hierarchical structure of the UN-CSD ...................................................14
Figure 2.7: Hierarchical structure of the EICC code ................................................15
Figure 2.8: Hierarchical structure of the GRI ..........................................................16
Figure 2.9: Hierarchical structure of the DJSI .........................................................17
Figure 2.10: Hierarchical structure of the BASF Seebalance ....................................19
Figure 2.11: Hierarchical structure of the Ford PSI ...................................................20
Figure 2.12: Hierarchical structure of the Wal-Mart Scorecard..................................21
Figure 3.1: Structuring levels and views of a factory based on (Wiendahl et al.
2007) ....................................................................................................23
Figure 3.2: Factories within the product life cycle based on (Wiendahl et al. 2007) 24
Figure 3.3: Global Industrial Energy Use, 1971 – 2004 (OECD Sustainable
Development Studies) ..........................................................................25

ix
Figure 3.4: Industrial Direct CO2 Emissions by Sector, 2004 (OECD Sustainable
Development Studies) ..........................................................................26
Figure 3.5: Classification of industrial sectors .........................................................28
Figure 4.1: Methodology for developing a framework to assess factory
sustainability .........................................................................................31
Figure 4.2: Structure of the Factory Sustainability Framework ................................35
Figure 4.3: AHP model for a composite performance index ....................................68
Figure 4.4: Scheme of the final framework .............................................................73
Figure 5.1: Start page of the tool ............................................................................77
Figure 5.2: VBA structure of the tool .......................................................................77
Figure 5.3: General factory information input mask ................................................78
Figure 5.4: VBA code to store information in database ...........................................79
Figure 5.5: Environmental dimension input mask ...................................................80
Figure 5.6: VBA code to combine two variables ......................................................81
Figure 5.7: VBA code to search for two variables ...................................................82
Figure 5.8: Presentation of assessment results ......................................................83
Figure 5.9: Presentation of assessment results by indicators .................................84
Figure 5.10: Presentation of assessment results by dimensions ..............................85
Figure 6.1: Presentation of assessment results for BMW Dingolfing .......................87
Figure 6.2: Presentation of assessment results for Daimler Sindelfingen ...............87

x
Figure 6.3: Presentation of assessment results by environmental indicators ..........88
Figure 6.4: Presentation of assessment results by social indicators .......................88
Figure 6.5: Presentation of assessment results by economic indicators .................89
Figure 6.6: Presentation of assessment results by social indicators .......................90
Figure 6.7: Presentation of assessment results for BMW 2012 ..............................92
Figure 6.8: Presentation of assessment results for BMW 2011 ...............................92
Figure 6.9: Presentation of assessment results for BMW 2010 ..............................93
Figure 6.10: Presentation of assessment results by environmental indicators for BMW
from 2010 to 2012 ................................................................................93
Figure 6.11: Presentation of assessment results by social indicators for BMW from
2010 to 2012 ........................................................................................94
Figure 6.12: Presentation of assessment results by economic indicators for BMW from
2010 to 2012 ........................................................................................94
Figure 6.13: Presentation of assessment results by dimensions for BMW from 2010 to
2012 .....................................................................................................96
Figure 7.1: Layout of the usability questionnaire ................................................... 100
Figure 7.2: Presentation of testing results ............................................................ 101

xi
LIST OF ABBREVIATIONS
AHP Analytic Hierarchy Process
AP Acidification potential
BAP Budget Allocation Process
BOD Benefit-of-the-doubt
CEI Core Environmental Indicators
CSD Commission on Sustainable Development
DEA Data Envelopment Analysis
DJSI Dow Jones Sustainability Index
EF Ecological Footprint
EICC Electronic Industry Code of Conduct
EW Equal Weighting
FPSI Ford Product Sustainability Index
GRI Global Reporting Initiative
GWP Global warming potential
HDI Human Development Index
ISO International Organization for Standardization
LCC Life-Cycle Costing
OECD Organization for Economic Cooperation and Development
UN United Nations
UNCED United Nations Conference on Environment and Development
VBA Visual Basic for Applications

xii
LIST OF SYMBOLS
Av,t Quantity of air emissions for period t-CO2
CEt Capital employed for period million-$
CI Composite index
CR Consistency ratio
E Number of employees
EHSt Amount of expenditures on Environment, million-$
Health, and Safety compliance for period
Et Energy consumption for period MWh
F Number of women
fu Weighting factor of resource
fv Equivalent factor of emission
FWt Quantity of freshwater for period m3
HWt Amount of hazardous waste for period Kg
IDt Amount of expenditures on staff development for period million-$
I Indicator
𝐼𝑁,𝑖,𝑗− Normalized indicator with negative influence sustainability
𝐼𝑁,𝑖,𝑗+ Normalized indicator with positive influence sustainability
𝐼𝑖,𝑗− Indicator with negative influence sustainability
𝐼𝑖,𝑗+ Indicator with positive influence sustainability
IPt Amount of expenditures on R&D for period million-$
Is,j Sustainability sub-index

xiii
J Dimension
MA Number of managers
Mu,t Quantity of resources used for period Kg
RI Random matrix consistency index
SDt,e Quantity of sick days for period
SEt,s Number of participants in safety trainings for period
T Time
TEt Quantity of expenses for period
THt Quantity of training hours for period
TRt Quantity of revenues for period
WAt Number of workplace related accidents for period
Wj Weight factor per indicator
WL Wages of lowest wage group $
Wt Amount of waste for period Kg
yj Output of a factory

1
CHAPTER 1 – INTRODUCTION
This thesis will develop an integrated assessment tool to measure the
sustainability of factory related operations. Therefore, the first section of this chapter
presents the background of sustainability in manufacturing and the motivation of the
thesis. The second part of this chapter describes the objectives of the study and the
procedure by which they can be achieved in more detail.
1.1 Background and Motivation
For the last two centuries, industry and economy has evolved on the premise that
the earth is an unlimited ‘store of resources’ and a stable ecosystem (Graedel, Allenby
2010). However, as the population exceeds seven billion and the standards of living
improve enormously, the interest and awareness towards the limited natural resources
increases as well. The goal is to use the resources consciously in order to satisfy
human demand (Davidson et al. 2010). One approach to this challenge can be found
in the key concept of sustainability. By regarding the three dimensions: social,
environment and economy, it aims for our society to meet present as well as future
needs worldwide. Obviously, manufacturing is a major factor in this approach towards
a more sustainable society (Despeisse et al. 2012).
Against this background many manufacturing companies have already started to
reconsider the idea of being “green” and how to deal with sustainability. However, this
change of attitude was of course supported by even more factors. Local environmental
regulations have a significant global impact, especially if they are supported by political
decisions. Therefore many global manufacturers feared to be locked out of the market,
if they do not change their policies towards the concept of sustainability (Srinivasan
2011). Furthermore, investors are also interested in the sustainability performance of

2
companies and some of them integrated it into their portfolio decisions. They are one
of the target groups that use indexes and tools to evaluate companies. This trend
towards socially responsible investing is another important factor that forced
companies to adapt their strategy (DJSI 2013).
Although rethinking has begun, it is important not to limit the scope of sustainability
to the product itself, but to consider the production process as well. There has been a
lot of work on researching sustainability on different levels, but sustainability
assessment at factory level is still lagging behind (Labuschagne et al. 2005).
1.2 Objectives and Procedure
Against this background the larger goal of the thesis is to focus on sustainability at
factory level and to describe the relationship between factories and sustainability
dimensions in a basic concept and to develop an integrated assessment tool based on
that relationship. In order to achieve this goal, several sub-goals will be pursued during
the study. These objectives are summarized below:
Giving an insight into the history and development of sustainability.
Reviewing the current state of sustainability assessment tools and
categorizing them.
Examining the impact of factories on their environment and classifying
industrial sectors.
Developing a framework to assess the sustainability performance of factories
and to calculate an overall composite index.
Implementing the model into a computer-based tool by using Visual Basics for
Applications.

3
Testing the tool by applying an exemplary case study and developing a
usability questionnaire.
The procedure which will be performed in this study in order to achieve the set
goals is illustrated in the following figure.
Phase Research Flow Output
hierarchy
Data Processing Implementation
Usability Questionnaire
Index Model Development
Hierarchy Development
Classification of Industrial Sectors
Analysis of Factories and their Impact
Introduction
Background on Sustainability
Review on Existing Tools
Phase I Sustainability Assessment
(Chapter 2)
Phase II Factory Analysis
(Chapter 3)
Phase 0
(Chapter 1)
Phase III Framework Development
(Chapter 4)
Phase IV Tool Implementing
(Chapter 5)
Data Entry Implementation
Exemplary Case Study Phase V Tool Validation
(Chapter 6&7)
Categorization of Tools
Needs for a new Tool
Reduced Set of Sectors
Tool Framework
Computer-based Tool
Optimization Potentials
Figure 1.1: Overall procedure of the study

4
CHAPTER 2 - SUSTAINABILITY ASSESSMENT
In order to develop a new sustainability assessment tool, it is necessary to begin
with understanding the background and concept of sustainability and to analyze the
state of the art in this field. Therefore, the first section of this chapter will present the
basic ideas behind sustainability and its development. In the second section, a
comprehensive literature review will categorize existing sustainability frameworks and
will identify their characteristics and field of application.
2.1 Basics of Sustainability
Becoming “sustainable” has become central to many aspects of everyday life. Not
only does this relate to environmental decisions, but many products, services,
production systems and developments now claim to be sustainable. However, in most
cases when the term sustainability is used, the definition and the meaning of it are not
clear. Sustainability has become a buzzword in the media, and is widely used in a
diverse range of contexts with disparate meanings.
2.1.1 Background of Sustainability
Sustainability is derived from two Latin words, sus which means up and tenere,
which means to hold (Theis, Tomkin 2012). After all, the term sustainability is
comparatively modern and was hardly used until the 1980s. The timeline in Figure 2.1
illustrates the development.
5
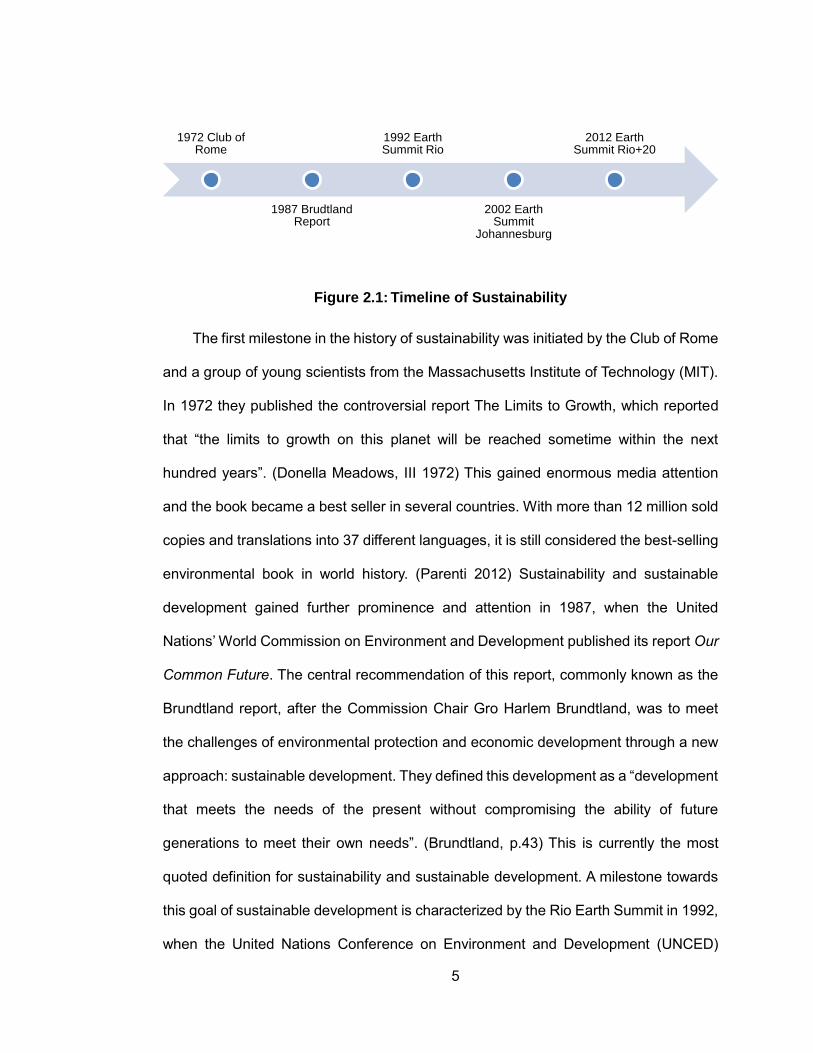
Figure 2.1: Timeline of Sustainability
The first milestone in the history of sustainability was initiated by the Club of Rome
and a group of young scientists from the Massachusetts Institute of Technology (MIT).
In 1972 they published the controversial report The Limits to Growth, which reported
that “the limits to growth on this planet will be reached sometime within the next
hundred years”. (Donella Meadows, III 1972) This gained enormous media attention
and the book became a best seller in several countries. With more than 12 million sold
copies and translations into 37 different languages, it is still considered the best-selling
environmental book in world history. (Parenti 2012) Sustainability and sustainable
development gained further prominence and attention in 1987, when the United
Nations’ World Commission on Environment and Development published its report Our
Common Future. The central recommendation of this report, commonly known as the
Brundtland report, after the Commission Chair Gro Harlem Brundtland, was to meet
the challenges of environmental protection and economic development through a new
approach: sustainable development. They defined this development as a “development
that meets the needs of the present without compromising the ability of future
generations to meet their own needs”. (Brundtland, p.43) This is currently the most
quoted definition for sustainability and sustainable development. A milestone towards
this goal of sustainable development is characterized by the Rio Earth Summit in 1992,
when the United Nations Conference on Environment and Development (UNCED)
1972 Club of Rome
1987 Brudtland Report
1992 Earth Summit Rio
2002 Earth Summit
Johannesburg
2012 Earth Summit Rio+20

6
agreed on climate change, biodiversity and Agenda 21. In order to supervise and
ensure the achievement of these agreements, the Commission on Sustainable
Development (CSD) was established. They developed a set of indicators that enabled
them to measure sustainable development and provided a basis for decision-making.
The CSD meets annually, while the UNCED meets every ten years. Accordingly, the
second Earth Summit took place in 2002 in Johannesburg. It focused more on social
than on environmental issues. The success of the conference was rather limited,
because no important agreements were reached. The last Earth Summit took place in
2012, again in Rio de Janeiro. The outcome document of the conference The Future
We Want states all Sustainable Development Goals that the members decided on.
(United Nations 2013)
Apart from the CSD, other organizations such as the Global Reporting Initiative
(GRI) were founded over the past two decades and they have developed other
indicators and matrices to assess sustainability on different levels (more in the following
section of the chapter).
2.1.2 Sustainability and Sustainable Development
Acoording to the Brundtland definition of sustainable development, sustainability
is a state that will be achieved through sustainable development. Therefore, the
literature supports the thesis that both terms can be described and measured as the
same and even Agenda 21 uses them interchangeably. (Dresner 2002, p.65) However,
this is also the reason why other authors criticize the Brundtland definition. Tim
O’Riordan expressed his concerns about the meaninglessness of the term 1988 in his
essay The Politics of Sustainability. He complains that the formulation is too vague and
it allows people to claim everything as being part of the sustainable development

7
(O'Riordan 1988). Nevertheless, keeping with the common practice, both terms will be
used interchangeably in this study.
Besides the definition of sustainable development the Brundtland report contains
also two key concepts: “the concept of 'needs', in particular the essential needs of the
world's poor, to which overriding priority should be given; and the idea of limitations
imposed by the state of technology and social organization on the environment's ability
to meet present and future needs.” (Brundtland, p.43) Thus, the report implies that
sustainability has three dimensions that it seeks to integrate: economic, environmental
and social. Today the common understanding in literature illustrates the three
dimensions as overlapping circles as represented in Figure 2.2.
Figure 2.2: Three dimensions of sustainability
This illustration implies that there is an interaction between the different
dimensions of sustainability, and progress can be achieved only by considering them
simultaneously (Seliger 2007).
Social Sustainability
Environmental Sustainability
Economic
Sustainability

8
2.1.3 Sustainable Manufacturing
Sustainable manufacturing can be considered to be a part of the larger concept,
sustainable development. Although it focuses only on one specific aspect, it is still
based on the same problems and aims for the same goals.
The most quoted definition is given by the U.S. Department of Commerce. They
define sustainable manufacturing as “the creation of manufactured products that use
processes that minimize negative environmental impacts, conserve energy and natural
resources, are safe for employees, communities, and consumers and are economically
sound” (U.S Department of Commerce 2007). This definition demonstrates again the
need to consider all three dimensions – economic, social and environmental.
Furthermore it also states that sustainable manufacturing includes both the
manufacturing of sustainable products as well as the sustainable manufacturing of all
products (NACFAM 2009). Therefore, it has to take the entire life-cycle with the stages
pre-manufacturing, manufacturing, use and post-use into consideration.
However, with regard to the goal of this study, sustainable manufacturing will be
limited to the stage “manufacturing” within the life-cycle and it will focus only on the
second part of the statement: sustainable manufacturing of all products.
2.2 Categorization of Sustainability Assessment Tools and Indicators
As mentioned in the previous section, there have been different organizations over
the last years that have developed tools and defined frameworks to assess
sustainability. The CSD and GRI referred to above are named as two examples. In the
literature several authors categorized these tools and frameworks based on numerous
factors and dimensions. For example Ness et al. conducted an overview of tools by

9
considering the focus of the tool (i.e. product level or policy), the temporal
characteristics and the degree to which it integrates environmental, social and/or
economic aspects (Ness et al. 2007). Feng et al. on the other hand categorized
sustainable assessment tools into a hierarchy of global, country, sector, corporation,
process, and product levels (Shaw C. Feng et al. 2010). Moreover, Labuschagne et al.
conducted an overview of tools that include a set of indicators, integrate all three
dimensions of sustainability, have a wide focus and are independent (Labuschagne et
al. 2005). This study categorizes tools by considering the following three factors:
Integration of all three dimensions of sustainability, i.e. if the tool considers
environmental, social and economic aspects.
The hierarchy/focus, i.e. if the focus is at the global, country, sector,
corporation or product level.
Developed by a company or by an organization
The developed categorization and overview of sustainability assessment tools is
illustrated in Figure 2.3. It consists of two main branches; the non-integrated and the
integrated indicators. The non-integrated indicators include indicators that do not
consider all three dimensions of sustainability simultaneously. Therefore, they are
further broken down into development, economy based and eco-system based indices.
The second branch on the other hand covers all integrated tools and divides them first
into macro and micro tools and subsequently into a hierarchy of global, country, sector,
corporate and product level. While the macro tools are developed by superordinate
organizations, the micro tools are developed by a company. This separation is based
on the main issue of macro frameworks and tools. Their focus is mainly “on the external
reporting for stakeholders, rather than on internal information need to decision-making
and re-design or optimization for actual eco-innovation.” (Shaw C. Feng 2009, p.2).

10
The tools developed by a company (micro tools) on the other hand give the
manufacturers the possibility to evaluate and track their sustainability performance
within the environment they are in. But the issue with those tools can be seen in the
fact that they are designed mainly for the specific environment of a company or supply
chain. Therefore it is important to include both in the overview.
Figure 2.3: Categorization of assessment tools
2.2.1 Review of Current Non-Integrated Indicators
Non-integrated indicators include all indices that do not consider the three
traditional dimensions simultaneously. Therefore, they are divided into three different
levels (see Figure 2.3). The development indices focus mainly on the social dimension,
Sustainability Assessment
Non integrated
indicators
Integrated
indicators/metrices
Development
indices
Economy
based indices
Eco-System-
based indices
Micro toolsMacro tools
Inter-
Company
Intra-
Company
Global
level
Country
level
Sector
level
Corporate
level
Product
level
Corporate
level
Product
level
Human Development
Index (HDI)
Life Cycle Costing
(LCC)
Ecological Footprint
Core Environmental
Indicators (CEI)
Indicators of Sustainable
Development (ISD)
EICC’s environmental
sustainability tools
Global Report Initiative (GRI)
Dow Jones S. Index (DJSI)
Sustainable Manufacturing
Indicator Repository (SMIR)
Philips Supplier Audit
BASF Seebalance
Ford Product
Sustainability Index
Inter-
Company
Intra-
Company
Walmart Scorecards

11
while the economy based indices focus on the economy and the eco-system based
indices on the environmental dimension. In the following the most quoted indicator at
each level will be described briefly.
Development Indices
The best known indicator at this level is the Human Development Index (HDI)
developed by the United Nations. This indicator consists of three main components.
The education component measures the mean years of schooling against the expected
years of schooling. The health component on the other hand is measured based on the
life expectancy at birth and a third component measures the gross national income per
capita to express the living standard. Additionally, all components are evaluated based
on a minimum and a maximum value and then normalized. (UNDP 2013)
Economy based Indices
At this level, Life-Cycle Costing (LCC) is one of the most important methods. It is
an economic approach to get the total cost of goods by examining all the parts of the
cost over its lifetime. This includes costs for research and development, production,
maintenance and disposal. Thereby, Life-Cycle Costing is not associated with
environmental costs, but with costs in general. Overall, it is an important tool to support
decision making. (Gluch, Baumann 2004)
Eco-System based Indices
At the eco-system based level, the Ecological Footprint (EF) is one of the most
quoted indicators. The Ecological Footprint developed by Wackernagel and Rees
(Wackernagel, Rees 1996) is defined as the quantitative land area on earth that is
required to sustain the given living standard until infinity. This includes also areas, which
are needed to produce food and clothes or to supply energy. Moreover, it takes also
12
the waste assimilation requirements in terms of a corresponding land area into account.
Finally, the result is expressed per hectare per person and year. In other words, “EF
analysis is an accounting tool that enables us to estimate the resource consumption
and waste assimilation requirements of a defined human population or economy in
terms of a corresponding productive land area” (Wackernagel, Rees 1996, p.9).
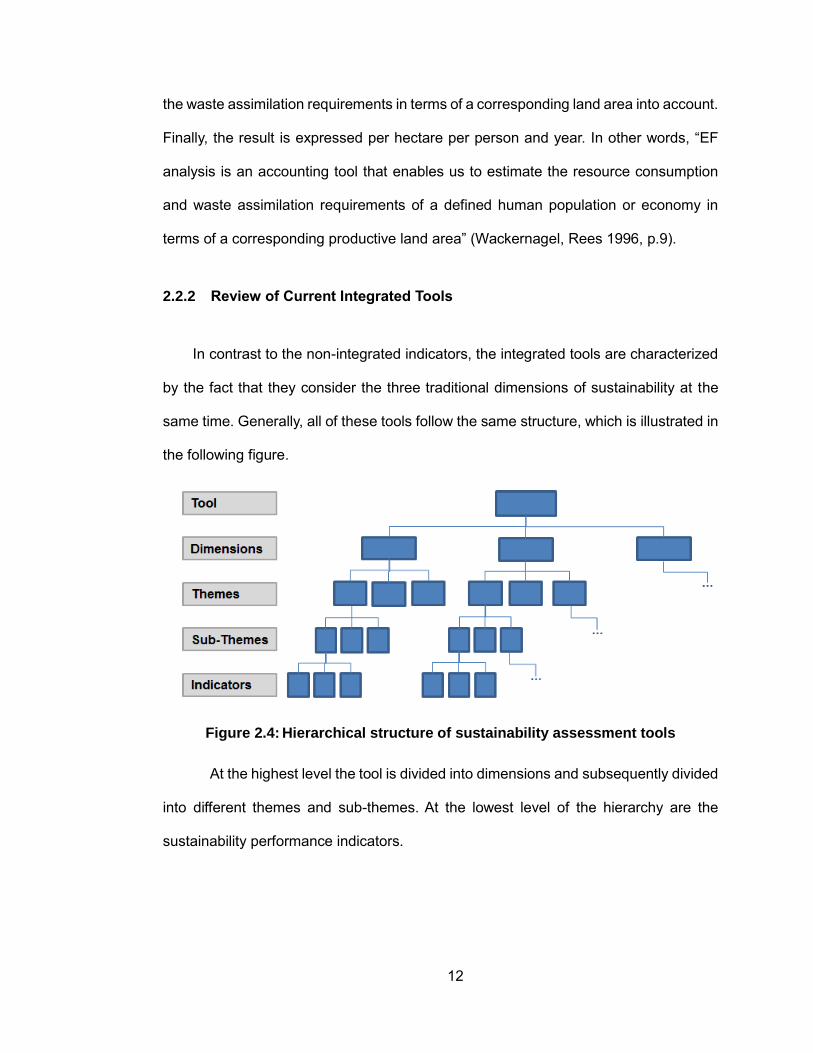
2.2.2 Review of Current Integrated Tools
In contrast to the non-integrated indicators, the integrated tools are characterized
by the fact that they consider the three traditional dimensions of sustainability at the
same time. Generally, all of these tools follow the same structure, which is illustrated in
the following figure.
Figure 2.4: Hierarchical structure of sustainability assessment tools
At the highest level the tool is divided into dimensions and subsequently divided
into different themes and sub-themes. At the lowest level of the hierarchy are the
sustainability performance indicators.

13
After a thorough literature analyses the most quoted and relevant integrated
sustainability assessment tools will be described in the following, including the first
three levels of their frameworks: tool, dimensions and themes (see Figure 2.4).
Global level
At the global level, the Core Environmental Indicators (CEI) developed by the
Organization for Economic Co-operation and Development (OECD) are considered to
be the most relevant indicators. They can be used to measure environmental
performance, to report on the progress towards sustainable development and also to
monitor the integration of economic and environmental decision making as well as
society’s response (OECD 2001, 2003). The core set contains about 50 indicators with
a strong focus on environmental issues, but it integrates also society and economic
aspects (OECD 2001). The hierarchical structure is shown in Figure 2.5.
Figure 2.5: Hierarchical structure of the OECD-CEI
Country level
At the country level, the UN commission’s sustainable development group (UN-
CSD) has developed another hierarchical framework for the evaluation of sustainability.
OECD-CEI
Environmental
Pollution Issues
Natural ressources & assets
Socio-economic
Socio-economic

14
The background that led to the development of this tool is described in chapter 2.1.1.
The latest version of the framework consists of 44 subthemes, 14 main themes and
four main areas. In contrast to the traditional view of three dimensions, the UN-CSD
considers institutional aspects as an additional main area. However, in the newly
revised set the division along the main areas is no longer explicit, because the
framework aims to integrate the main areas with cross-cutting themes like poverty or
natural hazards (United Nations 2007). The main themes covered by the framework
are illustrated in Figure 2.6. Overall, these indicators measure sustainable development
mainly from a society or national perspective and therefore not all of them are relevant
to industrial and business organizations (Labuschagne et al. 2005)
Figure 2.6: Hierarchical structure of the UN-CSD
Sector level
At the sector level, the electronic sector can be considered as a pioneer and good
example when it comes to sustainability. The Electronic Industry Citizenship Coalition
UN-CSD
Poverty
Gouvernance
Health
Education
Demographics
Natural hazard
Atmosphere
Land
Oceans, seas and coasts
Fresh water
Biodiversity
Economic development
Global economic partnership
Consumption pattern

15
released the Electronic Industry Code of Conduct (EICC code) in 2004. The EICC code
provides guidelines on social, environmental and ethical aspects through five main
themes (see Figure 2.7) that may be integrated and adopted by the companies on a
voluntary basis. So far more than 40 world-leading companies like Cisco, Philipp and
Apple support the EICC code and have also introduced it to their suppliers. (EICC 2012)
Figure 2.7: Hierarchical structure of the EICC code
Corporate level
With the regard to the goal of the study, to assess factory sustainability, the
corporate level is considered to be the most important hierarchical level. It also includes
factories as an aspect. Therefore, it is important not only to focus on one tool, but to
describe this level extensively.
One of the most quoted tools on this level is the Global Reporting Initiative (GRI).
The GRI was launched in 1997 by the United Nations Environment Program (UNEP)
together with the US non-profit organization the Coalition for Environmentally
Responsible Economics (CERES). It is designed to be used by organizations of any
size, sector or location and to report on sustainability of the entire organization.
EICC
Social
Health & Safety
Labor
Environemt
Environmental
Ethic
Ethics
Managment System

16
Therefore, the GRI uses a hierarchical framework in three focus areas. The social focus
area concerns the impacts an organization has on the social system within which it
operates. It includes indicators surrounding labor practices, human rights, society and
product sustainability at all company locations. Environmental indicators on the other
hand take inputs like materials, water and energy as well as outputs like emissions,
effluents and waste into account. Additionally, the economic indicators of sustainability
illustrate the organization’s main economic impact on stakeholders and throughout
society. The hierarchical structure is demonstrated in Figure 2.8. Overall, the guideline
contains 84 indicators, but only few organizations provide detailed information on all
focus areas or evaluate all indicators (Global Reporting Initiative 2011; Labuschagne
et al. 2005; Hussey et al. 2001)
Figure 2.8: Hierarchical structure of the GRI
The Dow Jones Sustainability Index (DJSI) is another important tool on this
subject. It was launched in 1999 by Dow Jones Indexes and the company SAM as the
first global sustainability benchmark. The DJSI evaluates the sustainability
GRI
Social
Labour practices and decent work
Human rights
Society
Product responsability
Environemt
Environmental
Economic
Direct economic impacts

17
performance of the world’s leading companies in terms of economic, environment and
social themes (see Figure 2.9). It is a weighted set of general and industry-specific
criteria, according to which the companies are ranked within their industry. Only the
leading company in each industry is selected for the DJSI. This tool is used especially
as benchmarks by investors who integrate sustainability consideration into their
portfolio and support sustainable investment. (DJSI 2013)
Figure 2.9: Hierarchical structure of the DJSI
In contrast to the GRI and Dow Jones Sustainability Index, BASF Seebalance
is developed by a company and not by a superordinate organization. With regard to the
categorization in Figure 2.3, it is considered to be a micro-tool. Initially BASF, the
world’s leading chemical company, has developed the eco-efficiency analysis to assess
environmental and economic opportunities and risks in any business activities. Based
on this two dimensional approach (environment and economic), BASF created the
socio-eco-efficiency analysis, known as Seebalance by also integrating the third
dimension (social) (Uhlman, Saling 2010). The socio-eco-efficiency analysis involves
DJSI
Social
Social reporting
Stakeholder engagement
Additional items
Environemt
Biodiversity
Climate strategy
Additional items
Economic
Brand management
Stakeholder engagement
Additional items

18
measuring the environmental impact over its entire lifecycle. It measures at least eleven
environmental impacts in six main themes (see Figure 2.10). The results are then
aggregated using weighting schemes for each category. Another aspect of the
Seebalance concerns the full economic impact of all alternatives, in order to determine
an overall total cost of ownership. All identified costs are summed, normalized and
combined in appropriate units, without weighting them. Finally, the socio-eco-efficiency
analysis assesses also the social fingerprint. Therefore, it takes five themes into
account and weights them. The themes are shown in Figure 2.10. Overall, this tool
allows it to quantify sustainability for different alternatives and to compare them.
Therefore, it is useful for supporting strategic decision-making, marketing and also for
prioritizing R&D activities (Saling et al. 2005).

19
Figure 2.10: Hierarchical structure of the BASF Seebalance
Product level
Like the BASF Seebalance, the Ford Product Sustainability Index (FPSI) is also
considered to be a micro-tool. It is directly used by Ford’s engineers to improve the
sustainability performance of the products and not to report to a superordinate
organization. The tool looks at eight different indicators, reflecting key impacts of
automotive products. The dimensions and themes are illustrated in Figure 2.11. Since
the tool focuses on only few key elements with available data, the effort to complete
the tool is rather easy and it can be done in approximately 10 – 15 hours for the whole
product development process. The tool has been applied the first time for the vehicles
BASF Seebalance
Social
Employees
International community
Future generation
Consumer
Local and national community
Environemt
Resource consumption
Energy consumption
Emissions
Toxicity potential
Risk potential
Land use
Economic
Costs
Wider economic effects

20
Ford Galaxy and S-MAX and resulted in a significant improvement of the sustainability
performance (Schmidt 2006).
Figure 2.11: Hierarchical structure of the Ford PSI
Another framework at this level was created by the company Wal-Mart. In contrast
to Ford’s approach, Wal-Mart designed their tool to be used not only within the
company, but mainly from their suppliers. For this reason it is considered to be at the
inter-company level. As one of the worldwide leading retailers, Wal-Mart was accused
of unfavorable business practices with a significant ecological impact and high carbon
footprints. Therefore, they changed their mission towards a sustainable development
and implemented an environmental initiative. (Nandagopal, Sankar 2009) Wal-Mart
expresses this mission through three goals: to be supplied 100% by renewable energy,
to create zero waste and to sell products that sustain people and the environment (Wal-
Mart 2012). In order to accomplish these goals Wal-Mart focuses on its suppliers and
especially on the product packaging. In 2006, they released a packaging scorecard
FPSI
Social
Safety
Mobility capability
Environemt
Global warming potential
Sustainable materials
Air quality potential
Restricted substances
Drive by noise
Economic
Life cycle ownership costs

21
with the intention of helping suppliers to improve packaging sustainability and to
conserve resources. This scorecard is a measurement tool that allows the suppliers to
evaluate themselves relative to other suppliers. The evaluation is performed using a
specific metric which is based on the “7 R’s of Packaging”: Remove, Reduce, Reuse,
Recycle, Renew, Revenue, and Read. (Wal-Mart 2006; Zettlemoyer 2007) The themes
are shown in Figure 2.12.
Figure 2.12: Hierarchical structure of the Wal-Mart Scorecard
Wal-Mart Scorecard
Material Health & Safety
Cube Utilization
GHG / CO2
Recycled Content
Renewable Energy
Recovery Value
Product / Package Ratio
Transportation
Innovation

22
CHAPTER 3 - FACTORIES AND INDUSTRIAL SECTORS
Since the thesis develops a tool to assess factory sustainability, it is important not
only to look at the sustainability aspect, but also at the factory aspect. Therefore, this
chapter presents a basic description of factories and illustrates their importance in
terms of sustainability, based on energy use and CO2 emissions. Besides the influence
of general factories, the industry specific influence by sector is also considered. Finally,
the chapter concludes with explaining the need for a factory specific sustainability
assessment tool that will be developed in the next chapters.
3.1 Basics of Factories
The term factory is derived from the Latin word facrica, which means workshop.
Generally, a factory describes a place where added value takes place by manufacturing
industrial goods using factors of production (Klemke et al. 2010). In contrast to
traditional craft workshops, industrial factories are highly complex socio-technical
systems that cannot be generalized easily. The whole factory consists of different levels
which are ranked in a hierarchal order. Two of the main orders and views are described
by Westkämpfer and Wiendahl. Both views of a factory are shown in Figure 3.1.

23
Figure 3.1: Structuring levels and views of a factory based on (Wiendahl et al. 2007)
Both structures subdivide factories into seven levels and consider network to be
the highest and processes to be the lowest level. Nevertheless, the interpretation of the
levels differs depending on the view. The resource view by Westkämpfer divides the
levels with a focus on technical and human resources, whereas the space view by
Wiendahl considers primarily the space that will be needed by the resources (Wiendahl
et al. 2007).
Moreover, it is important to classify factories also in an overall system. For this
purpose, different descriptive models have been developed. In terms of sustainability
the life cycle assessment appears to be the most relevant approach, where factories
are considered to be a stage in the product life cycle. This approach attempts to
evaluate the environmental impact of products throughout the entire life cycle of a
product from raw material extraction, manufacturing, and use to ultimate disposal (see
Figure 3.2) (Satish Joshi 2000).
Resource
ViewSpace
View
Network
Site
Segment
Network
Location
Master Plan
Building
Working Area
System
Cell
Station Working Place
Processes

24
Figure 3.2: Factories within the product life cycle based on (Wiendahl et al. 2007)
Figure 3.2 illustrates the entire product life cycle, but focuses on the environmental
impact of factories. It demonstrates that factories influence the environment by using
natural resources like water and air, as well as by creating waste products.
Furthermore, it takes the ecological backpack of input products into account and also
the environmental impact of the output products (Müller et al. 2009).
This section of the chapter gives a rough impression about the complexity and
significance of factories, based on the hierarchical order and the entire product life
cycle. However, in the following course of the study it is necessary to reduce the
complexity and to limit the scope in order to create a rapid assessment tool. Therefore
the factory will be considered in its entirety and the pre- and post-stages of the factory
will not be taken into account.
3.2 Impact of Factories on their Environment
The previous section of the chapter has already indicated that the manufacturing
industry produces adverse environmental impacts such as waste generation and
consumption of natural resources. The significance of factories becomes particularly
Raw Materials Manufacturing Product Use Recycling/Disposal
Extraction
Natural Ressources
Waste Products

25
obvious by regarding the global energy use. In 2004 the total global primary energy
supply was about 469 exajoules (EJ). With 113 EJ the manufacturing industry accounts
for nearly one third of this energy use. Even though the industrial energy intensity
(energy use per unit of industrial output) decreased over the last decades across all
manufacturing sectors, the absolute energy use has increased (OECD Sustainable
Development Studies). In total it even increased by 61% between 1971 and 2004. This
development is illustrated in Figure 3.3.
Figure 3.3: Global Industrial Energy Use, 1971 – 2004 (OECD Sustainable Development Studies)
Furthermore, Figure 3.3 shows that the energy consumption depends highly on
the industrial sector. Raw material productions such as chemical and petrochemicals,
iron and steel, non-metallic minerals and non-ferrous metals consume most of the
industrial energy. The chemical and petrochemical sector alone accounts already for
30% of industrial energy use.
Regarding CO2 emissions similar conclusions can be observed. With 9.7
gigatonnes (Gt) in 2004, the manufacturing industry accounts for 36% of total CO2
1971 1975 1980 1985 1990 1995 2000 2004
120
100
80
60
40
20
0
EJ/y
r
Non-specified (Industry)
Textile and Leather
Construction
Wood and Wood Products
Food and Tabacco
Mining and Quarrying
Machiney
Transport Equipment
Paper, Pulp and Print
Non-Metallic Minerals
Non-Ferrous Metals
Chemical and Petrochemical
Iron and Steel

26
emissions (OECD Sustainable Development Studies). The figure below demonstrates
that like industrial energy use, CO2 emissions vary as well depending on the sector. In
2004 the three sectors Iron & Steel, Non-Metallic Minerals and Chemical &
Petrochemicals account for 70% of industrial CO2 emissions.
Figure 3.4: Industrial Direct CO2 Emissions by Sector, 2004 (OECD Sustainable Development Studies)
Besides the industrial energy use and industrial CO2 emissions, the significance of
factories is also shown by regarding the general pollution. According to the European
Environment Agency (EEA) “manufacturing contributes 22% of European global
warming potential as well as 14% of acidification potential, and 21% of tropospheric
ozone potential” (OECD Sustainable Development Studies, p. 65).
So far, only air pollution and energy consumption have been considered for
describing the relationship between manufacturing and sustainability. Nevertheless,
there are even more issues, which indicate that sustainable manufacturing will become
one of the major objectives within industry in the twenty-first century. Not only
Other28%
Iron & Steel27%
Non-Metallic Minerals
27%
Non-Ferrous Metals
2%
Chemical & Petrochemical
16%

27
improvements in efficiency and reductions on pollution have to be made but also
traditional paradigms for doing business have to be changed.
3.3 Classification of Industrial Sectors
As the section above has already indicated, the different industrial sectors need to
be considered. Depending on the sector the consumption of energy, CO2 emissions
and general air pollution varies significantly. But not only environmental indicators are
influenced by sectors, the social and economic indicators are affected as well. The Dow
Jones Sustainability Index for example weights the social indicator Occupational Health
and Safety especially high for (raw) material sectors such as steel or oil. The economic
indicator Corporate Governance on the other hand is considered to be very important
for the automotive sector (SAM 2013).
Based on the explained significance of industrial sectors it is necessary to divide
the manufacturing industry into sectors within this study as well. The indicators need to
be weighted sector-specifically in order to receive a meaningful sustainability score.
The figure below presents the classification of different sectors.

28
Figure 3.5: Classification of industrial sectors
The left side of Figure 3.5 lists the 19 supersectors that are used by the DJSI.
However, their classification is not suitable for this study. In order to reduce the
complexity it is necessary to combine some of the supersectors. Hence the right side
of the figure presents the results of the combination. Moreover, only factory related
sectors are relevant for this work. Since the sectors Financials and Consumer Services

29
do not operate with factories they will not be considered any further. As a result six main
sectors: Basic Materials, Industrials, Consumer Goods, Health Care, Utilities and
Technology remain.
3.4 Needs of an Individual Tool at Factory-Level
This chapter demonstrates that the manufacturing industry is a main consumer of
natural resources and a main producer of adverse environmental impacts. It signifies
that there is a high responsibility of factories towards their environment. For this reason
it is important to design a tool for the sustainability evaluation of factories. Although the
purpose of such a tool is primarily to assess the sustainability performance of the
factory, it can also guide factory managers to think and act in the right direction and to
discover possible improvements in order to increase the sustainability metrics related
to factory operations.
Even though the literature review from chapter 2 indicates that several frameworks
and tools are already available to assess sustainability, it also demonstrates that they
vary depending on the subject of investigation and it needs a lot of insight knowledge
and effort to use those tools. Moreover, current tools focus primarily on regional,
national and global levels. At this point, the company level has not been considered
sufficiently and those tools that are actually used within industry focus mainly on a
product level within the organization (Labuschagne et al. 2005).

30
CHAPTER 4 – DEVELOPMENT OF A FRAMEWORK
In order to fill the gap of a missing factory assessment tool it is necessary to
develop effective sustainability indicators and a reasonable framework. Therefore, it is
important to specify the purpose of the tool in the beginning. This chapter presents
general criteria for indicators and also specific criteria for each dimension of
sustainability: social, environmental, and economic. Based on those criteria appropriate
indicators are derived in the next step for each dimension. The derived indicators are
then judged as to whether an indicator supports or harms a company’s sustainability.
The next step requires a normalization of the indicators to avoid adding up incompatible
data sets that can lead to inaccuracies in future steps. After evaluating and normalizing
the indicators, they also have to be weighted based on the type of industry in order to
obtain a meaningful evaluation of the sustainability performance of factories within each
industry. From this model it is possible to calculate a sub-index for each sustainability
dimension. Finally, all three sub-indices are combined into one overall composite
sustainable performance index. The figure below visualizes the process.

31
Figure 4.1: Methodology for developing a framework to assess factory sustainability
4.1 Purpose of the Tool
Generally, the study aims to develop a tool that assesses a factory’s sustainability
performance. Furthermore, it is the goal to ensure a rapid and integrated assessment
for all industries. Besides these general characteristics, the tool also has to meet
specific criteria listed below, which distinguish it from other tools.
It should be possible to use the tool as an external user without internal
information. That means the data for the indicators should be available
through published sustainability reports, webpages etc.

32
It should be possible to evaluate a single factory.
It should be possible to evaluate two or more factories and assess them as
alternatives against each other.
It should be possible to evaluate one factory over time, in order to observe its
sustainable development.
Based on the integration of these criteria the tool’s purpose is intended for external
investors as main users who integrate sustainability consideration into their portfolio.
The tool provides a quick and general overview of the sustainability performance and
supports the comparison of different alternatives. At the same time internal factory
managers may also use the tool to compare themselves to other companies or to
identify possible improvements or deteriorations in terms of sustainability.
4.2 Criteria of Sustainability Performance Indicators
Indicators are simple measures; most often quantitative that represent a state or
condition of something. An example of an indicator is a thermostat displaying 32
degrees. In this sense, indicators typically provide key information about a physical,
social, or economic system and also allow analyzing trends and relationships. Thus,
indicators are usually a step beyond primary data (Veleva, Ellenbecker 2001). They
vary depending on the type of system they monitor. In terms of this study, sustainability
indicators can be defined as “information used to measure and motivate progress
toward sustainable goals” (Ranganathan 1988, p.2). However, there are certain
characteristics that effective sustainability indicators have in common. The Sustainable
Measures Group (Sustainable Measures 2010) as well as Anderson et al. and Feng et
al. (Feng et al. 2010) have established the following criteria:

33
Measurable: Indicators need to be capable of being measured quantitatively
or qualitatively.
Relevant: Indicators have to fit the purpose of measuring sustainability
performance and provide useful information on it.
Understandable: Indicators should be easily understood by people who are
not experts.
Manageable: Indicators have to be limited to the minimal number required, to
meet the purpose of measuring.
Reliable: Indicators need to provide trustworthy information.
Data accessible: Indicators have to be based on information that are available
or can be easily accessed.
Timely manner: Indicators should be measured on a regular basis to enable
timely, informative decision-making.
Besides those characteristics regarding the content of indicators, there are further
attributes regarding the format and structure of indicators (Joung et al. 2013; Veleva,
Ellenbecker 2001):
Identification: Indicators should be organized either alphabetically or
numerically.
Name: Indicators need to be clearly designated.
Definition: Indicators should be defined with their essential characteristics and
functions.
Unit of measurement: The value of indicators has needs to be specified (e.g.
kilograms, tons, percent, hours)

34
Type of measurement: Indicators can be measured either quantitatively or
qualitatively and further can be either absolute (e.g. total energy used per
year) or adjusted (e.g. energy used per unit of product per year)
Period of measurement: Indicators have to be measured over a defined period
of time (e.g. year, quarter, month)
The characteristics listed above help to distinguish indicators from primary data,
goals, parameters, or issues. The following example demonstrates the importance.
“Using renewable energy” is often labeled as a sustainability indicator by the media,
even though it is not. In fact, it is a goal. In order to define an indicator it is necessary
to consider all the mentioned characteristics. In terms of renewable energy use a
possible indicator would be “percent of energy from renewables, measured at a facility
over a period of one year” (Veleva, Ellenbecker 2001).
4.3 Identifying and Grouping of Sustainability Performance Indicators
In order to identify and group indicators it is necessary to define a hierarchical
structure for the framework. Figure 2.4 illustrates the general hierarchy for integrated
sustainability tools. However, to suit the needs of the tool developed within the study, it
has to be modified and adapted for factories. The following figure presents the new
structure, including the modifications.

35
Figure 4.2: Structure of the Factory Sustainability Framework
According to this figure, the dimensions are derived from the literature. This can
be done easily, because the general literature focuses on the three traditional
dimensions of sustainability: social, environment and economy (see chapter 2).
Therefore, the framework adopts this view and contains the same three dimensions.
In contrast to the dimensions, the themes and indicators require more effort as
each sustainability tool in the literature focuses on different aspects. Therefore, it is
important to analyze and compare the main sustainability assessment tools that have
already been identified in chapter 2 further. Table 4.1 organizes the most important
sustainability tools from chapter 2 by focus level, dimension, themes, and subthemes.
Based on these information it is possible to derive dimension specific themes in the
following section of this chapter.
4.3.1 Themes for Environmental Sustainability
The environmental dimension traditionally gains most of the attention in terms of
sustainability, and it is the dimension discussed in most detail in the literature.
Tool
Dimensions
Themes
Sub-Themes
Indicators
Derived from literature
Derived from literature and adapted for factory
No Sub-Themes
Derived from literature and adapted for factory

36
Therefore, current integrated tools use a wide range of themes to evaluate the
environmental performance. With regards to Table 4.1 however, it can be identified that
most tools use relatively similar themes and subthemes. Furthermore, all of them focus
on the external impacts on the environmental system. Based on Table 4.1 the following
main themes are derived:
a) Natural resources & assets: This theme assesses a factory’s use of energy,
water and material as well as the amount of waste created by the factory.
b) Pollution: This theme evaluates a factory’s contribution to climate change and
global warming. Additionally, it takes substances into account that present
hazards to human health or the environment.
4.3.2 Themes for Social Sustainability
Recently, the public and especially stakeholders shifted the focus from
environmental-related to social-related issues. Therefore, businesses pay increasingly
more attention to the social dimension of sustainability, although the work on this topic
is still insufficient (Labuschagne et al. 2005). It is striking that the more modern tools
like EICC, 2004 and BASF Seebalance, 2012 contain significantly more social aspects
then the older tools, such as DJSI or OECD-CEI.
In contrast to the environmental dimension, most of the tools considering the social
dimension have an internal view instead of an external view. Since the tool developed
within this thesis is aimed at assessing the social sustainability at the factory level, the
focus is also internal. The following themes are derived from Table 4.1 and describe
the main issues of the social dimension with regard to factories:

37
c) Health and Safety: This theme focuses on the security and wellbeing of all
employees. It evaluates the preventative measures as well as the risk
potential.
d) Labor development and work satisfaction: This theme assesses the general
working conditions and the continuous development of the employees and
their talents.
e) Equal opportunity and decent work: This theme evaluates the compliance of
equal rights and fair employment practice standards. It contains aspects such
as gender equality and equal career chances.
4.3.3 Themes for Economic Sustainability
In terms of economic sustainability the review of current integrated frameworks
from chapter 2 shows that there are two different understandings of economic
sustainability. Since OECD and UN-CSD are located at the global and national level, it
is obvious that they take impacts from the economic system at the national and global
levels into account. However, GRI assesses sustainability at a company level and
considers “organization’s impacts on the economic circumstances of its stakeholders
and on economic systems at the local, national, and global levels” (Global Reporting
Initiative 2011). All three frameworks focus on the general economic performance and
development (see Table 4.1). Thus, there are two approaches that can be taken: one
approach takes the external impacts on the entire economic systems into
consideration, while the other focuses on the internal economic impacts of a business.
The DJSI as well as the EICC consider economic performance in terms of the internal
management, whereas the BASF and FPSI frameworks attempt to minimize their costs

38
(see Table 4.1). Consequently, it is necessary to choose between the two different
approaches.
With regards to the statement that the first goal of businesses towards
sustainability is to stay in business, the focus within this study is internal. Activities at
the factory level contribute to the overall profitability of the company and only
subsequently contribute to the economic system on a broader, national level
(Labuschagne et al. 2005). Therefore the following themes are derived based on the
DJSI, EICC, BASF, FPSI and Walmart-Scorecard:
f) Financials: This theme takes the internal financial stability of factories into
account by assessing the profits.
g) Development: This theme focuses on the investment and expenditures on
future development and Environment, Health and Safety compliance.

39
Table 4.1: Overview of existing frameworks and derivation of a new framework
Global Country Sector Factory
Dimension Themes/Sub-Theme OECD-CEI UNCSD-ISD EICC GRI DJSI BASF FPSI Walmart New Tool
Pollution Issues x x x x x x x x x
Emission, Effluent x x x x x x x x
Climate Change x x x
Toxicity Potential x x x
Permits and Reporting x x
Restricted/Hazardous
Substances x x
Risk Potential x x
Natural Resources & Assets x x x x x x x x x
Solid Wastes x x x x x
Water x x x x x x x
Energy x x x x x x x
Material x x x x x x
Biodiversity x x x x
Land Use x x x
Oceans, Seas and coasts x x
Compliance x
Natural Hazards x
Health & Safety x x x x x x x x
for employees x x x x x x
for customers x x x
Working Accidents x x x x
Machine Safeguarding x
Industrial Hygiene and
Toxicity Potential x x x
Physically Demanding Work x
Emergency Preparedness x
Mortality x
Sanitation, Food and Housing x x
Labor Practices and
Development x x x x x x
Training/Education x x x x x
Satisfaction (Strikes) x
Wages and Benefits x x x
Working Hours x
Human Rights and decent
Work x x x x
Non-Discrimination x x
Freedom of Association x x
Child Labor Avoidance x x
Freely Chosen Employment x x
Gender Equality x x x
Integration of Handicapped
People x x
Part Time Workers x
Governance and Community x x x x
Corruption x x
Security/Crime x x
Investment x x
Public Policy x
Demographics x x
Population Change x x
Management x x
Brand Management x
Risk & Crisis Management x x
Stakeholders Engagement x
Performance and Development x x x x x x x
Innovation, R&D x x x
Market Presence x
Indirect Economic Impacts x x
Exports/Trade x x x
Financials x x x
Material Costs x
Energy Costs x
Profit Margins x x
Eco
no
mic
ProductCorporate
Envi
ron
men
tal
Soci
al

40
4.3.4 Sustainability Performance Indicators
After defining themes for each dimension and the general criteria for indicators, it
is now required to define and constraint the concept to a number of key performance
indicators that meet all the criteria and can be measured, monitored, and recorded on
a regular basis. A wide range of possible sustainability performance indicators can be
found in the literature (see chapter 2). However, every indicator is not relevant to the
industry and can be evaluated from an external perspective. Therefore, suitable key
indicators have to be identified. To accomplish this, existing tools have to be compared
and the most common key indicators have to be identified. Again, the main
sustainability tools from chapter 2 are used for this analysis. A detailed overview of
each tool can be found in the digital appendix. Additional sets of indicators found in the
literature that focus on sustainable manufacturing are included as well: Krajnc and
Glavic (2003), Velena et al. (2001) and Veleva and Ellenbecker (2001). Finally, the
indicators are also tested and compared with sustainability reports published by
different companies to ensure the data availability for the external use of the tool. To
achieve this, the BMW Group Sustainable Value Report 2012, the BASF Report 2012
and the AkzoNobel Report 2012 are analyzed. These reports are published annually
by the companies to report their figures and goals in terms of sustainability.
Generally, the study aims for using only quantitative indicators, as these are more
objective and less biased than qualitative ones. It should also be possible to express
each indicator in relative terms and not only in absolute terms, as different factories
have to be compared on a meaningful level. Social indicators for example should
expressed relative to the size of the workforce and environmental indicators relative to
an appropriate measure of production such as produced units of product or an
indication of produced weight.

41
The identified key sustainability indicators along with their dimensions, themes and
units are summarized in Table 4.2.
Table 4.2: Key performance indicators of factory sustainability
Dimensions Themes Indicators Unit
Environment a) Natural resources & assets
1. Energy use MWh
2. Material use Kg
3. Freshwater consumption m³
4. Waste generation Kg
b) Pollution 5. Global warming potential t
6. Acidification potential
t
Social c) Health & safety 7. Working accidents
-
8. Safety training
-
9. Hazardous materials Kg
d) Labor development & work satisfaction
10. Training and education Hours
11. Sickness frequency
Days
12. Employee attrition rate %
e) Equal opportunity and decent work
13. Share of women in workforce %
14. Share of women in management positions
%
15. Wages at lowest wage group
16.
$
Economic f) Financials 16. Net profit margin %
17. Return of capital employed %
g) Development 18. Investment in R&D $
19. Investment in staff development $
20. Expenditures on EHS compliance $
While Table 4.2 gives an overview of all indicators, the detailed description of each
key performance indicator will be presented in the following sections. It includes the
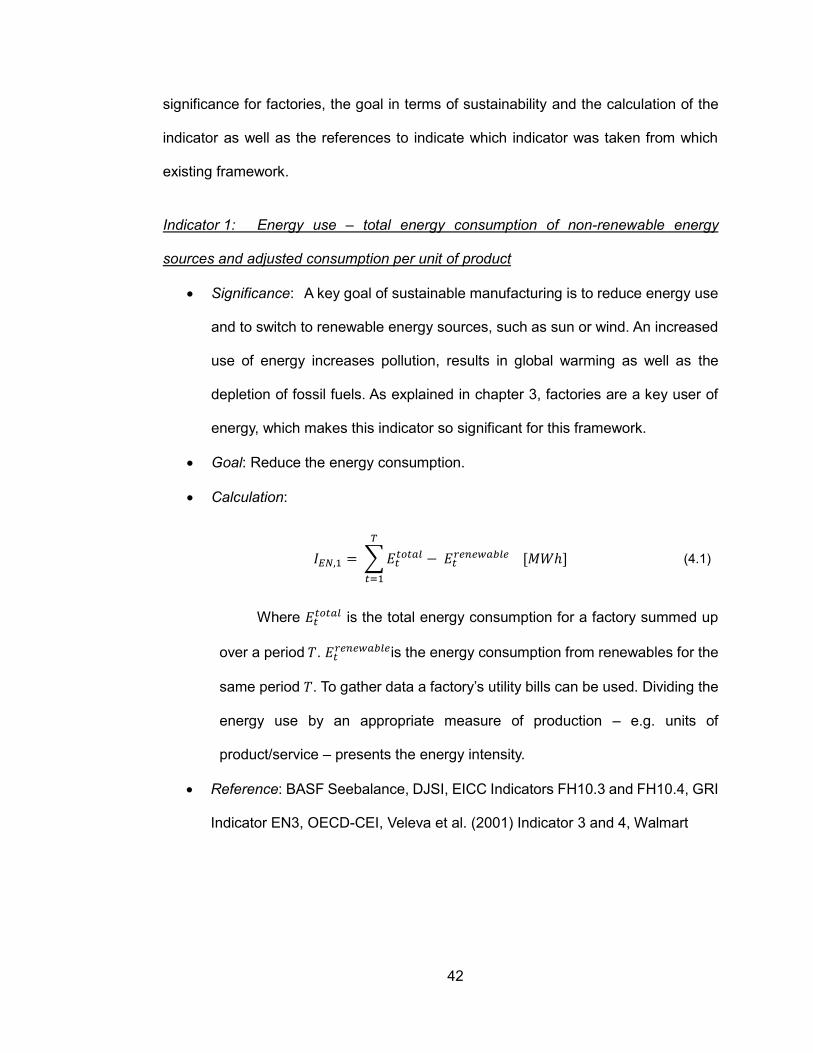
42
significance for factories, the goal in terms of sustainability and the calculation of the
indicator as well as the references to indicate which indicator was taken from which
existing framework.
Indicator 1: Energy use – total energy consumption of non-renewable energy
sources and adjusted consumption per unit of product
Significance: A key goal of sustainable manufacturing is to reduce energy use
and to switch to renewable energy sources, such as sun or wind. An increased
use of energy increases pollution, results in global warming as well as the
depletion of fossil fuels. As explained in chapter 3, factories are a key user of
energy, which makes this indicator so significant for this framework.
Goal: Reduce the energy consumption.
Calculation:
𝐼𝐸𝑁,1 = ∑𝐸𝑡𝑡𝑜𝑡𝑎𝑙
𝑇
𝑡=1
− 𝐸𝑡𝑟𝑒𝑛𝑒𝑤𝑎𝑏𝑙𝑒 [𝑀𝑊ℎ] (4.1)
Where 𝐸𝑡𝑡𝑜𝑡𝑎𝑙 is the total energy consumption for a factory summed up
over a period 𝑇. 𝐸𝑡𝑟𝑒𝑛𝑒𝑤𝑎𝑏𝑙𝑒is the energy consumption from renewables for the
same period 𝑇. To gather data a factory’s utility bills can be used. Dividing the
energy use by an appropriate measure of production – e.g. units of
product/service – presents the energy intensity.
Reference: BASF Seebalance, DJSI, EICC Indicators FH10.3 and FH10.4, GRI
Indicator EN3, OECD-CEI, Veleva et al. (2001) Indicator 3 and 4, Walmart

43
Indicator 2: Material use – total consumption of non-renewable materials and
adjusted consumption per unit of product
Significance: The depletion of non-renewable materials such as fossil fuels,
metals and minerals is becoming the limiting factor for traditional economic
growth. Reducing material use at the factory-level is therefore a critical goal for
achieving sustainable development.
Goal: Reduce the material consumption
Calculation:
𝐼𝐸𝑁,2 = ∑∑𝑀𝑢,𝑡 ∗ 𝑓𝑢
𝑈
𝑢=1
𝑇
𝑡=1
[𝐾𝑔] (4.2)
Where 𝑀𝑢,𝑡 is the quantity of resource 𝑢 summed up over a period 𝑇; 𝑓𝑢
represents the weighting factor of that resource based on the total estimated
world reserves (see Table 4.3). Renewable materials are calculated with a
weighting factor of 0 and are therefore not taken into account. Dividing the
total materials used by an appropriate measure of production presents the
material intensity.
Reference: BASF Seebalance, EICC Indicator FB3.1, FPSI, OECD-CEI, Veleva
et al. (2001) Indicator 2, Walmart

44
Table 4.3: Identifying weighting factors for material use (Kölsch 2011)
Resource 𝒖 Limit
(years) World
Reserves (Mt) Factor 𝒇𝒖
Coal 147 478 771 0.12
Crude Oil 41 164 500 0.39
Natural Gas 63 163 314 0.31
Brown Coal 241 142 000 0.17
NCI 1 000 18 000 000 0.01
Sulphur 9 091 600 000 0.01
Phosphorus 122 18 000 0.67
Iron Ore 70 71 000 0.45
Limestone 500 18 000 000 0.01
Bauxite 197 25 000 0.45
Sand 1 000 18 000 000 0.01
Indicator 3: Freshwater consumption – total consumption and adjusted per unit of
product
Significance: Water is considered to be the key problem of the 21st century.
Access to fresh water should be a universal and human right, but limited
resources and a growing population are increasing its economic value.
Therefore, a goal of sustainable manufacturing is to reduce consumption of
freshwater.
Goal: Reduce the freshwater consumption.
Calculation:
𝐼𝐸𝑁,3 = ∑𝐹𝑊𝑡
𝑇
𝑡=1
[𝑚3] (4.3)
Where 𝐹𝑊𝑡 is the quantity of freshwater summed up over a period 𝑇. To
gather this data, a factory’s water utility bills can be used. Dividing the total
45
amount of freshwater by an appropriate measure of production presents the
water intensity.
Reference: BASF Seebalance, DJSI, EICC Indicators FH10.3 and FH10.4.6,
GRI Indicator EN8, OECD-CEI, UNCSD-ISD, Veleva et al. (2001) Indicator 1
Indicator 4: Waste generation – total generation and adjusted per unit of product
Significance: The United States generated 250,000 Million tons of waste in
2010 and the rate of waste generation is increasing constantly (EPA 2012). The
major problems related to the high amount of waste are environmental pollution
and the release of toxic substances that endanger human and ecosystem
health.
Goal: Reduce the waste generation.
Calculation:
𝐼𝐸𝑁,4 = ∑𝑊𝑡
𝑇
𝑡=1
[𝐾𝑔] (4.4)
Where 𝑊𝑡 is the amount of solid waste generated over a period 𝑇.
Dividing the total amount of solid waste by an appropriate measure of
production presents the relative waste generation per unit of product/service.
Reference: BASF Seebalance, EICC Indicators FH12.4 and FH12.5, GRI
Indicator EN22, OECD-CEI, Veleva et al. (2001) Indicator 5
Indicator 5: Global Warming Potential (GWP) – total and adjusted per unit of
product
Significance: Global warming potential is a measure of how much a particular
emitted gas contributes to global warming, by comparing each gas at a relative
scale with carbon dioxide. As presented in Table 4.4, carbon dioxide has been

46
assigned a GWP of 1. The effects of global warming, like melting glaciers and
sea ice are significant and irreversible. As a main contributor to global warming
(see chapter 3) factories are forced to reduce their emissions of greenhouse
gases by the Kyoto Protocol and other international agreements.
Goal: Reduce greenhouse gas emissions.
Calculation:
𝐼𝐸𝑁,5 = ∑∑𝐴𝑢,𝑡 ∗ 𝑓𝑣
𝑉
𝑣=1
𝑇
𝑡=1
[𝑡] (4.5)
Where 𝐴𝑣,𝑡 is the quantity of emission 𝑣 summed up over a period 𝑇; 𝑓𝑣
represents the equivalent factor of that emission relative to carbon dioxide (see
Table 4.4). Dividing the total GWP by an appropriate measure of production
presents the relative intensity.
Reference: BASF Seebalance, EICC Indicator FH13, FPSI, GRI Indicators
EN16 and EN18, OECD-CEI, UNCSD-ISD, Veleva et al. (2001) Indicator 6,
Walmart
Indicator 6: Acidification potential (AP) – total and adjusted per unit of product
Significance: Acidification potential is a measure of how much a particular gas
contributes to the acidification, by comparing each gas at a relative scale with
sulfur dioxide. As presented in Table 4.4, sulfur dioxide has been assigned an
AP of 1. Upon release, plants and soils can absorb acidic gases, leading to
decreased biomass and poor soil quality. Additionally, surface waters and other
water bodies may be acidified, resulting in poor water quality, thus, endangering
ecosystem health.
Goal: Reduce emissions of acid gasses.

47
Calculation:
𝐼𝐸𝑁,6 = ∑∑𝐴𝑣,𝑡 ∗ 𝑓𝑣
𝑉
𝑣=1
𝑇
𝑡=1
[𝑡] (4.6)
Where 𝐴𝑣,𝑡 is the quantity of emission 𝑣 summed up over a period 𝑇; 𝑓𝑣
represents the equivalent factor of that emission relative to carbon dioxide (see
Table 4.4). Dividing the total AP by an appropriate measure of production
presents the relative intensity.
Reference: BASF Seebalance, EICC Indicator FH13, GRI Indicator EN20,
OECD-CEI, UNCSD-ISD, Veleva et al. (2001) Indicator 7
Table 4.4: Identifying weighting factors for emissions (Kölsch 2011)
Emissions CO2 SOx NOx CH4 HKW NH3 N2O HCI
GWP (CO2-equivalent)
1 25 4750 298
AP (SO2-equivalent)
1 0,7 1,88 0,88
Indicator 7: Work accidents – total and adjusted per employee
Significance: The importance of work-place related accidents is higher than
commonly assumed. Every year in the U.S. nearly 4 million people suffer a
workplace injury and some of them never recover (U.S. Department of Labor
2012). Production areas pose an especially dangerous environment.
Therefore, every factory’s goal should be to be as safe as possible.
Goal: Achieve zero working accidents.

48
Calculation:
𝐼𝑆𝑂,7 = ∑𝑊𝐴𝑡
𝑇
𝑡=1
[−] (4.7)
Where 𝑊𝐴𝑡 is the number of workplace related accidents over a period
𝑇. Dividing the total amount of working accidents by the total number of
employees presents the relative number of working accidents per employee.
Reference: BASF Seebalance, EICC Indicator FH5.8, GRI Indicators LA7 and
LA8, Veleva et al. (2001) Indicator 15
Indicator 8: Safety trainings - by number of participants and adjusted per employee
Significance: Due to the generally high number of working accidents and the
potentially dangerous environment of a production site, it is recommended to
provide safety trainings for all employees.
Goal: Increase the number of employees that participate in safety trainings
Calculation:
𝐼𝑆𝑂,8 = ∑∑𝑆𝐸𝑡,𝑠
𝑆
𝑠=1
𝑇
𝑡=1
[−] (4.8)
Where 𝑆𝐸𝑡,𝑠 is the quantity of participants summed up over all safety
trainings 𝑆 and over a period 𝑇. Dividing the total number of participants by
the total number of employees presents the relative number.
Reference: BASF Seebalance, EICC Indicator FH11.5, GRI Indicators LA7 and
LA8

49
Indicator 9: Hazardous materials - total amount and adjusted per unit of product
Significance: Hazardous materials are usually chemicals or mixtures of
chemicals that are toxic, flammable, dangerously reactive or that cause other
personal injury or illness. In order to protect worker’s health and safety they
should not be exposed to such materials.
Goal: Reduce the amount of hazardous materials.
Calculation:
𝐼𝑆𝑜,9 = ∑𝐻𝑊𝑡
𝑇
𝑡=1
[𝑘𝑔] (4.9)
Where 𝐻𝑊𝑡 is the amount of hazardous waste generated over a period
𝑇. Dividing the total amount of hazardous waste by an appropriate measure of
production presents the relative generation per unit of product. Since
companies usually do not publish the use of hazardous materials, the indicator
considers the generation of hazardous waste instead.
Reference: BASF Seebalance, EICC Indicator FH11.2, Veleva et al. (2001)
Indicator 8
Indicator 10: Training and education - total hours and adjusted per employee
Significance: Decent training and education programs provide several benefits
for a factory. Employee performance increases as well as the job satisfaction
and work morale. This, in turn, has positive consequences for the overall factory
performance.
Goal: Increase employee training.

50
Calculation:
𝐼𝑆𝑜,10 = ∑𝑇𝐻𝑡
𝑇
𝑡=1
[ℎ𝑜𝑢𝑟𝑠] (4.10)
Where 𝑇𝐻𝑡 is the quantity of training hours summed up over a period 𝑇.
Dividing the total number of training hours by the total number of employees
presents the relative number of training hours per employee.
Reference: BASF Seebalance, EICC Indicator FL.3.10, GRI Indicator LA10,
UNCSD-ISD Veleva et al. (2001) Indicator 18
Indicator 11: Sickness frequency - total number of sick days and adjusted per
employee
Significance: It is widely recognized that work satisfaction can be measured
through the number of sick days. A dissatisfied employee is more likely to call
in sick than a satisfied one. Therefore, factories have to increase work
satisfaction in order to minimize the number of working hours lost and to
increase employee performance.
Goal: Reduce sick days by increasing work satisfaction.
Calculation:
𝐼𝑆𝑜,11 = ∑∑𝑆𝐷𝑡,𝑒
𝐸
𝑒=1
𝑇
𝑡=1
[𝑑𝑎𝑦𝑠] (4.11)
Where 𝑆𝐷𝑡,𝑒 is the quantity of sick days summed up over all employees
𝐸 and over a period 𝑇. Dividing the total number of sick days by the total
number of employees presents the relative number of sick days per employee.
Reference: EICC Indicator FH6.8, Veleva et al. (2001) Indicator 19

51
Indicator 12: Employee attrition rate – rate of new employees and employee
turnover
Significance: The employee attrition rate generally indicates how long
employees tend to stay. Therefore, this is another indicator that reflects
employee well-being and work satisfaction. However, this indicator may also be
influenced by factors outside of a company’s control e.g. strong competitors or
the general economic situation. For this reason it is important to consider both,
indicator 11 and indicator 12 in order to make a statement about job satisfaction.
Goal: Reduce the employee attrition rate by increasing work satisfaction.
Calculation:
𝐼𝑆𝑜,12 = ∑𝐸𝑡𝑙𝑒𝑎𝑣𝑖𝑛𝑔
𝐸𝑡=1 + 𝐸𝑡=𝑇2
𝑇
𝑡=1
∗ 100 [%] (4.12)
Where 𝐸𝑡𝑙𝑒𝑎𝑣𝑖𝑛𝑔
is the number of employees who left summed up over a
period 𝑇, divided by the average total number of employees, where 𝐸𝑡=1 is the
number of employees at the beginning of the period and 𝐸𝑡=𝑇 at the end of the
period.
Reference: GRI Indicator LA2, Veleva et al. (2001) Indicator 17
Indicator 13: Share of women among the total number of employees
Significance: Social diversity is an integral part towards sustainability and
makes a contribution to company’s efficiency. Therefore, gender equality is an
important topic for modern companies. It is expressed by the share of women
in the total workforce.
Goal: Increase the share of women to a reasonable level.

52
Calculation:
𝐼𝑆𝑜,13 =𝐹
𝐸∗ 100 [%] (4.13)
Where 𝐹 is the total number of women divided by the total number of
employees 𝐸.
Reference: BASF Seebalance, EICC Indicator FL9.7, GRI Indicator LA13
Indicator 14: Share of women in management positions
Significance: The share of women in management positions is another indicator
that reflects gender equality and equal opportunities.
Goal: Increase the share of women to a reasonable level.
Calculation:
𝐼𝑆𝑂,14 =𝐹
𝑀𝐴∗ 100 [%] (4.14)
Where 𝐹 is the total number of women divided by the total number of
managers 𝑀𝐴.
Reference: BASF Seebalance, GRI Indicator EN20
Indicator 15: Wage at lowest wage group per year
Significance: Fair labor practices include adequate wages and benefits for all
employees. Especially manufacturing sites employ a high number of workers at
the lowest wage group. Therefore, it is important that the remuneration of this
group is adequate in order to increase employee motivation and morale at
factory level.
Goal: Increase the wages to a reasonable level.
53
Calculation:
𝐼𝑆𝑂,15 = 𝑊𝐿 [$] (4.15)
Where 𝑊𝐿 is the wage of lowest wage group per year.
Reference: BASF Seebalance, EICC Indicator FL7
Indicator 16: Net profit margin
Significance: Net profit margin represents the percentage of revenue remaining
after all operating expenses, interest and taxes have been deducted from a
company’s total revenue. This indicator represents the economic performance
and indicates how successful a company is, which is critical for investors.
Goal: Increase net profit margin.
Calculation:
𝐼𝐸𝐶,16 = ∑𝑇𝑅𝑡 − 𝑇𝐸𝑡𝑇𝑅𝑡
𝑇
𝑡=1
[%] (4.16)
Where 𝑇𝑅 𝑡 is the total quantity of revenues, minus the total quantity of
expenses 𝑇𝐸 𝑡summed up over a period 𝑇, divided by the total revenues.
Reference: BASF Seebalance, GRI Indicator EC1
Indicator 17: Return of capital employed
Significance: Another indicator that reflects the economic performance of a
company is the return of capital employed. This indicator measures the
profitability of a company by expressing how much it is gaining from its assets
and liabilities.
Goal: Increase return of capital employed.
54
Calculation:
𝐼𝐸𝐶,17 = ∑𝑁𝑂𝑃𝐴𝑇𝑡𝐶𝐸𝑡
𝑇
𝑡=1
[%] (4.17)
Where 𝑁𝑂𝑃𝐴𝑇 is the net operating profit after tax summed up over a
period 𝑇, divided by the capital employed 𝐶𝐸 𝑡.
Reference: GRI Indicator EC1
Indicator 18: Investment in R&D - total and adjusted per employee
Significance: Investment in research and development includes expenditures
on test equipment, machines, and tools. The goal of these type of investments
is to consistently keep the production plant in line with the most up-to-date
technology, to improve productivity, and to be innovative.
Goal: Increase investments in R&D.
Calculation:
𝐼𝐸𝐶,18 = ∑𝐼𝑃𝑡
𝑇
𝑡
[$ 𝑚𝑖𝑙𝑙𝑖𝑜𝑛] (4.18)
Where 𝐼𝑃𝑡 is the amount of expenditures on R&D summed up over a
period 𝑇. Dividing the total amount by the total number of employees presents
the relative amount of investment in R&D.
Reference: DJSI, Walmart
Indicator 19: Investment in staff development - total and adjusted per employee
Significance: Investment in staff development includes expenditures on training,
workshops and continuing professional and personal development. The goal of

55
these type of investments is to improve business performance, to promote
organizational learning and to gain long-term competitive advantages.
Goal: Increase investments in staff development.
Calculation:
𝐼𝐸𝐶,19 = ∑𝐼𝐷𝑡
𝑇
𝑡
[$ 𝑚𝑖𝑙𝑙𝑖𝑜𝑛] (4.19)
Where 𝐼𝐷𝑡 is the amount of expenditures on staff development summed
up over a period 𝑇. Dividing the total amount by the total number of employees
presents the relative amount of expenditures on staff development.
Reference: BASF Seebalance, GRI Indicator LA10
Indicator 20: Expenditures on EHS compliance - total and adjusted per employee
Significance: Expenditures associated with Environment, Health, and Safety
(EHS) compliance reduce the economic performance of the factory. The goal
should be to reduce the costs though cleaner production or pollution prevention
in order to increase profits.
Goal: Reduce EHS compliance costs.
Calculation:
𝐼𝐸𝐶,20 = ∑𝐸𝐻𝑆𝑡
𝑇
𝑡
[$ 𝑚𝑖𝑙𝑙𝑖𝑜𝑛] (4.20)
Where 𝐸𝐻𝑆𝑡 is the amount of expenditures on Environment, Health, and
Safety compliance summed up over period 𝑇. Dividing the total amount by the
total number of employees presents the relative amount of expenditures on
EHS.
Reference: GRI Indicator EN30, Veleva et al. (2001) Indicator 9

56
4.4 Judging of Sustainability Performance Indicators
After identifying the key indicators it is necessary to determine whether an indicator
supports or harms a company’s sustainability performance. This judgment of each
indicator becomes important for the normalization and the aggregation in the next
steps. Positive indicators are considered as sustainability contributing and should
therefore be maximized. Negative indicators on the other hand should be minimized to
support sustainability. The description of each indicator and especially their goals in the
section above indicate already whether it is a positive or negative indicator. Thus, the
results are summarized in the following table.
Table 4.5: Judging of key performance indicators
Indicators of positive sustainability Indicators of negative sustainability
Safety trainings Net profit margin Energy use Working Accidents
Training and education
Investment in R&D Material use Sickness frequency
Share of women in workforce
Investment in staff development
Freshwater consumption
Employee attrition rate
Share of management positions
Waste generation Hazardous materials
Wages at lowest wage group
GWP Expenditures on EHS compliance
Return of capital employed
AP

57
4.5 Normalizing of Sustainability Performance Indicators
The next step towards calculating a composite sustainability performance index
focuses on the normalization of indicators. This step is important, because the
indicators are expressed in different units and the combination of the indicators into the
performance index requires common units to achieve a representative result. A number
of normalization methods exist in the literature and the main procedures are presented
in the following.
4.5.1 Normalization Methods
Minimum-Maximum
This method normalizes indicators with a positive impact on sustainability by the
equation:
𝐼𝑁𝑖𝑗𝑡+ =
𝐼𝑖𝑗𝑡+ − 𝐼𝑖𝑗
+,𝑀𝑖𝑛
𝐼𝑖𝑗+,𝑀𝑎𝑥 − 𝐼𝑖𝑗
+,𝑀𝑖𝑛 (4.21)
Indicators with a negative impact on the other hand are normalized by the
equation:
𝐼𝑁𝑖𝑗𝑡− =
𝐼𝑖𝑗𝑡− − 𝐼𝑖𝑗
−,𝑀𝑖𝑛
𝐼𝑖𝑗−,𝑀𝑎𝑥 − 𝐼𝑖𝑗
−,𝑀𝑖𝑛 (4.22)
Where 𝐼𝑖,𝑗,𝑡+ and 𝐼𝑖,𝑗,𝑡
− are the values for indicator 𝑖 from the group of indicator 𝑗 in
year 𝑡 with positive and negative impacts on sustainability, respectively, while 𝐼𝑁,𝑖,𝑗,𝑡+ and
𝐼𝑁,𝑖,𝑗,𝑡− are the normalized positive and negative indicators, respectively. Overall, this

58
transformation results in a clear compatibility of different indicators, but it requires a
valid database in order to be carried out. (Zhou et al. 2012; OECD 2008)
Distance to a reference
This method calculates the ratio between the indicator and an external benchmark.
The normalized indicators are described in the following equation:
𝐼𝑁𝑖𝑗 = 𝐼𝑖𝑗
𝐼𝑖𝑗𝐵𝑒𝑛𝑐ℎ𝑚𝑎𝑟𝑘 (4.23)
Where 𝐼𝑖,𝑗𝐵𝑒𝑛𝑐ℎ𝑚𝑎𝑟𝑘
is benchmark for indicator 𝑖 from the group of indicators 𝑗. In
this case, it is possible that the normalized value is higher than 1, which indicates that
the performance of the factory is better than benchmark. (Zhou et al. 2012; OECD
2008)
Percentage over annual differences
Finally, the method “Percentage over annual differences” is the third main
normalization approach discussed in this chapter. It focuses on the development of the
indicators over time. Therefore, each indicator is transformed using the following
formula:
𝐼𝑁𝑖𝑗𝑡 =
𝐼𝑖𝑗𝑡 − 𝐼𝑖𝑗,𝑡−1
𝐼𝑖𝑗,𝑡−1 ∗ 100 (4.24)
The normalized indicator is dimensionless. Nevertheless, the disadvantage of this
method concerns the case 𝑡 = 𝑡𝑜. In that case, the indicators cannot be normalized by
the given equation and the data would be lost during the analysis. (Zhou et al. 2012)

59
4.5.2 Evaluation of Normalizing Method for Factory Sustainability
After reviewing the main normalizing methods, it is necessary to evaluate which
method fits best. This evaluation is not as straightforward as evaluating the weight of
the model. All of the described methods require a database or a set of reference data
in order to transform the indicators. However, since there is no database available for
the indicators, normalization is not possible for one data set of indicators. Nevertheless,
the tool created within this thesis does not only attempt to assess a single factory, but
also to compare different factories with each other and to evaluate the development
over time. These three different cases lead to the following conclusion:
Assessing a single factory → No normalization possible
Comparing different factories → “Distance to a reference”
Development of a factory → “Percentage over annual differences”
4.5.3 Implementation within the Framework
As mentioned above, the selection of the normalizing method depends on the
purpose of use. Regarding the comparison of factories the best method to use is the
“distance to a reference”. However, some aspects of this method have to be slightly
modified in order to meet the requirements within this thesis. As there is no large
database available, there is also no external benchmark value available. Although, it is
not possible to normalize one factory with a reference value, it is still possible to
compare two or more factories, by assigning the value 1 to the inferior factory for each
indicator and therefore making it a reference factory. The remaining factories are
evaluated relatively to that factory with a value between 0 and 1. The closer the value
is to 0, the better the performance of the factory according to that indicator.

60
The second case, where it is necessary to normalize the indicators, regards the
development of a factory over time. Here, the method “Percentage over annual
differences” provides the best comparison. In contrast to the other method, this method
can be implemented as described in the previous section, without modifying any
aspects. Nevertheless, if only few data sets are available it is recommended to use the
same normalization method as explained above, because the data for 𝑡 = 𝑡𝑜 would be
lost during the analysis.
4.6 Weighting of Sustainability Performance Indicators
The next step towards developing a sustainability assessment framework focuses
on weighting the indicators. Not only is it important to weight the indicators against each
other, but also with regard to the different industries (see chapter 2), and their impact
on factory performance. The main reason for weighting indicators is to determine the
individual importance of these indicators towards an overall goal. Although, this
purpose is understood intuitively, it remains difficult to determine weights with sufficient
accuracy (Krajnc, Glavič 2005). “The relative importance of the indicators is a source
of contention” (OECD 2008, p33). Therefore, a number of different weighting
techniques exist in the literature. Some are derived from statistical methods such as
the Data Envelopment Analysis and others from participatory methods like the Analytic
Hierarchy Process. Additionally, there is also a method that avoids the relative
importance of the indicators and weights them equally. In the next section, the theory
behind those weighting techniques is discussed and how they meet the criteria for
weighting factory assessment indicators.

61
4.6.1 Weighting Methods
Budget Allocation Process (BAP)
This weighting procedure determines the indicator weights based on expert
opinion. In general, the BAP has four different phases: first, experts in the field have
to be selected for the assessment. It is essential that the experts represent a wide
spectrum of knowledge and experience. Second, the selected experts have to allocate
a “budget” of one hundred points to the indicator set, based on their personal judgment
of the relative importance. In a third step weights are calculated as average budgets.
As an optional fourth step the procedure could be iterated until convergence is reached.
(Hermans et al. 2008; OECD 2008)
The main advantages of BAP are its transparent and simple application as well as
its short duration. On the other hand, it also contains several disadvantages: the
weights are fairly subjective and could reflect specific conditions that are not
transferable from one factory to another. (Zhou et al. 2012)
Analytic Hierarchy Process (AHP)
The Analytic Hierarchy Process is another participatory method similar to the
Budget Allocation Process. However, this method is far more complex and consists of
a mathematical approach. The AHP was developed by Saaty in the early 1970s and is
a widely accepted technique for multi-attribute decision making. Singh et al. used this
method to develop a composite sustainability performance index for the steel industry
(Singh et al. 2007), Krajnc et al. applied it to a case study on the sustainability
performance of the oil and gas industry (Krajnc, Glavič 2005) and Hermans et al.
implemented it to a limited extend in the road safety research (Hermans et al. 2008).

62
As a first step of this method it is necessary to translate a complex problem into a
hierarchy. The top element of the hierarchy is the overall goal of the decision model
and the criteria and indicators contributing to the decision are represented at the lower
levels. The second step requires a pair-wise comparison between each pair of
indicators. Experts have to judge “how important is indicator j relative to indicator i ?”.
Values on a scale from 1 to 9 are assigned to show the intensity of preference. The
larger the number, the greater the importance. (Saaty 1980) In the next step the results
are presented in a matrix to obtain the relative weights of each indicator. For a matrix
Q x Q, only Q-1 comparisons are necessary to find weights for Q indicators (OECD
2008). Finally, it is required to find the eigenvector with the largest eigenvalue from the
matrix. The eigenvector presents the weights and the eigenvalue measures the
consistency of each judgment. Inconsistency within this method can always occur,
because it is based on people’s beliefs and it is human nature that they may be
inconsistent. However, a consistency ratio of 0 indicates a perfectly consistent matrix,
while a ratio equal to 1 indicates meaningless or random judgments. A suggested rule-
of-thumb says that a ratio of less than 0.1 does not drastically affect the consistency of
the weights. (Saaty 1980; Singh et al. 2007)
Aside from the problem of possible inconsistency, the subjectivity of judgment is
another negative characteristic of the method. Each expert judges the indicators based
on his or her own knowledge and experiences. With that, the possible inconsistency is
also related to subjectivity (Hermans et al. 2008). Despite these disadvantages, AHP
is a comprehensive and popular technique and the information from well-selected
experts is valuable for weighting indicators. In contrast to most other methods AHP
allows both, quantitative and qualitative criteria to be entered into the model and it
assesses different levels of criteria.

63
Data Envelopment Analysis (DEA)
The Data Envelopment Analysis, developed by Charnes, Cooper and Rhodes
(CCR) in 1978, is a linear programming method that can be used for calculating the
relative efficiency of decision-making-units (DUM). In the context of this study each
factory can be considered as a DUM. So the efficiency of each factory 𝑘𝑜 is defined as
the ratio of the weighted sum of outputs, 𝑦𝑗, to the weighted sum of inputs, 𝑥𝑖, in the
following famous CCR model:
maxℎ𝑜 =
∑ 𝑤𝑗𝑦𝑗 𝑘𝑜 𝑛𝑗=1
∑ 𝑣𝑖𝑥𝑖 𝑘𝑜𝑚𝑖=1
, (4.25)
∑ 𝑤𝑗𝑦𝑗 𝑘 𝑛𝑗=1
∑ 𝑣𝑖𝑥𝑖 𝑘 𝑚𝑖=1
≤ 1, 𝑘 = 1,… , 𝐾, 𝑤, 𝑣 ≥ 0 (4.26)
Here the constraints require that the unknown weights (w’s and v’s) are assigned
to maximize the efficiency of each factory (El-Mahgary, Lahdelma 1995). To solve the
original CCR model for constructing composite indicators it has to be converted to a
linear form by neglecting the inputs and referring to each indicator as an output. A
general DEA model for constructing such indexes has been developed by Cherchye et
al. (Cherchye et al. 2007), where every factory 𝑘𝑜 is described by the following linear
programming problem:
𝐶𝐼𝑘 = 𝑚𝑎𝑥𝑤𝑗 ∑𝑦𝑗𝑘 𝑤𝑗
𝑛
𝑗=1
(4.27)
𝑠. 𝑡. ∑𝑦𝑗𝑙 𝑤𝑗 ≤ 1
𝑛
𝑗=1
, 𝑤𝑗 ≥ 0 (4.28)

64
In this case, if 𝑦𝑗𝑘 > 𝑦𝑗𝑙 then the factory 𝑘 performs better then factory 𝑙. The model
results in a set of indicator weights 𝑤𝑗 that maximizes the indicator value 𝐶𝐼𝑘 for each
factory. Therefore, the weights may be different for factory 𝑘 than for factory 𝑙. The
weights are only restricted to be non-negative as stated by the second constraint of the
model.
The DEA is different compared to the other weighting methods. The model results
in factory-specific weights instead of one set of weights for all factories. This is a
disadvantage, because factories can only be ranked and compared, if they are based
on the same set of weights. Furthermore, in this approach the weights do not sum up
to 1, which makes the comparison with other weighting methods difficult. Nevertheless,
this method has already been used for a number of indices such as the Technology
Achievement Index (Cherchye et al. 2007). The strength of the method lies in the fact
that the optimal weights are directly derived from the data and that no normalization is
needed.
Another approach to implement the DEA is proposed by Hermans et al. In order to
develop a road safety performance index the authors combine the DEA model with the
BAP model. In that case the weights are bounded by the BAP and the authors were
able to develop one model for all DUMs. The DEA assesses then the efficiency.
(Hermans et al. 2008) Yang and Kuo on the other hand combine AHP for weighting and
DEA for measuring the efficiency (Yang, Kuo 2003).
Benefit-of-the-doubt (BOD)
The benefit-of-the-doubt presents another application of the DEA in the field of
composite indicators. In contrast to the original DEA model, BOD evaluates the relative
performance of the factories and not the efficiency (Cherchye et al. 2004). However, it
65
is based on the same model and follows the same process. The composite index 𝐶𝐼 in
this case is calculated as the ratio between the actual performance of the factory and
the external benchmark:
𝐶𝐼 =∑ 𝐼𝑆𝑗 𝑗
∗ 𝑤𝑗
∑ 𝐼𝑆𝑗𝐵𝑒𝑛𝑐ℎ𝑚𝑎𝑟𝑘
𝑗 ∗ 𝑤𝑗 (4.29)
Where 𝐼𝑆𝑗 is the sub-index for the group of indicators 𝑗, while 𝐼𝑆𝑗𝐵𝑒𝑛𝑐ℎ𝑚𝑎𝑟𝑘 is their
benchmarks and 𝑤𝑗 the corresponding weight (Zhou et al. 2012). Whereas, the sub-
indicator 𝐼𝑆𝑗 is calculated by:
𝐼𝑆𝑗 = ∑𝐼𝑁𝑖𝑗 ∗ 𝑤𝑖𝑗
𝑚
𝑖=1
(4.30)
𝑠. 𝑡. ∑𝑤𝑖𝑗 = 1,
𝑚
𝑖=1
𝑤𝑖𝑗 ≥ 0 (4.31)
Where 𝑤𝑖,𝑗 is the corresponding weight of each indicator 𝑖 within the group of
indicator 𝑗 and reflects the individual importance of each indicator during the
sustainability assessment of the factory to maximize the value for CI. The specific
weights can be determined by solving the same linear programming problem from the
original DEA model (see equation 4.25).
Since BOD can be seen as a specialized version of the original DEA model, the
DEA’s advantages and disadvantages also apply for this method. However, this method
has already been used for a number of indeces. It was originally proposed in the context
of a macroeconomic performance assessment by Melyn and Moesen in 1991 and later
adapted by Cherye and Kuosmann for a cross-country assessment of human
development and sustainable development performance (Cherchye et al. 2004).

66
Equal Weighting (EW)
As its name already indicates, the same weight is assigned to each indicator. This
implies that all indicators have the same importance and that no statistical or
participatory approach is used to determine the weights. The value of the weights is
simply calculated by 1
𝑙 where 𝑙 is the number of all indicators and 1 represents the sum
of all weights (Zhou et al. 2012; Hermans et al. 2008).
Although this method appears too simple from a scientific point of view, several
composite indicators like the Environmental Sustainability Index or the European
Innovation Scoreboard are constructed by equal weighting (Hermans et al. 2008). The
main disadvantage is the fact that is does not offer any insights on indicator importance
and it does not reflect reality. However, this method can be considered as a solution in
case no other weighting method presents valid results.
4.6.2 Evaluation of Weighting Method for Factory Sustainability
In order to analyze which weighting method is best fitted and suitable for a
framework to assess factory sustainability it is required to develop specific criteria that
has to be fulfilled.
Quantitative and qualitative data: Since the set of indicators that are used for
this framework may be extended by quantitative indicators it is necessary that
the weighting method can handle both types of data.
Objectivity: Indicators should be weighted without bias in order to be
meaningful and to decrease personal preferences.
Insights into indicator importance: The overall goal of the tool developed within
this study is to assess the sustainability performance of factories. Therefore,

67
it is important that indicators reflect their individual importance towards factory
sustainability.
Transferability: The developed tool is supposed to allow the user to compare
factories with each other. In order to do so, it is required that the indicator
specific weights are always valid and transferable from factory to factory.
No need for a database: Due to the fact that there is no large accessible
database for each indicator, the weighting has to be possible without including
a lot of data.
In order to identify a weighting method the methods introduced previously are
presented in a structured way in Table 4.6, where each method is assessed towards
the fulfillment of the before derived criteria:
Table 4.6: Evaluation of weighting methods
Method Quantitative/ qualitative
data Objectivity
Insights in indicator
importance Transferability
No need for a
database
BAP
+ - O O +
AHP + O + + +
DEA O + O - -
BOD + + O - -
EW + - - + +
+ = Criteria fulfilled O = Fulfilled with restriction - = Criteria not fulfilled
A method fulfilling all the criteria cannot be identified. However, of all the
reviewed weighting methods, the AHP gives the best results. It is therefore used to
weight the different indicators in the next section of this chapter.

68
Industry
Industry
Industry
4.6.3 Implementation within the Framework
The first step towards implementing the AHP requires the formulation of an AHP
model, which synthesizes the composite sustainability performance index into a
systematic hierarchal structure. The overall goal of the problem, to develop a composite
sustainability performance index, is represented at the top level of the hierarchy as
shown in Figure 4.3. The three dimensions of sustainability, which are identified to
achieve the goal form the second level. The third level consists of the various key
performance indicators, which are grouped with respect to the three dimensions and
shall be weighted specifically to the industry that is being evaluated.
Level 1
Level 2
Level 3
Indicator are weighted industry specific
In the next step, all three levels have to be assessed using the AHP approach of
pair-wise comparisons according to their impact on the next level. A group of four
sustainability experts is asked to judge the indicators by estimating a preference factor
of each indicator relative to another. The preference factors follow a scale from 1 to 9,
where 1 indicates equality between the two indicators and 6 for example means that
one indicator is six times more relevant than the other. However, the evaluation has to
be carried out in an industry specific manner for each one of the six main industries
Figure 4.3: AHP model for a composite performance index
Composite Sustainability Performance Index
Environemt
Iji Iji ...
Social
Iji Iji ...
Economic
Iji Iji ...

69
that have been identified in chapter 3. For this reason, the assessment team that is
asked to carry out the evaluation is composed of experts from different sustainability
leading companies, like BMW, Cisco, and AkzoNobel, for example. This ensures that
the evaluation is practically oriented and comprehensive. The exact questionnaire that
was distributed to the experts is shown in the appendix A1.
The process of pair-wise comparisons and relative weight evaluation is presented
in the following based on an example considering the environmental dimension within
the basic materials/resources industry. The pair-wise comparison matrix for this
example is shown below.
Table 4.7: Pair-wise comparison matrix for evaluation of estimated weights of environmental indicators
Energy Material Water Waste GWP AP
Energy use 1,00 2,00 3,00 3,00 1,00 2,00
Material use 0,50 1,00 3,00 1,00 0,50 1,00
Freshwater use 0,33 0,33 1,00 2,00 0,50 1,00
Waste 0,33 1,00 0,50 1,00 0,50 2,00
GWP 1,00 2,00 2,00 2,00 1,00 2,00
AP 0,50 1,00 1,00 0,50 0,50 1,00
The first column of the matrix includes the indicators and is provided to the expert.
The second column is filled in by judging indicator 2, 3,..n with respect to indicator 1.
Then the process of comparison is repeated for all other columns of the matrix.
The next step requires a normalization of the weights. Therefore each column of
the matrix in Table 4.7 is normalized by dividing each indicator weight by the sum of all
relative weights in the column and then averaging them. The results are presented in
Table 4.8.

70
Table 4.8: Normalized values of environmental indicators
Energy Material Water Waste GWP AP
Average weight
Energy use 0,27 0,27 0,29 0,32 0,25 0,22 0,27
Material use 0,14 0,14 0,29 0,11 0,13 0,11 0,15
Freshwater use 0,09 0,05 0,10 0,21 0,13 0,11 0,11
Waste 0,09 0,14 0,05 0,11 0,13 0,22 0,12
GWP 0,27 0,27 0,19 0,21 0,25 0,22 0,24
AP 0,14 0,14 0,10 0,05 0,13 0,11 0,11
After calculating the weights, it is required to check the consistency of the
judgment. Inconsistency is likely to occur when the expert exaggerates or makes errors
during the pair-wise comparison. For example, if material use is preferred over energy
use and material use is not as important compared to waste, consequently waste
should be more preferred over energy use. In case this logical chain is not followed,
inconsistencies will occur. As stated above, the consistency index ranging from 0-1 can
be applied in this scenario to test for discrepancies in the evaluation and weighting of
the indicators. To check for consistency it is necessary to find a vector by multiplying
the pair-wise comparison matrix with the weight vector.
(
1.0 2.0 3.00.5 1.0 3.00.33 0.33 1.00.33 1.0 0.51.0 2.0 2.00.5 1.0 1.0
3.0 1.0 1.01.0 0.5 1.02.0 0.5 1.01.0 0.5 2.01.0 1.0 2.00.5 0.5 1.0)
∗
(
0,270,150,110,120,240,11)
=
(
1,730,970,720,751,490,69)
(4.32)
In the next step the resulting vector has to be divided by the weights vector.
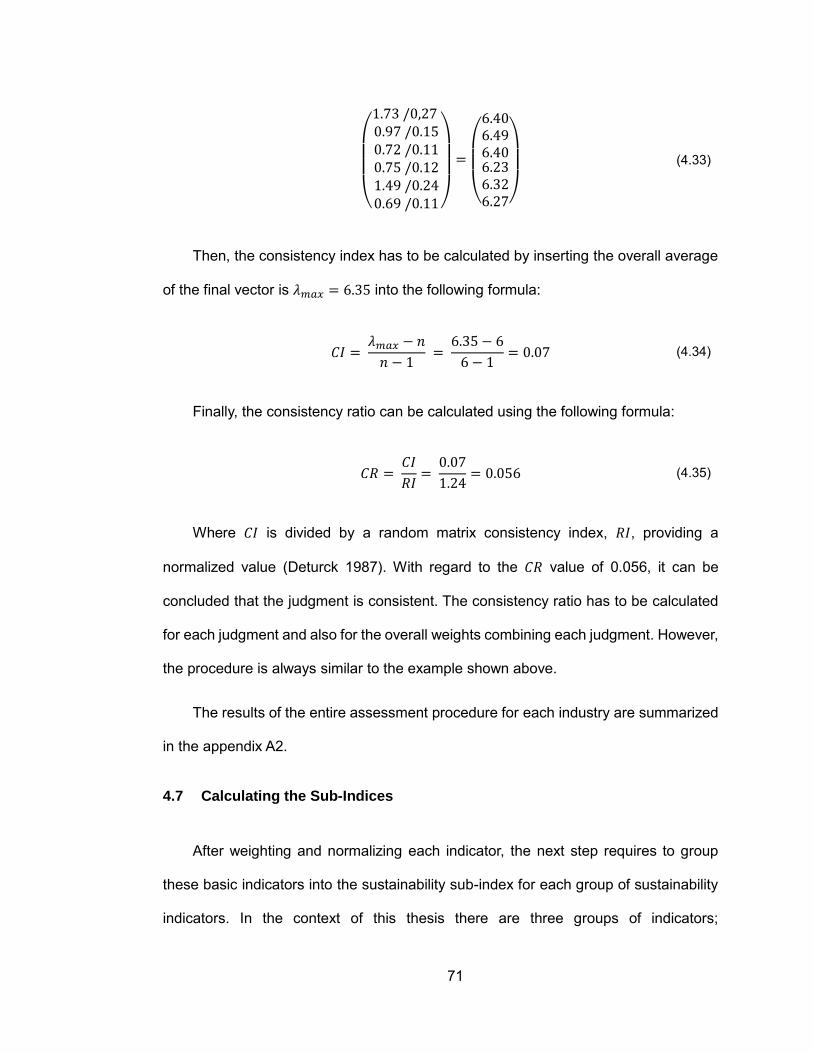
71
(
1.73 /0,27 0.97 /0.150.72 /0.110.75 /0.121.49 /0.240.69 /0.11)
=
(
6.406.496.406.236.326.27)
(4.33)
Then, the consistency index has to be calculated by inserting the overall average
of the final vector is 𝜆𝑚𝑎𝑥 = 6.35 into the following formula:
𝐶𝐼 = 𝜆𝑚𝑎𝑥 − 𝑛
𝑛 − 1 =
6.35 − 6
6 − 1= 0.07 (4.34)
Finally, the consistency ratio can be calculated using the following formula:
𝐶𝑅 = 𝐶𝐼
𝑅𝐼= 0.07
1.24= 0.056 (4.35)
Where 𝐶𝐼 is divided by a random matrix consistency index, 𝑅𝐼, providing a
normalized value (Deturck 1987). With regard to the 𝐶𝑅 value of 0.056, it can be
concluded that the judgment is consistent. The consistency ratio has to be calculated
for each judgment and also for the overall weights combining each judgment. However,
the procedure is always similar to the example shown above.
The results of the entire assessment procedure for each industry are summarized
in the appendix A2.
4.7 Calculating the Sub-Indices
After weighting and normalizing each indicator, the next step requires to group
these basic indicators into the sustainability sub-index for each group of sustainability
indicators. In the context of this thesis there are three groups of indicators;

72
environmental, economic, and social and therefore also three sub-indices, respectively.
Sub-indices can be derived as shown in the following equation:
𝐼𝑆𝑗 = ∑𝑤𝑗𝑡
𝑛
𝑗𝑖
∗ 𝐼𝑁𝑗𝑖 (4.36)
𝑠. 𝑡. ∑𝑤𝑗𝑖
𝑛
𝑗𝑖
= 1, 𝑤𝑗𝑖 ≥ 0 (4.37)
Where 𝑆𝐼𝑗 is the sustainability sub-index for each group of indicators 𝑗. Since the
framework uses the AHP weighting method, the first constraint restricts the sum of all
weights 𝑤𝑗𝑖 of indicator 𝑖 for the group of sustainability indicators 𝑗 to be equal to 1.
4.8 Combining the Sub-Indices into the Composite Index
As a final step it is required to combine all three sub-indices into one overall
composite sustainable performance index. This index can be calculated as shown in
the following equation:
𝐶𝐼 = ∑𝑤𝑗
𝑛
𝑗=1
∗ 𝐼𝑆𝑗 (4.38)
𝑠. 𝑡. ∑𝑤𝑗
𝑛
𝑗=1
= 1, 𝑤𝑗 ≥ 0 (4.39)
Where 𝐶𝐼 is the overall sustainability composite index for the factory that has been
assessed.

73
4.9 Final Framework of the Factory Sustainability Assessment Tool
Reviewing the concept of the framework that is used to assess factory
sustainability in this thesis shows that three different cases can be evaluated using this
assessment tool.
Figure 4.4: Scheme of the final framework
First, it is possible to consider only a single factory. The collected data for this case
can be judged according to the results of section 4.4, but since there is no reference
data available for each indicator, normalization cannot be performed. This process
ends here with the presentation of the results. The other case regards the comparison
of two or more factories. After collecting the relevant data for each indicator, they can

74
be normalized by using the method “distance to a reference”, where the value 1 is
assigned to the worst factory for each indicator. In a next step it is possible to weight
the data according to their importance towards an overall goal. Afterwards the
normalized and weighted indicators can be combined to a sub-index and then to an
overall composite index. The third case considers the development of a factory over
time. This case is similar to the case “comparison of factories”. The only difference is
that the normalization step uses the method “percentage over annual differences“. This
is the best suited method, because only one factory is considered over time.

75
CHAPTER 5 – IMPLEMENTATION OF THE TOOL
After developing the framework of the tool in the previous chapter, it is now
required to convert it into a computer-based tool. For a user friendly digital assessment
and data processing it is decided to implement the tool in MS Excel by using VBA.
Therefore, the first section of the chapter presents the programming environment Visual
Basic for Application and its characteristics, in order to show that it satisfies all needs.
In the second section, the implementation and structure of the tool will be presented in
more detail.
5.1 Characteristics of Visual Basic for Application
Visual Basic for Applications (VBA) is the programming environment for Microsoft
Office and its associate applications. It allows object-oriented programming by using a
modern language that resembles most of the popular programming languages such as
Pascal or C. VBA is used for the same reasons macros are used, but it offers a finer
degree of control and more possibilities than macros alone (Microsoft 2013). Moreover,
it was decided to implement the tool in VBA because of the following characteristics:
Stepwise processing: The input and processing of the data is complex and
should be performed in several steps. VBA simplifies the coordination and the
process.
For example: Each dimension has its own input mask.
Error prevention: The data has to be entered in a specific way and the tool
should prevent the user from making mistakes. VBA can ensure to accept only
a certain format.
For example: The input mask cannot be closed before the user has entered
all data.

76
Error messages: When the user makes an error, the error and the possible
remedy should be displayed with individual information and instructions for the
user. This ensures a minimal rate of errors.
For example: A message box will be displayed to show the user which
information is missing in order to match the input mask.
Automatic analyses: The tool calculates sub-indices and a composite
sustainability index. Moreover, the results should be presented graphically
based on different charts. This requires an iterative calculation process, as
well as a process to create and format the charts. These tasks can be
automated by using VBA to write explicit instructions for Excel.
For example: Any company from the database can be evaluated at the touch
of a button.
These characteristics indicate that by implementing the tool in VBA, it can easily
be used on any computer with an MS Excel installation without the need of
sophisticated programming experience. Furthermore, MS Excel is usually available at
any company.
5.2 Implementation of the Tool
The start page of the tool is shown in the figure below. It is simply structured with
clear symbols and colors. It is divided into the left side with buttons for data entry and
the right side with higher level functions and buttons for the data processing. These
buttons and functions are described in more detail in the next sections of this chapter.

77
Figure 5.1: Start page of the tool
While Figure 5.1 shows the user view of the tool in Excel, Figure 5.2 presents the
VBA structure behind the tool. It indicates that the tool consists of 6 tables and 29 user
forms. With VBA it is possible to write a program code for each object (buttons, user
forms etc.). By selecting the object it is possible to get access to the code and to edit it
on the right side of the VBA window (see Figure 5.2).
Figure 5.2: VBA structure of the tool

78
5.2.1 Implementation of the Data Input
The data input is divided into four different steps. As mentioned above, the start
page of the tool in Figure 5.1 shows all four buttons for the input at the left side. One
for the general factory information and one for each dimension.
The input mask for the general information is presented in Figure 5.3. Besides the
start and end date of the evaluation period, the user has to insert general information
about the company (name, size of workforce and number of produced units).
Additionally, it is asked in which sector and industry the company is operating. Here the
user can choose between the sectors identified in chapter 3. This decision influences
the weighting in the next steps.
Figure 5.3: General factory information input mask
After entering all information, the user has to confirm the input and close the mask
by pushing the button “OK” and all information are automatically stored in a general
database. The following figure presents the program code for this process.

79
Figure 5.4: VBA code to store information in database
In a next step the user has to enter data into the input mask for the environmental
dimension (see Figure 5.5). Starting with the first indicator to the last one. This mask is
similar to the input mask described above. After confirming the input, a code
comparable to the code in Figure 5.4 will store the information in the database at the
correct position.

80
Figure 5.5: Environmental dimension input mask
Additionally, the user has to complete the data entry for the social and economic
dimensions accordingly.
Generally, the tool provides assistance to avoid entry errors. Some entry fields
allow only integers or strings to prevent errors during calculation. Moreover, it is not
possible to close the input mask before the user entered all information.
5.2.2 Implementation of the Data Processing
Besides the aspect of data entry, the tool considers also the aspect of data analysis
and evaluation. By pushing the button “Results” on the start page another user form
opens and the user can select one out of three different cases:
Case 1: Assessing one factory
The first case assesses only a single factory. The user form provides checkboxes
to select a factory from the database. The selection is made based on the name of the
company and also on the date of the evaluation period. Since the same company might
be listed more than once, it is necessary to search the database for two variables in

81
order to make a clear identification. The following program code shows the iterative for-
loop, used to combine both variables.
Figure 5.6: VBA code to combine two variables
After selecting the desired company, the respective values have to be analyzed
and presented. In order to transfer the correct data it is required to search the database
for both variables, company name and date. The code in Figure 5.7 presents the code
for this process. At first the two search variables company name and date are declared
(search, searchc). Next, the database is searched iteratively with a do-while loop for
an entry with the correct company name in one column and with the correct date in the
next column (offset) which matches the second search variable. If an entry is found the
respective database entry is returned otherwise a massage box with an error is
displayed.

82
Figure 5.7: VBA code to search for two variables
Finally, the results will be presented in a structured and clear overview, as shown
in Figure 5.8. The button “Print Results” will automatically format the page and print it
out on the standard printer.

83
Figure 5.8: Presentation of assessment results
Case 2: Comparing different factories
In this case the user has the possibility to assess two or more factories at the same
time and to evaluate them as alternatives against each other. As in case 1, the user
can select the companies from the database by entering the name and the date.
Therefore, this case uses similar codes as shown in Figure 5.6 and Figure 5.7. The
data processing for this case is performed automatically by the tool and can be divided
into three steps:
a) Creating a structured overview: This type of overview is shown in Figure 5.8
and will be created for each factory that is being assessed. It includes all
absolute indicators and calculates for adjusted indicators per employee or per
unit of production.

84
b) Normalizing and comparing the indicators: This step results in a spider chart
for each dimension to visualize the results. Figure 5.9 presents an example
for the environmental dimension. It shows the distribution of the assessment
results and enables the identification of strengths and weaknesses of the
alternative factories compared to each other.
Figure 5.9: Presentation of assessment results by indicators
c) Calculating sub-indices and an overall index: The last step calculates an index
for each dimension by weighting and aggregation of the results as described
in the previous chapter. The figure below shows how the tool visualizes the
results in terms of the three dimensions.

85
Figure 5.10: Presentation of assessment results by dimensions
Finally, it combines the results to one overall index. Based on these numbers
the user is able to determine which factory has the best sustainability
performance in comparison to the other factories.
Case 3: Assessing a factory over time
The third case concerns the assessment of one factory over a period of time. The
user can select different evaluation periods for the same factory and analyses the
results. Generally, the data entry as well as the data processing is very similar to the
second case. Therefore it is not presented any further.

86
CHAPTER 6 - CASE STUDY: AUTOMOTIVE INDUSTRY
After implementing the framework into a computer based tool, it has been applied
to a practical case study in order to demonstrate its application and effectiveness. The
case study is divided into two parts. The first part focuses on the comparison of different
factories (Case 2), by analyzing the BMW plant in Dingolfing, Germany and the Daimler
plant in Sindelfingen, Germany. The second part of this chapter considers the
assessment of a factory over time (Case 3). In this case the results of BMW are
compared for the year 2010, 2011 and 2012. However, the assessment of a single
factory (Case 1) is not considered in this chapter, because it is already included when
Case 2 and/or Case 3 are performed. The entire case study is carried out by using the
developed sustainability assessment tool and data based on public records.
6.1 Comparison of different Factories
In this section of the case study the sustainability performance of two different
factories from the automotive industry are compared with each other. One factory that
is being assessed is the BMW plant in Dingolfing. This plant belongs to the BMW Group
since 1967, employs a workforce of around 18,500 and produces about 1,500 cars per
day. The other plant is located in Sindelfingen and was founded by the automotive
producer Daimler in 1915. The annual production of this site is estimated to be 424,609
and it employs a workforce of around 25,947.
For this case study the data of the calendar year from 1 January to 31 December
2011 are considered. All data and information are gathered from public records e.g.
environmental declarations, webpages and sustainability reports. The data entry and
data processing is then carried out by using the developed assessment tools.

87
According to the data processing process described in chapter 5, the first step of
this analysis results in a structured overview including all indicators for each production
site. Figure 6.1 and Figure 6.2 illustrate the results.
Figure 6.1: Presentation of assessment results for BMW Dingolfing
Figure 6.2: Presentation of assessment results for Daimler Sindelfingen

88
In a next step of the analysis the results of each indicator are illustrated in a spider
chart and are compared for both sites. The results of this comparison are presented in
the following three figures. The closer the value is to 0 the better the performance.
Figure 6.3: Presentation of assessment results by environmental indicators
Figure 6.4: Presentation of assessment results by social indicators

89
Figure 6.5: Presentation of assessment results by economic indicators
This comparison demonstrates that the BMW plant performs better than the
Daimler plant in terms of most environmental indicators, expect for the material use.
Also it can be determined that the energy use and the waste generation are rather
similar for both sites. With regard to the social dimension it is striking that the BMW
plant performs significantly better in terms of working accidents, safety trainings and
employee attrition rate. The Daimler plant on the other hand performs slightly better in
terms of hazardous material and training and education. The economic dimension is
particularly interesting regarding the two indicators investment in R&D and
expenditures on EHS compliance. While the Daimler plant invests significantly more in
R&D, the BMW plant has lower costs in terms of EHS compliance.
In order to make a general statement about the sustainability performance of both
production sites, the results of each indicator have to be weighted and combined into
a composite index. The results of this process are presented in the following table.

90
Table 6.1: Sub-indices and overall index for the comparison of the production sites Dingolfing and Sindelfingen
Company Environment
Sub-Index Social
Sub-Index Economic Sub-Index
Overall Index
BMW Dingolfing
0.87 0.83 0.75 0.81
Daimler Sindelfingen
0.95 0.96 0.91 0.93
It can be seen that the BMW plant Dingolfing performs better in all areas. However,
the overall index of 0.81 compared to the index of 0.93 shows that the differences are
not as significant and both production plants are in the same range. The results are
also visualized in Figure 6.6.
Figure 6.6: Presentation of assessment results by social indicators
Finally, it can be concluded that the comparison of different factories provides clear
results and presents them in a comprehensible form. Since BMW is the sustainable
leader in the automotive industry, it was expected for the BMW plant to perform better.
However, there are also indicators where the Daimler plant achieved better results.
This might be interesting for a factory manager of either one of the two companies in

91
order to improve the performance in the future. On the other hand these results are
also interesting for any investor with a focus on sustainable investing. In this case the
analysis clearly supports the decision to invest in the BMW plant in Sindelfingen.
6.2 Assessment of a Factory over Time
In this section, the sustainability performance of the company BMW is assessed
from 2010 to 2012. It is a leading company in terms of sustainability and has been
awarded with several prizes. The BMW Group was named for example best automotive
producer in the Dow Jones Sustainability Group Index several times in a row and it is
ranked at GRI level A+, which means that BMW meets the maximum requirements
detailed by the GRI guidelines.
For this case study the evaluation period for all three periods is again the calendar
year from 1 January to 31 December. For the most part the data were taken from the
BMW Sustainability Report 2012, because all data in this report were audited and
verified by a third party and it is therefore a reliable source. In this case the data
includes the 17 main production sites e.g. Landshut, Leipzig and Munich and presents
an average over all of them.
After gathering and entering the data for each evaluation period into the computer
based tool, the data processing is performed. According to chapter 5 the first step of
the data processing results in a structured overview. The following three figures
illustrate the results and provide detailed information for each evaluation period.

92
Figure 6.7: Presentation of assessment results for BMW 2012
Figure 6.8: Presentation of assessment results for BMW 2011

93
Figure 6.9: Presentation of assessment results for BMW 2010
The next step of the data processing considers the different results for all indicators
and compares them with each other for each evaluation period. The results are shown
in Figure 6.10, Figure 6.11 and Figure 6.12.
Figure 6.10: Presentation of assessment results by environmental indicators for BMW from 2010 to 2012

94
Figure 6.11: Presentation of assessment results by social indicators for BMW from 2010 to 2012
Figure 6.12: Presentation of assessment results by economic indicators for BMW from 2010 to 2012
The spider charts present clearly the development of each indicator. With regard
to the environmental dimension it can be seen that the sustainability performance for

95
almost every indicator improves steadily over time. Only the indicators acidification
potential and waste generation show minor differences. Regarding the social
dimension it is significant that the employee attrition rate has increased from 2011 to
2012. Furthermore, it is striking that the safety trainings show a discontinuous
development. Additionally, all indicators concerning the economic dimension are rather
unremarkable and present only minor differences.
In a next step of this case study it is important to analyze the weighted and
combined sub-indices. The indices are presented in Table 6.2.
Table 6.2: Sub-indices and overall index for the comparison of BMW from 2012 to 2010
Company Environment
Sub-Index Social
Sub-Index Economic Sub-Index
Overall Index
BMW 2012 0,80 0,82 0,94 0,84
BMW 2011 0,87 0,89 0,93 0,89
BMW 2010 0,99 0,96 0,99 0,97
Recalling that the closer the index is to 0 the better the sustainability performance,
it can be determined that the environmental and social indices have improved
significantly over time. However, the economic dimension shows a minor difference.
Here the index for the year 2011 is slightly better than the index for the year 2012.
Nevertheless, the overall composite sustainability index indicates again the continuous
improvement of the sustainability performance over the last three years. The results
are also visualized by the sustainability assessment tool (see Figure 6.13).

96
Figure 6.13: Presentation of assessment results by dimensions for BMW from 2010 to 2012
As a conclusion of this case study it can be summarized that the general
development of the sustainability performance of BMW demonstrates a continuous
improvement over the last three years. However, it shows also that in the future
production managers at BMW should focus more on economic indicators and also on
the employee attrition rate.
6.3 Results of the Case Study
The case study has been carried out without any significant complications. The
results of the study are clearly visualized and provide detailed information that might
be used by factory managers as well as investors to support decisions and to guide
future activities.
However, the data collection based on public records required more time than
expected. The general sustainability report, a report about the main production sites of
a company, offered all data needed for this study. Therefore, the second part of the

97
case study was completed within 90 minutes, including the data collection, data entry
and data processing. The first part of the case study on the other hand was more time
consuming. It has been proven more difficult to gather data for an individual production
site than for all sites combined. However, the environmental declarations are very
useful and provide data for each environmental indicator and also for some social and
economic indicators. According to the Eco Management and Audit Scheme (EMAS), a
new environmental policy instrument developed by the United Nations, these
environmental declarations are required for each production site in order to be certified
by EMAS. Therefore, the use and popularity of such environmental declarations is
increasing steadily. Other indicators had to be sought in press releases or webpages.
Nevertheless, there were still some indicators such as the number of working accidents
that had to be derived from the general sustainability report, by calculating the share of
the total number of working accidents for the specific production site based on its size.
However, this information is not completely accurate.
Overall it can be concluded that data collection for large companies with a focus
on sustainability is significantly easier than for small and individual production sites.
However, since sustainability is attracting more and more attention it becomes also
more important for companies to be certified by environmental audits such as EMAS
and therefore they have to publish more figures and data in the future. For now it cannot
be guaranteed to find all data on public records, but there is always the option to get in
touch with the sustainability contact person in order to gather more information about
a specific production site.

98
CHAPTER 7 - VERIFICATION OF THE USABILITY
Besides testing the developed factory assessment tool on its functional capability
and effectiveness, it needs to be tested on its usability as well. In order to get feedback
for initial improvements, the tool is tested under real conditions in collaboration with
different test users. Thus the first section of the chapter describes the development of
a suitable questionnaire. In the second part, the test persons use the questionnaire to
evaluate the software based tool. The results are then analyzed and discussed in order
to optimize the assessment tool.
7.1 Developing a Usability Questionnaire
Questionnaires are the most frequently used tool for the evaluation of software
usability. The goal of the evaluation is to detect weaknesses in the tool and to develop
suggestions for improvement. In order to achieve this, the test users have to answer all
questions based on their personal experience with the tool.
7.1.1 Usability and ISO Norm 9241
The term usability has been defined by many researchers in many different ways.
However, the International Organization for Standardization (ISO) established an
official standard on usability. ISO 9241 defines usability as “the extent to which a
product can be used by specified users to achieve specified goals with effectiveness,
efficiency, and satisfaction in a specified context of use” (p.2). Additionally, ISO 9241
part 10 formulates seven principles regarding the description, design and evaluation of
software:
Suitability for the task
99
Self-descriptiveness
Controllability
Conformity with user expectations
Error tolerance
Suitability for individualization
Suitability for learning
These principles can only be applied as general guidelines when assessing a
software. They are still too vague to be considered as an evaluation instrument on its
own.
However, one approach that supports usability assessment according to ISO 9241
is the ISONORM 9241/10 questionnaire. It consist of 35 bipolar items, five for each of
the seven principles. The test persons judge each statement with values on a scale
from - - - (very negative) to +++ (very positive) (Prümper, Michael 1993).
7.1.2 Structure and Layout of the Questionnaire
Based on the ISONORM 9241/10, a questionnaire for the evaluation of the rapid
factory assessment tool is being developed. It consists of the same seven principles
and uses the same rating scale. However, since the original ISONORM 9241/10 is
usually used for more complex and larger software, certain bipolar items have to be
adjusted or simply neglected in order to meet the demands of the rapid factory
assessment tool and to decrease the complexity. Thus, the final questionnaire contains
only fourteen items instead of thirty five; two for each principle.

100
The basic layout of the questionnaire is shown in the figure below. Each block
contains the name of the principle, the general topic, the bipolar items and a rating
scale. The complete questionnaire can be found in the appendix A3.
Error tolerance
Does the tool ensure a minimal rate of errors?
The tool… Agreement to the statement The tool…
does not prevent the user from making errors.
prevents the user from making errors.
provides error messages which are difficult to understand.
provides error messages which are easy to understand.
Figure 7.1: Layout of the usability questionnaire
7.2 Testing the Factory Assessment Tool
The tool has to be tested under real conditions in order to obtain meaningful
results. As the purpose of the tool specifies that any external user should be able to
work with the tool, it is not necessary to test the tool in collaboration with a real factory.
Therefore, the evaluation of the tool is carried out based on the case study from
the previous chapter. Each test user is given the task to enter the data of the company
BMW for the year 2012 based on its sustainability report. Furthermore, they have to
compare the results with the results from the years 2010 and 2011 from the database
(see section 6.2). It is assumed that the test user has never seen the tool before and
works without further help.
Once the task is completed, the test user has to answer the usability questionnaire.
Every question has to be answered based on the personal experience during the case
study. For a comprehensive evaluation all questions need to be answered.
- - - - - - -/+ + ++ +++

101
7.3 Outcome of the Test
The test has been carried out without any significant complications. Each test user
was able to enter the data for each indicator and to analyze them as instructed. It was
noticeable that it was fairly time consuming to convert the values from the sustainability
report into the right format. Nevertheless, each test user was able to complete the tasks
within 45 minutes, including the data entry and data processing. Thus, it is proved that
the goal of a rapid assessment tool is achieved.
After completing the tasks each test user answered the usability questionnaire.
The results of this survey are illustrated in Figure 7.2.
Figure 7.2: Presentation of testing results
The evaluation of the questionnaire demonstrates that the results for six out of
seven principles are more than satisfactory. The principles Suitability for Learning,
Conformity with User Expectations, Self-descriptiveness, Controllability, Error
Tolerance and Suitability for the Task are already in the very positive area. In contrast

102
to these six principles, the results for the principle Suitability for Individualization are
rather negative. Since the test users were no VBA-experts they stated that it is very
complicated to expand the tool for new tasks or to adapt it to the individual working
style.
A subsequent feedback discussion with the test users revealed further suggestions
for improvement such as introducing a tabindex and an overview of the different types
of industries. In summary, testing the practical case study in collaboration with different
test users provided new insights and also possibilities to improve the usability of the
tool.

103
CHAPTER 8 - SUMMARY AND CONCLUSIONS
In the beginning of the study, the basic concept of sustainability as well as the
history of its development was presented. Additionally, a comprehensive literature
review in the field of sustainability assessment categorized existing sustainability
frameworks. It can be concluded that integrated sustainability assessment tools are
available at different levels e.g. global, national, company and they are either
developed by a company or by a superordinate organization. However, sustainability
assessment at factory level is still lagging behind and is not considered sufficiently.
Besides the aspects of sustainability, the study looked also at the factory aspect.
In the next phase, the study presented a basic description of factories and illustrated
their importance in terms of sustainability, based on energy use and CO2 emissions. It
was pointed out that the manufacturing industry is a main consumer of natural
resources and a main producer of adverse environmental impacts. Based on the high
responsibility of factories towards their environment, the need for a factory specific
sustainability assessment tool was explained. Moreover, it was pointed out that the
influence on the environment varies depending on the specific type of industry. In this
context, different industrial sectors have been classified as well within this phase.
Based on this situation a framework for a tool at factory level was developed in
this research. The framework has a hierarchical structure with the three dimensions of
sustainability at the highest level, followed by themes and indicators for each
dimension. It was demonstrated that the traditional view in the literature considers three
dimensions: social, environmental and economic. This view was adapted for the
framework. However, the definition of suitable themes and indicators required more
effort. The main sustainability assessment tools that have been identified in the

104
literature review had to be analyzed and compared in order to derive suitable themes
and indicators for the framework.
Furthermore, the framework includes a model to calculate an overall composite
index. The development of this index followed various steps. First, the indicators had
to be judged whether they support or harm a company’s sustainability. Then, they had
to be normalized in order to avoid adding up incompatible data sets that can lead to
inaccuracies. Therefore different normalization methods were analyzed and selected.
It was concluded that a single set of data for one factory cannot be normalized, because
currently there is no standardized scale for the assessment values available. However,
the method “Distance to a reference” was selected for the case when different
companies are compared to each other and the method “Percentage over annual
differences” was selected for the case when one factory is being assessed over time.
In the next step it was necessary to weight each indicator based on the type of industry
in order to obtain a meaningful evaluation of the sustainability performance of factories
within each industry. After analyzing and evaluating different weighting methods based
on the fulfillment of criterias is was decided to implement the AHP-method. This method
provides insights into indicator importance, handles quantitative and qualitative data, is
transferable from factory to factory and does not require a large database in order to
be calculated. However, since the weighting is based on experts judgment this method
is not as objective as methods that are derived from statistical methods. In a next step
a formula had to be defined to calculate a sub-index for each sustainability dimension
from this model. Finally, all three sub-indices were combined into one overall composite
sustainable performance index. In summary, the framework considers three different
cases. In the first case a single factory is being assessed; in the second case two or
more factories are being compared and in the third case the development of one factory

105
is being assessed over time. The tool can be used from the external perspective for all
three cases and the assessment can be completed rapidly with a minimal time effort.
Based on the given framework, a computer-based tool was developed. Therefore
it was necessary to implement the framework into MS Excel by using Visual Basics for
Applications. It was pointed out that based on its characteristics VBA is the best fitted
solution for the tool.
After implementing the computer based tool, it was then applied to a practical case
study in order to demonstrate its application and to test its effectiveness. The first part
of this case study focused on the comparison of two production sites. The BMW site in
Dingolfing, Germany and the Daimler site in Sindelfingen, Germany. The second part
considered the assessment of the BMW Group from 2010 to 2012. The data collection
for both cases was based on public records and used the developed sustainability
assessment tool for data entering and data processing. It can be concluded that the
tool provides clear results and presents them in a comprehensible form. However, the
data collection from public records has revealed some difficulties. Smaller, individual
production sites without a strong focus on sustainability have not yet published
extensive data or figures on this topic.
Finally, the computer based tool was tested on its usability. In order to get feedback
for initial improvements, the tool was tested under real conditions in collaboration with
different test users. Test users were asked to perform the same case study as
mentioned above, by assessing the sustainability performance for BMW in the year
2012 and to compare the results to the years 2010 and 2011. Once the task was
completed, the test user had to answer a usability questionnaire. The questionnaire
was developed based on the ISO Norm 9241 and modified to meet the needs of the
evaluation. As a result of the evaluation, it can be concluded that the tool meets the

106
goal of a rapid assessment tool. All test users completed the task within 45 minutes.
Furthermore, the results of the questionnaire indicated that the tool prevents the user
from making errors, is easy to learn, self-descriptive, suitable for the task and easy to
control. However, it was also pointed out that it is rather complicated to expand the tool
for new tasks or to adapt it to the individual working style.
Finally, it can be concluded that the research objectives of the study were all
achieved. It gives an insight into the history of sustainability, reviews and categorizes
the current state of sustainability assessment tools, analyses the impact of factories on
their environment and classifies industrial sectors. Furthermore, it develops a
framework and implements it into a computer-based tool. Finally, it also tests the tool
in collaboration with different test users.
However, the larger goal of the study was to fill the gap of a missing sustainability
assessment tool at factory level. Theoretically the tool is verified to achieve the goal,
but this needs to be confirmed in practice. The tool enables external user such as
investors as well as internal users such as factory managers to compare the
sustainability performance of different companies or to evaluate the development of a
company in terms of sustainability performance. On the one hand this tool supports the
investors decision on sustainable investing and on the other hand it may also guide
factory managers to think and act in the right direction and to discover possible
improvements in order to increase the sustainability metrics related to factory
operations. However, there is still potential for future research on this topic, especially
when it comes to data collection of small and medium sized factories.

107
CHAPTER 9 – RECOMMENDATIONS FOR FUTURE RESEARCH
Although ideas for improvement and extensions have been mentioned throughout
this study, they shall be summarized at this point. Therefore, the section is divided into
two parts. First, the ideas to improve the usability of the developed tool are presented
and then the ideas to further improve the assessment framework.
9.1 Usability of the Tool
As the results of the questionnaire pointed out, it is important to improve the
Suitability for individualization. Since it cannot be assumed that any user is an Excel-
expert, a detailed user manual shall be developed. This manual has to instruct the user
on how to adapt the tool to the individual working style, to change options and to expand
the tool for new tasks.
Minor suggestions on the improvement of the tool such as a tabindex or an
overview for the different industrial sectors were already implemented in the latest
version of the tool.
9.2 Assessment Framework of the Tool
The model of the tool provided in this work does not offer the calculation of an
index for the assessment of a single factory. This is due to the fact that no database or
standardized scale for the assessment values is available and the values cannot be
normalized. This issue offers potential for further development. One possibility would
be to collect data for the leading company in each industrial sector. In case a single
factory is being assessed the results can be normalized relative to the benchmark
company of the specific industry. The leading sustainability companies could be

108
identified based on the DJSI. Also, the case study proved that data collection especially
for factories with a focus on sustainability is rather easy to accomplish.
Another step of further improvement considers the weighting of indicators by using
the AHP method. Since it is a participatory method, the results will be more
sophisticated the more experts participate. Therefore the questionnaire should be
placed on a webpage where experts have the possibility to evaluate the indicators
continuously. The results of the evaluation have to be stored automatically through an
interface into a database.
In the future, it might also be possible to place the entire tool on a public webpage.
Therefore different users have access to it and they would be able to share a database.
The variety of factories in the database would increase and the users have the
opportunity to compare the results of different factories with a minimal amount of effort.
This may also solve the problem concerning the complicated and time consuming data
collection for small and midsize factories based on public records.

109
APPENDICES
A1: Questionnaire for AHP-method
Environmental Dimension
Please do a pair-wise comparison between each pair of indicators, by judging “how
important is indicator j relative to indicator i ?”. Values are given on a scale from 1 to 9
to show the intensity of preference (see table below). The larger the number, the greater
the importance.
Factor of preference Importance
1 Equally preferred
3 Moderately preferred
5 Strongly preferred
7 Very strongly preferred
9 Extremely strongly
2,4,6,8 Intermediate values
Example (where waste is very strongly preferred over water and energy and water are equally preferred):
Waste generation Freshwater use
Energy use Freshwater use
Please fill out the next tables in the same way for each type of industry, by moving the
orange dot:
Basic Materials/Resources (Oil & Gas, Chemicals, Basic Resources)
Indicator j Factor of preference Indicator i
Energy use Material use
Energy use Freshwater use
Energy use Waste generation
Energy use GWP
1 3 3 5 55
7 9 7 9
1 3 3 5 55
7 9 7 9

110
Energy use AP
Material use Freshwater use
Material use Waste generation
Material use GWP
Material use AP
Freshwater use Waste generation
Freshwater use GWP
Freshwater use AP
Waste generation GWP
Waste generation AP
GWP AP
Economic Dimension
Please do a pair-wise comparison between each pair of indicators, by judging “how
important is indicator j relative to indicator i ?”. Values are given on a scale from 1 to 9
to show the intensity of preference (see table below). The larger the number, the
greater the importance.
Factor of preference Importance
1 Equally preferred
3 Moderately preferred
5 Strongly preferred
7 Very strongly preferred
9 Extremely strongly
2,4,6,8 Intermediate values
Please fill out the next tables for each type of industry, by moving the orange dot
(an example can be found at page “environmental dimension”):

111
Basic Materials/Resources (Oil & Gas, Chemicals, Basic Resources)
Indicator j Factor of preference Indicator i
Net profit margin Return of capital employed
Net profit margin Investment in R&D
Net profit margin Investment in staff development
Net profit margin Expenditures on EHS compliance
Return of capital employed
Investment in R&D
Return of capital employed
Investment in staff development
Return of capital employed
Expenditures on EHS compliance
Investment in R&D Investment in staff development
Investment in R&D Expenditures on EHS compliance
Investment in staff development
Expenditures on EHS compliance
Social Dimension
Please do a pair-wise comparison between each pair of indicators, by judging “how
important is indicator j relative to indicator i ?”. Values are given on a scale from 1 to 9
to show the intensity of preference (see table below). The larger the number, the greater
the importance.
Factor of preference Importance
1 Equally preferred
3 Moderately preferred
5 Strongly preferred
7 Very strongly preferred
9 Extremely strongly
2,4,6,8 Intermediate values
1 3 3 5 55
7 9 7 9
1 3 3 5 55
7 9 7 9
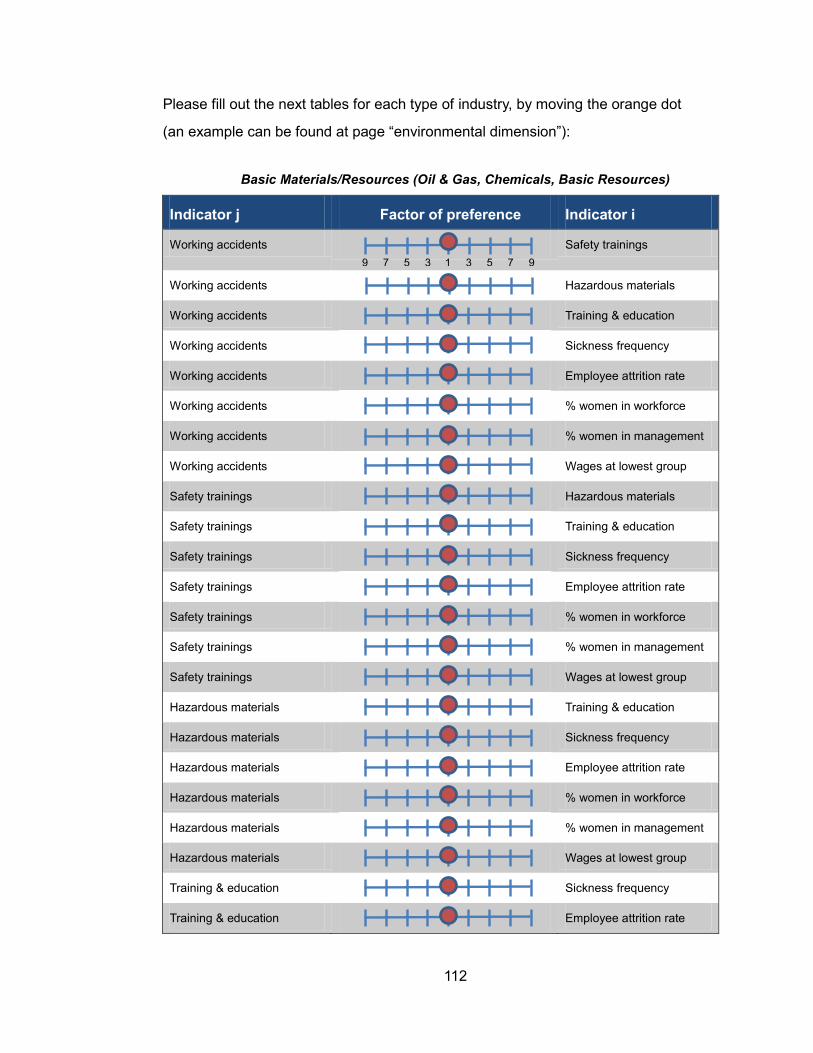
112
Please fill out the next tables for each type of industry, by moving the orange dot
(an example can be found at page “environmental dimension”):
Basic Materials/Resources (Oil & Gas, Chemicals, Basic Resources)
Indicator j Factor of preference Indicator i
Working accidents Safety trainings
Working accidents Hazardous materials
Working accidents Training & education
Working accidents Sickness frequency
Working accidents Employee attrition rate
Working accidents % women in workforce
Working accidents % women in management
Working accidents Wages at lowest group
Safety trainings Hazardous materials
Safety trainings Training & education
Safety trainings Sickness frequency
Safety trainings Employee attrition rate
Safety trainings % women in workforce
Safety trainings % women in management
Safety trainings Wages at lowest group
Hazardous materials Training & education
Hazardous materials Sickness frequency
Hazardous materials Employee attrition rate
Hazardous materials % women in workforce
Hazardous materials % women in management
Hazardous materials Wages at lowest group
Training & education Sickness frequency
Training & education Employee attrition rate
1 3 3 5 55
7 9 7 9

113
Training & education % women in workforce
Training & education % women in management
Training & education Wages at lowest group
Sickness frequency Employee attrition rate
Sickness frequency % women in workforce
Sickness frequency % women in management
Sickness frequency Wages at lowest group
Employee attrition rate % women in workforce
Employee attrition rate % women in management
Employee attrition rate Wages at lowest group
% women in workforce % women in management
% women in workforce Wages at lowest group
% women in management Wages at lowest group

114
A2: Results of the Weighting Method
Key indicators
Ba
sic
Mate
rials
/
Re
sou
rce
s
Indu
str
ials
Co
nsu
me
r
Go
od
s
He
alth
Care
Utilit
ies
Te
chn
olo
gy
Key indicators
Environment
Energy use 0,27 0,24 0,24 0,25 0,29 0,25
Material use 0,15 0,19 0,19 0,19 0,13 0,19
Freshwater use 0,11 0,12 0,13 0,11 0,12 0,11
Waste 0,12 0,11 0,17 0,18 0,17 0,18
GWP 0,24 0,28 0,20 0,20 0,22 0,20
AP 0,11 0,07 0,07 0,07 0,07 0,07
Social
Working accidents 0,26 0,21 0,19 0,19 0,12 0,11
Safety training 0,17 0,18 0,11 0,14 0,11 0,10
Hazardous 0,19 0,17 0,11 0,11 0,10 0,09
Training & Education 0,07 0,08 0,13 0,12 0,16 0,17
Sickness 0,06 0,07 0,11 0,08 0,13 0,14
Attrition rate 0,05 0,06 0,08 0,08 0,09 0,10
Women in Workforce 0,06 0,08 0,10 0,11 0,12 0,11
Women Management 0,06 0,08 0,08 0,08 0,08 0,08
Wages lowest group 0,07 0,07 0,09 0,09 0,10 0,10
Economic
Net profit margin 0,25 0,22 0,26 0,26 0,19 0,20
Return of capital employed
0,29 0,33 0,34 0,34 0,28 0,25
Investment in R&D 0,14 0,16 0,14 0,14 0,25 0,25
Investment in staff 0,14 0,18 0,16 0,16 0,17 0,20
Costs for EHS 0,17 0,11 0,11 0,11 0,11 0,11
Dimensions
Environmental 0,41 0,33 0,33 0,33 0,33 0,33
Social 0,33 0,33 0,33 0,33 0,33 0,33
Economic 0,26 0,33 0,33 0,33 0,33 0,33

115
A3: Usability Questionnaire
Please evaluate the factory assessment tool by judging each statement of the
questionnaire. Values are given on a scale from --- (very negative) to +++ (very
positive).
The goal of the evaluation is to detect weaknesses in the tool and to develop
suggestions for improvement. In order to achieve this, please answer every question
based on your personal experience.
Suitability for the task
Does the tool support to realize the tasks more effectively and efficiently?
The tool… Agreement to the statement The tool…
is complicated to use. is not complicated to use.
requires unnecessary input. does not require unnecessary input.
Self-descriptiveness
Is every step understandable in an intuitive way?
The tool… Agreement to the statement The tool…
uses terms, definitions and/or symbols that are difficult to understand.
uses terms, definitions and/or symbols that are not difficult to understand.
does not offer context-sensitive explanation, which are concretely helpful.
does offer context-sensitive explanation, which are concretely helpful.
- - - - - - -/+ + ++ +++
- - - - - - -/+ + ++ +++

116
Conformity with user expectations
Is the tool consistent with common expectations and habits?
The tool… Agreement to the statement The tool…
complicates orientation due to an inconsistent design.
facilitates orientation due to a consistent design.
provides insufficient insight regarding its current status.
provides sufficient insight regarding its current status.
Suitability for learning
Is the effort for learning the tool as low as possible?
The tool… Agreement to the statement The tool…
requires a lot of time to learn. requires little time to learn.
cannot be used without previous knowledge or training.
can be used without previous knowledge or training.
Controllability
Is the user able to start the sequence and influence its direction?
The tool… Agreement to the statement The tool…
forces the user to follow an unnecessarily rigid sequence of steps.
does not force the user to follow an unnecessarily rigid sequence of steps.
does not support easy switching between individual menus or masks.
supports easy switching between individual menus or masks.
- - - - - - -/+ + ++ +++
- - - - - - -/+ + ++ +++
- - - - - - -/+ + ++ +++

117
Error tolerance
Does the tool ensure a minimal rate of errors?
The tool… Agreement to the statement The tool…
does not prevent the user from making errors.
prevents the user from making errors.
provides error messages which are difficult to understand.
provides error messages which are easy to understand.
Suitability for individualization
Does the tool allow customizing according to the task and individual preferences?
The tool… Agreement to the statement The tool…
is difficult to expand for new tasks.
is easy to expand for new tasks.
is difficult to adapt to the individual working style.
is easily adaptable to the individual working style.
- - - - - - -/+ + ++ +++
- - - - - - -/+ + ++ +++
118
BIBLIOGRAPHY
Brundtland, Gro H.: World Commission on Environment and Development. In: Our
Common Future, vol. 42, pp. 8–9.
Cherchye, L.; Moesen, W.; Rogge, N.; van Puyenbroeck, T.; Saisana, M.; Saltelli, A. et
al. (2007): Creating composite indicators with DEA and robustness analysis:
the case of the Technology Achievement Index. In J Oper Res Soc 59 (2),
pp. 239–251.
Cherchye, L.; Moesen, W.; van Puyenbroeck, T. (2004): Legitimately Diverse, yet
Comparable: On Synthesizing Social Inclusion Performance in the EU*. In
JCMS: J Common Market Studies 42 (5), pp. 919–955.
Davidson, Cliff I.; Hendrickson, Chris T.; Matthews, H. Scott; Bridges, Michael W.; Allen,
David T.; Murphy, Cynthia F. et al. (2010): Preparing future engineers for
challenges of the 21st century: Sustainable engineering. In Going beyond
the rhetoric: system-wide changes in universities for sustainable societies 18
(7), pp. 698–701. Available online at
http://www.sciencedirect.com/science/article/pii/S0959652609004156.
Despeisse, M.; Ball, P. D.; Evans, S.; Levers, A. (2012): Industrial ecology at factory
level – a conceptual model. In Journal of Cleaner Production 31 (0), pp. 30–
39. Available online at
http://www.sciencedirect.com/science/article/pii/S0959652612001035.
Deturck, D. M. (1987): The approach to consistency in the analytic hierarchy process.
In Mathematical Modelling 9 (3–5), pp. 345–352. Available online at
http://www.sciencedirect.com/science/article/pii/027002558790491X.
DJSI (2013): Dow Jones Sustainability Index. Available online at
http://www.sustainabilityindex.com/dow-jones-sustainability-
indexes/index.jsp/, checked on 13/04/2013.
Donella Meadows, Dennis Meadows Jorgen Randers and William Behrens, III (1972):
Limits to Growth. New York: Universe Books.
Dresner, Simon (2002): The Principles of Sustainability. London: Earthscan
Publications Ltd.

119
EICC (2012): Electronic Industry Citizenship Coalition Code of Conduct. With
assistance of EICC. Available online at
http://www.eicc.info/documents/EICCCodeofConductEnglish.pdf, updated
on 12/04/2012, checked on 20/04/2013.
El-Mahgary, Sami; Lahdelma, Risto (1995): Data envelopment analysis: Visualizing the
results. In European Journal of Operational Research 83 (3), pp. 700–710.
Available online at
http://www.sciencedirect.com/science/article/pii/037722179400303T.
EPA (2012): Wastes - Municipal Solid Waste. Edited by U.S. Environmental Protection
Agency. Available online at http://www.epa.gov/epawaste/comments.htm,
updated on 15/11/2012, checked on 8/06/2013.
Feng, S. C.; Joung, C.-B; Li, G. (2010): Development Overview of Sustainable
Manufacturing Metrics. Edited by S. C. Feng, C.-B Joung, G. Proceedings of
the 17th CIRP International Conference on Life Cycle Engineering Li.
Available online at
http://www.sustainelectronics.illinois.edu/NSFworkshop/Reading/Developm
ent%20Overview%20of%20Sustainable%20Manufacturing%20Metrics.pdf,
updated on 13/05/2010, checked on 2/06/2013.
Global Reporting Initiative (2011): Sustainability Reporting Guidelines. Version 3.1.
Edited by Global Reporting Intiviative. Netherlends. Available online at
https://www.globalreporting.org/resourcelibrary/G3.1-Guidelines-Incl-
Technical-Protocol.pdf, checked on 17/04/2013.
Gluch, Pernilla; Baumann, Henrikke (2004): The life cycle costing (LCC) approach: a
conceptual discussion of its usefulness for environmental decision-making
(5). Available online at
http://publications.lib.chalmers.se/records/fulltext/local_2423.pdf, checked
on 2/05/2013.
Graedel, T. E.; Allenby, Braden R. (2010): Industrial ecology and sustainable
engineering. International ed. Boston: Pearson.

120
Hermans, Elke; van den Bossche, Filip; Wets, Geert (2008): Combining road safety
information in a performance index. In Accident Analysis & Prevention 40 (4),
pp. 1337–1344, checked on 11/06/2013.
Hussey, D.; Kirsop, P.; Meissen, R. (2001): Global Reporting Initiative Guidelines. An
Evaluation of Sustainable Development Metrics for Industry. In
Environmental Quality Management, (Vol. 1), pp. 143–162.
Joung, Che B.; Carrell, John; Sarkar, Prabir; Feng, Shaw C. (2013): Categorization of
indicators for sustainable manufacturing. In Ecological Indicators 24 (0), pp.
148–157. Available online at
http://www.sciencedirect.com/science/article/pii/S1470160X12002294.
Kölsch, Daniela (2011): Sozioökonomische Bewertung von Chemikalien. Entwicklung
und Evaluation einer neuartigen und umfassenden sozioökonomischen
Bewertungsmethode, basierend auf der SEEBALANCE® Methode zur
Bewertung von Chemikalien unter REACh. Dissertation, Kahlsruhe. KIT,
checked on 8/06/2013.
Krajnc, Damjan; Glavič, Peter (2005): How to compare companies on relevant
dimensions of sustainability. In Ecological Economics 55 (4), pp. 551–563.
Available online at
http://www.sciencedirect.com/science/article/pii/S0921800904004513.
Labuschagne, Carin; Brent, Alan C.; van Erck, Ron P.G (2005): Assessing the
sustainability performances of industries. In Journal of Cleaner Production
13 (4), pp. 373–385, checked on 11/04/2013.
Microsoft (2013): Introducing Visual Basic For Applications. Edited by Microsoft.
Available online at http://msdn.microsoft.com/en-
us/library/office/aa188202%28v=office.10%29.aspx, checked on 8/07/2013.
Müller, Egon; Engelmann, Jörg; Löffler, Thomas; Strauch, Jörg (2009):
Energieeffiziente Fabriken planen und betreiben. Berlin Heidelberg:
Springer-Verlag, checked on 27/05/2013.
NACFAM (2009): Sustainable Manufacturing. With assistance of National Council for
Advanced Manufacturing. Available online at

121
http://www.nacfam.org/PolicyInitiatives/SustainableManufacturing/tabid/64/
Default.aspx, checked on 28/04/2013.
Nandagopal, R.; Sankar, A. R.N (2009): WAL-MART’S ENVIRONMENTAL STRATEGY.
In Asian Journal of Management Cases (6), pp. 119–133. Available online at
http://www.cfsgs.com/uploads/3/6/0/1/3601225/119.pdf, checked on
2/05/2013.
Ness, Barry; Urbel-Piirsalu, Evelin; Anderberg, Stefan; Olsson, Lennart (2007):
Categorising tools for sustainability assessment. In Ecological Economics 60
(3), pp. 498–508, checked on 11/04/2013.
OECD (2001): OECD Environmental Indicators. TOWARDS SUSTAINABLE
DEVELOPMENT. OECD. Paris (ISBN 92-64-18718-9, 52079 2001).
Available online at http://www.oecd.org/site/worldforum/33703867.pdf,
updated on 9/01/2002, checked on 27/04/2013.
OECD (2003): OECD Environmental Indicators. Development, Measurement and Use.
OECD. Paris. Available online at
http://www.oecd.org/environment/indicators-modelling-
outlooks/24993546.pdf, updated on 31/10/2003, checked on 27/04/2013.
OECD (2008): Handbook on Constructing Composite Indicators. Methodology and
UserGuide. Paris: OECD PUBLICATIONS. Available online at
www.oecd.org/publishing/corrigenda, checked on 11/06/2013.
OECD Sustainable Development Studies: Measuing Sustainable Production.
Developing Indicators of Energy Efficiency. With assistance of Cecilia Tam.
2008. Available online at
http://browse.oecdbookshop.org/oecd/pdfs/product/9708021e.pdf, checked
on 28/05/2013.
O'Riordan, Tim (1988): The Politics of Sustainability. In Sustainable Environmental
Managment: Principles and Practice.
Parenti, Christian (2012): 'The Limits to Growth': A Book That Launched a Movement.
Available online at http://www.thenation.com/article/171610/limits-growth-
book-launched-movement#, checked on 2/05/2013.

122
Prümper, J.; Michael, A. (Eds.) (1993): Software-Ergonomie '93. Die Evaluation von
Software auf Grundlage des Entwurfs zur internationalen Ergonomie-Norm
ISO 9241 Teil 10 als Beitrag zur partizipativen Systemgestaltung. Stuttgart:
Teubner (Berichte des German Chapter of the ACM, 39).
Ranganathan, J. (1988): Sustainability Rulers: Measuring Corporate Environmental
and Social Performance. Edited by Sustainable Enterprise Initiative.
Washington, DC. Available online at
http://pdf.wri.org/sustainability_rulers.pdf, updated on 13/09/2006, checked
on 2/06/2013.
Saaty, Thomas Lorci (1980): The analytic hierarchy process. Planning, priority setting,
resource allocation. New York: McGraw-Hill.
Saling, Peter; Maisch, Roland; Silvani, Maurizio; König, Natalie (2005): Assessing the
Environmental-Hazard Potential for Life Cycle Assessment, Eco-Efficiency
and SEEbalance (8 pp). In Int J Life Cycle Assessment 10 (5), pp. 364–371,
checked on 30/04/2013.
SAM (2013): Dow Jones Sustainability World Index Guide. Edited by RobecoSAM AG.
Available online at http://www.sustainability-index.com/images/djsi-world-
guidebook_tcm1071-337244.pdf, updated on 4/04/2013, checked on
18/04/2013.
Satish Joshi (2000): Product Environmental Life-Cycle Assessment Using Input-Output
Techniques. In Journal of Industrial Ecology (3), pp. 95–120, checked on
27/05/2013.
Schmidt, W.-P Taylor A. (2006): Ford of Europe’s Product Sustainability Index. Edited
by 13th CIRP International Conference of Life Cycle Engineering (CIRP
International Conference of Life Cycle Engineering, 13th). Available online at
http://www.mech.kuleuven.be/lce2006/key2.pdf, updated on 11/05/2006,
checked on 1/05/2013.
Seliger, Günther (2007): Sustainability in manufacturing. Recovery of resources in
product and material cycles. Berlin; Heidelberg; New York: Springer.
Shaw C. Feng, Che B. Joung (2009): An Overview of a Proposed Measurement
Infrastructure for Sustainable Manufacturing. Edited by The 7th Global

123
Conference on Sustainable Manufacturing. Manufacturing Engineering
Laboratory National Institute of Standards and Technology Gaithersburg,
Maryland, USA, updated on 12/11/2009, checked on 25/04/2013.
Shaw C. Feng; Che-Bong Joung; Gang Li (2010): Development Overview of
Sustainable Manufacturing Metrics. Proceedings of the 17th
CIRP International Conference on Life Cycle Engineering, Hefei, China. In
Proceedings of the 17th CIRP International Conference on Life Cycle
Engineering, checked on 11/04/2013.
Singh, Rajesh Kumar; Murty, H. R.; Gupta, S. K.; Dikshit, A. K. (2007): Development of
composite sustainability performance index for steel industry. In Ecological
Indicators 7 (3), pp. 565–588. Available online at
http://www.sciencedirect.com/science/article/pii/S1470160X06000550.
Srinivasan, Vijay (2011): An Engineer grapples with sustainable manufacturing. In
Clean Techn Environ Policy 13 (2), pp. 217–219.
Sustainable Measures (2010). West Hartford, CT. Available online at
http://www.sustainablemeasures.com/node/92, checked on 2/06/2013.
Theis, T.; Tomkin, J. (2012): Sustainability: A Comprehensive Foundation. Houston,
Texas: Connexions, Rice University. Available online at
http://ia600806.us.archive.org/18/items/ost-earth-sciences-
col11325/col11325.pdf, checked on 2/05/2013.
U.S Department of Commerce (2007): How does Commerce define Sustainable
Manufacturing? With assistance of International Trade Administration.
Available online at
http://www.trade.gov/competitiveness/sustainablemanufacturing/how_doc_
defines_SM.asp, checked on 25/04/2013.
U.S. Department of Labor (2012): Workers Memorial Day. Available online at
http://www.dol.gov/_sec/media/speeches/20120426_WMD.htm, updated on
26/04/2012, checked on 8/06/2013.
Uhlman, B.; Saling, P. (2010): Measuring and Communicating Sustainability through
Eco-Efficiency Analysis. In CEP Magazine (December 2010). Available
online at

124
http://www.basf.com/group/corporate/en_GB/function/conversions:/publish/
content/sustainability/eco-efficiency-analysis/presentations-
files/BASF_Presentation_Uhlman_2010.pdf, checked on 30/04/2013.
UNDP (2013): Human Development Reports. With assistance of United Nations
Development Programme. Available online at
http://hdr.undp.org/en/statistics/hdi/, updated on 2013, checked on
1/05/2013.
United Nations (2007): Indicators of Sustainable Development: Guidelines and
Methodologies. Edited by United Nations publication. New York. Available
online at
http://sustainabledevelopment.un.org/index.php?page=view&type=400&nr=
107&menu=35, updated on 8/01/2008, checked on 17/04/2013.
United Nations (2013): Sustainable Development. United Nations. Available online at
http://sustainabledevelopment.un.org/csd.html, checked on 2/05/2013.
Veleva, Vesela; Ellenbecker, Michael (2001): Indicators of sustainable production:
framework and methodology. In Journal of Cleaner Production 9 (6), pp.
519–549. Available online at
http://www.sciencedirect.com/science/article/pii/S0959652601000105.
Wackernagel, M.; Rees, W. (1996): Our Ecological Footprint. Reducing Human Impact
on the Earth. Gabriola Island: New Society Publishers.
Wal-Mart (2006): Wal-Mart Unveils "Packaging Scorecard" to Suppliers. Chicago.
Available online at http://news.walmart.com/news-archive/2006/11/01/wal-
mart-unveils-packaging-scorecard-to-suppliers, updated on 1/11/2006,
checked on 11/04/2013.
Wal-Mart (2012): Sustainability. Available online at
www.walmartstores.com/Sustainability/, checked on 2/04/2013.
Wiendahl, H.-P; ElMaraghy, H.A; Nyhuis, P.; Zäh, M.F; Wiendahl, H.-H; Duffie, N.;
Brieke, M. (2007): Changeable Manufacturing - Classification, Design and
Operation. In CIRP Annals - Manufacturing Technology 56 (2), pp. 783–809,
checked on 27/05/2013.
125
Yang, Taho; Kuo, Chunwei (2003): A hierarchical AHP/DEA methodology for the
facilities layout design problem. In European Journal of Operational
Research 147 (1), pp. 128–136. Available online at
http://www.sciencedirect.com/science/article/pii/S0377221702002515.
Zettlemoyer, A. (2007): Life Cycle Inventory and the Impact to the Wal-Mart Packaging
Sustainable Value Network. In International Life Cycle Assessment and
Management.
Zhou, Li; Tokos, Hella; Krajnc, Damjan; Yang, Yongrong (2012): Sustainability
performance evaluation in industry by composite sustainability index. In
Clean Techn Environ Policy 14 (5), pp. 789–803, checked on 11/06/2013.


![Rapid assess[1]. of uiatf report](https://static.fdocuments.net/doc/165x107/58f31d311a28ab4f668b4667/rapid-assess1-of-uiatf-report.jpg)