A range-wide synthesis and timeline for phylogeographic events in the red fox
15
RESEARCH ARTICLE Open Access A range-wide synthesis and timeline for phylogeographic events in the red fox (Vulpes vulpes) Verena E Kutschera 1* , Nicolas Lecomte 2,3 , Axel Janke 1,4 , Nuria Selva 5 , Alexander A Sokolov 6 , Timm Haun 1 , Katharina Steyer 7 , Carsten Nowak 7 and Frank Hailer 1* Abstract Background: Many boreo-temperate mammals have a Pleistocene fossil record throughout Eurasia and North America, but only few have a contemporary distribution that spans this large area. Examples of Holarctic-distributed carnivores are the brown bear, grey wolf, and red fox, all three ecological generalists with large dispersal capacity and a high adaptive flexibility. While the two former have been examined extensively across their ranges, no phylogeographic study of the red fox has been conducted across its entire Holarctic range. Moreover, no study included samples from central Asia, leaving a large sampling gap in the middle of the Eurasian landmass. Results: Here we provide the first mitochondrial DNA sequence data of red foxes from central Asia (Siberia), and new sequences from several European populations. In a range-wide synthesis of 729 red fox mitochondrial control region sequences, including 677 previously published and 52 newly obtained sequences, this manuscript describes the pattern and timing of major phylogeographic events in red foxes, using a Bayesian coalescence approach with multiple fossil tip and root calibration points. In a 335 bp alignment we found in total 175 unique haplotypes. All newly sequenced individuals belonged to the previously described Holarctic lineage. Our analyses confirmed the presence of three Nearctic- and two Japan-restricted lineages that were formed since the Mid/Late Pleistocene. Conclusions: The phylogeographic history of red foxes is highly similar to that previously described for grey wolves and brown bears, indicating that climatic fluctuations and habitat changes since the Pleistocene had similar effects on these highly mobile generalist species. All three species originally diversified in Eurasia and later colonized North America and Japan. North American lineages persisted through the last glacial maximum south of the ice sheets, meeting more recent colonizers from Beringia during postglacial expansion into the northern Nearctic. Both brown bears and red foxes colonized Japan’s northern island Hokkaido at least three times, all lineages being most closely related to different mainland lineages. Red foxes, grey wolves, and brown bears thus represent an interesting case where species that occupy similar ecological niches also exhibit similar phylogeographic histories. Keywords: Carnivores, Divergence time estimate, Generalist, mtDNA control region, Phylogeography, Vulpes * Correspondence: [email protected]; [email protected] 1 Biodiversity and Climate Research Centre (BiK-F), Senckenberg Gesellschaft für Naturforschung, Senckenberganlage 25, 60325 Frankfurt am Main, Germany Full list of author information is available at the end of the article © 2013 Kutschera et al.; licensee BioMed Central Ltd. This is an Open Access article distributed under the terms of the Creative Commons Attribution License (http://creativecommons.org/licenses/by/2.0), which permits unrestricted use, distribution, and reproduction in any medium, provided the original work is properly cited. Kutschera et al. BMC Evolutionary Biology 2013, 13:114 http://www.biomedcentral.com/1471-2148/13/114
Transcript of A range-wide synthesis and timeline for phylogeographic events in the red fox

Kutschera et al. BMC Evolutionary Biology 2013, 13:114http://www.biomedcentral.com/1471-2148/13/114
RESEARCH ARTICLE Open Access
A range-wide synthesis and timeline forphylogeographic events in the red fox(Vulpes vulpes)Verena E Kutschera1*, Nicolas Lecomte2,3, Axel Janke1,4, Nuria Selva5, Alexander A Sokolov6, Timm Haun1,Katharina Steyer7, Carsten Nowak7 and Frank Hailer1*
Abstract
Background: Many boreo-temperate mammals have a Pleistocene fossil record throughout Eurasia and NorthAmerica, but only few have a contemporary distribution that spans this large area. Examples of Holarctic-distributedcarnivores are the brown bear, grey wolf, and red fox, all three ecological generalists with large dispersal capacityand a high adaptive flexibility. While the two former have been examined extensively across their ranges, nophylogeographic study of the red fox has been conducted across its entire Holarctic range. Moreover, no studyincluded samples from central Asia, leaving a large sampling gap in the middle of the Eurasian landmass.
Results: Here we provide the first mitochondrial DNA sequence data of red foxes from central Asia (Siberia), andnew sequences from several European populations. In a range-wide synthesis of 729 red fox mitochondrial controlregion sequences, including 677 previously published and 52 newly obtained sequences, this manuscript describesthe pattern and timing of major phylogeographic events in red foxes, using a Bayesian coalescence approach withmultiple fossil tip and root calibration points. In a 335 bp alignment we found in total 175 unique haplotypes. Allnewly sequenced individuals belonged to the previously described Holarctic lineage. Our analyses confirmed thepresence of three Nearctic- and two Japan-restricted lineages that were formed since the Mid/Late Pleistocene.
Conclusions: The phylogeographic history of red foxes is highly similar to that previously described for grey wolvesand brown bears, indicating that climatic fluctuations and habitat changes since the Pleistocene had similar effectson these highly mobile generalist species. All three species originally diversified in Eurasia and later colonized NorthAmerica and Japan. North American lineages persisted through the last glacial maximum south of the ice sheets,meeting more recent colonizers from Beringia during postglacial expansion into the northern Nearctic. Both brownbears and red foxes colonized Japan’s northern island Hokkaido at least three times, all lineages being most closelyrelated to different mainland lineages. Red foxes, grey wolves, and brown bears thus represent an interesting casewhere species that occupy similar ecological niches also exhibit similar phylogeographic histories.
Keywords: Carnivores, Divergence time estimate, Generalist, mtDNA control region, Phylogeography, Vulpes
* Correspondence: [email protected]; [email protected] and Climate Research Centre (BiK-F), Senckenberg Gesellschaftfür Naturforschung, Senckenberganlage 25, 60325 Frankfurt am Main,GermanyFull list of author information is available at the end of the article
© 2013 Kutschera et al.; licensee BioMed Central Ltd. This is an Open Access article distributed under the terms of the CreativeCommons Attribution License (http://creativecommons.org/licenses/by/2.0), which permits unrestricted use, distribution, andreproduction in any medium, provided the original work is properly cited.

Kutschera et al. BMC Evolutionary Biology 2013, 13:114 Page 2 of 15http://www.biomedcentral.com/1471-2148/13/114
BackgroundWhile current population genetic structuring tends to beweak in arctic mammalian specialists [1,2], species intemperate regions usually show more pronounced struc-turing [3-5], due to their survival in different refugiaduring the last glacial maximum (LGM) (reviewed in[6,7]). An exception to this trend is observed in sometemperate-zone species with generalist habitat require-ments and high mobility, like large carnivores that occuracross a wide habitat and climatic gradient. Indeed, greywolves (Canis lupus) and brown bears (Ursus arctos)show an overall weak phylogeographic structure withseveral widely distributed lineages [8-15].Similar to the brown bear and the grey wolf, the red
fox (Vulpes vulpes) is distributed across all northerncontinents (Europe, Asia, and North America), being themost widely distributed carnivore in the world [16]. Thehigh mobility and adaptability of the red fox to differenthabitats and climates is reflected by its earliest appear-ance in the fossil record outside the southern refugiashortly after the last glacial maximum (LGM). Some13,500 years before present, for instance, the red fox re-appeared in Northern Germany close to the ice sheets[17]. Daily distances of more than 10 km are common[18,19], and the longest recorded distance covered by ared fox was 302 km within less than a year’s time [20].Although red fox phylogeography using DNA se-
quence data from a ca. 268 – 342 bp fragment of themitochondrial (mt) control region has been investigatedbefore [21-27], these studies had a regional focus orsampling gaps in Siberia and Asia (Figure 1). In addition,so far the published data has not been collated to inves-tigate range-wide processes, and no timeline has yetbeen established for phylogeographic events. Previousstudies described two major red fox lineages – one witha Holarctic distribution and a Nearctic lineage consistingof three sublineages (widespread lineage, eastern lineage,mountain lineage) [23,24,27]. A study on Japanese red
Figure 1 Map of sample locations for all sequences used in thisstudy (published data and newly generated data). Currentdistribution range of the red fox [84] is shown in light grey. Blackstars with white numbers indicate sampling locations for new datagenerated in this study. Circles indicate sampling regions fromprevious studies, with black numbers denoting numbers ofpublished sequences for these regions. Details on all sequencesused in this study are given in Additional file 1.
foxes found two main lineages in Japan: one lineage thatwas exclusively found on Japan’s northern island Hokkaido(Hokkaido II), and another lineage that comprised threeJapanese sublineages occurring on Hokkaido and onJapan’s main southern islands Honshu and Kyushu(Hokkaido Ia, Hokkaido Ib, Honshu/Kyushu) alongwith mainland Asian red foxes [21].We here present novel data from red foxes of various
Eurasian populations, notably including individuals fromcentral Siberia, a biogeographically important regionwith the potential to link European with East Asian and/or North American populations. In a range-wide synthe-sis of published and publicly available control region se-quences combined with newly generated data (Figure 1),the identity and geographic distribution of previously de-scribed lineages is validated. Based on this novel assess-ment of mtDNA structure in red foxes, we establish atimeline of major phylogeographic events using aBayesian coalescence approach with multiple fossil tipand root calibration points. We compare these resultsfor red foxes to previously published findings fromother carnivores with a Holarctic distribution, allowingus to identify common phylogeographic patterns andprocesses.
ResultsIn our analysis of 729 red foxes (a map with the geo-graphic locations is given in Figure 1 and a completecompilation is found in Additional file 1), we found 95variable sites that defined 175 haplotypes in a 335 bp-alignment of the mitochondrial control region (Table 1).Haplotype diversity for the whole dataset was 0.948 +/−0.005, and nucleotide diversity was 0.057 +/− 0.028(Table 1). The 52 newly sequenced individuals from Si-beria, Germany, Poland, and Finland formed 25 haplo-types. Most of these haplotypes (n = 22) had not beenencountered in previous studies (Additional file 2). Allnewly obtained sequences have been submitted to theEMBL database [EMBL:HF677203-HF677255].
Major mitochondrial clades and population structuringWe confirmed all previously described lineages (Figures 2and 3, Additional file 3). All Nearctic lineages and theJapanese Hokkaido II and Honshu/Kyushu lineages weredistinct in a median-joining network (Figure 3), althoughsome received less than 95% posterior support in theBEAST analysis (Figure 2). However, the most basal splitwithin each of these lineages received high posteriorsupport in the BEAST analysis (Figure 2). A phylogen-etic analysis of haplotype data conducted in MrBayesrecovered a tree with a topology congruent with thetree obtained from BEAST (Additional file 3), inaccordance with previous lineage definitions. There-fore, despite some uncertainty with regard to their

Table 1 Summary statistics of genetic variability of major red fox mtDNA control region lineages
Geographic region, mtDNA lineage n S NH Hd π Fu’s FS
All samples 729 95 175 0.948 +/− 0.005 0.057 +/− 0.028 −23.363***
Holarctic lineage 405 67 131 0.964 +/− 0.004 0.047 +/− 0.024 −23.701***
Japan, Hokkaido II 6 3 3 0.600 +/− 0.215 0.003 +/− 0.003 −0.189*
Japan, Honshu/Kyushu 29 5 6 0.517 +/− 0.106 0.003 +/− 0.003 −1.295**
North America, Nearctic lineage 289 34 35 0.742 +/− 0.026 0.019 +/− 0.010 −4.347***
North America, eastern lineage 72 9 8 0.678 +/− 0.050 0.003 +/− 0.002 −2.423**
North America, mountain lineage 186 20 18 0.429 +/− 0.046 0.006 +/− 0.004 −6.295***
North America, widespread lineage 31 13 9 0.847 +/− 0.036 0.022 +/− 0.012 2.886
n sample size (number of individuals), S number of segregating sites, NH number of distinct haplotypes, Hd haplotype diversity, π nucleotide diversity, and Fu’s FS,an indicator of population expansion (when negative and significant). Asterisks indicate significance level (*p ≤ 0.02; **p ≤ 0.01; ***p ≤ 0.001).
Kutschera et al. BMC Evolutionary Biology 2013, 13:114 Page 3 of 15http://www.biomedcentral.com/1471-2148/13/114
placement in the red fox mtDNA phylogeny, those re-gional lineages represent distinct clades that captureaspects of the evolutionary history of red foxes. Ouranalysis and discussion of regional lineages thereforefocuses on groupings with high statistical support and/or lineages that were specifically defined in previousstudies.Nucleotide and haplotype diversity were highest for
geographically widely distributed lineages (Holarctic,Nearctic, and Nearctic widespread lineages), and lowestfor regionally restricted lineages (Japanese Hokkaido IIand Honshu/Kyushu lineages, Nearctic mountain andeastern lineages) (Table 1).North American red foxes fell into four mitochon-
drial groups: a Nearctic lineage that comprised threesublineages (mountain, eastern, and widespread line-ages), and a Holarctic lineage that was composed ofNorth American and Eurasian red foxes (Figures 2 and3). These lineages were previously described anddiscussed in detail by Aubry et al. [23], Sacks et al.[24], and Statham et al. [27].All Eurasian red foxes were placed in the Holarctic
lineage (Figures 2 and 3). In contrast to the Nearcticlineage, most support values for phylogenetic groupingswithin the Holarctic lineage were low: no geographicallyrestricted sublineages in the Holarctic lineage receivedhigh statistical support, except for two sublineages fromJapan (Figures 2 and 3; and see below). Haplotypes fromother geographic regions did not form monophyleticgroups, but were scattered across the Holarctic lineage(Figures 2 and 3). However, the few instances of haplo-type sharing occurred only between geographicallyneighboring populations (e.g., Germany, Switzerland,France; see Additional file 1). This weak phylogeographicstructuring within the Holarctic lineage was consistent withprevious findings by Teacher et al. [25] and Edwards et al.[26], who discussed red fox phylogeographic patterns inEurope more in detail.All 52 newly sequenced red foxes from Siberia,
Germany, Finland, and Poland belonged to the
Holarctic lineage (Figures 2 and 3). The six centralSiberian individuals formed three not previously de-scribed haplotypes that were not especially closely re-lated to each other (Figure 3, Additional files 1 and2). Also the Finnish red fox carried a novel haplotype(F01). The thirty newly sequenced German individualsformed ten haplotypes. Seven of these were new; threehaplotypes were identical to previously publishedsequences from French, Swiss or other European pop-ulations [23,25,28] (Additional files 1 and 2). OneGerman haplotype (individuals D408, D655, andD660) was shared with a Polish red fox (POLI68) fromthe present study. The newly sequenced Polish redfoxes formed thirteen haplotypes (Figure 3, Additionalfiles 1 and 2), twelve of which had not been describedpreviously. Besides the haplotype described above(POLI68), another was identical to a German haplo-type from the present study (D08) and to a Swisshaplotype from a previous study (Swit12) [25,28](Additional file 1). One Polish haplotype was closelyrelated to a Serbian haplotype (I) that was previouslydescribed as being distinct from all other Serbian redfoxes [22] (Serbia 3; see Figure 3).The other Serbian red foxes clustered separately into
two groups that were distinct from each other (Serbia 1and Serbia 2) within the Holarctic lineage, confirmingKirschning et al. [22]. In contrast to Kirschning et al.[22] findings, however, the two groups were separated byseveral Eurasian haplotypes and distinct from the rest ofthe Holarctic diversity in the median-joining network(Figure 3). In the Bayesian inference tree (Additional file3), all three Serbian lineages received less than 95%posterior support.The Japanese samples formed four distinct groups
that fell within the Holarctic diversity (Figures 2 and3, Additional file 3). These Japanese lineages wereseparated by intermediate haplotypes found on theEurasian mainland (Figure 3). Unlike in previous ana-lyses [21,29], our extended sampling and range-widesynthesis revealed that the Honshu/Kyushu lineage

Figure 2 Maximum clade credibility tree with time estimates for colonization events and basal diversifications within red fox mtDNAcontrol region lineages. For the dating of phylogeographic events we used a combined approach, utilizing tip dates based on publishedancient DNA red fox sequences [25], plus the arctic fox as exterior calibration point. This tree shows the results for a root height prior of 1.75-4million years (My), according to the 95% credibility interval in Perini et al. [80] for the divergence time between red and arctic fox (Table 2). White:Nearctic lineage haplotypes; grey: Japanese haplotypes (lineages Honshu/Kyushu and Hokkaido II); black: Holarctic lineage haplotypes, includingJapanese lineages Hokkaido Ia and Ib; ka: thousand years. Nodes marked with an asterisk were supported by posterior probability values >0.95.Samples used for tip calibration are marked with a ♦ symbol. Median ages and 95% highest posterior density ranges in brackets show theestimated ages of major lineages, and of the most basal nodes within these lineages. Our discussion focuses on lineages/nodes with ≥0.95statistical support, recognizing that longer mtDNA sequences will be required to resolve larger proportions of the red fox mitochondrialphylogeny (see [58-62]).
Kutschera et al. BMC Evolutionary Biology 2013, 13:114 Page 4 of 15http://www.biomedcentral.com/1471-2148/13/114
was not closely related to Hokkaido Ia, Hokkaido Ib,and Asian mainland red foxes, but formed a distinctlineage (Figures 2 and 3, Additional file 3). Red foxesfrom the northern island Hokkaido formed three sep-arate groups. The Hokkaido II lineage remained
clearly distinct from the other red foxes, as originallydescribed by Inoue et al. [21] and confirmed using mito-chondrial cytochrome b data by Yu et al. [29] (Figures 2and 3). Hokkaido I red foxes clustered into two sub-groups in the Holarctic lineage (Figures 2 and 3)
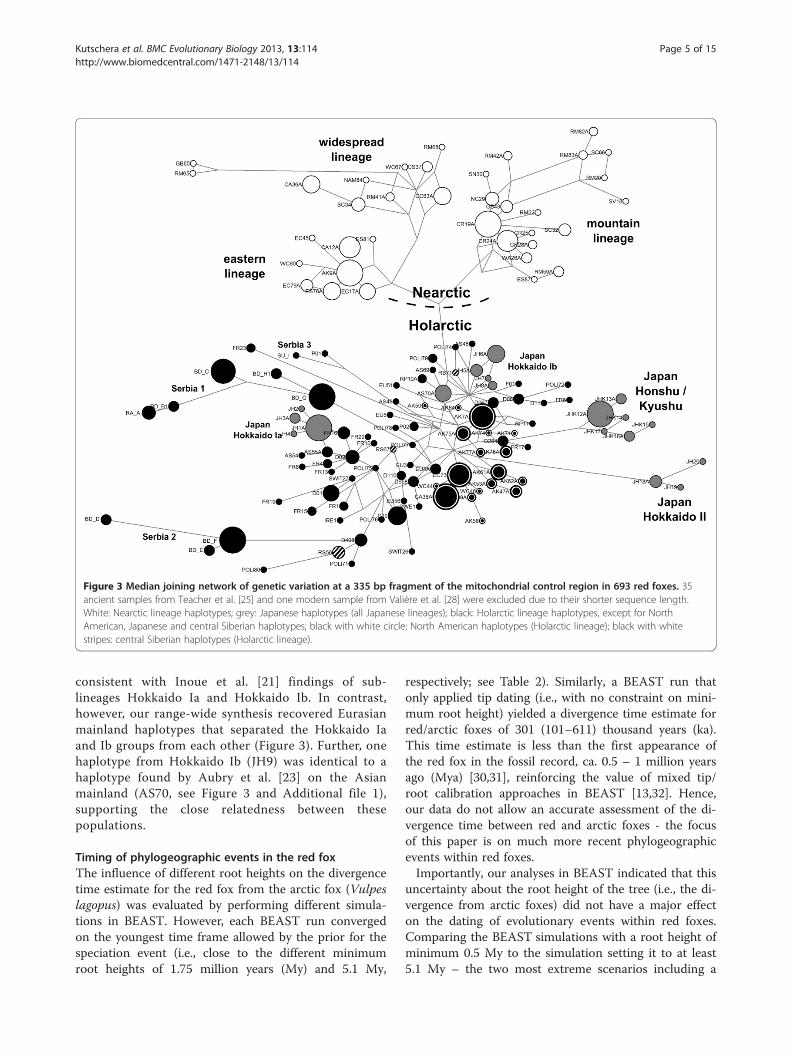
Figure 3 Median joining network of genetic variation at a 335 bp fragment of the mitochondrial control region in 693 red foxes. 35ancient samples from Teacher et al. [25] and one modern sample from Valière et al. [28] were excluded due to their shorter sequence length.White: Nearctic lineage haplotypes; grey: Japanese haplotypes (all Japanese lineages); black: Holarctic lineage haplotypes, except for NorthAmerican, Japanese and central Siberian haplotypes; black with white circle: North American haplotypes (Holarctic lineage); black with whitestripes: central Siberian haplotypes (Holarctic lineage).
Kutschera et al. BMC Evolutionary Biology 2013, 13:114 Page 5 of 15http://www.biomedcentral.com/1471-2148/13/114
consistent with Inoue et al. [21] findings of sub-lineages Hokkaido Ia and Hokkaido Ib. In contrast,however, our range-wide synthesis recovered Eurasianmainland haplotypes that separated the Hokkaido Iaand Ib groups from each other (Figure 3). Further, onehaplotype from Hokkaido Ib (JH9) was identical to ahaplotype found by Aubry et al. [23] on the Asianmainland (AS70, see Figure 3 and Additional file 1),supporting the close relatedness between thesepopulations.
Timing of phylogeographic events in the red foxThe influence of different root heights on the divergencetime estimate for the red fox from the arctic fox (Vulpeslagopus) was evaluated by performing different simula-tions in BEAST. However, each BEAST run convergedon the youngest time frame allowed by the prior for thespeciation event (i.e., close to the different minimumroot heights of 1.75 million years (My) and 5.1 My,
respectively; see Table 2). Similarly, a BEAST run thatonly applied tip dating (i.e., with no constraint on mini-mum root height) yielded a divergence time estimate forred/arctic foxes of 301 (101–611) thousand years (ka).This time estimate is less than the first appearance ofthe red fox in the fossil record, ca. 0.5 – 1 million yearsago (Mya) [30,31], reinforcing the value of mixed tip/root calibration approaches in BEAST [13,32]. Hence,our data do not allow an accurate assessment of the di-vergence time between red and arctic foxes - the focusof this paper is on much more recent phylogeographicevents within red foxes.Importantly, our analyses in BEAST indicated that this
uncertainty about the root height of the tree (i.e., the di-vergence from arctic foxes) did not have a major effecton the dating of evolutionary events within red foxes.Comparing the BEAST simulations with a root height ofminimum 0.5 My to the simulation setting it to at least5.1 My – the two most extreme scenarios including a

Table 2 Comparison of BEAST dating results employing a relaxed-clock approach with combined tip (interior) and root(exterior) calibration
Scenario Rootheightprior(min.)[ka]
Medianposterior
substitutionrate [per
site and 106
years]
Divergence time estimates [ka]
Red / arcticfox
Red foxdiversification
Nearcticlineage
NorthAmerica,easternlineage
NorthAmerica,
widespreadlineage
NorthAmerica,mountainlineage
Japan,Honshu /Kyushu
Japan,Hokkaido
II
Scenario 1 1750 33.2% 1,894(1,750–2,412)
173(92–316)
68(39–93)a
42(18–82)a
42(18–82)a
52(20–104)
24(9–52)a
27(11–60)a
Scenario 2 5100 25.6% 5,325(5,100–5,847)
235(118–423)
128(73–206)a
57(23–121)a
73(28–164)
57(23–121)a
64(46–94)a
45(22–69)a
Scenario 3 500 41.9% 586(500–874)
129(78–208)
61(30–92)a
32(13–61)a
32(13–61)a
39(14–74)
21(8–51)a
32(13–64)a
All three scenarios were using the same tip dates, but varying root heights as exterior calibration points (red/arctic fox divergence time estimate). Scenario 1:uniform prior for root height of 1.75-4 million years (My) according to the 95% credibility interval in Perini et al. [80] (Figure 2). Scenario 2: uniform prior for theroot height of 5.1-6 My according to the 95% credibility interval in Nyakatura and Bininda-Emonds [81]. Scenario 3: lognormal root height prior based on the firstappearance of the red fox in the fossil record (0.5-1 My ago) [30,31], setting the minimum age of the root height to 0.5 My. The 95% interval of the lognormalprior included a period of up to 5.9 My.aLess than 95% posterior support for the divergence from the next most closely related sequence, but at least 95% support for the most basal divergence withinthe lineage. Note also that, despite uncertainty regarding the phylogenetic placement of these groups, their inferred age was relatively similar acrosscalibration scenarios.ka thousand years.
Kutschera et al. BMC Evolutionary Biology 2013, 13:114 Page 6 of 15http://www.biomedcentral.com/1471-2148/13/114
root height and tip dating – the estimated divergencetime for the red/arctic fox speciation event varied by afactor of 10, whereas the median time estimates forphylogeographic events within red foxes varied only by afactor of 1.4-3, with overlapping confidence intervals(Table 2). It thus appeared that the inconsistent rootheight (red/arctic fox divergence time) only slightly im-pacted our time estimates for phylogeographic eventswithin red foxes, which is likely in part due to our
Figure 4 Map outlining major phylogeographic events in red foxes amultiple fossil tip and root calibration points. Current distribution ranglineages; black: Holarctic lineage (excluding Japan-restricted lineages). MP:Holocene. Note that not all sublineages within the Holarctic lineage are culineages show extensive range expansions (Figures 2 and 3, and Additiona
additional use of interior tip calibrations based on an-cient DNA sequences from known-age fossil remains.BEAST runs yielded posterior substitution rate esti-
mates of 33.2% for Scenario 1 (with a root height of 1.75My), and 25.6% or 41.9% for Scenarios 2 and 3, respect-ively (Table 2). A recent study of red fox mtDNAobtained a similar mutation rate estimate (ca. 26.29-33.81%, depending on whether the substitution modelincluded a gamma correction; Edwards et al. [26]). It is
s reconstructed using a Bayesian coalescence approach withe [84] is shown in foxy red. White: Nearctic lineage; grey: JapaneseMid Pleistocene, LP: Late Pleistocene, LGM: Last Glacial Maximum, Hol:rrently distributed across Eurasia and North America; only somel file 3).

Kutschera et al. BMC Evolutionary Biology 2013, 13:114 Page 7 of 15http://www.biomedcentral.com/1471-2148/13/114
interesting to note that these results [26] were based ona partial control region fragment combined with a par-tial cytochrome b fragment, precluding direct compari-sons of the estimates. Similar reasoning applies to themutation rate estimate (28.8%) obtained for mtDNA inbrown and cave bears [33], that is based on a fragmentthat only overlaps partially with our alignment.Due to low posterior support values for many internal
nodes (Figure 2 and Additional file 3), our analyses donot allow to identify the next most closely related se-quence of some of the described lineages. However, re-gardless of their exact phylogenetic placement, estimateddivergence times of regional lineages from their mostclosely related sequence remained largely constant(Table 2).Based on the most basal divergences among extant lin-
eages (Figure 2, Table 2), red foxes started to diversify inEurasia during the end of the Mid Pleistocene (Figure 4).North America was colonized independently by severallineages from this Holarctic diversity (Figures 2 and 4,Table 2), as indicated by simulations in BEAST. Thecolonization event forming the Nearctic lineage hap-pened around the Mid or Late Pleistocene (Figures 2and 4, Table 2). All three Nearctic sublineages (eastern,mountain, and widespread) were formed before theLGM (Figures 2 and 4, Table 2). The close relationshipbetween North American and Eurasian Holarctic lineagered foxes (Figures 2 and 3) indicated that the NorthAmerican Holarctic lineage colonized North Americamuch more recently than the Nearctic lineage, probablyaround the LGM (Figure 4).Also Japan was colonized several times independently
by individuals from the Holarctic lineage. The southernislands Honshu and Kyushu were colonized during theLate Pleistocene, or around the LGM (Figures 2 and 4,Table 2). The northern island Hokkaido was colonizedseveral times. The lineage Hokkaido II arrived most
Table 3 Mismatch distribution analysis under a sudden expandifferent mitochondrial lineages
Geographic region,mtDNA lineagea
τ(confidenceinterval)
Deviation from suddenexpansion model (p-value)
Ti
North America,Nearctic lineage
10.580(0.541–19.053)
0.115
North America,eastern lineage
1.086(0.516–1.641)
0.371
North America,widespread lineage
13.295(0.697–24.838)
0.071
Japan, Hokkaido II 1.725(0–4.025)
0.743
aMismatch analyses were performed for all lineages (see Table 1). Time since expanthe sudden expansion model (p > 0.05).bTime estimates calculated based on a per-lineage substitution rate of 7.1% (u = 2.3respectively.ka thousand years, My million years.
likely during the end of the Late Pleistocene (Figures 2and 4, Table 2). Due to the close relationship of HokkaidoIa and Hokkaido Ib red foxes to Eurasian mainlandred foxes (Figures 2 and 3), the two groups mostlikely colonized Hokkaido more recently than theHokkaido II lineage did, probably around the LGM(Figure 4).
DemographyWhen we tested the exponential population growthmodel in BEAST, the exponential growth rate fluctuatedaround zero, so we could not reject the constant popula-tion size model for the entire dataset. Fu’s FS showed asignal of population growth across all red fox sequences,with a highly significant (p ≤ 0.001) value of −23.363(Table 1). Except for the Nearctic widespread lineage,all major lineages had a significant (p ≤ 0.02) FS, withnegative values ranging from −0.189 for the JapaneseHokkaido II lineage to −23.701 for the Holarctic lineage(Table 1). Star-like structures in a median joining net-work (Figure 3) also indicated evolutionarily recentpopulation growth for these lineages.We calculated mismatch distributions for all lineages
in Arlequin. For the Nearctic lineage, the Nearctic east-ern and widespread lineages, and the Japanese HokkaidoII lineage, population growth was confirmed by mis-match distribution analyses, where simulations inArlequin did not differ significantly (p > 0.05) from ex-pectations under the sudden expansion model (Table 3).The Nearctic lineage started to diversify around the LatePleistocene/LGM, as further supported by our dating inBEAST of the most basal bifurcation within each lineage(Figure 2, Table 2 and 3). The estimated sudden expan-sion for the Nearctic eastern lineage of 23 (11–35) ka(assuming 7.1% per-lineage substitution rate per My),and 5 (2–7) ka (assuming 33.2% per-lineage substitutionrate per My) (Table 3) overlapped with the period
sion model and time since expansion calculated for
me since expansion [ka] (7.1%substitutions/lineage/My)b
Time since expansion [ka] (33.2%substitutions/lineage/My)b
222.4 (11.4–400.5) 47.6 (2.4–85.7)
22.8 (10.8–34.5) 4.9 (2.3–7.4)
279.5 (14.7–522.1) 59.8 (3.1–111.7)
36.2 (0–84.6) 7.8 (0–18.1)
sion was only calculated for lineages where τ did not differ significantly from
79*10-5; see [2]) or 33.2% per million years (u = 1.112*10-4; see Table 2),

Kutschera et al. BMC Evolutionary Biology 2013, 13:114 Page 8 of 15http://www.biomedcentral.com/1471-2148/13/114
indicated by the BEAST analyses (Figure 2, Table 2).Population expansion of the Japanese Hokkaido IIlineage started about 36 (0–85) ka with 7.1% per-lineagesubstitution rate per My, and about 8 (0–18) ka with33.2% per-lineage substitution rate per My (Table 3),similar to the date estimate from the BEAST analysis of6 (1–15) ka (Figure 2). The very recent date estimatesfor the most basal bifurcation in Hokkaido II during theHolocene (Figure 2, Table 3) were possibly a result ofgenetic drift removing more ancient lineages in thisclade (e.g., [34]). Because deviation from the suddenexpansion model in Arlequin was significant for theremaining major clades, we could not determine the tim-ing for any onset of population expansion for them. How-ever, based on the BEAST results, the Honshu/Kyushupopulation diversity was slightly older than the HokkaidoII population diversity, with 95% credibility intervals span-ning the LGM (Figure 2, Table 3).The two methods we used to detect population
growth are characterized by different levels of sensitiv-ity: tests based on mismatch distribution analyses areconservative and less powerful than Fu’s FS to detectpopulation growth [35]. This might explain inconsist-encies in our demographic inferences: Fu’s FS wasnegative and significant for the Nearctic mountainlineage and the Japanese Honshu/Kyushu lineage(Table 1), whereas mismatch distribution analysesfailed to detect population growth (thus not enablingus to obtain an estimate of the timing from the mis-match distribution analysis for these lineages). TheNearctic widespread lineage showed the opposite re-sult: while mismatch distribution analyses indicatedpopulation growth (Table 3), Fu’s FS was positive(Table 1). Our inferred timing of the onset of suddenexpansion of this lineage from mismatch distributionanalysis (about 280 (15–522) ka with 7.1% per-lineagesubstitution rate per My, and about 60 (3–112) kawith 33.2% per-lineage substitution rate per My;Table 3) should therefore be taken with caution, espe-cially since the time estimate inferred from BEAST(24 (9–46) ka; Figure 2; see also Table 2) was younger.
DiscussionOur synthesis of 677 published and publicly availablesequences together with 52 newly obtained sequencesincludes previously unsampled geographic regions (e.g.,central Siberia; Figure 1), and confirms previous classi-fications of mitochondrial lineages in red foxes[21,23,24,27]. In this study, we delineate the range-wide timing and pattern of phylogeographic events forthis widespread carnivore. During the Mid Pleistocene,a period characterized by repeated climatic oscilla-tions, red foxes started to diversify. One lineage (theHolarctic lineage) today occurs across most of the
entire distribution range, including North America,Europe, and Asia. In contrast, other red fox lineagesare regionally restricted. During the Late Pleistoceneand Holocene, North America and Japan were colo-nized several times independently by red foxes (Figures 2and 4), likely at times when landbridges connectedthese islands to adjacent landmasses (except forHonshu/Kyushu, see below). Our dating of subse-quent diversification events suggests that demographicexpansions in many red fox populations occurred sincethe Late Pleistocene. Our suggested timeline and pat-tern of phylogeographic events in red foxes closelyresembles the scenarios described for the ecologicallysimilar and co-distributed grey wolves and brownbears [8,10,13,36], reinforcing that ecological and cli-matic factors had similar effects on temperate zonespecies.
Phylogeographic history of red foxesMid PleistoceneAccording to the fossil record [37], red foxes werealready present in Eurasia during the Mid Pleistocene,around 300 ka, a timing consistent with our finding ofthe most basal diversification within red foxes duringthat time (Figure 2). For extended time periods sincethe Mid Pleistocene, North America was connected toEurasia via the Bering landbridge [38], at glacial times oflower sea level, allowing species like the red fox tocolonize North America several times independently.Red fox fossil remains from Alaska indicate that NorthAmerica was first colonized during the Illinoian glaci-ation (ca. 300–130 ka) [39]. This period overlaps withour estimate for the emergence of the Nearctic lineage(Scenario 2, Table 2), likely corresponding to thecolonization of North America from Eurasia around theend of the Mid Pleistocene (Figures 2 and 4).
Late PleistoceneThe fossil record indicates that some North Americanred foxes persisted through the Late Pleistocene glacia-tions (Wisconsin; ca. 100–10 ka) south of the ice sheets[40-42]. It would be interesting to use ancient DNAtechniques to verify whether such remains indeed belongto the Nearctic red fox mitochondrial lineage. Consistentacross a broad range of different rate calibrations(Table 2), we found a Late Pleistocene diversification ofthe Nearctic lineage into three sublineages (Figures 2and 4), the eastern, mountain, and the widespreadlineages.During the same time frame, the Holarctic lineage fur-
ther diversified in Eurasia (Figures 2 and 4). From thisdiversity, Japan was colonized several times independ-ently. Japan’s main southern islands Honshu and Kyushuhave been isolated from the Eurasian mainland and

Kutschera et al. BMC Evolutionary Biology 2013, 13:114 Page 9 of 15http://www.biomedcentral.com/1471-2148/13/114
Hokkaido in the north since the Mid Pleistocene(reviewed in [43]). The Tsugaru Strait separating Hokkaidofrom Honshu/Kyushu represents a biogeographic barrier(Blakiston’s line [44]) for many species since the MidPleistocene (reviewed in [43]), including the red fox.However, red foxes appear to have colonized Honshuand Kyushu during the Late Pleistocene (Figures 2 and 4).The European fossil record indicates potential humaninfluence on red fox dispersal (based on the commonfinding of red fox remains in European archaeologicalassemblages; [17]). Humans first reached Japan ca.50 ka (reviewed in [45]), consistent with our red foxcolonization time estimate for Honshu and Kyushu. Redfoxes might thus have reached these islands throughhuman introduction, although non-human facilitatedrafting or temporary ice bridges connecting Honshuand Hokkaido [46] are also plausible alternatives.During most of the Late Pleistocene glacial phases,
Hokkaido was repeatedly connected to the Eurasianmainland via the Russian island Sakhalin [43]. In-deed, red foxes from the Hokkaido II lineage colonizedHokkaido during the Late Pleistocene (Figures 2 and 4),most likely from the mainland via these northernlandbridges.
Around the last glacial maximum (LGM)The phylogeographic structure found in North Americanred foxes has been interpreted to result from range frag-mentation by ice sheets during glacial maxima [23]. Incontrast, we did not find a strong signal of red fox sur-vival during the LGM in distinct and isolated southernrefugia in Eurasia. In fact, the Holarctic lineage appearsto be geographically largely unstructured and shows onlyweak signs of past population fragmentation (Figures 2and 3; see also [25,26]). This could support the notion ofred foxes as habitat generalists that were able to survivethe LGM period in the vast arctic steppes, as shown fora now-extinct wolf ecotype [34]. However, red fox re-mains have not been found in the arctic steppe regionsof northern and central Europe during the LGM [17].Indeed, contemporary red fox distribution and popula-tion ecological studies suggest that the species has anorthern (and upper latitudinal) limit in its distribution,where more arctic-adapted species like the arctic foxhave a competitive advantage (e.g., [47]). Survival of redfoxes during the LGM in southern refugia is supportedby several lines of evidence: (i) our finding of (albeitweakly) differentiated mitochondrial sublineages inSerbia (Figure 3), (ii) genetic differentiation of Iberianred foxes from other European populations [26], (iii)signs of low connectivity among different Mediterraneanpopulations [48], and (iv) the restriction of red foxes tosouthern European refugial regions during the LGM[17]. Similar to findings from brown bears [10], the high
dispersal capability of red foxes and their rapidrecolonization of suitable habitats after deglaciation mayhave led to gene flow among refugia, preventing thedevelopment of pronounced phylogeographic structur-ing. Our finding of signals of population expansions inmany red fox lineages (Tables 1 and 3) likely reflects thispostglacial demographic growth.The following conditions may therefore have pre-
vented the formation of deeply separated mitochondriallineages in Eurasian red foxes: only short periods (ca.10 ka [17]) of geographic restriction in refugia for gen-etic differentiation, and potential for some gene flowamong such refugial regions in periods of temporarywarming within longer climatic cold phases. Ongoingrange expansion of red foxes north and into higher alti-tudes into traditional arctic fox habitats (e.g., [49-51])may mirror this situation of rapid recolonization ofnorthern habitats.The extensive mitochondrial gene flow among Eurasian
red fox populations also reached parts of North America,forming a vast Holarctic population (Figure 4). Ice-free re-gions of Alaska and the Yukon (Beringia) were connectedto Eurasia via the Bering landbridge during glacial max-ima, but separated from regions south of the Laurentideand Cordilleran ice sheets [7]. Due to postglacial sea levelrise, the Holarctic North American population was even-tually isolated from the rest of the Holarctic lineage whenthe Bering landbridge was closed. Today, North Americanand Eurasian haplotypes from the Holarctic lineageare still intermingled (Figures 2 and 3), confirming theirrecent evolutionary separation. However, we found nohaplotype sharing between North American and Eurasianred foxes (but note the shared haplotype between main-land Asia and Hokkaido; see Additional file 1), likelyreflecting a post-LGM interruption of trans-Beringiangene flow. Similarly, the British Isles belonged to theEurasian landmass during much of the Late Pleistoceneand early Holocene. Edwards et al. [26] found red foxesfrom the British Isles to be only weakly differentiatedfrom European main land foxes, resulting from recentpostglacial isolation. Japan’s northern island Hokkaidowas also repeatedly part of the Eurasian landmass dur-ing the Late Pleistocene, which is reflected by the pres-ence of at least three distinct red fox lineages (HokkaidoIa, Hokkaido Ib, and Hokkaido II; Figures 2 and 3; [21]).Hokkaido I haplotypes (Ia and Ib) are closely relatedto Eurasian mainland haplotypes (Figures 2 and 3),suggesting that they were isolated only recently fromthe rest of the Holarctic lineage. This may have oc-curred after the LGM (Figures 2 and 4) when risingsea levels isolated Hokkaido from the Asian main-land [43].Genetic and paleontological data indicate that popula-
tion expansion after the LGM occurred rapidly in

Kutschera et al. BMC Evolutionary Biology 2013, 13:114 Page 10 of 15http://www.biomedcentral.com/1471-2148/13/114
European red foxes ([17,26]; see also the signals ofdemographic expansion in Table 3). The finding ofsublineages within the Holarctic diversity in southernEurope [26,48] indicates that some southern red fox pop-ulations contributed less to the postglacial recolonizationof Eurasia, while other lineages showed wide-rangingdispersal, even across Beringia (Figure 4).Despite these signals of extensive wide-ranging gene
flow in red foxes, mtDNA also shows some signals ofcurrently restricted gene flow, even within continents.Studies reporting local adaptations by red foxes in someregions that are discussed below confirm this view. Inour dataset, the only instances of haplotype sharingoccur among neighboring populations in Europe, and asingle case involving Hokkaido and the Asian mainland(Additional file 1). Similarly, studies on red foxes usingnuclear microsatellites have shown dispersal restrictionson shorter time scales [24,52-54], consistent with lowerlevels of gene flow today.
Common phylogeographic trends in Holarctic carnivoresTwo other large carnivores that have a Holarctic distri-bution and generalist habitat requirements are thebrown bear and the grey wolf. Both species are highlymobile and flexible regarding their habitat requirements.Besides their ecology, they share remarkably similarphylogeographic patterns with the red fox. All three spe-cies are characterized by very widespread Holarcticmitochondrial lineages that are distributed acrossEurasia and North America, and only some locallyrestricted lineages - indicating dispersal limitationsin some regions of the Holarctic [8,9,11-13,34,55].Independent colonization events from Eurasia led to
the establishment of several endemic North Americanlineages such as grey wolves [34] and brown bears [13].Those lineages survived the Late Pleistocene glaciationssouth of the North American ice sheets. Since the LGMperiod, additional Eurasian lineages immigrated via theBering landbridge into the Nearctic, leading to currentdenomination of those lineages as Holarctic (Figure 4).Brown bears also inhabit the Japanese island Hokkaido.Similar to the situation in red foxes, Hokkaido was colo-nized at least three times by brown bears. Hokkaido har-bors three distinct brown bear lineages, each being mostclosely related to different mainland lineages [56].The grey wolf is another extensively studied example
of a Holarctic generalist that displays a worldwide weakphylogeographic pattern, but with some geographicallyrestricted mitochondrial lineages. It appears that espe-cially some southern wolf populations did not expandafter the Pleistocene glaciations: two distinct lineagessurvived south of the Himalayas [9]. In brown bears, asimilar situation has been described for Syria and Iran[11,13], and in red foxes analogous evidence exists for
Iberia [26,48] and Serbia (Figure 3; data from Kirschninget al. [22]).Likely reflecting even more recent processes, grey
wolves have been shown to be locally adapted to specifichabitat and foraging conditions in Pacific temperatecoastal rainforests [12,15]. Further, eastern Europeangrey wolf population structure appears to be correlatedwith ecological factors [36,57]. As reviewed by Sackset al. [24], North American montane red fox populationsshow physiological and morphological adaptations tocold climate, and are genetically distinct from other redfox populations (Nearctic mountain lineage) [23]. A re-fined sampling in this region supported an indigenousorigin of the Sacramento Valley population, which dif-fers in body size from the montane red fox popula-tions [24].In summary, bears, wolves, and red foxes show similar
phylogeographic structuring and evidence of large-scalegene flow, but also of recently reduced levels of connect-ivity and local adaptations in some regions.
OutlookFruitful future research will be a refined sampling in sev-eral geographic regions, especially in northern Africa,Asia, and Eastern Europe. Because some southern popu-lations appear not to have contributed to large-scalepostglacial range expansions, those seem particularlylikely to harbor previously undetected genetic variation.High sequence variability in some mitochondrial gen-omic regions can provide enough information to detectphylogeographic events, especially the hypervariable 5′end of the mammalian mtDNA control region. How-ever, analysis of a larger mtDNA fragment or of thewhole mitochondrial genome can reveal additionalphylogeographic structure, in particular among re-cently diverged lineages [58-63]. Such a larger frag-ment could help overcome some of the topologicaluncertainties present in our dataset.Microsatellite markers have been used to study the
fine-scale population structure in geographically re-stricted red fox populations [24,52-54]. Frati et al. [48]used allozymes and cytochrome b sequences to comparegenetic variability among some European red fox popu-lations. To date, most studies on the large-scale popula-tion structuring and phylogeography of red foxes haveutilized mtDNA sequences [21-27,29]. As a maternallyinherited molecule with a high mutation rate, comparedto the nuclear genome, and fast coalescence (due tolower effective population size than autosomal loci),mtDNA has been used to resolve phylogeographic struc-tures in many taxa. However, as male-mediated geneflow cannot be detected from mtDNA, more completeinferences of the phylogeographic history of a speciesshould include biparentally or paternally inherited

Kutschera et al. BMC Evolutionary Biology 2013, 13:114 Page 11 of 15http://www.biomedcentral.com/1471-2148/13/114
markers (e.g., [64,65]), especially in species like the redfox where males disperse more than females [20].Therefore, the application of SNP chips, modern high-
throughput sequencing techniques [63], and/or the es-tablishment of new (nuclear) markers in a synthesis withphenotypic features and ecological adaptations (e.g.,[12,66]) will lead to a deeper understanding of thephylogeographic history and adaptations of this wide-spread generalist.
MethodsSamples and DNA extractionIn total, 52 red fox samples and one arctic fox samplewere used in this study (Figure 1, Additional file 1). 33red fox muscle and skin samples were collected inGermany, Finland, Poland, and central Siberia. The arc-tic fox muscle sample was collected in central Siberia(Additional file 1). All samples originated from deadwildlife legally hunted during hunting season accordingto local law, and the animals were not killed specificallyfor this study. No ethical approval or permit for animalexperimentation was required. Additionally, 16 hair and3 fecal samples were collected in Germany.Total DNA was extracted from muscle and skin sam-
ples using a standard salt extraction protocol (modifiedfrom the Puregene™ DNA extraction kit). We extractedDNA from hair using the QIAamp DNA Investigator kit(Qiagen, Hilden) protocols for hair and the QIAampDNA Stool Mini Kit for fecal samples following themanufacturers’ instructions.
Amplification and sequencingA 449 bp fragment (excluding primers) from the 5′ endof the mitochondrial control region was amplified usingthe primers Vv.CRS1F 5′-CCCCAAGACTCAAGGAAG-AGGCAC and Vv.CRS1R 5′-ACACCACAGTTATG-TGTGATCATGGGC. These primers were newly designedbased on an alignment of published Vulpes mitochondrialsequence [GenBank:GQ374180, AF098155, EU935091(unpublished); GenBank:AM181037, NC_008434 [67];GenBank:AB292765, AB292754, AB292741 [21]; GenBank:D83639 [68]; GenBank:AJ585358 [69]]. The forward pri-mer is located at the end of the mitochondrial tRNA-Thr and the beginning of the tRNA-Pro genes, andthe reverse primer is located 397 nucleotides into inthe control region. The amplified region encompassesthe hypervariable region targeted in previous red foxcontrol region studies, allowing direct comparison ofthe data. PCR reactions were carried out in 15 μl vol-umes containing approximately 15 ng of genomicDNA, 0.27 μM of each primer, 0.16 μg/μl BSA (NewEngland Biolabs, Ipswich, MA, USA), and 0.8 × ofVWR Taq DNA Polymerase Master Mix containinga final concentration of 1.6 mM MgCl2 (VWR,
Darmstadt, Germany). PCR was performed on aUnocycler (VWR, Darmstadt, Germany) using the fol-lowing thermal profile: 3 min at 95°C prior to 40 cyclesof 30 s at 94°C, 25 s at 59°C, and 1 min 15 s at 72°C;followed by an extension step of 10 min at 72°C. PCRproducts were detected using standard 1.5% agarosegel electrophoresis, and cycle sequenced with BigDye3.1 chemistry (Applied Biosystems, Foster City, CA,USA) according to the manufacturer’s recommenda-tion using 1/12th of the reaction mix, with 0.16 μl ofBigDye in a 10 μl total volume reaction. DetectedPCR products were run on an ABI 3100 instrument(Applied Biosystems). Electropherograms were assem-bled, checked manually, and sequences were alignedusing Geneious 5.4 (Biomatters).
Sequence analysesA total of 677 previously published and publicly avail-able sequences from wild red fox populations were col-lated from GenBank for the control region [21-25,27,28](Figure 1, Additional file 1). Aubry et al. [23], Sacks et al.[24], and Statham et al. [27] obtained most sequencesfrom museum specimens (1850–1991), the 35 sequencesfrom Teacher et al. [25] were from the Late Pleistoceneand early Holocene. All other sequences were of recentorigin (>1989) [21,22,24,27,28]. The 52 newly obtainedred fox sequences (from samples collected since 2009)were added to a final alignment containing in total 729red foxes, with a length of 335 bp. Ancient DNA sam-ples from Teacher et al. [25] and one modern sequencefrom Valière et al. [28] were shorter (179–268 bp), andtherefore omitted in network analyses (see below). Acomprehensive list of all analyzed sequences, includinggeographic origins (see also Figure 1), GenBank acces-sion numbers, and referenced study is provided inAdditional file 1.
Data analysesWe determined parameters of within-population vari-ability for all samples and major lineages using Arlequin3.5 [70], calculating the number of segregating sites andhaplotypes, haplotype diversity (Hd), nucleotide diversity(π), and Fu’s FS [71], an indicator of population expan-sion when it is negative and significant (p ≤ 0.02)[35,70,71] (Table 1).Mismatch distributions under the sudden expansion
model [72] were modeled and investigated in Arlequin3.5 [70]. The sudden expansion model assumes popula-tion growth from a population at equilibrium with θ = θ0to a new size with θ = θ1 within τ units of mutationaltime, with τ = 2*u*t (u = substitution rate per lineage forthe entire DNA fragment, and t = number of generationssince the expansion; see [73]). Time since expansion wasthus calculated by dividing the estimate of τ by the
Kutschera et al. BMC Evolutionary Biology 2013, 13:114 Page 12 of 15http://www.biomedcentral.com/1471-2148/13/114
product of: 335 (sequence length in base pairs) and thedivergence rate (twice the per-lineage substitution rate;see [74]) in percent per year. Generation time for redfoxes was assumed to be one year [16,75]. To testgoodness-of-fit of the observed mismatch distribution tothat expected under the sudden population expansionmodel, the sum of squared deviations [76] was com-puted in Arlequin with 10,000 replicates. To calculatetime since expansion for those lineages that did not de-viate from sudden expansion (p > 0.05), we assumed aper-lineage substitution rate of: (i) 7.1% substitutions perlineage per million years (or u = 2.379*10-5), a rate previ-ously used for the arctic fox [2], and (ii) 33.2% substitu-tions per lineage per million years (u = 1.112*10-4), themean rate estimated from two independent simulationsin BEAST (Scenario 1; details see below) (Table 3).A median-joining network of nucleotide sequences
(n = 693) was constructed using the software Network4.6.1.0 [77] (Figure 3). Due to their shorter sequencelength and thus missing data, all 35 ancient samplesfrom Teacher et al. [25] and one modern sample fromValière et al. [28] were excluded.To identify the model of sequence evolution that best
fit the data, we used jmodeltest 0.0.1 [78], which sug-gested the TN93 + G + I model of sequence evolution. Aphylogeny and divergence time estimates for differentlineages were obtained from simulations in BEASTv1.7.5 [79]. For computational reasons, a maximumnumber of eight individuals was included per haplo-type. BEAST was set to run for 1 billion generations,sampling every 10,000th generation. Convergence waschecked in Tracer v1.5. Two runs with identical set-tings were combined before resampling ca. 20,000trees, both using LogCombiner v1.7.5 (without settinga burn-in). A maximum clade credibility tree wasconstructed using TreeAnnotator with a burn-in of10%. Besides the constant population size model, wealso evaluated the exponential population growthmodel implemented in BEAST.A combined approach was used for dating of
phylogeographic events, utilizing the arctic fox as exter-ior calibration point, plus tip dates based on publishedancient DNA red fox sequences [25]. This approach ac-counts for major discrepancies from the possible timedependency of the molecular clock on recent evolution-ary time scales [32]. The fossil tip calibrations arecloser to the phylogeographic time frames of interestthan the exterior calibration point, avoiding possiblerate shifts. To further validate the robustness of ourdating methodology, we performed a simulation usingonly tip dates, without setting a prior for the rootheight of the tree.The divergence time to the arctic fox was used as ex-
terior calibration point, because to our knowledge this is
the closest relative to the red fox with an available diver-gence time estimate.We tested three scenarios in BEAST, all three using
the same tip dates, but varying root heights as exteriorcalibration points (Table 2). Scenario 1: the uniformprior for the root height was set to 1.75-4 million years(My), according to the 95% credibility interval in Periniet al. [80] for the divergence time between red and arcticfox (Figure 2). Scenario 2: we tested a uniform prior thatspanned a period of 5.1-6 My, according to the 95%credibility interval for another divergence time estimateby Nyakatura and Bininda-Emonds [81]. Scenario 3: avery recent divergence time scenario was tested, basedon the first appearance of the red fox in the fossil record(0.5-1 Mya) [30,31], setting the minimum age of the rootheight to 0.5 My and using a lognormal prior. As thespeciation event very likely happened earlier than 0.5Mya [80,81], the 95% interval of the lognormal prior in-cluded a period of up to 5.9 My.A phylogenetic analysis of haplotype data was
conducted in MrBayes 3.2 [82] (Additional file 3). Weused jmodeltest 0.0.1 [78] to find the model of evolutionthat best fits the data (HKY + G + I). The analysis wasrun for 15 million MCMC generations sampling every2,000th generation, with a burnin of 25%. We used fourheated chains and confirmed convergence using the po-tential scale reduction factor [83], a convergence diag-nostic implemented in MrBayes, which approached1.000 for all parameters.
Additional files
Additional file 1: Sequence information for all individuals analyzedin this study. Individual IDs, haplotype frequencies, consecutivehaplotype numbers, individuals with identical sequence, geographicorigins, age assumed for the BEAST analyses, GenBank accessionnumbers, corresponding abbreviations used in the original sourcestudies, and the corresponding references are provided. The designationof individuals is explained in detail in the table caption.
Additional file 2: Sample size and number of mtDNA control regionhaplotypes for newly sequenced red foxes. This pdf-file contains atable giving details on haplotypes (novelty, haplotype-sharing) that werereconstructed from 52 newly sequenced red foxes.
Additional file 3: Bayesian inference tree of red fox mtDNA controlregion haplotypes. This png-file contains a Bayesian inference tree thatwas based on 175 haplotypes reconstructed in MrBayes. All majorlineages are indicated by square brackets. Interesting haplotypes withinthe Holarctic lineage are indicated as follows: grey stars: JapaneseHokkaido Ia and Ib haplotypes (Holarctic lineage); black stars: Serbianhaplotypes; black stars with parallel white stripes: central Siberianhaplotypes; black stars with white edge: North American haplotypes(Holarctic lineage).
Competing interestsThe authors declare that they have no competing interests.
Authors’ contributionsVEK performed laboratory analyses, analyzed the data, and wrote themanuscript. AJ helped conceive the study and contributed reagents. NL, NS,

Kutschera et al. BMC Evolutionary Biology 2013, 13:114 Page 13 of 15http://www.biomedcentral.com/1471-2148/13/114
AAS, TH, and CN contributed samples. KS contributed samples and extractednon-invasive samples. NL, AJ, NS, AAS, TH, KS, and CN participated in revisingthe manuscript. FH conceived the study, analyzed the data, and wrote themanuscript. All authors read and approved the final manuscript.
AcknowledgementsWe thank Vasiliy Sokolov, Natalya Sokolova, Kamila Plis, Filip Zięba, JochenBecker, and Tomas Häggvik for providing us with samples, and AnnaKaempffe and Jessica Appel for assistance in the lab. Sampling was partlyfunded by the Research Council of Norway within the IPY project "Arcticpredators" and by the Program of UD RAS, project No 12-4-7-022-Arctic. Weacknowledge the contribution of the Department of Environment/Government of Nunavut. We thank Frank Zachos and three anonymousreviewers for helpful comments on a previous version of the manuscript. Thestudy was supported by Hesse’s funding program LOEWE (Landes-Offensivezur Entwicklung Wissenschaftlich-ökonomischer Exzellenz).
Author details1Biodiversity and Climate Research Centre (BiK-F), Senckenberg Gesellschaftfür Naturforschung, Senckenberganlage 25, 60325 Frankfurt am Main,Germany. 2Department of Arctic and Marine Biology, University of Tromsø,N-9037 Tromsø, Norway. 3Department of Environment, Government ofNunavut, X0A0L0 Igloolik, Canada. 4Institute for Ecology, Evolution andDiversity, Goethe University Frankfurt, Max-von-Laue-Straße 13, 60438Frankfurt am Main, Germany. 5Institute of Nature Conservation, PolishAcademy of Sciences, Mickiewicza 33, 31-120 Krakow, Poland. 6EcologicalResearch Station of the Institute of Plant and Animal Ecology, RussianAcademy of Sciences, Labytnangi, 629400 Russia. 7Conservation GeneticsGroup, Senckenberg Research Institute and Natural History MuseumFrankfurt, Clamecystraße 12, 63571 Gelnhausen, Germany.
Received: 1 February 2013 Accepted: 29 May 2013Published: 5 June 2013
References1. Paetkau D, Amstrup SC, Born EW, Calvert W, Derocher AE, Garner GW,
Messier F, Stirling I, Taylor MK, Wiig Ø, Strobeck C: Genetic structure of theworld’s polar bear populations. Mol Ecol 1999, 8:1571–1584.
2. Dalén L, Fuglei E, Hersteinsson P, Kapel CMO, Roth JD, Samelius G,Tannerfeldt M, Angerbjörn A: Population history and genetic structure ofa circumpolar species: the arctic fox. Biol J Linn Soc 2005, 84:79–89.
3. Wooding S, Ward R: Phylogeography and pleistocene evolution in theNorth American black bear. Mol Biol Evol 1997, 14:1096–1105.
4. Seddon JM, Santucci F, Reeve NJ, Hewitt GM: DNA footprints of Europeanhedgehogs, Erinaceus europaeus and E. concolor: Pleistocene refugia,postglacial expansion and colonization routes. Mol Ecol 2001,10:2187–2198.
5. Niedziałkowska M, Jędrzejewska B, Honnen A-C, Otto T, Sidorovich VE,Perzanowski K, Skog A, Hartl GB, Borowik T, Bunevich AN, Lang J, Zachos FE:Molecular biogeography of red deer Cervus elaphus from easternEurope: insights from mitochondrial DNA sequences. Acta Theriol 2011,56:1–12.
6. Taberlet P, Fumagalli L, Wust-Saucy A-G, Cosson J-F: Comparativephylogeography and postglacial colonization routes in Europe. Mol Ecol1998, 7:453–464.
7. Hewitt G: The genetic legacy of the Quaternary ice ages. Nature 2000,405:907–913.
8. Vilà C, Amorim IR, Leonard JA, Posada D, Castroviejo J, Petrucci-Fonseca F,Crandall KA, Ellegren H, Wayne RK: Mitochondrial DNA phylogeographyand population history of the grey wolf Canis lupus. Mol Ecol 1999,8:2089–2103.
9. Sharma DK, Maldonado JE, Jhala YV, Fleischer RC: Ancient wolf lineages inIndia. P R Soc B 2004, 271:S1–S4.
10. Valdiosera CE, García N, Anderung C, Dalén L, Crégut-Bonnoure E,Kahlke R-D, Stiller M, Brandström M, Thomas MG, Arsuaga JL, GötherströmA, Barnes I: Staying out in the cold: glacial refugia and mitochondrialDNA phylogeography in ancient European brown bears. Mol Ecol 2007,16:5140–5148.
11. Calvignac S, Hughes S, Hänni C: Genetic diversity of endangered brownbear (Ursus arctos) populations at the crossroads of Europe, Asia andAfrica. Divers Distrib 2009, 15:742–750.
12. Muñoz-Fuentes V, Darimont CT, Wayne RK, Paquet PC, Leonard JA:Ecological factors drive differentiation in wolves from British Columbia.J Biogeogr 2009, 36:1516–1531.
13. Davison J, Ho SYW, Bray SC, Korsten M, Tammeleht E, Hindrikson M,Østbye K, Østbye E, Lauritzen S-E, Austin J, Cooper A, Saarma U:Late-Quaternary biogeographic scenarios for the brown bear (Ursusarctos), a wild mammal model species. Q Sci Rev 2011, 30:418–430.
14. Edwards CJ, Suchard MA, Lemey P, Welch JJ, Barnes I, Fulton TL, Barnett R,O’Connell TC, Coxon P, Monaghan N, Valdiosera CE, Lorenzen ED, WillerslevE, Baryshnikov GF, Rambaut A, Thomas MG, Bradley DG, Shapiro B: AncientHybridization and an Irish Origin for the Modern Polar Bear Matriline.Curr Biol 2011, 21:1251–1258.
15. Weckworth BV, Dawson NG, Talbot SL, Flamme MJ, Cook JA: Going Coastal:Shared Evolutionary History between Coastal British Columbia andSoutheast Alaska Wolves (Canis lupus). PLoS One 2011, 6:e19582.
16. Larivière S, Pasitschniak-Arts M: Vulpes vulpes. Mamm Species 1996,537:1–11.
17. Sommer R, Benecke N: Late-Pleistocene and early Holocene history of thecanid fauna of Europe (Canidae). Mamm Biol 2005, 70:227–241.
18. Voigt DR: Red fox. In Wild furbearer management and conservation in NorthAmerica. Edited by Novák M, Baker JA, Obbard ME, Malloch B. Toronto:Ontario Ministry of Natural Resources; 1987:379–382.
19. Goszczynski J: Population dynamics of the red fox in central Poland. ActaTheriol 1989, 34:141–154.
20. Allen SH, Sargeant AB: Dispersal Patterns of Red Foxes Relative toPopulation Density. J Wildl Manage 1993, 57:526–533.
21. Inoue T, Nonaka N, Mizuno A, Morishima Y, Sato H, Katakura K, Oku Y:Mitochondrial DNA Phylogeography of the Red Fox (Vulpes vulpes) inNorthern Japan. Zool Sci 2007, 24:1178–1186.
22. Kirschning J, Zachos FE, Cirovic D, Radovic IT, Hmwe SS, Hartl GB:Population Genetic Analysis of Serbian Red Foxes (Vulpes vulpes) byMeans of Mitochondrial Control Region Sequences. Biochem Genet 2007,45:409–420.
23. Aubry KB, Statham MJ, Sacks BN, Perrine JD, Wisely SM: Phylogeography ofthe North American red fox: vicariance in Pleistocene forest refugia. MolEcol 2009, 18:2668–2686.
24. Sacks BN, Statham MJ, Perrine JD, Wisely SM, Aubry KB: North Americanmontane red foxes: expansion, fragmentation, and the origin of theSacramento Valley red fox. Conserv Genet 2010, 11:1523–1539.
25. Teacher AG, Thomas JA, Barnes I: Modern and ancient red fox (Vulpesvulpes) in Europe show an unusual lack of geographical and temporalstructuring, and differing responses within the carnivores to historicalclimatic change. BMC Evol Biol 2011, 11:214.
26. Edwards CJ, Soulsbury CD, Statham MJ, Ho SYW, Wall D, Dolf G, Iossa G,Baker PJ, Harris S, Sacks BN, Bradley DG: Temporal genetic variation of thered fox, Vulpes vulpes, across western Europe and the British Isles. Q SciRev 2012, 57:95–104.
27. Statham MJ, Sacks BN, Aubry KB, Perrine JD, Wisely SM: The origin ofrecently established red fox populations in the United States:translocations or natural range expansions? J Mammal 2012, 93:52–65.
28. Valière N, Fumagalli L, Gielly L, Miquel C, Lequette B, Poulle M-L, Weber J-M,Arlettaz R, Taberlet P: Long-distance wolf recolonization of France andSwitzerland inferred from non-invasive genetic sampling over a periodof 10 years. Anim Conserv 2003, 6:83–92.
29. Yu J-N, Han S-H, Kim B-H, Kryukov AP, Kim S, Lee B-Y, Kwak M: Insights intoKorean Red Fox (Vulpes vulpes) Based on Mitochondrial Cytochrome bSequence Variation in East Asia. Zool Sci 2012, 29:753–760.
30. Kurtén B: Pleistocene Mammals of Europe. Chicago, Illinois: AldineTransaction; 1968.
31. Wayne RK, Van Valkenburgh B, O’Brien SJ: Molecular distance and divergencetime in carnivores and primates. Mol Biol Evol 1991, 8:297–319.
32. Ho SYW, Phillips MJ, Cooper A, Drummond AJ: Time Dependency ofMolecular Rate Estimates and Systematic Overestimation of RecentDivergence Times. Mol Biol Evol 2005, 22:1561–1568.
33. Saarma U, Ho SYW, Pybus OG, Kaljuste M, Tumanov IL, Kojola I,Vorobiev AA, Markov NI, Saveljev AP, Valdmann H, Lyapunova EA,Abramov AV, Männil P, Korsten M, Vulla E, Pazetnov SV, Pazetnov VS,Putchkovskiy SV, Rõkov AM: Mitogenetic structure of brown bears(Ursus arctos L.) in northeastern Europe and a new time frame forthe formation of European brown bear lineages. Mol Ecol 2007,16:401–413.

Kutschera et al. BMC Evolutionary Biology 2013, 13:114 Page 14 of 15http://www.biomedcentral.com/1471-2148/13/114
34. Leonard JA, Vilà C, Wayne RK: Legacy lost: genetic variability and populationsize of extirpated US grey wolves (Canis lupus). Mol Ecol 2005, 14:9–17.
35. Ramos-Onsins SE, Rozas J: Statistical Properties of New Neutrality TestsAgainst Population Growth. Mol Biol Evol 2002, 19:2092–2100.
36. Pilot M, Jedrzejewski W, Branicki W, Sidorovich VE, Jedrzejewska B,Stachura K, Funk SM: Ecological factors influence population geneticstructure of European grey wolves. Mol Ecol 2006, 15:4533–4553.
37. Kurtén B, Anderson E: Pleistocene Mammals of North America. NorthAmerica: Columbia University Press; 1980.
38. Hoffecker JF, Elias SA: The Human Ecology of Beringia. New York: ColumbiaUniversity Press; 2007.
39. Péwé TL, Hopkins DM: Mammal Remains of Pre-Wisconsin Age in Alaska.California: University Press; 1967.
40. Péwé TL: Quaternary Geology of Alaska, Geological Survey Professional Paperno 835. Washington, DC: US Government Printing Office; 1975.
41. Harington CR: Pleistocene vertebrates of the Yukon Territory, Dissertation.University of Alberta; 1977.
42. FAUNMAP Working Group: FAUNMAP: a database documenting lateQuaternary distributions of mammal species in the United States.Illinois State Museum Scientific Papers 1994, 25:1–690.
43. McKay BD: A new timeframe for the diversification of Japan’s mammals.J Biogeogr 2011, 39:1134–1143.
44. Blakiston T: Zoological indications of ancient connection of theJapan Islands with the continent. Trans Asiatic Soc Japan 1883,11:126–140.
45. Ding Q-L, Wang C-C, Farina SE, Li H: Mapping Human Genetic Diversity onthe Japanese Archipelago. Adv Anthropol 2011, 1:19–25.
46. Kawamura Y: Last glacial and Holocene land mammals of the Japaneseislands: their fauna, extinction and immigration.Q Res 2007, 46:171–177.
47. Hersteinsson P, MacDonald DW: Interspecific Competition and theGeographical Distribution of Red and Arctic Foxes Vulpes vulpes andAlopex lagopus. Oikos 1992, 64:505–515.
48. Frati F, Hartl GB, Lovari S, Delibes M, Markov G: Quaternary radiation andgenetic structure of the red fox Vulpes vulpes in the MediterraneanBasin, as revealed by allozymes and mitochondrial DNA.J Zool 1998, 245:43–51.
49. Tannerfeldt M, Elmhagen B, Angerbjörn A: Exclusion by interferencecompetition? The relationship between red and arctic foxes.Oecologia 2002, 132:213–220.
50. Killengreen ST, Lecomte N, Ehrich D, Schott T, Yoccoz NG, Ims RA: Theimportance of marine vs. human-induced subsidies in the maintenanceof an expanding mesocarnivore in the arctic tundra.J Anim Ecol 2011, 80:1049–1060.
51. Rodnikova A, Ims RA, Sokolov AA, Skogstad G, Sokolov V, Shtro V, Fuglei E:Red fox takeover of arctic fox breeding den: an observation from YamalPeninsula, Russia. Polar Biol 2011, 34:1609–1614.
52. Robinson NA, Marks CA: Genetic structure and dispersal of red foxes(Vulpes vulpes) in urban Melbourne. Aust J Zool 2001, 49:589–601.
53. Wandeler P, Funk SM, Largiadèr CR, Gloor S, Breitenmoser U: The city-foxphenomenon: genetic consequences of a recent colonization of urbanhabitat. Mol Ecol 2003, 12:647–656.
54. Oishi T, Uraguchi K, Takahashi K, Masuda R: Population Structures of theRed Fox (Vulpes vulpes) on the Hokkaido Island, Japan, Revealed byMicrosatellite Analysis. J Hered 2011, 102:38–46.
55. Korsten M, Ho SYW, Davison J, Pähn B, Vulla E, Roht M, Tumanov IL, Kojola I,Andersone-Lilley Z, Ozolins J, Pilot M, Mertzanis Y, Giannakopoulos A,Vorobiev AA, Markov NI, Saveljev AP, Lyapunova EA, Abramov AV, Männil P,Valdmann H, Pazetnov SV, Pazetnov VS, Rõkov AM, Saarma U: Suddenexpansion of a single brown bear maternal lineage across northerncontinental Eurasia after the last ice age: a general demographic modelfor mammals? Mol Ecol 2009, 18:1963–1979.
56. Matsuhashi T, Masuda R, Mano T, Murata K, Aiurzaniin A: PhylogeneticRelationships among Worldwide Populations of the Brown Bear Ursusarctos. Zool Sci 2001, 18:1137–1143.
57. Pilot M, Jędrzejewski W, Sidorovich VE, Meier-Augenstein W, Hoelzel AR:Dietary Differentiation and the Evolution of Population Genetic Structurein a Highly Mobile Carnivore. PLoS One 2012, 7:e39341.
58. Björnerfeldt S, Webster MT, Vilà C: Relaxation of selective constraint ondog mitochondrial DNA following domestication. Genome Res 2006,16:990–994.
59. Lindqvist C, Schuster SC, Sun Y, Talbot SL, Qi J, Ratan A, Tomsho LP, KassonL, Zeyl E, Aars J, Miller W, Ingólfsson Ó, Bachmann L, Wiig Ø: Completemitochondrial genome of a Pleistocene jawbone unveils the origin ofpolar bear. Proc Natl Acad Sci USA 2010, 107:5053–5057.
60. Morin PA, Archer FI, Foote AD, Vilstrup J, Allen EE, Wade P, Durban J,Parsons K, Pitman R, Li L, Bouffard P, Nielsen SCA, Rasmussen M, Willerslev E,Gilbert MTP, Harkins T: Complete mitochondrial genome phylogeographicanalysis of killer whales (Orcinus orca) indicates multiple species. GenomeRes 2010, 20:908–916.
61. Rutledge LY, Patterson BR, White BN: Analysis of Canis mitochondrial DNAdemonstrates high concordance between the control region and ATPasegenes. BMC Evol Biol 2010, 10:215.
62. Keis M, Remm J, Ho SYW, Davison J, Tammeleht E, Tumanov IL, Saveljev AP,Männil P, Kojola I, Abramov AV, Margus T, Saarma U: Completemitochondrial genomes and a novel spatial genetic method revealcryptic phylogeographical structure and migration patterns amongbrown bears in north-western Eurasia.J Biogeogr 2013, 40:915–927.
63. McCormack JE, Hird SM, Zellmer AJ, Carstens BC, Brumfield RT: Applicationsof next-generation sequencing to phylogeography and phylogenetics.Mol Phylogenet Evol 2013, 66:526–538.
64. Hellborg L, Gündüz İ, Jaarola M: Analysis of sex-linked sequences supportsa new mammal species in Europe. Mol Ecol 2005, 14:2025–2031.
65. Hailer F, Kutschera VE, Hallstrom BM, Klassert D, Fain SR, Leonard JA,Arnason U, Janke A: Nuclear Genomic Sequences Reveal that PolarBears Are an Old and Distinct Bear Lineage. Science 2012,336:344–347.
66. Nadachowska-Brzyska K, Zieliński P, Radwan J, Babik W: Interspecifichybridization increases MHC class II diversity in two sister species ofnewts. Mol Ecol 2012, 21:887–906.
67. Arnason U, Gullberg A, Janke A, Kullberg M, Lehman N, Petrov EA, Väinölä R:Pinniped phylogeny and a new hypothesis for their origin and dispersal.Mol Phylogenet Evol 2006, 41:345–354.
68. Okumura N, Ishiguro N, Nakano M, Matsui A, Sahara M: Intra- andinterbreed genetic variations of mitochondrial DNA major non-codingregions in Japanese native dog breeds (Canis familiaris). Anim Genet1996, 27:397–405.
69. Statham MJ, Turner PD, O’Reilly C: Use of PCR amplification and restrictionenzyme digestion of mitochondrial D-loop for identification of mustelidsin Ireland. Ir Nat J 2005, 28:1–6.
70. Excoffier L, Lischer HEL: Arlequin suite ver 3.5: a new series of programsto perform population genetics analyses under Linux and Windows.Mol Ecol Resour 2010, 10:564–567.
71. Fu Y-X: Statistical Tests of Neutrality of Mutations Against PopulationGrowth, Hitchhiking and Background Selection. Genetics 1997,147:915–925.
72. Rogers AR, Harpending H: Population growth makes waves in thedistribution of pairwise genetic differences. Mol Biol Evol 1992, 9:552–569.
73. Rogers AR: Genetic Evidence for a Pleistocene Population Explosion.Evolution 1995, 49:608–615.
74. Schenekar T, Weiss S: High rate of calculation errors in mismatchdistribution analysis results in numerous false inferences of biologicalimportance. Heredity 2011, 107:511–512.
75. Lloyd HG: The Red Fox. London: Batsford; 1980.76. Schneider S, Excoffier L: Estimation of Past Demographic Parameters
From the Distribution of Pairwise Differences When the Mutation RatesVary Among Sites: Application to Human Mitochondrial DNA. Genetics1999, 152:1079–1089.
77. Bandelt HJ, Forster P, Röhl A: Median-joining networks for inferringintraspecific phylogenies. Mol Biol Evol 1999, 16:37–48.
78. Posada D: jModelTest: Phylogenetic Model Averaging. Mol Biol Evol 2008,25:1253–1256.
79. Drummond AJ, Suchard MA, Xie D, Rambaut A: Bayesianphylogenetics with BEAUti and the BEAST 1.7. Mol Biol Evol 2012,29:1969–1973.
80. Perini FA, Russo CAM, Schrago CG: The evolution of South Americanendemic canids: a history of rapid diversification and morphologicalparallelism. J Evol Biol 2010, 23:311–322.
81. Nyakatura K, Bininda-Emonds OR: Updating the evolutionary history ofCarnivora (Mammalia): a new species-level supertree complete withdivergence time estimates. BMC Biol 2012, 10:12.

Kutschera et al. BMC Evolutionary Biology 2013, 13:114 Page 15 of 15http://www.biomedcentral.com/1471-2148/13/114
82. Ronquist F, Teslenko M, van der Mark P, Ayres DL, Darling A, Höhna S,Larget B, Liu L, Suchard MA, Huelsenbeck JP: MrBayes 3.2: EfficientBayesian Phylogenetic Inference and Model Choice Across a LargeModel Space. Syst Biol 2012, 61:539–542.
83. Gelman A, Rubin DB: Inference from Iterative Simulation Using MultipleSequences. Stat Sci 1992, 7:457–472.
84. IUCN (International Union for Conservation of Nature): Vulpes vulpes. InIUCN 2011 IUCN Red List of Threatened Species Version 20121. 2008.
doi:10.1186/1471-2148-13-114Cite this article as: Kutschera et al.: A range-wide synthesis and timelinefor phylogeographic events in the red fox (Vulpes vulpes) . BMCEvolutionary Biology 2013 13:114.
Submit your next manuscript to BioMed Centraland take full advantage of:
• Convenient online submission
• Thorough peer review
• No space constraints or color figure charges
• Immediate publication on acceptance
• Inclusion in PubMed, CAS, Scopus and Google Scholar
• Research which is freely available for redistribution
Submit your manuscript at www.biomedcentral.com/submit