A quick note for teachers This presentation is one element of the freely downloadable lesson plan...
21
A quick note for teachers • This presentation is one element of the freely downloadable lesson plan salinity and the Murray–Darling Basin. • Comprehensive presenter notes are available in the ‘notes’ view of this presentation • For an accompanying student worksheet and teacher notes for this lesson plan, visit education@MDBA online: (http:// www.mdba.gov.au/what-we-do/education )
-
Upload
eustacia-washington -
Category
Documents
-
view
215 -
download
0
Transcript of A quick note for teachers This presentation is one element of the freely downloadable lesson plan...

A quick note for teachers
• This presentation is one element of the freely downloadable lesson plan salinity and the Murray–Darling Basin.
• Comprehensive presenter notes are available in the ‘notes’ view of this presentation
• For an accompanying student worksheet and teacher notes for this lesson plan, visit education@MDBA online:
(http://www.mdba.gov.au/what-we-do/education)

education@MDBA
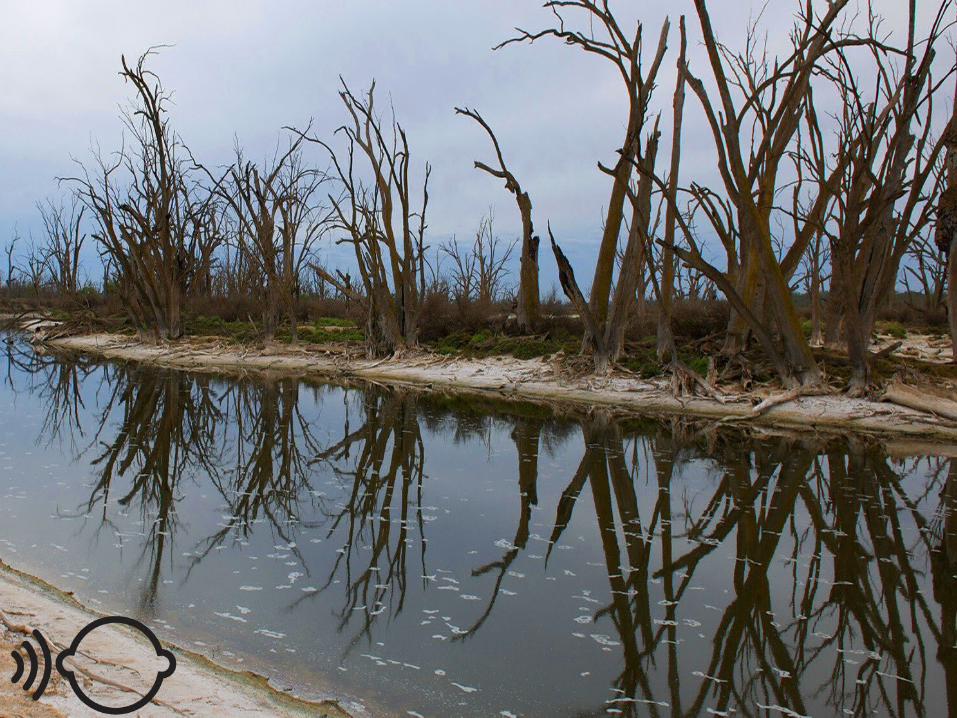
Salinityand the Murray–Darling Basin

Lesson overview
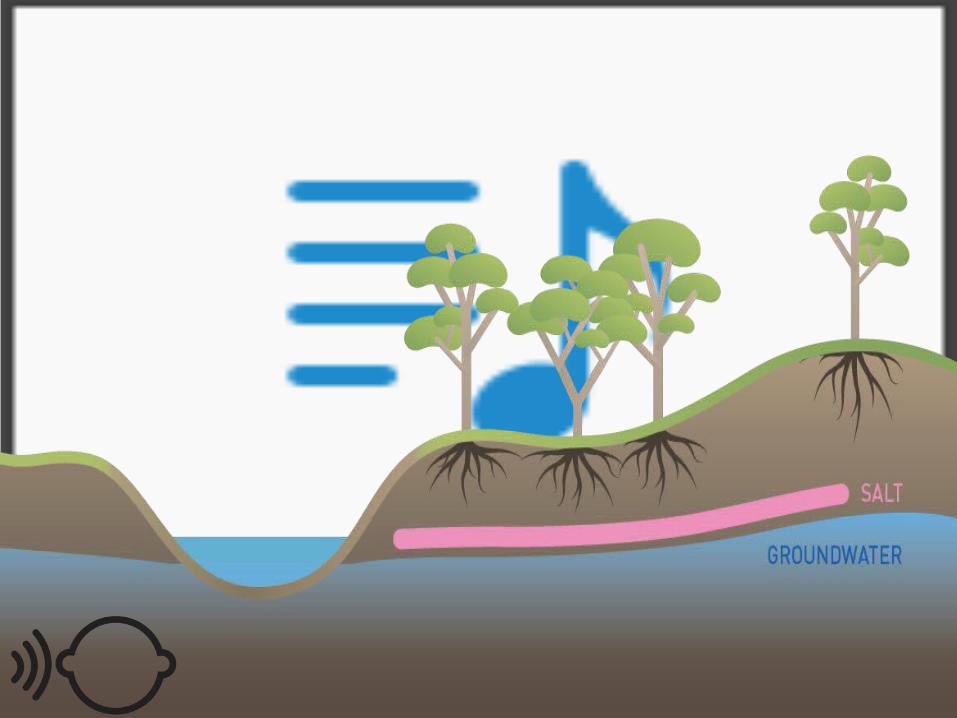
In this lesson we will learn about:• Salt in the landscapes of the
Murray–Darling Basin • Monitoring salinity• Managing salinity

Lesson keys
• Listen to your teacher
• Discuss• Play Run the River
• Answer • Research• Investigate


Answer
• Answer the following questions on your worksheet1. On your worksheet is a map showing the location
of the salt interception schemes in the Murray–Darling Basin.
a. Label the direction of water flow along the rivers.b. Imagine that the salt interception pumps were not
working. Use ‘+’ (plus) and ‘-‘ (minus) signs to indicate the likely comparative salinity at each of the salt interception scheme locations along the river.


Investigate
• Design and conduct an investigation to test the effect of salt on plant growth. In your plan consider the following things:
• an aim and hypothesis• equipment / materials• a scientific control• a suitable method (including
repeating your results) • how you will compile and
analyse your results

Play• Play Run the River: a water sharing
challenge until you reach level 5: 1977. • As you play this level, answer the following
questions:1. As you progress through the eras of the game,
the number of farms, towns and cities dependant on the river system increases. What is the effect of this on the demand for water by consumers?
2. What led to the increase of salinity in the river system by 1977?
3. What effect can cover-watering crops have on the water table? How can this cause salinity to increase?

Research1. Access the most recent salinity and flow data from the MDBA website to
investigate the salinity readings along the river in the past week. Write the actual readings on your map.
2. Describe the trend in salinity level observed along the river system. 3. Draw a labelled diagram or series of diagrams to explain how salt
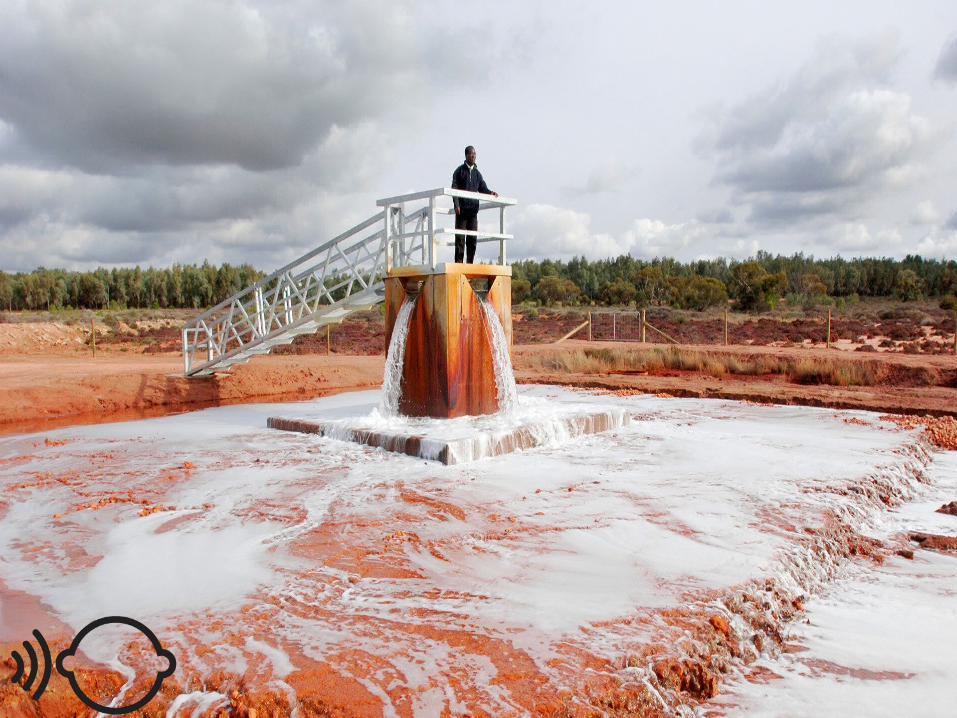
interception schemes work. 4. Investigate what happens with the residual salt produced in salt
interception schemes. 5. Imagine that you are a farmer with a property on the river near Loxton
and all of the upstream salt interception schemes are out of order. 6. Describe the effect that this has on your farm and household. 7. Outline what you will do to solve the problem at a local level. 8. Explain the likely effect that this problem will have on communities
further downstream at locations such as Morgan.
Recap
In this lesson we learnt about:• Salt in the landscapes of the
Murray–Darling Basin • Monitoring salinity• Managing salinity