
A QUANTITATIVE THEORY OF THE PRECIPITIN REACTION
24
A QUANTITATIVE THEORY OF THE PRECIPITIN REACTION III. TEE REACTION BETWEEN CRYSTALLINE EGG ALBUmN AND ITS HOHOLOGOUS ANTIBODY* BY MICHAEL HEIDELBERGER, PH.D., ANn FORREST E. KENDALL, ProD. (From the Department of Medicine, College of Physicians and Surgeons, Columbia University, and the Presbyterian Hospital, New York) (Receivedfor publication, August 7, 1935) In the first paper of this series (1) 1it was shown that the precipitin reaction might be considered the resultant of a series of competing bimolecular reactions, the quantitative outcome of which depended on the relative proportions in which the components were mixed. It was thus found possible to express the entire course of the precipitin reaction between a specific polysaccharide and its homologous anti- body by simple equations derived from the mass law. In the second paper of the series (2) it was shown that. these considerations were equally applicable to an antigen-antibody system in which the antigen was R-salt-azo-biphenyl-azo-crystalline egg albumin. This antigen, a deep red dye, could be determined with accuracy in precipitates over the entire range of the reaction, thus permitting the separate quantitative estimation of the amounts of antigen and antibody nitrogen precipitated. In the present communication the information obtained with the aid of the specific polysaccharide and the protein dye is applied to a system involving a colorless antigen, crystalline egg albumin, and its homologous antibody. The antigen used has the advantages of homo- geneity, known molecular weight, and of having been studied quantita- tively in respect to its behavior in the precipitin reaction by a number * The work reported in this communication was carried out under the Harkness Research Fund of the Presbyterian Hospital. 1 A statement was omitted in this paper that the sera used were absorbed with pneumococcus protein and "C" substance before purification of the antibody. 697 Downloaded from http://rupress.org/jem/article-pdf/62/5/697/1180536/697.pdf by guest on 08 February 2022
Transcript of A QUANTITATIVE THEORY OF THE PRECIPITIN REACTION

A QUANTITATIVE THEORY OF THE PRECIPITIN REACTION
I I I . TEE REACTION BETWEEN CRYSTALLINE EGG ALBUmN AND ITS HOHOLOGOUS ANTIBODY*
BY MICHAEL HEIDELBERGER, PH.D., ANn FORREST E. KENDALL, ProD.
(From the Department of Medicine, College of Physicians and Surgeons, Columbia University, and the Presbyterian Hospital, New York)
(Received for publication, August 7, 1935)
In the first paper of this series (1) 1 it was shown that the precipitin reaction might be considered the resultant of a series of competing bimolecular reactions, the quantitative outcome of which depended on the relative proportions in which the components were mixed. It was thus found possible to express the entire course of the precipitin reaction between a specific polysaccharide and its homologous anti- body by simple equations derived from the mass law. In the second paper of the series (2) it was shown that. these considerations were equally applicable to an antigen-antibody system in which the antigen was R-salt-azo-biphenyl-azo-crystalline egg albumin. This antigen, a deep red dye, could be determined with accuracy in precipitates over the entire range of the reaction, thus permitting the separate quantitative estimation of the amounts of antigen and antibody nitrogen precipitated.
In the present communication the information obtained with the aid of the specific polysaccharide and the protein dye is applied to a system involving a colorless antigen, crystalline egg albumin, and its homologous antibody. The antigen used has the advantages of homo- geneity, known molecular weight, and of having been studied quantita- tively in respect to its behavior in the precipitin reaction by a number
* The work reported in this communication was carried out under the Harkness Research Fund of the Presbyterian Hospital.
1 A statement was omitted in this paper that the sera used were absorbed with pneumococcus protein and "C" substance before purification of the antibody.
697
Dow
nloaded from http://rupress.org/jem
/article-pdf/62/5/697/1180536/697.pdf by guest on 08 February 2022

698 QUANTITATIVE THEORY O]~ PRECIPITIN REACTION. III
of workers including Taylor (3), Culbertson (4, 5), Taylor, Adair, and Adair (6), and Hooker and Boyd (7). I t is shown below that the theory presented in Papers I and II of this series is applicable to the egg albumin-antibody system and that the data of the previous workers with this reaction may be used over the portion of the range in which they are sufficiently explicit. A method is given by which both egg albumin and antibody nitrogen may be determined quantitatively in precipitates and supernatants over a limited range in the region of antigen excess. Except in the region approaching complete inhibition it is thus found possible to predict the behavior of an anti-egg albumin serum over the entire remaining range of the reaction after a small number of quantitative analyses for nitrogen have been made. More- over, the empirical relation which was shown in Reference 2 to permit the calculation of the maximum amount of specifically precipitable antibody has been found to be applicable, though somewhat less exactly, to the egg albumin-antibody system.
Opportunity is also taken to discuss the concept of the equivalence zone, the constancy of the equivalence point, the relation of the findings to methods for the determination of optimal proportions for flocculation, and certain practical considerations regarding the com- bining proportions of antigen and antibody.
Finally, a quantitative study has been made of the behavior of antibody formed by a single rabbit in three successive courses of in- jections. The differences found are believed to have bearing on the mechanism of antibody formation and the process of immunization.
EXPEI~ IMENTAL
The writers are pleased to note that in all of the four laboratories studying the egg albumin-antibody reaction the amount of specifically precipitable nitrogen is now accepted as a standard. The technique used in this laboratory for analyz- ing specific precipitates for nitrogen has been given in previous papers (1, 2, 8, 9). In applying the method to the egg albumin (Ea)-antibody (A) system it was found that precipitates, particularly in the equivalence zone, tended to remain somewhat loosely packed, so that it was necessary in such cases to centrifuge the supernatant a second time to recover additional small amounts of specific precipitate. In such cases tubes must be carefully watched if allowed to drain.
The crystalline egg albumin used was prepared according to Reference 10 and was recrystallized three times and dialyzed in the cold until free from ammonium salts. The nitrogen content of Ea was taken as 15.5 per cent.
Dow
nloaded from http://rupress.org/jem
/article-pdf/62/5/697/1180536/697.pdf by guest on 08 February 2022

MICHAEL ttEIDELBERGER AND FORREST E. KENDALL 699
TABLE I
Influence of Temperature, Time of Standing, and Volume on Total Specifically Predpitable Nitrogen
Laboratory No. of serum + amount Ea N
1.31 +0.027 mg. Ea N
2.24 +1.0 mg. Ea N
3.87 I, 1:1 + 0.050 rag. Ea N + 0.098 nag. Ea N
(excess)
+ 0.124 rag. Ea N
+ 0 , 3 0 5 " " "
3.87 II, 1:1 + 0,050 mg. Ea N
+ 0,098 . . . . . .
3.87 III , 1:1 +0.079 mg. Ea N
3.88 + 0.066 rag. Ea N
Total N precipitated from 1.0 ml. serum by amount of Ea N indicated in 1.0 ml. saline.--Total volume 2.0 mL unless otherwise stated
37°~ 1 hr.
rag.
0.29
0.62 0.82
37°~ 2 hrs.
rag.
0.29
0.61 0.81
0.19
o.7oll
37°j 3 hrs.
rag.
0.29
20 °, 0 °*
mg.
1.78, 1.74 1.75, 1.72~
37 °, 0 °
0.72 0.70 (6 ml.)
20 °, 0 °
0.12
0°~ 24 hrs. 0 °, 48 hrs.
rag. rag.
0.31
0.63 0.82 0.82
o.11~
0.84, 0.85 0.82§ 1.18 1.15 (9 ml.)
1 3111 1.28 (8 ml.)
o.7511
* 2 hrs. at 20 °, overnight in the ice box. t 4 ml. volume.
Value given by duplicate tubes standing 4 days and 7 days in the ice box, with occasional stirring.
§ Two additional washings with a total of approximately 4 ml. chilled saline. II Nitrogen determined according to Reference 11.
Dow
nloaded from http://rupress.org/jem
/article-pdf/62/5/697/1180536/697.pdf by guest on 08 February 2022

700 QUA1WTITATIVE TIIEORY OF PR_ECIPITIN REACTION. III
In Table I are given data showing the effect of temperature and volume changes on the amount of nitrogen precipitated. Since occasional anti-Ea sera gave 021 or 0.02 mg. more specifically precipitable N per ml. when allowed to stand at 0 ° for 48 instead of 24 hours, all determinations at 0 ° were allowed to stand 2 days except those in the inhibition zone, for which 4 days were allowed (cf. 2).
Egg albumin suspensions were prepared for injection as follows: Dialyzed solutions of crystalline Ea were d/luted with saline to less than 1 per cent Ea and were treated with 1 nil. of sterile 1 per cent alum solution per 100 mg. Ea present. The clear solution was neutralized with N sodium hydroxide solution until the resulting precipitate no longer appeared to increase, the maximum being reached when the suspension was barely acid to litmus paper. The suspension, which contained very little dissolved Ea, was brought down to the desired concentration (5 rag. Ea per ml. in the case of Rabbit 3.87) with saline and enough 1 per cent merthiolate solution to make a final concentration of 1:10,000. Rabbits were injected with this suspension four times a week for 4 successive weeks (Course I) and generally yielded excellent antisera. Rabbit 3.87 (weight 4.9 kilos) received fourteen injections of 10 rag. each under this schedule, and the serum designated 3.87 1 was obtained 5 days after the h s t injection. Serum 3.87 I I was secured 5 days after completion of a further course of eleven injections starting with 2.5 mg. Ea and working up to 15 rag. at the end, and 3.87 I I I after six more injections following a rest period of over a month. 2 The serum then contained 85 mg. of total protein per ml. (total N X 6.25), of which 44.7 mg. per ml. consisted of globulin (Howe method). I t will be noted that by this time 21.5 per cent of the total protein, or 40.7 per cent of the globulin, consisted of precipitin (maximum specifically precipitable N × 6.25). Quantitative data on the sera from the three courses are given in Table I I and compared in graphic form at a concentration of 1 rag. antibody N per ml. in Text-fig. 2, while Text-fig. 1 gives the total N and antibody N curves of 3.87 1 as well as the data on this serum calculated according to equations [3] and [6]. In Table I I and other Tables, N estimations (always in duplicate unless otherwise stated) are reported to the third decimal place although its value is uncertain except in the case of Ea N added.
The analysis of supernatants for the very small amounts of Ea in the limited range of Ea excess before the beginning of the inhibition zone is most simply carried out by adding as large an aliquot as possible to the same amount of serum as was used in the determinations of the equation and reading off the corresponding amount of Ea from the total nitrogen curve of the serum (as, for example, Curve IV, Text-fig. 1). The validity of the method is supported by the next to last experiment recorded in Table I I , in which it is shown that the presence of super-
Toward the end of this period, when the animal's serum contained < 0.2 mg. of precipitin N per ml., a single injection of 10 rag. of crystalline horse serum albumin was given. Quantitative analyses at short intervals failed to reveal any "anamnestic" rise in anti-egg albumin.
Dow
nloaded from http://rupress.org/jem
/article-pdf/62/5/697/1180536/697.pdf by guest on 08 February 2022

TABLE I I
Addition of Increaslng Amounts of Egg Albumin to 1.0 MI. Serum 3.87, 1:1, at 0 °
E a N a d d e d
m g .
0.0091 0.0155 0.025 0.040 0.050 0.065 0.074 0.082 0.090
E a N p p t d .
gttg.
. T o t a l N A n t i - A n t i - [ R a t i o ] b o d y b o d y Antibody[ anti- [ N [ N
Pl ca [ Nbydif-[ body pptd. pptd. pptd. ference N:EaN calcd, calcd.
in pp t . f r o m f r o m
. . . . . . 1 _ _ [ eq. [3] eq. [6]
:" I *'g" "g" I I m g ' l ' g " Course I
Mg. antibody N pptd. = 15.8 Ea N - 83 (Ea N) 2 Mg. antibody N pptd. = 19.4 Ea N -- 36 (Ea N) a'~
Total* st
ss
tt
t t
t t
tt
ts
0.087
0.089 0.087
(0.072): ( o . 048 ) ( o . o o 4 )
0.156t 0.236 0.374 0.526t
0.098 0.124 0.135 0.195 0.307 0.490
Maximum E a N , A
0.147 0.220 0.349 0 . 4 8 6
0.632 0.582 ] 0.740 0.675 0.794 0.720 0.830 0.748 [ 0.826 0.739
0.820 0.730 0 .610 t 0.414 0.106 0.042
0 .731[ 0.643 [
(0.538) (0.366)
16.2 0 137 14.2 0 225 14.0 0 343 12.2 0 495 11.6 0 582 10.4 0 677 9.7 0 714 9.1 0 738 8.5 0746
8.2 7.4
(7.5) (7.6)
3.146 9.231 9.342 9.488 9.567 9.664 3.710 9.746 3.763
Tests on supernatant
Excess A
ss ~
tg ts
Excess A, trace Ea No A or Ea No A, < 0.001 Ea N Excess Ea, analyses in Table
I I I ts ~L
cd ~
N in ppt. accbrding to equation [3], 0.095, 0.752; according to equation [6], 0.129, 0.836
0.0155 0.050 0.088 0.098 0.118 0.127 0.135 0.143
0.195 0.123 0.490 (0.018) 0.490 (0.034)§
Maximum
Course I I
Mg antibody N pptd. = 20.4 EaN -- 96 (Ea N) * Mg. antibody N pptd. = 26.1 EaN - 48.1 (Ea N) s/2
Total* 0 . 3 0 6 1 0 . 2 9 0 18.7 ).29310.312 " 0.844 0.794 15.9 3.78010.766 " 1.144 1.056 12.0 1.053[1.039
i
" 1.180 1.082 11.0 1.077[1.081 " 1.214 1.096 9.3 1.127 " 1.278 1.151 9.1 1.137 " 1.280 1.145 8.5 1.138
0.142 1.288 1.146 8.1 1.133
1.024 0.901 7.3 0.154 10.136) (7.51 0.154 10.120) (3.51
Excess A
No A or Ea ~t t~ t t t t
< 0.001 Ea N < 0.001 Ea N Excess Ea, analyses in Table
I I I u ic
st t s
t s t t
Ea N, A N in ppt. according to equation [3], 0.106; 1.083; according to equation [6], 0.131, 1.139
* Assumed. t At p H 6.36.
3.87 I I , 1 : 1, used. § 3.87 I, 1 : 1, used.
7ol
Dow
nloaded from http://rupress.org/jem
/article-pdf/62/5/697/1180536/697.pdf by guest on 08 February 2022

702 QUANTITATIVE THEORY OF PRECIPITIN" REACTION.. I I I
TABLE II ( c o n c l u d e d )
Ea N added
raG.
0.0296 0.049 0.079 0.082 0.088 0.098 0.122 0.140 0.15711 0.195
Anti- Anti- [ Ratio ~ body I Anfibodyl anti- ~ N
Ea N ~ptd. Total N N by dif-I body [ pptd., pptd., pptd. ferenee N:EaN calcd, caled.
in ppt, from from [ _ _ l _ _ [ e q . [ 3 ] eq.[6]
/ ] mg. rag. rag. [ I rag" rag"
Course I I I
Mg. antibody N pptd. = 24.8 Ea N - 111 (Ea N) 2 Mg. antibody N pptd. = 31.8 Ea N -- 56.6 (Ea N)3/2
0.635 I1.5 0.622 Excess A 0.956 .9.5 0.94g 1.241 5 .7 1.267 1.288 5 .7 1.288
1.324 1.364 1.373
Total*
el 4~
cc
~c
0. t94
0.202
0.665 1.005 1.320 1.370 1.422 1.468 1.5701 1.5921 1.6061 1.650
1.542 1.025
0.234 0.295
Maximum E a N ,
1.334 1.370 1.448 1.452 1.449 1.456
1.340
5.2 .4.0 .1.9 0 .4 I 9.2 7.5
6.6
A
Tests on supernatant
~.652 0.944 " " 1.256 t Traces A, Ea (?) 1.279 t Excess A 1.319] Slight excess A 1.379 N o A o r E a 1.466 " " . . . .
1.487 . . . . . . . .
1.474 " " " " 1.330 Excess Ea, analyses in Table
I I I
N in ppt. according to equation [3], 0.112, 1.393; according to equation [6], 0.140, 1.483
0.140 0.140 + 3 ml. 0.140~
supernatant J
0.157 q- 1.0 ml. 1 supernatant from[ 3.87 I I I serial ex-~ periment (Table L V) )
1.542
1.538
1.866 Found above
1.402
1.398
1.709
1.449
0.36
[I 1 determination discarded.
natant from tubes in which maximum precipitation has occurred fails to increase the amount of Ea-A normally precipitated. When it becomes necessary to analyze supernatants containing more Ea, as in the inhibition zone, the presence of dis- solved Ea-A introduces complications. These were discussed in Reference 2, and it is accordingly assumed that in the analysis of inhibition zone supernatants for Ea, as well as in the dye-antidye system, all of the dissolved antibody in the
Dow
nloaded from http://rupress.org/jem
/article-pdf/62/5/697/1180536/697.pdf by guest on 08 February 2022

MICHAEL HEIDELBERGER AND YORREST E. KENDALL ~03
supernatant is precipitated together with that derived from the serum used for the analysis.
The following method of calculation, based on this assumption, gives the same result as the simpler method given at the begirming"of the preceding paragraph in the region of antigen excess up to the inhibition zone, and the differences from it are small up to the range in which inhibition is pronounced. In this range the simpler
tG
t2
e-to
7"
o
~ 6
o
J /
C
f
, ~ .
x.~-~ ~Z
i/
! !
LineI and curves, JaN o.o6 Line ]]',~ppxcl.: o.lo o.t6 0.22
T~xT-Fm. 1
0,28
O.Of'
:<I
4
¢ J
method soon leads to values of Ea in the supernatant higher than the total added, whereas the method given below gives this result only when inhibition is practically complete, in which case it is necessary to use so small an aliquot that any analytical errors would be greatly multiplied in the final result.
Let A = the maximum antibody nitrogen found in the serum used, Ea - the amount of egg albumin nitrogen added, and N = the amount of nitrogen precipi-
Dow
nloaded from http://rupress.org/jem
/article-pdf/62/5/697/1180536/697.pdf by guest on 08 February 2022
704 QUANTITATIVE THEORY OF PRECIPITIN REACTION. Ill
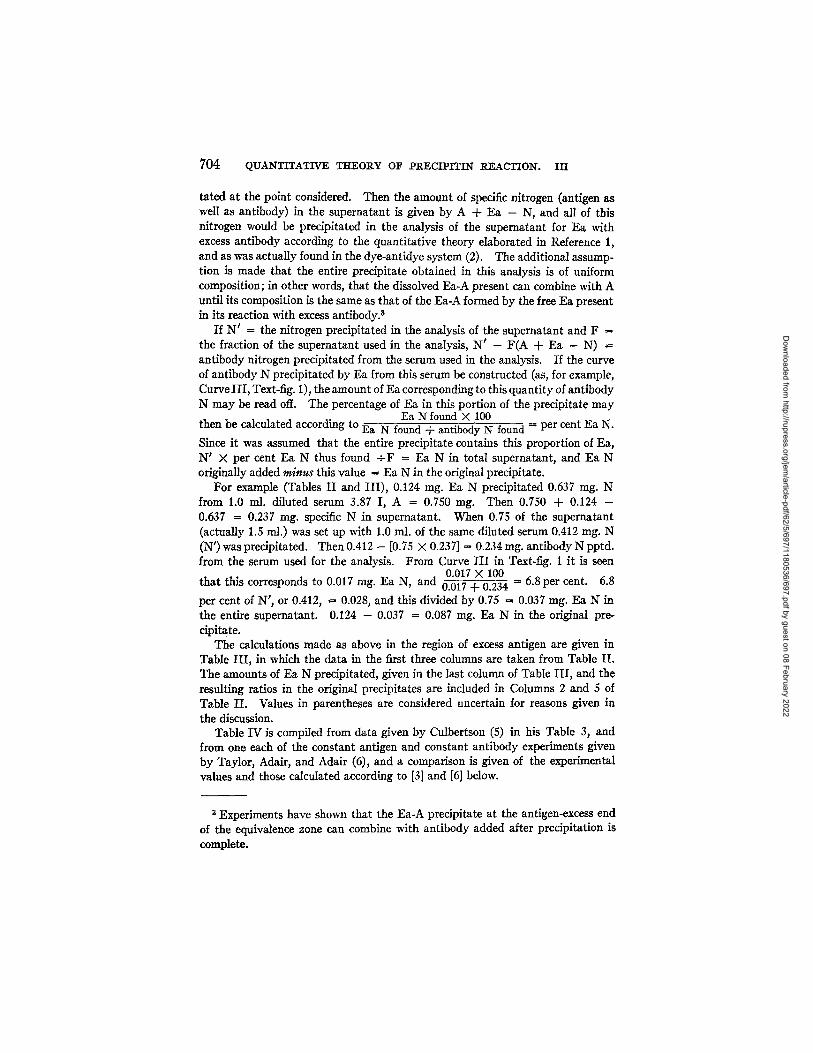
tated at the point considered. Then the amount of specific nitrogen (antigen as well as antibody) in the supernatant is given by A + Ea - N, and all of this nitrogen would be precipitated in the analysis of the supernatant for Ea with excess antibody according to the quantitative theory elaborated in Reference 1, and as was actually found in the dye-antidye system (2). The additional assump- tion is made that the entire precipitate obtained in this analysis is of uniform composition; in other words, that the dissolved Ea-A present can combine with A until its composition is the same as that of the Ea-A formed by the free Ea present in its reaction with excess antibody. 3
If N t -- the nitrogen precipitated in the analysis of the supernatant and F = the fraction of the supernatant used in the analysis, N p - F(A + Ea - N) = antibody nitrogen precipitated from the serum used in the analysis. If the curve of antibody N precipitated by Ea from this serum be constructed (as, for example, Curve I I I , Text-fig. 1), the amount of Ea corresponding to this quantity of antibody N may be read off. The percentage of Ea in this portion of the precipitate may
Ea N found X 100 then be calculated according to Ea N found + antibody N found -- per cent Ea N.
Since it was assumed that the entire precipitate contains this proportion of Ea, N ' × per cent Ea N thus found + F -- Ea N in total supernatant, and Ea N originally added minus this value = Ea N in the original precipitate.
For example (Tables I I and I I I ) , 0.124 mg. Ea N precipitated 0.637 nag. N from 1.0 ml. diluted serum 3.87 I, A = 0.750 rag. Then 0.750 + 0.124 - 0.637 = 0.237 rag. specific N in supernatant. When 0.75 of the supematant (actually 1.5 hal.) was set up with 1.0 ml. of the same diluted serum 0.412 nag. N (N') was precipitated. Then 0.412 - [0.75 × 0.237] = 0.234 rag. antibody N pptd. from the serum used for the analysis. From Curve I I I in Text-fig. 1 it is seen
0.017 )< 100 that this corresponds to 0.017 mg. Ea N, and 0.017 + 0.234 - 6.8 per cent. 6.8
per cent of N', or 0.412, =- 0.028, and this divided by 0.75 = 0.037 rag. Ea N in the entire supernatant. 0.124 - 0.037 = 0.087 rag. Ea N in the original pre- cipitate.
The calculations made as above in the region of excess antigen are given in Table I I I , in which the data in the first three columns are taken from Table II . The amounts of Ea N precipitated, given in the last column of Table I I I , and the resulting ratios in the original precipitates are included in Columns 2 and 5 of Table I I . Values in parentheses are considered uncertain for reasons given in the discussion.
Table IV is compiled from data given by Culbertson (5) in his Table 3, and from one each of the constant antigen and constant antibody experiments given by Taylor, Adair, and Adair (6), and a comparison is given of the experimental values and those calculated according to [3] and [6] below.
3 Experiments have shown that the Ea-A precipitate at the antigen-excess end of the equivalence zone can combine with antibody added after precipitation is complete.
Dow
nloaded from http://rupress.org/jem
/article-pdf/62/5/697/1180536/697.pdf by guest on 08 February 2022

MICHAEL HEIDELBERGER AND FORREST E. KENDALL 705
Table V shows the result of serial additions of small amounts of egg albumin to several anti-egg albumin sera (cf. 1). The data on 10.0 ml. of undiluted serum 3.87 I I show a pronounced, but relatively small Danysz effect, while those on the diluted serum, 2.24A, do not show this effect, possibly on account of the small amount of antibody present. A serial experiment on 5.0 ml. of undiluted serum 3.87 I I I showed that 0.450 nag. Ea N, added in four portions, pre-
TABLE II I
Calculation of Ea N in Precipitate in Region of Antigen Excess
Specific ] N i Tota l N Less n i ifl Per cent • E a N m T 1 • pp td n spec c Corre- E a N m • • E a N ota N super- Frac t ion l ' s i " i n " i E a N "r c ' i entire E a N m added pptd. n a t a n t [ana lyzed l a n ~ s [ fr~ction I SPgn-~Pgl in 2nd I ~ l ~ l s u p e r - [ ppt.
'~*" '~" I '~g" I J '~g" I '~g" I ,~e. I / '~g" I rag" I "~" Serum 3.87 I, 1:1, maximum antibody N pptd., 0.750 rag.
0.090 0.826 0.014 1 . 7 5 t 0 . 0 7 8 [ 0.053 0.0035 6.2 0.00481 0.003 0.087 0.098 0.820 0.028 0.75 0.106 [ 0.085 0.0057 6.3 0.0067[ 0.009 0.089 0.124 0.730 0.144 0.75 0.41210.304 0.0219 6.7 0.027610.037 0.087 0.135 0.610 0.275 0.50 0.596~ I 0.458 0.0257 5.3 0.03161 0.063 0.072 0.195 0.414 0.531 0.34 0.676/0.495 0.0395 7.4 0.0500 0.147 0.048 0.307 0.106 0.951 0.167 0.674 I 0.515 0.0418 7.51 0.0506 0.303 0.004
I Serum 3.87 II, 1 : 1, maximum antibody N pptd., 1.151 rag.
0.143 1.288 0.006 1.75t I 0.046 [ 0.035 0.00171 4.6 0.0021 0.001 0.142 0.195 1.024 0.322 0.50 I 0.664 I 0.503 0.02851 5.4 0.0359 0.072 0.123 0.490 0.154 1.487 0.167 1.180 0.932 0.0667 6.68 0.0788 0.472 0.018 0.490 0.154 1.487 0.125 0.738§ 0.552 0.0462 7.72 0.057 0.456 0.034
;erum 3.87 III, 1 : 1, maximum antibody N pptd,, 1.456 rag. 0.195 1.650 0.0051 1.50' 10.02610.01810.001 10.001 0.001 0.194 0.234 1.542 0.148 0.75 0.566 0.455 0.0205 4.3 0.0243 0.032 0.202
* 100 times value in Column 7 divided by sum of values in Columns 6 and 7. t Not run in duplicate.
3.87 II , 1:1, used. § 3.87 I, 1:1, used.
cipitated 9.4 nag. A N, calculated to 5.0 cc. From the equation for 3.87 I I I , the same relative amount of Ea N, 0.046 rag., added at once to 1.0 ml. of 1:1 serum, is found to precipitate 0.91 rag. A N, or 9.1 rag. from 5.0 ml. undiluted serum--again a definite but small Danysz effect. When the serial experiment on this serum was carried to completion it was found that only 11.34 nag. A N could be precipitated, as against 14.55 rag. which should have been found if all the Ea had been added at once. Thus 22 per cent of the
Dow
nloaded from http://rupress.org/jem
/article-pdf/62/5/697/1180536/697.pdf by guest on 08 February 2022

TABLE IV
Experiments of Other Authors Calculated According to Equations [3] and [6]
I Amt. Ea N [ added (pptd.) Total N pptd.
rag. rag.
Culbertson (1935) Table 3.
0.023 0.045 0.068 0.080 0.097 0.114 0.143
AntibodyN RatloA[Np'.Ea ~,TI fromequation[3]Antib°dyN AnfibodyN in t *'J pptd., calcd, pptd., calcd. pptd. from equation [6]
mg. I mg. mg,
Mg. antibody N pptd. = 17.6 Ea N -- 64 (Ea N) ~ Mg. antibody N pptd. = 22.3 Ea N -- 34.8 (Ea N) ~/*
0.423 0.400 17.4 0.678 0.633 14.1 0.968 0.900 13.2 1.079 0.999 12.5 1.207 1.110 11.4 1.249 (Antigen excess) 1.320 ( . . . . , maximum total N)
0.371 0.391 0.662 0.670 0.901 0.899 0.998 0.996 1.105 1.110
Maximum Ea N, A N in ppt. according to equation [3], 0.138, 1.210; according to equation [6], 0.182, 1.355
Taylor, Adair, and Adair (1934) Table II, Serum 1754C Mg. antibody N pptd. -- 18.2 Ea N -- 94 (Ea N) ~ Mg. antibody N pptd. = 22.3 Ea lq -- 40.5 (Ea N)m
0.0149 0.250" 0.235 15.8 0.250 0.258 0.0297 0.506* 0.476 16.0 0.458 0.454 0.045 0.677 0.632 14.0 0.629 0.616 0.059 0.813 0.754' 12.8 0.747 0.736 0.074 0.914 0.840 11.4 0.832 0.835 0.089J" 0.974 0.885 9.9 0.875 0.907
Maximum Ea N, A N in ppt. according to equation [3], 0.097, 0.881; according to equation [6], 0.135, 1.003
Taylor, Adair, and Adair (1934) Table III , Serum 1754D
~er rag. ser~ra
0.046 0.051 0.056 0.062 0 .O70 0.080 0.093 0.111 0.139'[
Maximum Ea N,
Mg. antibody N pptd. --- 16.4 Ea N -- 54 (Ea N) ~ Mg. antibody N pptd. --- 20.6 Ea N -- 30.6 (Ea N) ~I2
#er f~ . ser~ra
0.684 0. 743 0.799 0.883 0.949 1.028 1.096 1.258 1.451
~er f~. ser~ra
0.638 0.692 0,743 0.821 0.879 0.948 1.003~ 1.147 1.312
13.9 13.6 13.3 13.2 12.6 11.9 10.8 10.3 9.4
per ra~. set , f i t
0.640 0.697 0.748 0.810 0.883 0.966 1.058 1.156 1.237
lber trd. seru.ra
0.646 0.698 0.747 0.804 0 •874 0.956
A N calcd, from equation [3], 0.152, 1.246; from 1.384
1.153 1.276
equation [6], 0.202,
* Mean of two determinat ions. t Trace of ant igen in excess.
F rom weight of precipi ta te; omi t ted in calculat ion of line according to equa-
t ion [61. 706
Dow
nloaded from http://rupress.org/jem
/article-pdf/62/5/697/1180536/697.pdf by guest on 08 February 2022

MICHAEL HEIDELBERGER AND I~ORREST E. KENDALL 707
antibody is not precipitable unless other antibody is present, recalling the be- havior of certain antidye sera (2). The concluding data of Table I I show, how- ever, that the entire amount of this antibody is carried down if added to a fresh portion of serum and egg albumin. These findings are again referred to in the discussion.
TABLE V
Serial Addition ~ Egg Albumin to Various Sera, Calcu~ted to Ordinal Volume
Total antibody N Total of succesive Total antibody Ratio A N : Ea N pptd. if added in
Ea N additions in ppt. 1 portion (Equation [3], Table II)
mg. mg.
0.015s 0.032 0.049 0.067 0.128 0.441 0.770
Total N pptd. N pptd.
mg. mg.
3.87 II, undiluted, 10.0 ml. 0.388 (0.438*) 0.372 (0.422*) 24 (27*)
0.775 24.2 1.130 23.1 1.528 22.8 2.81 22.0 9.03 20.5
13.90 18.1 Mg. antibody N pptd. = 23.4 Ea N -- 6.9 (Ea N) 2 Mg. antibody N pptd. = 24.9 Ea N -- 7.9 (Ea N) s/~
Serum2.24 A, diluted to approximatelysameAcontent as 0.015s 0.033 0.052s
0.015s 0.033 0.052s
2.24]3 4.0ml. 0.324 [ 0.308 19.9
J 0.576 17.5 0.789 15.0
Mg. antibody Npptd. = 22 E a N - - 133 (EaN) 2 Serum2.24B, partially exhausted, 4.0ml.
0.248 I 0.6870"4640'232 I 12.114"115"0
Mg. antibody Npptd. = 16.8 E a N - 90 (EaN) 2
2.53 8.06
12.86
* Assuming solubility of precipitate in serum to be as in saline, approximately 0.005 mg. N per ml. This correction would need to be made only on the first precipitation, since the serum would then be saturated with Ea-A compound.
Text-fig. 2 is derived by putting A -- 1.00 in the equations according to [4] in Table I I and the portion of Table IV dealing with Taylor, Adair, and Adair's figures. Thus the straight lines in the figure represent a comparison of the sera at a common concentration of 1.00 mg. of antibody N per ml.
The pH of serum 3.87 1 was 7.8. 10.0 ml. were diluted to 20.0 ml. with saline and a drop of glacial acetic acid. The pH of the resulting dilution was 6.36. 4 Set
4 Determined electrometrically by Mr. F. Rosebury, of the Department of Biological Chemistry.
Dow
nloaded from http://rupress.org/jem
/article-pdf/62/5/697/1180536/697.pdf by guest on 08 February 2022

708 QUANTITATIVE THEORY OF PRECIPITIN REACTION. III
up as in Table II with a number of the same dilutions of Ea, the more acid serum gave identical amounts of N, within the limits of error of the method, as at pH 7.8, even in the inhibition zone (of. 2). Since Marrack and Smith (12) have also failed to observe differences due to pH changes within almost the same limits, the details of the experiment are not given.
In Table VI is contained a compilation of the writers' data relative to the equivalence zone and the equivalence point in the Ea-A system, as well as the found and calculated ratios at the point of maximum antibody precipitation.
TABLE VI
Ratios of Antibody N: Egg Albumin N in Equivalence Zone and at Maximum Antibody Precipitation
Serum
1.31 1.35 1.36 1.68 2.24 2.32 3.87 I 3.87 II 3.87 III
Ratio at antibody excess end
of zone
9.4 9.3
11.5 16.1 9.1
10.4 (11.5) (is .o)
Calculated equivalent e point ratio
9.0
14.0
9.8 9.8
11.3
Ratio at antigen excess end
Of zone
9.2 8.6
>7 .6 11.8
9.1 8.1 7.5
Ratio at first max imum
pptn. point
9.2
10.5
9.1 9.1
11.9
Calcd, ratio at maximum equation [6
7.2
6.2
9.8
6.6 8.7
10.2
Values in parentheses are estimated from nearest actual determination.
DISCUSSION
Tha t crystalline egg albumin is a single definite chemical individual appears to be established with as great cer tainty as possible in the case of a protein. When injected into rabbits i t nevertheless gives rise to antibodies of differing reactivity, as has already been noted by Hooker and Boyd (13), and as is shown in the present communica- tion. In spite of this i t is assumed in the following discussion, as in References 1 and 2, tha t the average behavior of the ant ibody is tha t of a single substance, and tha t i t may accordingly be treated mathemat ical ly as such.
Another assumption, which was made in Reference 1 bu t not found applicable in Reference 2, was tha t in the region of excess ant ibody all of the hapten (antigen) added was precipitated since none could be
Dow
nloaded from http://rupress.org/jem
/article-pdf/62/5/697/1180536/697.pdf by guest on 08 February 2022

~CHA~L H~IDE~,BEROER AND FOIST E. KE~ALL 709
detected in the superna tan t by the exceedingly delicate serological test. The same assumption, which is not considered valid by Taylor , Adair, and Adair (6), is made in the egg albumin (Ea) -an t ibody (A) system, for the following reasons.
(a) The antigen is a single definite chemical individual. (b) The test for Ea with homologous antibody is sensitive to an antigen dilution of at least 1:200,000, and the dissociation constant of a soluble Ea-A complex would have to be exceed- ingly small ff the Ea in it were to escape detection. (c) When soluble Ea-A compounds are known to be present, as in the inhibition zone, these are pre- cipitated when fresh antibody is added. (d) In a serial experiment, such as the first ~ Table V, antigen appears in excess as soon as all but the last traces of antibody precipitable in this way have been thrown down. The serially non- precipitable antibody can thus scarcely be concerned in the disappearance of Ea into an undissoeiated, soluble Ea-A complex, the more so as it is quantitatively precipitated when added to fresh antibody and Ea (see last experiment in Table II). A third type of antibody would then have to be postulated. (e) If it is assumed that all of the Ea added in the region of excess antibody is precipitated, the resulting A N:Ea N ratios in the precipitate and the range of these ratios with varying Ea-A proportions are found to be of the same magnitude as was observed in the dye-antidye system (2) in which antigen and antibody in the precipitate were each directly determined.
As in the instances studied in the first two papers of this series (1, 2) it is considered tha t the precipi t in react ion between crystalline egg albumin and an t ibody occurs in steps in a series of bimolecular reactions which take place before precipi ta t ion begins.
The first step in the reaction would be
A + Ea ~ A.Ea . . . . . . . . . . . . . . . . . . . . . . . . . . . . . [1]
This would represent the equivalence point compound in its simplest form, as composed of 1 unit of A and I unit of Ea, regardless of their actual molecular pro- portions. A molecular formula would be Am Ea~, and this compound would be arrived at through a series of bimolecular reactions. Since both A and Ea are proteins, and the opportunity is given for the immunologieally reactive groupings to recur a number of times, the reactants may be considered multivalent with respect to each other. Thus the A-Ea compound initially formed could react with other molecules of the same compound, or with A or Ea, if either is present in excess. In the region of excess antibody the second step of the reaction would then consist of the two competing bimolecular reactions, in which dissociation is assumed to be negligible:
A.Ea + A --~ AEa.A, and . . . . . . . . . . . . . . . . . . . . . . . . [2]
A .Ea -k A.Ea ~ AEa.AEa
Dow
nloaded from http://rupress.org/jem
/article-pdf/62/5/697/1180536/697.pdf by guest on 08 February 2022

7i0 QUANTITATIVE THEORY O]~ PRECIPITIN REACTION. III
Since both A and Ea may be considered multivalent with respect to each other, the products of reaction [2] would combine chemically until aggregates large enough to separate from solution are formed. This might be represented two- dimensionally as follows:
• • o •
A Ea.A Ea..- • * • ,
• -. A.Ea-A • Ea-A • Ea.A .. . . _, * • ,
Ea A • Ea ..
in which the end-result would be much the same as that p~ctured by Niarrack (i4). In the special case in which A and Ea are mixed in equivalent proportions the
A.Ea (or Am Ea~) produced according to [1] would merely polymerize, and the equivalence point precipitate would be (A-Ea)z, or (Am Ea~)x.
As in the reactions studied in References 1 and 2 the composition of the precipitate would thus depend on the relative proportions in which the reactants are mixed. As in Reference 2, only a small proportion of the antibody was found to react to form compounds containing more A than twice the equivalence point ratio, so that the additional reactions which it was necessary to consider in Refer- ence 1 may be neglected. Based on the above concept of the reaction the following expression for the region of excess antibody may be derived with the aid of the mass law as in Reference 1:
R'(Ea N)' rag. antibody N precipitated = 2R(Ea N) - - . .......... [3]
A
in which R = the ratio of antibody nitrogen to egg albumin nitrogen in the precipitate at the point at which antigen first appears in excess; Ea N = egg albumin nitrogen precipitated, and A = the amount of antibody N precipitated at the point at which antigen first appears in excess. Only in serum 3.87 I I I was R in better agreement with the equivalence point than the point chosen (cf. also Table VI).
The Ea-A system differs from the dye-antidye and S III-antibody systems already studied in that maximum precipitation of antibody is reached at a point very close to that at which antigen first appears in excess, after which inhibition of specific precipitation begins very rapidly. The range of maximum precipitation in the region of anti- gen excess is thus so small that the use of an expression such as [4]
Dow
nloaded from http://rupress.org/jem
/article-pdf/62/5/697/1180536/697.pdf by guest on 08 February 2022

~r~CHA~T. H~D~LB~RO~R AND FOmU~ST ~.. ~ENDALL 711
in Reference 2 was found unnecessary in the sera studied. Since anti- Ea sera are thus extremely sensitive to an excess of ant igen i t is necessary to use great care tha t only a ve ry slight excess of Ea be present in analyzing for maximum ant ibody precipitation. The amount of Ea to be used m a y be determined by a rapid prel iminary experiment on 0.5 ml. of serum a t 37 °, in which 0.1 rag. port ions of Ea (or less in the case of weak antisera) are added unti l no fur ther
precipitat ion occurs. No a t t empt is made in the present communicat ion to formulate
the reaction in the inhibition zone on account of the uncertaint ies of analysis discussed below. As in the dye-ant idye system the relative proport ions of the components appear to be the determining factors since precipi tat ion does not occur in the superna tan t when the con- centra t ion of Ea is reduced b y dilution with saline.
From Table I it is seen that precipitation in the Ea-A system is complete in 1 hour at 37°C., and that the amount of nitrogen precipitated is only sllghtly, if at all less, than at 0 ° for 48 hours. In one experiment in the inhibition zone, however, with 0.305 rag. Ea N, 0.19 rag. N was precipitated at 37 °, 0.12 rag. at 20 ° for 2 hours and overnight in the cold, and only 0.11 rag. at 0 ° for 4 days, a result con- sistent with increased dissociation of the soluble Ea-A compound at the higher temperatures. Except in the inhibition zone, then, there are no marked differ- ences except in rate when the reaction is carried out at 37 °, at 0 °, or, as in ordinary immunological practice, at 37* for 2 hours and overnight in the cold. Numerous data obtained at 37 ° are accordingly omitted. Since certain sera show slightly more precipitable nitrogen at 0 ° for 48 hours than under other conditions this pro- cedure was adopted in the present work, except that experiments in the inhibition zone were allowed to stand for 4 days, with thorough mixing each day. I t will also be noted from Table I that the solubility of the specific precipitate up to the region of slight antigen excess is about 0.005 rag. per ml. at 0 °, a value some- what lower than that given by Marrack and Smith (12) for the pseudoglobulin- antibody precipitate. If this value he accepted it would be necessary to correct all values for antibody nitrogen given in this paper by addition of 0.02 or 0.03 rng. of N. Since, however, actual experimental data are presented the correction is indicated only in the case of a serial experiment with 10.0 ml. of serum (Table V), in which enough Ea-A compound is dissolved in the first supernatant (0.05 mg. N, calculated) to make the initial precipitate smaller in amount than the second,
The linear relat ion
R 2 AntibOdYEa N N in the precipitate -- 2R -- ~- (FAN) . . . . . . . . . . . . . . [4]
Dow
nloaded from http://rupress.org/jem
/article-pdf/62/5/697/1180536/697.pdf by guest on 08 February 2022

712 QUANTITATIVE THEORY OF PRECIPITIN REACTION. III
follows from equation [3]. By plotting the values of the ratio Antibody N
Ea N - against Ea N precipitated a straight line results from
which the values of the constants in equations [4] and [3] may be obtained. Thus, in Text-fig. 1, Line I is plotted in this way from data in Table II up to the region of excess antigen. For serum 3.87 I, 1: 1, the intercept on the y-axis, 2 R, = 15.8, and the slope of the line,
R 2
-- A-' = -- 83,whence R = 7.9, A = 0.752. The experimentally found
values are R = 9.1 and A = 0.748 at the antigen excess end of the equivalence zone. Equation [3] for serum 3.87 I, I: 1, is thus N = 15.8 Ea N - 83 (Ea N) *, and is represented by Curve I I I in Text-fig. 1, on which the circles show the experimentally determined points. A comparison of the fourth and sixth columns of Table I I shows, in general, close agreement between the experimentally determined values of antibody N precipitated and those calculated according to [3] for the three sera given in the table. Curve IV represents the corresponding total nitrogen curve, N = 16.8 Ea N - 83 (Ea N) ~ for serum 3.87 I, 1 : 1.
Since [4] is a linear expression, the equation for the line may be approximately fixed for any serum by determination (in duplicate) of the amounts of antibody nitrogen precipitated at two points in the region of excess antibody. The greater the number of points determined the greater would be the accuracy attained. As recom- mended in References 1 and 2, more than one-third of the antibody should be precipitated in order to minimize the error due to the small portion of antibody yielding compounds of ratio > 2R.
Antibody N In Reference 2 it was shown that i f Dye N- in the precipitate
were plotted against the square root of dye N precipitated an even closer approximation to a straight line was obtained than by means of an equation of the type of [4].
Reduced to the same form as [71 in Reference 2, this gives
Antibody N i= tho p. ipi to - 5 Fa N)
- - . . . . . . . . . tsl F a N v A
in which 3R" is the intercept on the y-axis and -2 ~//(R")'(Ea N> is the slope
of the line, A = maximum precipitable antibody N, and R" = Antibody N:Ea N
Dow
nloaded from http://rupress.org/jem
/article-pdf/62/5/697/1180536/697.pdf by guest on 08 February 2022

MICHAEL H E I D E L B E R G E R AND FORREST E. KENDALL 713
ratio at the maximum. For serum 3.87 I, 1:1, the best equation for this line, (Line II, Text-fig. 1), arrived at by application of the method of least squares
Antibody to the experimental data, is Ea N N in the precipitate -- 19.4 - 36 ~ .
Then
rag. antibody N precipitated --- 19.4 Ea N -- 36(EaN) 3/~ . . . . . . . . . . . [6]
and when the first derivative, 19.4 - 54 (Ea N) 1/2 ffi 0, antibody N precipitated at the maximum, or A, ffi 0.836, a value somewhat higher than that actually found, 0.748. R", also, ffi 6.5, which is too low. It will be noted, however, from the maxima and from the values calculated according to equation [6] given in Column 7 of Table II, that this relation gives better agreement with the experimental values for serum 3.87 II than does equation [3], while in the case of serum 3.87 III both methods of calculation fit the data well.
In Table IV are given data from papers by Culbertson (5) and Taylor, Adair, and Adair (6) as far as the region of antigen excess, and it is seen tha t the Ea-A reaction in the sera studied by these workers m a y also be quant i ta t ively expressed up to this region ac- cording to equation [3] which follows from the writers' theory of the reaction, or by the empirical relation [6].
Of the eleven sets of da ta given by Taylor, Adair, and Adair, only two fail to conform to equation [3] and three to equation [6]. Both of these equations m a y be used for total N precipitated, in which case the coefficient of the first term is increased by 1, since the total N : E a N ratio is 1 greater than the A N : E a N ratio. This was done in calculating Curve IV, Text-fig. 1. In comparing the values calcu- lated according to [3] or [6] with Taylor, Adair, and Adair 's da ta i t should also be borne in mind tha t the first point of maximum ant ibody precipitation (with increasing amounts of antigen) need not coincide with the point of maximum total nitrogen, since ant ibody in this range is capable of combining with still more antigen, as shown by the decreasing ratios for A N : E a N in the precipitate in this range and in the initial portion of the inhibition zone.
I t is felt that the inhibition zone data in the Ea-A system offer too many un- certainties to warrant treatment of this portion of the reaction range as in Refer- ences 1 and 2. The method of calculation of the composition of the precipitate given in the Experimental part (pages 715 and 716) appears to be the most reason- able, but it is not considered entirely trustworthy since it tends to show somewhat
Dow
nloaded from http://rupress.org/jem
/article-pdf/62/5/697/1180536/697.pdf by guest on 08 February 2022

714 QUANTITATIVE THEORY OF PRECIPITIN REACTION. III
higher amounts of Ea in the supernatants near the region of total inhibition than were actually added. There is an uncertainty as to what correction to apply in order to avoid this.
If, for example, one deducts from the nitrogen precipitated in the analysis of the supernatants the average discrepancy noted in Reference 2, 0.03 rag. N for precipitates of 0.300 nag. N and over, one obtains decreasing ratios for A N:Ea N precipitated in the inhibition zone which agree well with comparable, directly determined ratios in the inhibition zone of the dye-antidye system. However, it is not known whether a like discrepancy, to be corrected for, exists in the Ea-A system, and indeed, the next to last experiment in Table II would seem to argue against such a correction. The uncorrected ratios appear to become constant before inhibition is greatly advanced, and while this result is not improbable, the precipitates become more and more gelatinous as the amounts of Ea added a r e
increased and inhibition becomes more complete, so that a change in composition seems indicated if A in this region may be considered as a single substance. It is hoped to ellm~nate these uncertainties in work now under way.
The serial experiments shown in Table V, as well as others which are not reported, also appear to conform to equations [3] and [6]. In addit ion they furnish evidence against the homogenei ty of anti- egg albumin. Thus serum 2.24 B, exhausted by Ea additions to approximately the same A content as diluted serum 2.24 A, yielded an equat ion with entirely different constants (Table V). s In general, the Danysz effect is much smaller than would have been expected by analogy with References 1 and 2. In spite of this a fraction of the ant ibody in sera 2.24 and 3.87 nI , the only ones studied f rom this s tandpoint , was found to be non-precipitable when the Ea was added in serial portions. This residual antibody, amount ing to 22 per cent in the case of serum 3.87 In , might be considered to be of lower react ivi ty owing to the small number, possibly only one, of immunologicaUy reactive groupings in an otherwise unal tered globulin molecule. Ant ibody of this type could scarcely build up the large A. Ea aggregates postula ted b y the writers and by Mar- rack as necessary before precipi tat ion occurs. However , when multi- valent (or average) an t ibody is present any A - E a compound formed
5 Similarly, the supernatant from the serial experiment on serum 3.87 II, containing approximately the same amount of precipitin N as 3.87 I, gave a linear equation almost coinciding with the line for 3.87 I, Text-fig. 1. It will be noted, however, from Text-fig. 2 that the equations for the whole sera do not coincide a t
equal A content.
Dow
nloaded from http://rupress.org/jem
/article-pdf/62/5/697/1180536/697.pdf by guest on 08 February 2022

MICHAEL HEIDELBERGER AND FOEREST E. KENDALL 715
by the residual antibody would participate in the building up of ag- gregates through the multivalent Ea present and the maximum titer would be attained if sufficient Ea were added, as is actually found. Moreover, if this interpretation be correct, it would be ex- pected that if such low-grade or residual antibody were added in suitable amount to serum before precipitation with a given quantity of Ea, the entire amount of residual antibody would be found added to the precipitable nitrogen obtainable from the serum and Ea alone. That this actually occurs, is seen in the last experiment given in Table II and on pages 717 and 719. The calculated residual anti- body N in 1.0 ml. of the serial supernatant, allowing for the succes- sive dilutions necessary, was 0.36 rag., and precisely this amount was found over the normally precipitated N when 1.0 ml. of supernatant was added to serum and Ea.
Thus by means of the quantitative method it has been possible to show, in an antiserum to a single protein antigen, the presence of a low-grade fraction of the total antibody, non-precipitable by the Ea when isolated, but precipitated with the remainder of the antibody under ordinary conditions. A simple explanation of the behavior of this antibody is also offered.
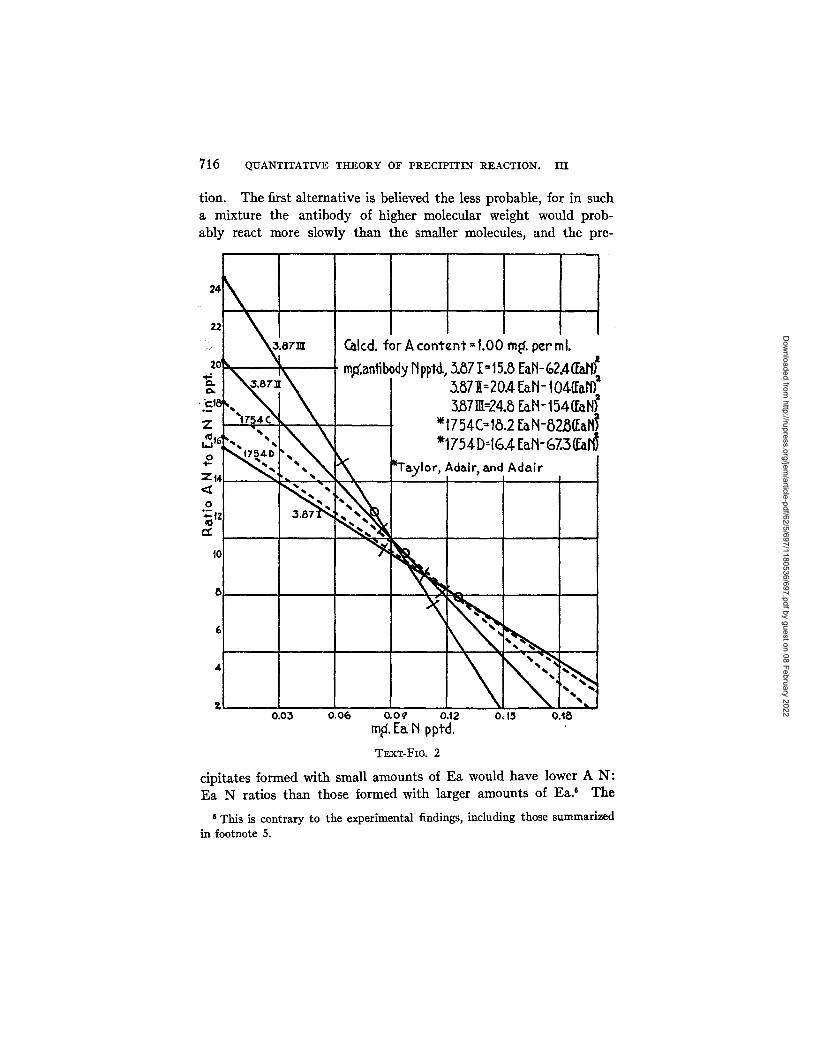
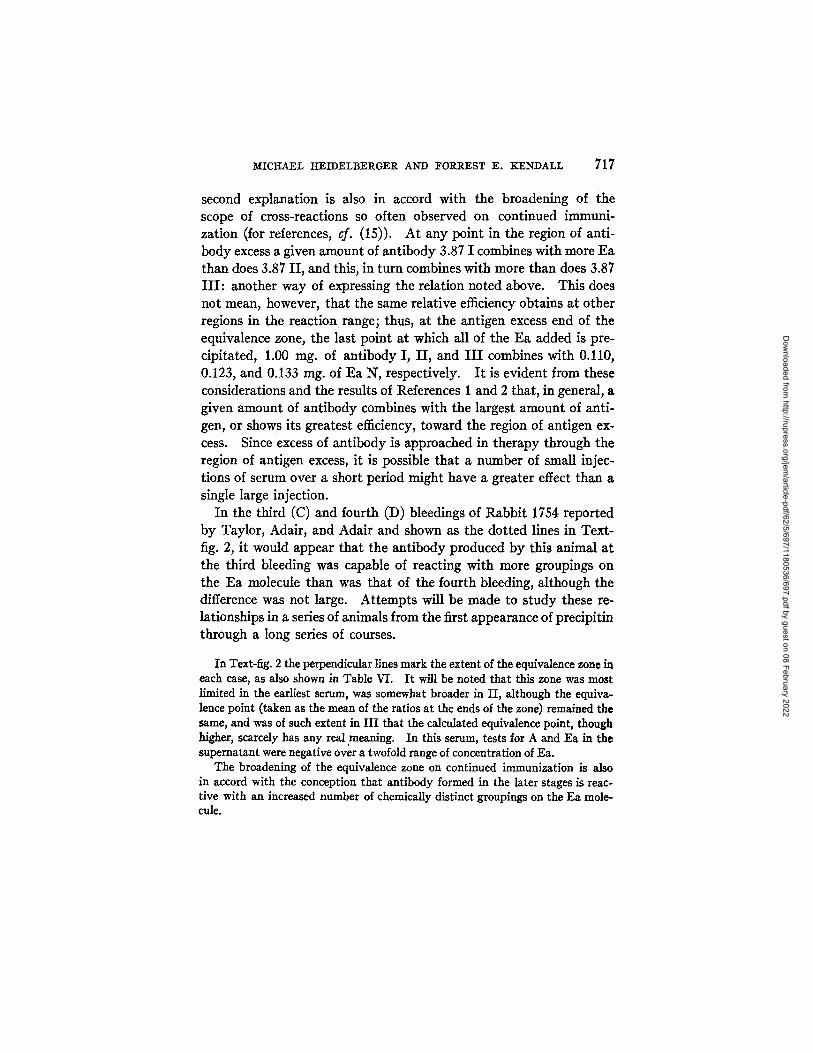
In Text-fig. 2 the lines given by equation [4] for the bleedings from Courses I, II, and I I I of Rabbit 3.87, (solid lines) and from the third and fourth bleedings of Rabbit 1754 (broken lines, Taylor, Adair, and Adair) are compared at 1.00 rag. of antibody N per mh
It will be noted that all points up to t he calculated maximum (indicated by the circle) on the line for 3.87 I I I lie above those of 3.87 II, which in turn lie above those of 3.87 I. The same result holds if the found maxima are taken as points of reference. Thus the antibody, considered as a single reactive unit, has become capable of combining with Ea to form compounds of higher A N: Ea N ratio in each successive bleeding. Two readily occurring explanations of this are: that antibody of higher and higher molecular weight, with the same combining capacity, is formed as the immunization proceeds, or that in the later stages antibody is formed which is reactive with a larger number of chemically distinct groupings on the Ea molecule than was the antibody produced in the earlier stages of immuniza-
Dow
nloaded from http://rupress.org/jem
/article-pdf/62/5/697/1180536/697.pdf by guest on 08 February 2022
716 QUANTITATIVE THEORY OF PRECIPITIN I~EACTION. III
tion. The first alternative is believed the less probable, for in such a mixture the antibody of higher molecular weight would prob- ably react more slowly than the smaller molecules, and the pre-
- \
.... r C~lcd. for A content --1.00 m S. per rnl.
, ~ z mp'.anlibocl 3 N ppt~, 5.87 I=15.8 [~N-62A(~I; .5.87 ][: 20.4 E~H- 104ff~rl]
_ '. 3.g7]]I=24.5 E~.II-154(~E Z "tr54 c\ *1754C=18.2 g~N-828ff~tt
~I~ "1754 D=IG.4 [~N- G7.3 ff~N
<~
o 3.8 7 " ~ a: ' e ~ ~%~ I
0.03 0.06 0.0¢ 0.t2 O, 15 0.48 rn~l. Ez~ N pptd.
Tz~xT-Fzo. 2
cipitates formed with small amounts of Ea would have lower A N: Ea N ratios than those formed with larger amounts of Ea? The
6 This is contrary to the experimental findings, including those summarized in footnote 5.
Dow
nloaded from http://rupress.org/jem
/article-pdf/62/5/697/1180536/697.pdf by guest on 08 February 2022
MICHAEL HEIDELBERGER AND FORREST E. KENDALL 717
second explanation is also in accord with the broadening of the scope of cross-reactions so often observed on continued immuni- zation (for references, el. (15)). At any point in the region of anti- body excess a given amount of antibody 3.87 1 combines with more Ea than does 3.87 II, and this, in turn combines with more than does 3.87 III : another way of expressing the relation noted above. This does not mean, however, that the same relative efficiency obtains at other regions in the reaction range; thus, at the antigen excess end of the equivalence zone, the last point at which all of the Ea added is pre- cipitated, 1.00 rag. of antibody I, II, and I I I combines with 0.110, 0.123, and 0.133 mg. of Ea N, respectively. I t is evident from these considerations and the results of References 1 and 2 that, in general, a given amount of antibody combines with the largest amount of anti- gen, or shows its greatest efficiency, toward the region of antigen ex- cess. Since excess of antibody is approached in therapy through the region of antigen excess, it is possible that a number of small injec- tions of serum over a short period might have a greater effect than a single large injection.
In the third (C) and fourth (D) bleedings of Rabbit 1754 reported by Taylor, Adair, and Adair and shown as the dotted lines in Text- fig. 2, it would appear that the antibody produced by this animal at the third bleeding was capable of reacting with more groupings on the Ea molecule than was that of the fourth bleeding, although the difference was not large. Attempts will be made to study these re- lationships in a series of animals from the first appearance of precipitin through a long series of courses.
In Text-fig. 2 the perpendicular lines mark the extent of the equivalence zone in each case, as also shown in Table VI. It will be noted that this zone was most limited in the earliest serum, was somewhat broader in II, although the equiva- lence point (taken as the mean of the ratios at the ends of the zone) remained the same, and was of such extent in III that the calculated equivalence point, though higher, scarcely has any real .meaning. In this serum, tests for A and Ea in the supernatant were negative over a twofold range of concentration of Ea.
The broadening of the equivalence zone on continued immunization is also in accord with the conception that antibody formed in the later stages is reac- tive with an increased number of chemically distinct groupings on the Ea mole- cule.
Dow
nloaded from http://rupress.org/jem
/article-pdf/62/5/697/1180536/697.pdf by guest on 08 February 2022

71g QUANTITATIVE TIIEORY OF PRECIPITIN REACTION. III
As had been found in References 1 and 2 the data in Table VI in- dicate that it is a matter of considerable difficulty to fix accurately the limits of the equivalence zone so that the equivalence point may be even approximately calculated. In most of the anti-Ea sera studied by the writers, by Culbertson (4, 5), and by Taylor, Adair, and Adair (6), the equivalence zones extended over a considerable range, and the extremes of the approximate equivalence points differed by as much as 50 per cent of the lower values. Consequently, this point can scarcely be said to be "constant" as considered by the other workers and by Hooker and Boyd (7). While the average equivalence point ratio appears to be fairly characteristic for any antigen-anti- body system, as shown by Hooker and Boyd, the variations of the equivalence point ratio in any one system are so great, even in different bleedings from the same animal, as to render it likely that this ratio is governed by other factors as well as the relative molecular weights of the reactants. I t would appear to the writers that available evidence favors the view that combining ratios over the entire range of the predpitin reaction depend on the relative numbers of reactive groupings in the antigen and antibody molecules as well as on the molecular weights.
The parallel study of the constant-antigen and constant-antibody series made by Taylor, Adair, and Adair (6) indicates, as these work- ers and others have pointed out, the probable correspondence of the constant-antibody flocculation optimum with the equivalence point; the chemical significance of the constant-antigen optimum is not dear. Although titrations made in these two ways show optimal ratios with the quotient 1.6, experiments of both types yield similar relations when calculated according to equations [3] or [6], as shown in Table IV.
In conclusion it is again pointed out that evidence is presented in References 1 and 2 and the present paper that antibody is not homo- geneous. Much of this evidence, it is believed, could not have been secured by the use of any but an accurate, quantitative method. At any rate it is apparent that a theory based on the statistical be- havior of antibody as a single substance can serve merely as a temporary expedient, useful in its application to antisera as they
Dow
nloaded from http://rupress.org/jem
/article-pdf/62/5/697/1180536/697.pdf by guest on 08 February 2022

MICHAEL HEIDELBERGER AND FOR_REST E. KENDALL 719
occur, and until such time as it may be possible to isolate antibody possessed of a single reactivity.
SUMMARY
1. A quantitative theory of the precipitin reaction based on the laws of classical chemistry has now been found applicable to the crystalline egg albumin-antibody system. Equations derived from the theory permit the calculation of the behavior of an anti-egg al- bumin serum over most of the reaction range after a few quantitative analyses have been made for the nitrogen precipitated. Data of other workers also conform to the proposed equations.
2. The empirical relation, shown to have advantages in the dye antidye system, may also be used for the Ea-A reaction.
3. Serum from the same animal after successive courses exhibits progressive changes which have been described graphically and quan- titatively. These changes are believed to consist in the formation of more and more antibody capable of reacting with a larger number of chemically different groupings in the antigen molecule.
4. Evidence is presented that anti-egg albumin is not homogeneous, and that even after prolonged immunization the antiserum contains much low-grade antibody, incapable of forming precipitates unless more reactive precipitin is present.
5. Factors affecting the equivalence point ratio are discussed.
In conclusion the writers wish to express their thanks for assist- ance given by Dr. Torsten Teorell.
BIBLIOGRAPHY
I. Heidelberger, M., and Kendall, F. E., J. Exp. Med., 1935, 619 563. 2. Heidetberger, M., and Kendall, F. E., J. Exp. ]Wed., 1935, 62, 467. 3. Taylor, G. L., J. Hyg., 1931, 31, 56; 1933, 33, 12. 4. Culbertson, J. T., J. Immunol., 1932, 9.3, 439. 5. Culbertson, J. T., J. Immunol., 1935, 28, 279. 6. Taylor, G. L., Adair, G. S., and Adair, M. E., J. Hyg., 1934, 34, 118. 7. Hooker, S. B., and Boyd, W. C., J. Gen. Physiol., 1934, 17, 341; Proc. Soc.
Exp. Biol. and Med., 1935, 32~ 1104. 8. Heidelberger, M., Kendall, F. E., and Soo Hoo, C. M., J. Exp. Meal., 1933, 58,
137. 9. Heidelberger, M., and Kendall, F. E., J. Exp. Med., 1932, 55, 555.
Dow
nloaded from http://rupress.org/jem
/article-pdf/62/5/697/1180536/697.pdf by guest on 08 February 2022

~20 QUANTITATIVE THEORY O~ PRECIPITIN REACTION. III
10. Heidelberger, M., Advanced laboratory manual of organic chemistry, New York, Chemical Catalog Co., 1923, 83.
11. Teorell, T., Acta reed. Stand., 1928, 68, 305. 12. Marrack, J. R., and Smith, F. C., Brit. Y. Exp. Path., 1931, 19., 30. 13. Hooker, S. B., and Boyd, W. C., Y. Immunol., 1934, 9.6, 469. 14. Marrack, J. R., The chemistry of antigens and antibodies, London, His
Majesty's Stationery Office, 1934. 15. Heidelberger, M., and Kendall, F. E., I . Exp. Med., 1934, fig~ 519.
Dow
nloaded from http://rupress.org/jem
/article-pdf/62/5/697/1180536/697.pdf by guest on 08 February 2022


