A quantitative analysis of the submentalis muscle electromyographic amplitude during rapid eye...
7
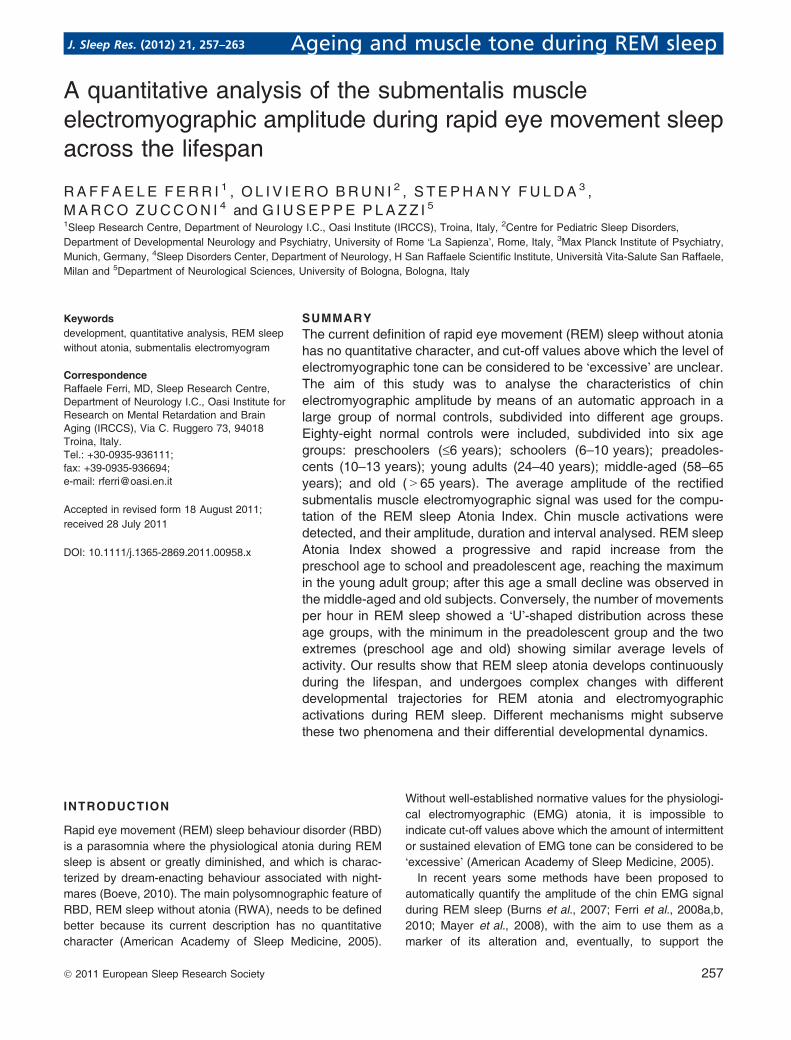
A quantitative analysis of the submentalis muscle electromyographic amplitude during rapid eye movement sleep across the lifespan RAFFAELE FERRI 1 , OLIVIERO BRUNI 2 , STEPHANY FULDA 3 , MARCO ZUCCONI 4 and GIUSEPPE PLAZZI 5 1 Sleep Research Centre, Department of Neurology I.C., Oasi Institute (IRCCS), Troina, Italy, 2 Centre for Pediatric Sleep Disorders, Department of Developmental Neurology and Psychiatry, University of Rome ÔLa SapienzaÕ, Rome, Italy, 3 Max Planck Institute of Psychiatry, Munich, Germany, 4 Sleep Disorders Center, Department of Neurology, H San Raffaele Scientific Institute, Universita ` Vita-Salute San Raffaele, Milan and 5 Department of Neurological Sciences, University of Bologna, Bologna, Italy Keywords development, quantitative analysis, REM sleep without atonia, submentalis electromyogram Correspondence Raffaele Ferri, MD, Sleep Research Centre, Department of Neurology I.C., Oasi Institute for Research on Mental Retardation and Brain Aging (IRCCS), Via C. Ruggero 73, 94018 Troina, Italy. Tel.: +30-0935-936111; fax: +39-0935-936694; e-mail: [email protected] Accepted in revised form 18 August 2011; received 28 July 2011 DOI: 10.1111/j.1365-2869.2011.00958.x SUMMARY The current definition of rapid eye movement (REM) sleep without atonia has no quantitative character, and cut-off values above which the level of electromyographic tone can be considered to be ÔexcessiveÕ are unclear. The aim of this study was to analyse the characteristics of chin electromyographic amplitude by means of an automatic approach in a large group of normal controls, subdivided into different age groups. Eighty-eight normal controls were included, subdivided into six age groups: preschoolers (£6 years); schoolers (6–10 years); preadoles- cents (10–13 years); young adults (24–40 years); middle-aged (58–65 years); and old (>65 years). The average amplitude of the rectified submentalis muscle electromyographic signal was used for the compu- tation of the REM sleep Atonia Index. Chin muscle activations were detected, and their amplitude, duration and interval analysed. REM sleep Atonia Index showed a progressive and rapid increase from the preschool age to school and preadolescent age, reaching the maximum in the young adult group; after this age a small decline was observed in the middle-aged and old subjects. Conversely, the number of movements per hour in REM sleep showed a ÔUÕ-shaped distribution across these age groups, with the minimum in the preadolescent group and the two extremes (preschool age and old) showing similar average levels of activity. Our results show that REM sleep atonia develops continuously during the lifespan, and undergoes complex changes with different developmental trajectories for REM atonia and electromyographic activations during REM sleep. Different mechanisms might subserve these two phenomena and their differential developmental dynamics. INTRODUCTION Rapid eye movement (REM) sleep behaviour disorder (RBD) is a parasomnia where the physiological atonia during REM sleep is absent or greatly diminished, and which is charac- terized by dream-enacting behaviour associated with night- mares (Boeve, 2010). The main polysomnographic feature of RBD, REM sleep without atonia (RWA), needs to be defined better because its current description has no quantitative character (American Academy of Sleep Medicine, 2005). Without well-established normative values for the physiologi- cal electromyographic (EMG) atonia, it is impossible to indicate cut-off values above which the amount of intermittent or sustained elevation of EMG tone can be considered to be ÔexcessiveÕ (American Academy of Sleep Medicine, 2005). In recent years some methods have been proposed to automatically quantify the amplitude of the chin EMG signal during REM sleep (Burns et al., 2007; Ferri et al., 2008a,b, 2010; Mayer et al., 2008), with the aim to use them as a marker of its alteration and, eventually, to support the J. Sleep Res. (2012) 21, 257–263 Ageing and muscle tone during REM sleep Ó 2011 European Sleep Research Society 257
-
Upload
raffaele-ferri -
Category
Documents
-
view
212 -
download
0
Transcript of A quantitative analysis of the submentalis muscle electromyographic amplitude during rapid eye...
A quantitative analysis of the submentalis muscleelectromyographic amplitude during rapid eye movement sleepacross the lifespan
RAFFAELE FERR I 1 , O L I V I ERO BRUN I 2 , S TEPHANY FULDA 3 ,MARCO ZUCCON I 4 and G I USEPPE PLAZZ I 51Sleep Research Centre, Department of Neurology I.C., Oasi Institute (IRCCS), Troina, Italy, 2Centre for Pediatric Sleep Disorders,Department of Developmental Neurology and Psychiatry, University of Rome �La Sapienza�, Rome, Italy, 3Max Planck Institute of Psychiatry,Munich, Germany, 4Sleep Disorders Center, Department of Neurology, H San Raffaele Scientific Institute, Universita Vita-Salute San Raffaele,Milan and 5Department of Neurological Sciences, University of Bologna, Bologna, Italy
Keywordsdevelopment, quantitative analysis, REM sleepwithout atonia, submentalis electromyogram
CorrespondenceRaffaele Ferri, MD, Sleep Research Centre,Department of Neurology I.C., Oasi Institute forResearch on Mental Retardation and BrainAging (IRCCS), Via C. Ruggero 73, 94018Troina, Italy.Tel.: +30-0935-936111;fax: +39-0935-936694;e-mail: [email protected]
Accepted in revised form 18 August 2011;received 28 July 2011
DOI: 10.1111/j.1365-2869.2011.00958.x
SUMMARYThe current definition of rapid eye movement (REM) sleep without atoniahas no quantitative character, and cut-off values above which the level ofelectromyographic tone can be considered to be �excessive� are unclear.The aim of this study was to analyse the characteristics of chinelectromyographic amplitude by means of an automatic approach in alarge group of normal controls, subdivided into different age groups.Eighty-eight normal controls were included, subdivided into six agegroups: preschoolers (£6 years); schoolers (6–10 years); preadoles-cents (10–13 years); young adults (24–40 years); middle-aged (58–65years); and old (>65 years). The average amplitude of the rectifiedsubmentalis muscle electromyographic signal was used for the compu-tation of the REM sleep Atonia Index. Chin muscle activations weredetected, and their amplitude, duration and interval analysed. REM sleepAtonia Index showed a progressive and rapid increase from thepreschool age to school and preadolescent age, reaching the maximumin the young adult group; after this age a small decline was observed inthe middle-aged and old subjects. Conversely, the number of movementsper hour in REM sleep showed a �U�-shaped distribution across theseage groups, with the minimum in the preadolescent group and the twoextremes (preschool age and old) showing similar average levels ofactivity. Our results show that REM sleep atonia develops continuouslyduring the lifespan, and undergoes complex changes with differentdevelopmental trajectories for REM atonia and electromyographicactivations during REM sleep. Different mechanisms might subservethese two phenomena and their differential developmental dynamics.
INTRODUCTION
Rapid eye movement (REM) sleep behaviour disorder (RBD)is a parasomnia where the physiological atonia during REMsleep is absent or greatly diminished, and which is charac-terized by dream-enacting behaviour associated with night-mares (Boeve, 2010). The main polysomnographic feature ofRBD, REM sleep without atonia (RWA), needs to be definedbetter because its current description has no quantitativecharacter (American Academy of Sleep Medicine, 2005).
Without well-established normative values for the physiologi-cal electromyographic (EMG) atonia, it is impossible toindicate cut-off values above which the amount of intermittentor sustained elevation of EMG tone can be considered to be�excessive� (American Academy of Sleep Medicine, 2005).In recent years some methods have been proposed to
automatically quantify the amplitude of the chin EMG signalduring REM sleep (Burns et al., 2007; Ferri et al., 2008a,b,2010; Mayer et al., 2008), with the aim to use them as amarker of its alteration and, eventually, to support the
J. Sleep Res. (2012) 21, 257–263 Ageing and muscle tone during REM sleep
� 2011 European Sleep Research Society 257

diagnosis of RBD. Recently, we have also reported that ourquantitative method is able not only to disclose differencesbetween normal controls and patients with RBD, but alsobetween nosologically different groups of patients who seemto present with different types of REM sleep-related motordisturbances (Ferri et al., 2008a,b). What today is lumpedtogether under the term of RBD, might in the future berevealed to have different underlying neurochemical andneurophysiological mechanisms, depending on whether it isobserved in its idiopathic form or in patients with synuclein-opathies (e.g. multiple system atrophy; Ferri et al., 2008b) ornarcolepsy (Ferri et al., 2008a).The characteristics of this automatic approach need now to
be described better in a normal population in order to be usedmore widely for clinical reasons. In particular, developmentalaspects of REM sleep atonia have not received muchattention, although RBD can occur in children and adoles-cents (Sheldon and Jacobsen, 1998; Stores, 2008) in whomit might be underdiagnosed, especially in association withnarcolepsy. Virtually no data on automated quantitative chinEMG amplitude are currently available in children and, giventhe increasing interest in the diagnosis of RBD in thepaediatric population (Maski and Kothare, 2009; Nevsimal-ova et al., 2007; Vendrame et al., 2008), the aim of this newstudy was to analyse the characteristics of chin EMGamplitude by means of our automatic approach in a largegroup of normal controls, subdivided into different agegroups, covering a large part of the lifespan.
MATERIALS AND METHODS
Subjects
Eighty-eight normal controls were included in this study,whose recordings were available in the lab databasebecause they had participated in various research protocols(ethics committee approval and informed consent had beenobtained for each of the protocols). The subjects weresubdivided into six age groups: preschoolers (age £ 6years); schoolers age (>6, <10 years); preadolescents age(‡10, <13 years); young adults (age > 24, <40 years);middle aged (age > 58, £65 years); and old (age > 65years); their demographic features are detailed in Table 1.
None of these subjects had any physical, neurological orpsychiatric disorders or history of sleep problems, and nonewas taking medication at the time of recording. Exclusioncriteria included: (i) a sleep disorder diagnosis (includingRBD, sleep apnoea, restless legs syndrome ⁄periodic legmovement disorder); (ii) a major mental illness; (iii) asignificant history of cognitive difficulties; (iv) prior (within1 year) or current use of a neuroleptic agent or selectiveserotonin reuptake inhibitors, venlafaxine, duloxetine;(v) history of alcohol or other substance abuse.
Nocturnal polysomnography
Nocturnal polysomnography was carried out after a night ofadaptation in a standard sound-attenuated (noise level to amaximum of 30 dB nHL) sleep laboratory room. Subjectswere not allowed caffeinated beverages the afternoonpreceding the recording, and were allowed to sleep-in untiltheir spontaneous awakening in the morning. Lights-out timewas based on individual habitual bed time, and rangedbetween 21:30 and 23:30 h. The following signals wererecorded: electroencephalogram (at least two channels, onecentral and one occipital, referred to the contralateralearlobe); electrooculogram (electrodes placed 1 cm abovethe right outer cantus and 1 cm below the left outer cantus,and referred to A1); electromyogram (EMG) of the submen-talis muscle (bipolar derivations with two electrodes placed3 cm apart and affixed using a collodion-soaked gauzepad), impedance was kept <10 kX (typically <5 kX); EMG ofthe right and left tibialis anterior muscles; and electrocar-diogram (one derivation). Sleep signals were sampled at200 or 256 Hz, and stored on hard disk for further analysis.The sleep respiratory pattern of each patient was monitoredusing oral and nasal airflow thermistors and ⁄or nasalpressure cannula, thoracic and abdominal respiratory effortstrain gauge, and by monitoring oxygen saturation (pulse-oxymetry). Subjects with an apnoea ⁄hypopnoea index > 5were not included (>1 in the paediatric ages). Sleep stageswere scored following standard criteria (Rechtschaffenand Kales, 1968) on 30-s epochs; epochs containingtechnical artefacts or extremely elevated muscle activitycausing saturation of amplifiers were carefully detected andmarked for exclusion from the subsequent quantitative EMGanalysis.
Quantification of the submentalis muscle EMG amplitude
Similarly to the method we have previously reported (Ferriet al., 2008a,b, 2010), the submentalis muscle EMG signalwas digitally band-pass filtered at 10–100 Hz, with a notchfilter at 50 Hz, and rectified; subsequently, all REM sleepepochs were included in the analysis and subdivided into 301-s mini-epochs. The average amplitude of the rectifiedsubmentalis muscle EMG signal was then obtained for eachmini-epoch. Then a noise reduction method was imple-mented (Ferri et al., 2010) by subtracting from the average
Table 1 Demographic features of the subject groups
Group Males Females Total
Age
Mean SD
Preschool 7 7 14 4.9 1.14School 9 7 16 7.3 0.83Preadolescent 7 7 14 10.4 0.76Young 12 13 25 29.7 3.57Middle-aged 4 6 10 62.2 2.17Old 3 6 9 73.4 6.30
258 R. Ferri et al.
� 2011 European Sleep Research Society
rectified EMG amplitude in each mini-epoch the minimumvalue found in a moving window of ±30 mini-epochs(assuming that the minimum value in this 60-s period is agood estimate of the local level of noise affecting all sampledsignal values in such a period). The values of the averagenoise-reduced EMG signal amplitude in each mini-epochwere used to draw distribution histograms of the percentageof values in the following 20 amplitude (amp) classes(expressed in lV): amp £ 1, 1 < amp £ 2, …, 18 < amp £19, amp ‡ 20. The REM sleep Atonia Index was thencomputed as:
REMsleepAtonia Index ¼ amp � 1=ð100� 1< amp � 2Þ;
which reflects the degree of preponderance of the firstcolumn in these graphs (amp £ 1) in relation to the cumula-tive value of all columns with amp > 2 and amp ‡ 20 (thecolumn 1 < amp £ 2 is not taken into account because itmight reflect both atonia and EMG activation). Mathemati-cally, this index can vary from 0 (absence of mini-epochs withamp £ 1), which means complete absence of EMG atonia, to1 (all mini-epochs with amp £ 1) or continuous stable EMGatonia during REM sleep.Subsequently, we also counted all sequences of consec-
utive mini-epochs exceeding the value of 2 lV (which we willalso call �movements�) and calculated their number per hourof REM sleep. The duration of these movements wasclassified within the following 20 duration (dur) classes(expressed in s): dur = 1, dur = 2, …, dur = 19, dur > 19.Distribution histograms of the duration of movements,normalized to the number per hour of REM sleep, weredrawn for each age group. Lastly, the intervals between thesemovements were measured and plotted as distributionhistograms, within the following 49 interval (int) classes(expressed in s): int = 2–4, int = 4–6, …, int = 98–100.
Statistical data analysis
Overall-comparisons between age groups were carried outusing the non-parametric Kruskal–Wallis anova for indepen-dent data sets. Differences and correlations were consideredsignificant when they reached a P < 0.05 level. In addition, apolynomial (cubic or quartic) interpolation line was computedto depict the course of REM sleep Atonia Index and totalnumber of movements per hour across age groups by usingungrouped individual data. The data analysis softwaresystem STATISTICA (StatSoft, 2004, version 6. http://www.statsoft.com) was used for statistical analysis.
RESULTS
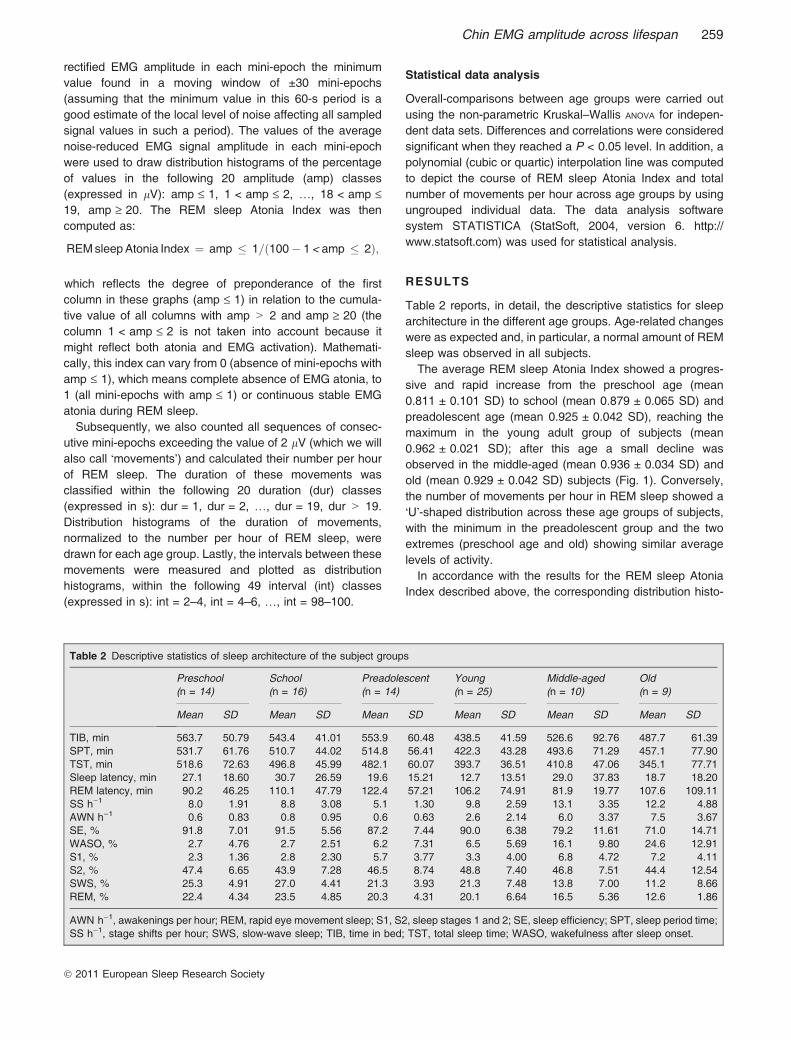
Table 2 reports, in detail, the descriptive statistics for sleeparchitecture in the different age groups. Age-related changeswere as expected and, in particular, a normal amount of REMsleep was observed in all subjects.The average REM sleep Atonia Index showed a progres-
sive and rapid increase from the preschool age (mean0.811 ± 0.101 SD) to school (mean 0.879 ± 0.065 SD) andpreadolescent age (mean 0.925 ± 0.042 SD), reaching themaximum in the young adult group of subjects (mean0.962 ± 0.021 SD); after this age a small decline wasobserved in the middle-aged (mean 0.936 ± 0.034 SD) andold (mean 0.929 ± 0.042 SD) subjects (Fig. 1). Conversely,the number of movements per hour in REM sleep showed a�U�-shaped distribution across these age groups of subjects,with the minimum in the preadolescent group and the twoextremes (preschool age and old) showing similar averagelevels of activity.In accordance with the results for the REM sleep Atonia
Index described above, the corresponding distribution histo-
Table 2 Descriptive statistics of sleep architecture of the subject groups
Preschool(n = 14)
School(n = 16)
Preadolescent(n = 14)
Young(n = 25)
Middle-aged(n = 10)
Old(n = 9)
Mean SD Mean SD Mean SD Mean SD Mean SD Mean SD
TIB, min 563.7 50.79 543.4 41.01 553.9 60.48 438.5 41.59 526.6 92.76 487.7 61.39SPT, min 531.7 61.76 510.7 44.02 514.8 56.41 422.3 43.28 493.6 71.29 457.1 77.90TST, min 518.6 72.63 496.8 45.99 482.1 60.07 393.7 36.51 410.8 47.06 345.1 77.71Sleep latency, min 27.1 18.60 30.7 26.59 19.6 15.21 12.7 13.51 29.0 37.83 18.7 18.20REM latency, min 90.2 46.25 110.1 47.79 122.4 57.21 106.2 74.91 81.9 19.77 107.6 109.11SS h)1 8.0 1.91 8.8 3.08 5.1 1.30 9.8 2.59 13.1 3.35 12.2 4.88AWN h)1 0.6 0.83 0.8 0.95 0.6 0.63 2.6 2.14 6.0 3.37 7.5 3.67SE, % 91.8 7.01 91.5 5.56 87.2 7.44 90.0 6.38 79.2 11.61 71.0 14.71WASO, % 2.7 4.76 2.7 2.51 6.2 7.31 6.5 5.69 16.1 9.80 24.6 12.91S1, % 2.3 1.36 2.8 2.30 5.7 3.77 3.3 4.00 6.8 4.72 7.2 4.11S2, % 47.4 6.65 43.9 7.28 46.5 8.74 48.8 7.40 46.8 7.51 44.4 12.54SWS, % 25.3 4.91 27.0 4.41 21.3 3.93 21.3 7.48 13.8 7.00 11.2 8.66REM, % 22.4 4.34 23.5 4.85 20.3 4.31 20.1 6.64 16.5 5.36 12.6 1.86
AWN h)1, awakenings per hour; REM, rapid eye movement sleep; S1, S2, sleep stages 1 and 2; SE, sleep efficiency; SPT, sleep period time;SS h)1, stage shifts per hour; SWS, slow-wave sleep; TIB, time in bed; TST, total sleep time; WASO, wakefulness after sleep onset.
Chin EMG amplitude across lifespan 259
� 2011 European Sleep Research Society
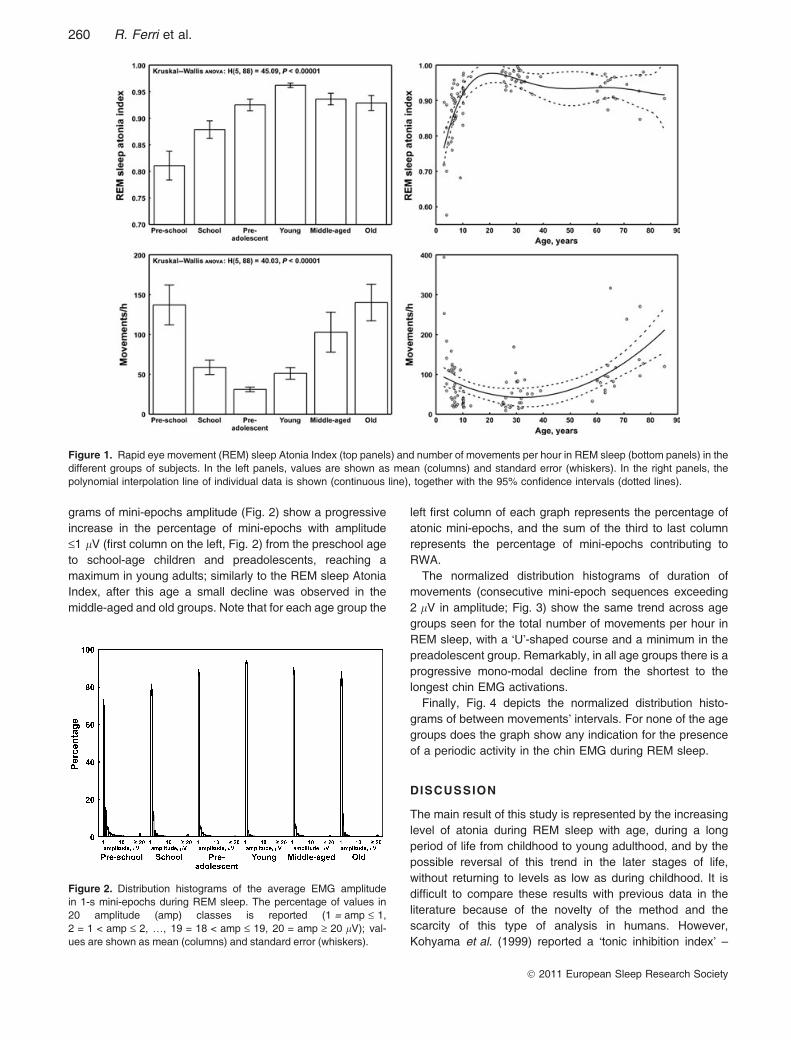
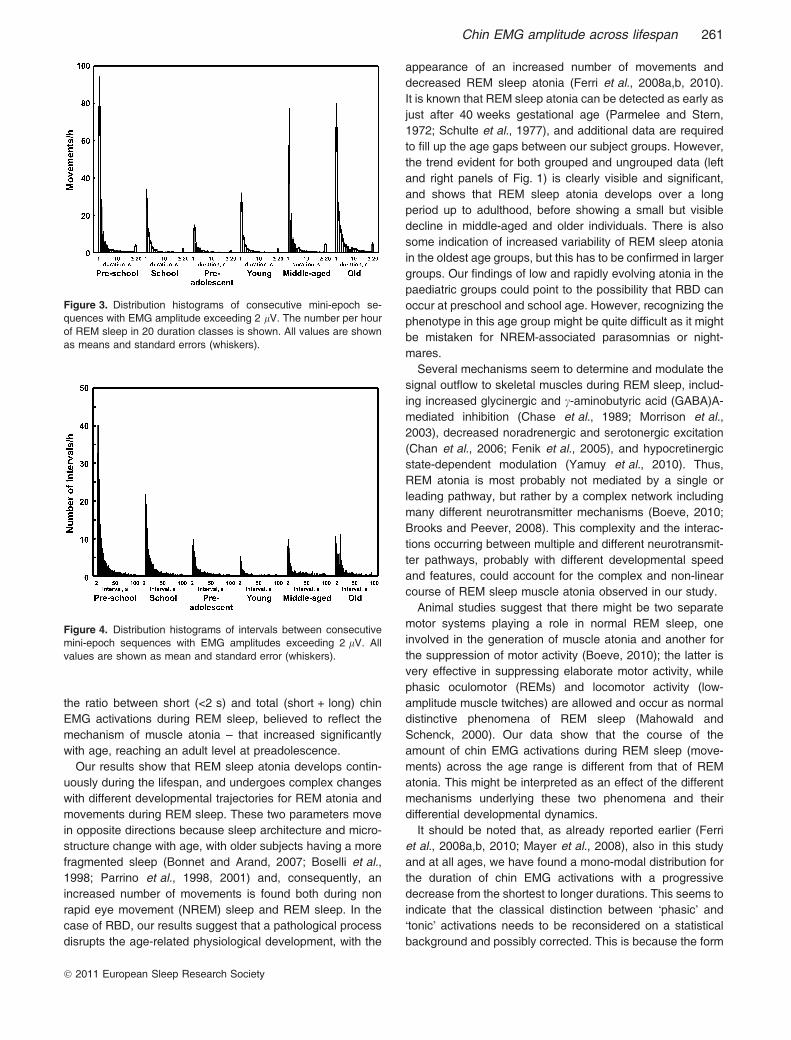
grams of mini-epochs amplitude (Fig. 2) show a progressiveincrease in the percentage of mini-epochs with amplitude£1 lV (first column on the left, Fig. 2) from the preschool ageto school-age children and preadolescents, reaching amaximum in young adults; similarly to the REM sleep AtoniaIndex, after this age a small decline was observed in themiddle-aged and old groups. Note that for each age group the
left first column of each graph represents the percentage ofatonic mini-epochs, and the sum of the third to last columnrepresents the percentage of mini-epochs contributing toRWA.The normalized distribution histograms of duration of
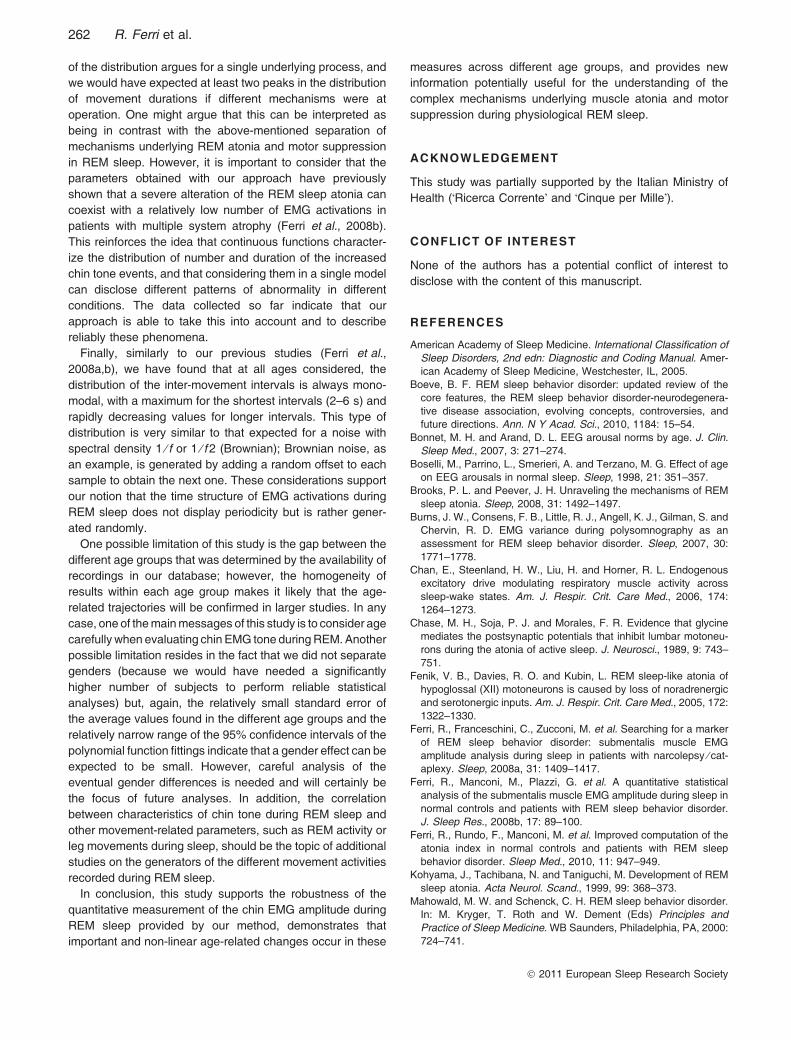
movements (consecutive mini-epoch sequences exceeding2 lV in amplitude; Fig. 3) show the same trend across agegroups seen for the total number of movements per hour inREM sleep, with a �U�-shaped course and a minimum in thepreadolescent group. Remarkably, in all age groups there is aprogressive mono-modal decline from the shortest to thelongest chin EMG activations.Finally, Fig. 4 depicts the normalized distribution histo-
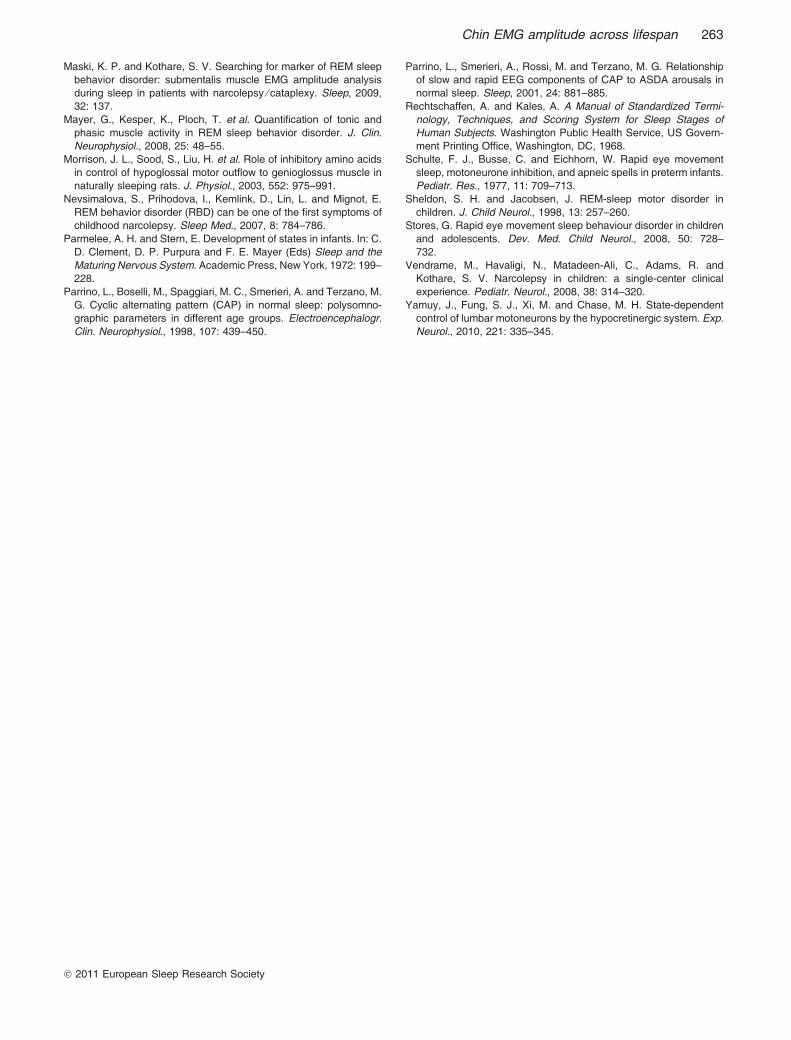
grams of between movements� intervals. For none of the agegroups does the graph show any indication for the presenceof a periodic activity in the chin EMG during REM sleep.
DISCUSSION
The main result of this study is represented by the increasinglevel of atonia during REM sleep with age, during a longperiod of life from childhood to young adulthood, and by thepossible reversal of this trend in the later stages of life,without returning to levels as low as during childhood. It isdifficult to compare these results with previous data in theliterature because of the novelty of the method and thescarcity of this type of analysis in humans. However,Kohyama et al. (1999) reported a �tonic inhibition index� –
Figure 1. Rapid eye movement (REM) sleep Atonia Index (top panels) and number of movements per hour in REM sleep (bottom panels) in thedifferent groups of subjects. In the left panels, values are shown as mean (columns) and standard error (whiskers). In the right panels, thepolynomial interpolation line of individual data is shown (continuous line), together with the 95% confidence intervals (dotted lines).
Figure 2. Distribution histograms of the average EMG amplitudein 1-s mini-epochs during REM sleep. The percentage of values in20 amplitude (amp) classes is reported (1 = amp £ 1,2 = 1 < amp £ 2, …, 19 = 18 < amp £ 19, 20 = amp ‡ 20 lV); val-ues are shown as mean (columns) and standard error (whiskers).
260 R. Ferri et al.
� 2011 European Sleep Research Society
the ratio between short (<2 s) and total (short + long) chinEMG activations during REM sleep, believed to reflect themechanism of muscle atonia – that increased significantlywith age, reaching an adult level at preadolescence.Our results show that REM sleep atonia develops contin-
uously during the lifespan, and undergoes complex changeswith different developmental trajectories for REM atonia andmovements during REM sleep. These two parameters movein opposite directions because sleep architecture and micro-structure change with age, with older subjects having a morefragmented sleep (Bonnet and Arand, 2007; Boselli et al.,1998; Parrino et al., 1998, 2001) and, consequently, anincreased number of movements is found both during nonrapid eye movement (NREM) sleep and REM sleep. In thecase of RBD, our results suggest that a pathological processdisrupts the age-related physiological development, with the
appearance of an increased number of movements anddecreased REM sleep atonia (Ferri et al., 2008a,b, 2010).It is known that REM sleep atonia can be detected as early asjust after 40 weeks gestational age (Parmelee and Stern,1972; Schulte et al., 1977), and additional data are requiredto fill up the age gaps between our subject groups. However,the trend evident for both grouped and ungrouped data (leftand right panels of Fig. 1) is clearly visible and significant,and shows that REM sleep atonia develops over a longperiod up to adulthood, before showing a small but visibledecline in middle-aged and older individuals. There is alsosome indication of increased variability of REM sleep atoniain the oldest age groups, but this has to be confirmed in largergroups. Our findings of low and rapidly evolving atonia in thepaediatric groups could point to the possibility that RBD canoccur at preschool and school age. However, recognizing thephenotype in this age group might be quite difficult as it mightbe mistaken for NREM-associated parasomnias or night-mares.Several mechanisms seem to determine and modulate the
signal outflow to skeletal muscles during REM sleep, includ-ing increased glycinergic and c-aminobutyric acid (GABA)A-mediated inhibition (Chase et al., 1989; Morrison et al.,2003), decreased noradrenergic and serotonergic excitation(Chan et al., 2006; Fenik et al., 2005), and hypocretinergicstate-dependent modulation (Yamuy et al., 2010). Thus,REM atonia is most probably not mediated by a single orleading pathway, but rather by a complex network includingmany different neurotransmitter mechanisms (Boeve, 2010;Brooks and Peever, 2008). This complexity and the interac-tions occurring between multiple and different neurotransmit-ter pathways, probably with different developmental speedand features, could account for the complex and non-linearcourse of REM sleep muscle atonia observed in our study.Animal studies suggest that there might be two separate
motor systems playing a role in normal REM sleep, oneinvolved in the generation of muscle atonia and another forthe suppression of motor activity (Boeve, 2010); the latter isvery effective in suppressing elaborate motor activity, whilephasic oculomotor (REMs) and locomotor activity (low-amplitude muscle twitches) are allowed and occur as normaldistinctive phenomena of REM sleep (Mahowald andSchenck, 2000). Our data show that the course of theamount of chin EMG activations during REM sleep (move-ments) across the age range is different from that of REMatonia. This might be interpreted as an effect of the differentmechanisms underlying these two phenomena and theirdifferential developmental dynamics.It should be noted that, as already reported earlier (Ferri
et al., 2008a,b, 2010; Mayer et al., 2008), also in this studyand at all ages, we have found a mono-modal distribution forthe duration of chin EMG activations with a progressivedecrease from the shortest to longer durations. This seems toindicate that the classical distinction between �phasic� and�tonic� activations needs to be reconsidered on a statisticalbackground and possibly corrected. This is because the form
Figure 3. Distribution histograms of consecutive mini-epoch se-quences with EMG amplitude exceeding 2 lV. The number per hourof REM sleep in 20 duration classes is shown. All values are shownas means and standard errors (whiskers).
Figure 4. Distribution histograms of intervals between consecutivemini-epoch sequences with EMG amplitudes exceeding 2 lV. Allvalues are shown as mean and standard error (whiskers).
Chin EMG amplitude across lifespan 261
� 2011 European Sleep Research Society
of the distribution argues for a single underlying process, andwe would have expected at least two peaks in the distributionof movement durations if different mechanisms were atoperation. One might argue that this can be interpreted asbeing in contrast with the above-mentioned separation ofmechanisms underlying REM atonia and motor suppressionin REM sleep. However, it is important to consider that theparameters obtained with our approach have previouslyshown that a severe alteration of the REM sleep atonia cancoexist with a relatively low number of EMG activations inpatients with multiple system atrophy (Ferri et al., 2008b).This reinforces the idea that continuous functions character-ize the distribution of number and duration of the increasedchin tone events, and that considering them in a single modelcan disclose different patterns of abnormality in differentconditions. The data collected so far indicate that ourapproach is able to take this into account and to describereliably these phenomena.Finally, similarly to our previous studies (Ferri et al.,
2008a,b), we have found that at all ages considered, thedistribution of the inter-movement intervals is always mono-modal, with a maximum for the shortest intervals (2–6 s) andrapidly decreasing values for longer intervals. This type ofdistribution is very similar to that expected for a noise withspectral density 1 ⁄ f or 1 ⁄ f 2 (Brownian); Brownian noise, asan example, is generated by adding a random offset to eachsample to obtain the next one. These considerations supportour notion that the time structure of EMG activations duringREM sleep does not display periodicity but is rather gener-ated randomly.One possible limitation of this study is the gap between the
different age groups that was determined by the availability ofrecordings in our database; however, the homogeneity ofresults within each age group makes it likely that the age-related trajectories will be confirmed in larger studies. In anycase, one of themainmessages of this study is to consider agecarefully when evaluating chin EMG tone duringREM.Anotherpossible limitation resides in the fact that we did not separategenders (because we would have needed a significantlyhigher number of subjects to perform reliable statisticalanalyses) but, again, the relatively small standard error ofthe average values found in the different age groups and therelatively narrow range of the 95% confidence intervals of thepolynomial function fittings indicate that a gender effect can beexpected to be small. However, careful analysis of theeventual gender differences is needed and will certainly bethe focus of future analyses. In addition, the correlationbetween characteristics of chin tone during REM sleep andother movement-related parameters, such as REM activity orleg movements during sleep, should be the topic of additionalstudies on the generators of the different movement activitiesrecorded during REM sleep.In conclusion, this study supports the robustness of the
quantitative measurement of the chin EMG amplitude duringREM sleep provided by our method, demonstrates thatimportant and non-linear age-related changes occur in these
measures across different age groups, and provides newinformation potentially useful for the understanding of thecomplex mechanisms underlying muscle atonia and motorsuppression during physiological REM sleep.
ACKNOWLEDGEMENT
This study was partially supported by the Italian Ministry ofHealth (�Ricerca Corrente� and �Cinque per Mille�).
CONFLICT OF INTEREST
None of the authors has a potential conflict of interest todisclose with the content of this manuscript.
REFERENCES
American Academy of Sleep Medicine. International Classification ofSleep Disorders, 2nd edn: Diagnostic and Coding Manual. Amer-ican Academy of Sleep Medicine, Westchester, IL, 2005.
Boeve, B. F. REM sleep behavior disorder: updated review of thecore features, the REM sleep behavior disorder-neurodegenera-tive disease association, evolving concepts, controversies, andfuture directions. Ann. N Y Acad. Sci., 2010, 1184: 15–54.
Bonnet, M. H. and Arand, D. L. EEG arousal norms by age. J. Clin.Sleep Med., 2007, 3: 271–274.
Boselli, M., Parrino, L., Smerieri, A. and Terzano, M. G. Effect of ageon EEG arousals in normal sleep. Sleep, 1998, 21: 351–357.
Brooks, P. L. and Peever, J. H. Unraveling the mechanisms of REMsleep atonia. Sleep, 2008, 31: 1492–1497.
Burns, J. W., Consens, F. B., Little, R. J., Angell, K. J., Gilman, S. andChervin, R. D. EMG variance during polysomnography as anassessment for REM sleep behavior disorder. Sleep, 2007, 30:1771–1778.
Chan, E., Steenland, H. W., Liu, H. and Horner, R. L. Endogenousexcitatory drive modulating respiratory muscle activity acrosssleep-wake states. Am. J. Respir. Crit. Care Med., 2006, 174:1264–1273.
Chase, M. H., Soja, P. J. and Morales, F. R. Evidence that glycinemediates the postsynaptic potentials that inhibit lumbar motoneu-rons during the atonia of active sleep. J. Neurosci., 1989, 9: 743–751.
Fenik, V. B., Davies, R. O. and Kubin, L. REM sleep-like atonia ofhypoglossal (XII) motoneurons is caused by loss of noradrenergicand serotonergic inputs. Am. J. Respir. Crit. Care Med., 2005, 172:1322–1330.
Ferri, R., Franceschini, C., Zucconi, M. et al. Searching for a markerof REM sleep behavior disorder: submentalis muscle EMGamplitude analysis during sleep in patients with narcolepsy ⁄ cat-aplexy. Sleep, 2008a, 31: 1409–1417.
Ferri, R., Manconi, M., Plazzi, G. et al. A quantitative statisticalanalysis of the submentalis muscle EMG amplitude during sleep innormal controls and patients with REM sleep behavior disorder.J. Sleep Res., 2008b, 17: 89–100.
Ferri, R., Rundo, F., Manconi, M. et al. Improved computation of theatonia index in normal controls and patients with REM sleepbehavior disorder. Sleep Med., 2010, 11: 947–949.
Kohyama, J., Tachibana, N. and Taniguchi, M. Development of REMsleep atonia. Acta Neurol. Scand., 1999, 99: 368–373.
Mahowald, M. W. and Schenck, C. H. REM sleep behavior disorder.In: M. Kryger, T. Roth and W. Dement (Eds) Principles andPractice of Sleep Medicine. WB Saunders, Philadelphia, PA, 2000:724–741.
262 R. Ferri et al.
� 2011 European Sleep Research Society
Maski, K. P. and Kothare, S. V. Searching for marker of REM sleepbehavior disorder: submentalis muscle EMG amplitude analysisduring sleep in patients with narcolepsy ⁄ cataplexy. Sleep, 2009,32: 137.
Mayer, G., Kesper, K., Ploch, T. et al. Quantification of tonic andphasic muscle activity in REM sleep behavior disorder. J. Clin.Neurophysiol., 2008, 25: 48–55.
Morrison, J. L., Sood, S., Liu, H. et al. Role of inhibitory amino acidsin control of hypoglossal motor outflow to genioglossus muscle innaturally sleeping rats. J. Physiol., 2003, 552: 975–991.
Nevsimalova, S., Prihodova, I., Kemlink, D., Lin, L. and Mignot, E.REM behavior disorder (RBD) can be one of the first symptoms ofchildhood narcolepsy. Sleep Med., 2007, 8: 784–786.
Parmelee, A. H. and Stern, E. Development of states in infants. In: C.D. Clement, D. P. Purpura and F. E. Mayer (Eds) Sleep and theMaturing Nervous System. Academic Press, New York, 1972: 199–228.
Parrino, L., Boselli, M., Spaggiari, M. C., Smerieri, A. and Terzano, M.G. Cyclic alternating pattern (CAP) in normal sleep: polysomno-graphic parameters in different age groups. Electroencephalogr.Clin. Neurophysiol., 1998, 107: 439–450.
Parrino, L., Smerieri, A., Rossi, M. and Terzano, M. G. Relationshipof slow and rapid EEG components of CAP to ASDA arousals innormal sleep. Sleep, 2001, 24: 881–885.
Rechtschaffen, A. and Kales, A. A Manual of Standardized Termi-nology, Techniques, and Scoring System for Sleep Stages ofHuman Subjects. Washington Public Health Service, US Govern-ment Printing Office, Washington, DC, 1968.
Schulte, F. J., Busse, C. and Eichhorn, W. Rapid eye movementsleep, motoneurone inhibition, and apneic spells in preterm infants.Pediatr. Res., 1977, 11: 709–713.
Sheldon, S. H. and Jacobsen, J. REM-sleep motor disorder inchildren. J. Child Neurol., 1998, 13: 257–260.
Stores, G. Rapid eye movement sleep behaviour disorder in childrenand adolescents. Dev. Med. Child Neurol., 2008, 50: 728–732.
Vendrame, M., Havaligi, N., Matadeen-Ali, C., Adams, R. andKothare, S. V. Narcolepsy in children: a single-center clinicalexperience. Pediatr. Neurol., 2008, 38: 314–320.
Yamuy, J., Fung, S. J., Xi, M. and Chase, M. H. State-dependentcontrol of lumbar motoneurons by the hypocretinergic system. Exp.Neurol., 2010, 221: 335–345.
Chin EMG amplitude across lifespan 263
� 2011 European Sleep Research Society