Quantification of Permeability Heterogeneity for Reservoir Uncertainty Quantification
City University of New York (CUNY) City University of New York (CUNY)
CUNY Academic Works CUNY Academic Works
Dissertations and Theses City College of New York
2018
A Quantification Analysis on Potential Use of Recuperated A Quantification Analysis on Potential Use of Recuperated
Regenerative Braking Energy from NYCT Subways into Charging Regenerative Braking Energy from NYCT Subways into Charging
Electric Buses Electric Buses
AHMED S. RAHMAN CUNY City College
How does access to this work benefit you? Let us know!
More information about this work at: https://academicworks.cuny.edu/cc_etds_theses/890
Discover additional works at: https://academicworks.cuny.edu
This work is made publicly available by the City University of New York (CUNY). Contact: [email protected]

______________________________________________________________________________________________
_______________________________________________________________________________________________
Department of Electrical Engineering
Grove School of Engineering
The City College of the City University of New York
New York, USA
A Quantification Analysis on Potential Use of Recuperated
Regenerative Braking Energy from NYCT Subways into
Charging Electric Buses
The City College of New York
Master’s Thesis in Electrical Power Engineering
AHMED S. RAHMAN

The City College of New York TOC-1
A Quantification Analysis on Potential Use of Recuperated
Regenerative Braking Energy from NYCT Subways into
Charging Electric Buses
Thesis
Submitted in partial fulfillment of the requirements for the degree
Master of Engineering, Electrical Engineering
At
The City College of the City University of New York
By
Ahmed S. Rahman
December 2018
Approved:
Prof. Ahmed Mohamed, Thesis Advisor
Department of Electrical Engineering
Prof. Roger Dorsinville, Chairman
Department of Electrical Engineering
The City College of New York TOC-2
ABSTRACT
The New York Metropolitan Transportation Authority (MTA) is one of the biggest consumers of
electricity in east coast of the United States. According to a report published by Dayton T.
Brown in 2013, MTA consumes approximately 2150 GWh electrical energy per year for traction
power, where the New York City Transit (NYCT) alone is a consumer of about 80% of the total
annual MTA energy consumption. This continuous high demand for electricity from a single
organization opens research opportunities to search for alternative ways to reduce the needs.
NYCT Subways has an existing total rolling stock of 6,418 train cars where more than half of
these existing cars have and all future cars will have the capability of regenerating energy while
braking. This huge rolling stock operating in a 24/7 active revenue service environment holds
tremendous potential to reduce energy demand by proper capture and use of regenerative
energy from braking trains.
In New York city, bus operations play a vital role in public transportation. NYCT & MTA Bus
have a joint fleet of 5700+ buses providing transportation services to the city by continuously
operating on 238 local, 13 select bus service and 74 express bus routes within the five boroughs.
Currently, this huge fleet has a combination of Compressed Natural Gas (CNG) buses, diesel
and hybrid diesel buses. In 2014, the MTA released a total of .27 pounds of carbon dioxide
(CO2) gases per passenger mile. Even though on a per passenger-mile basis, emissions from
single occupancy vehicles are up to five times higher than the per-passenger mile emissions of
mass transit, MTA is making efforts to reduce this emission to support environmental
sustainability. An announcement made by MTA in January 2018 revealed MTA’s plan to
gradually transition its large bus fleet into zero emission electric buses. To start with, MTA has
launched a pilot program to operate 10 all-electric buses in some of the busiest streets of NYC.
This gradual transition and future addition of new all electric buses will increase energy
demands and will need a charging infrastructure. This infrastructure could be established for
assuming the total demand or could be shared with other existing installations. The use of
existing railway electrical infrastructure to provide electrical energy to charge Electric buses
may provide many benefits.
This paper explores the huge potential of using regenerated energy from braking trains to
charge electric buses in context of NYCT Subways and Buses. NYCT subways and bus
The City College of New York TOC-3
operations were studied, existing train rolling stock profiles and new-all electric bus profiles
were examined. A quantification method was developed to generate close estimation of energy
availability reproduced through regenerative braking for 24-hour time cycles at targeted
subway station locations considering NYCT’s current operational procedures. An
approximation of energy demands for current all-electric buses was estimated. Two potential
demographic locations within MTA operational boundaries were selected for this analysis. An
overall quantification analysis was performed to show the huge potential of electrical energy
availability possible through regenerative braking and it was proven that this available energy
would be enough to support electric bus charging demands.
Thesis Final Table of Contents
The City College of New York TOC-4
TABLE OF CONTENTS
1.0 INTRODUCTION ............................................................................................ 1-8
1.1 Background ........................................................................................................ 1-8
1.2 Objectives ......................................................................................................... 1-10
2.0 MTA NEW YORK CITY TRANSIT INFRASTRUCTURE ............................ 2-11
2.1 MTA New York City Transit ......................................................................... 2-11
2.2 NYC Subways .................................................................................................. 2-11
2.3 Subway Lines & Services ............................................................................... 2-12
2.4 Rolling Stock .................................................................................................... 2-16
2.5 New Technology Trains ................................................................................. 2-17
2.6 NYCT Buses ..................................................................................................... 2-24
2.7 NYCT Bus Fleet ............................................................................................... 2-24
3.0 RECUPERATION OF REGENERATIVE BRAKING ENERGY .................... 3-25
3.1 Train Timetable Optimization ....................................................................... 3-25
3.2 Energy Storage Systems (ESS) ....................................................................... 3-26
3.2.1 Battery Storage ................................................................................. 3-27
3.2.2 Super Capacitor ................................................................................ 3-28
3.2.3 Flywheel Energy Storage ................................................................ 3-28
3.3 Reversible Substation ..................................................................................... 3-30
4.0 BUS ENERGY REQUIREMENTS .................................................................. 4-31
4.1 MTA Electric Buses ......................................................................................... 4-31
4.2 Electric bus specifications .............................................................................. 4-31
4.3 Electric Bus Routes .......................................................................................... 4-33
4.3.1 Route B32 and B39 ........................................................................... 4-33
4.3.2 Electric Bus Routes M42 and M50 ................................................. 4-37
Thesis Final Table of Contents
The City College of New York TOC-5
4.4 Electric Bus energy requirements ................................................................. 4-38
5.0 ENERGY RECUPERATION AT NYCT SUBWAYS ...................................... 5-41
5.1 Recuperated Energy Estimation Method .................................................... 5-41
5.2 Area of Consideration .................................................................................... 5-42
5.2.1 Focus area 1 ....................................................................................... 5-42
5.2.2 Focus Area 2 ...................................................................................... 5-45
5.3 Recuperated Energy Quantification ............................................................. 5-46
5.3.1 Quantified Available Energy at Marcy Avenue Station ............. 5-46
5.3.2 Quantified Available Energy at Grand Central Terminal
Station ................................................................................................ 5-50
5.4 Findings ............................................................................................................ 5-52
6.0 GLOBAL BENCHMARKS ............................................................................. 6-53
6.1 Hedgehog Applications ................................................................................. 6-53
6.2 Train2Car Project in Spain ............................................................................. 6-54
7.0 CONCLUSION AND RECOMMENDATIONS ............................................ 7-55
7.1 Conclusion ....................................................................................................... 7-55
7.2 Recommended Future Work ......................................................................... 7-56
8.0 REFERENCES ................................................................................................ 8-58

Thesis Final Table of Contents
The City College of New York TOC-6
LIST OF TABLES
TABLE 2-1 :MTA NYCT SUBWAY LINES & SERVICES........................................................................... 2-13
TABLE 2-2: ROLLING STOCK SUMMARY LIST ........................................................................................ 2-17
TABLE 2-3: R142 & R142A CAR SUMMARY ........................................................................................... 2-19
TABLE 2-4: R188 CAR SUMMARY ........................................................................................................... 2-20
TABLE 2-5: R143 CAR SUMMARY ........................................................................................................... 2-21
TABLE 2-6: R160A & R160B CAR SUMMARY: ....................................................................................... 2-22
TABLE 2-7: R179 CAR SUMMARY ........................................................................................................... 2-23
TABLE 4-1: SPECIFICATIONS OF CATALYST E2 ...................................................................................... 4-32
TABLE 4-2: SPECIFICATION OF XCELSIOR-CHARGE .............................................................................. 4-33
TABLE 4-3: B32 BROOKLYN BOUND TIMETABLE .................................................................................... 4-35
TABLE 4-4: B32 QUEENS BOUND TIMETABLE ......................................................................................... 4-35
TABLE 4-5: FACTS & FIGURES OF ROUTE B32 ........................................................................................ 4-36
TABLE 4-6: FACTS & FIGURES OF ROUTE B39 ........................................................................................ 4-36
TABLE 4-7: FACTS & FIGURES OF ROUTE M 42 ...................................................................................... 4-37
TABLE 4-8: FACTS & FIGURES OF ROUTE M50 ...................................................................................... 4-37
TABLE 4-9: ELECTRIC BUS ENERGY PROFILES FOR ROUTE B32 & B39 .................................................. 4-39
TABLE 4-10: TOTAL ENERGY REQUIREMENT FOR ROUTES B32 & B39 ................................................. 4-39
TABLE 4-11: ELECTRIC BUS ENERGY PROFILES FOR M42 & M50 ROUTES............................................ 4-40
TABLE 4-12: TOTAL ENERGY REQUIREMENT FOR ROUTE M42 & M50 ................................................ 4-40
TABLE 5-1: TOTAL AVAILABLE ENERGY @ MARCY AVE ...................................................................... 5-49
TABLE 5-2: TOTAL AVAILABLE ENERGY @ GRAND CENTRAL TERMINAL 42ST ................................. 5-52

Thesis Final Table of Contents
The City College of New York TOC-7
LIST OF FIGURES
FIGURE 2-1: NYCT SUBWAY MAP ......................................................................................................... 2-15
FIGURE 3-1: TYPICAL COMPONENTS OF A FLYWHEEL ........................................................................... 3-29
FIGURE 3-2: BLOCK DIAGRAM OF A REVERSIBLE SUBSTATION ............................................................ 3-30
FIGURE 4-1: PROTERRA CATALYST E2 ................................................................................................... 4-32
FIGURE 4-2: NEW FLYER XCELSIOR-CHARGE ........................................................................................ 4-33
FIGURE 4-3: BUS ROUTE B32 & B39 ....................................................................................................... 4-34
FIGURE 4-4: BUS ROUTE M42 & M50 ..................................................................................................... 4-38
FIGURE 5-1: LOCATION OF BUS ROUTE B32 & B39 TERMINAL ............................................................ 5-43
FIGURE 5-2: ROUTE B32 & B39 TERMINAL AND MARCY AVE STATION PLOT .................................... 5-44
FIGURE 5-3: SUBSTATION NEAR WILLIAMSBURG BRIDGE .................................................................... 5-44
FIGURE 5-4: BUS MAP ROUTE M42 & M50 ............................................................................................ 5-45
FIGURE 5-5: MIDTOWN SUBSTATIONS NEAR BUS ROUTE M42 & M50 ................................................ 5-46
FIGURE 5-6: ROUTE J / Z SOUTH BOUND TIMETABLE WITH ENERGY MAPPING .................................. 5-48
FIGURE 5-7: ROUTE J / Z NORTH BOUND TIMETABLE WITH ENERGY MAPPING ................................. 5-48
FIGURE 5-8: ROUTE M SOUTH BOUND TIMETABLE WITH ENERGY MAPPING ...................................... 5-49
FIGURE 5-9: ROUTE 4 SOUTH BOUND TIMETABLE WITH ENERGY MAPPING ........................................ 5-51
FIGURE 5-10: ROUTE 4 NORTH BOUND TIMETABLE WITH ENERGY MAPPING ..................................... 5-51
FIGURE 6-1: ENERGY TRANSFER MODEL ............................................................................................... 6-54
FIGURE 6-2: TRAIN2CAR ENERGY TRANSFER BLOCK DIAGRAM ......................................................... 6-55

The City College of New York 1-8
1.0 INTRODUCTION
1.1 Background
Improving energy efficiency, reducing energy consumption and achieving emission free
transportation have become top priority challenges in transportation industries around the
world. Advanced research studies are being performed on all modes of transportation to reach
a carbon-emission free world for a better sustainable environment. Electric rail transportation
system and bus play a significant role when it comes to energy consumption. Rapid
development in urban rail transit has brought more demands for energy. Continuous need for
operational expansion in public transportation without increasing energy demands has initiated
continuous research on improving energy efficiency. In an urban railway network, trains
accelerate and brake very frequently. Trains consume a huge amount of energy when
accelerating and braking. When braking, the amount of energy consumed by train is mostly
dissipated as heat. Applying regenerative braking technology available in modern train cars has
a noticeable impact on reduction of energy consumption. However, the regenerative braking
energy cannot be returned to the traction network completely, and mostly gets wasted in the
braking resistor networks. As a result, the kinetic energy of the train is turned into heat [1].
Regenerative braking is based on the ability of an electric motor to act as a generator during
deceleration, whereby the kinetic energy stored in the rotor as mechanical inertia becomes a
prime mover, sending electric power back to the power supply when the train decelerates.
Today this approach requires electric train cars to interface with the third rail through a bi-
directional traction inverter.
Since urban railway systems mostly use DC-power as traction power for urban trains, the
regenerated energy is not always received well by the electric network and gets dissipated
through on-board resistor network as heat. This excessive heat may increase the temperature in
railway tunnels and may bring problems to train safety and security. A number of techniques
and strategies have been developed to maximize the capture and usage of regenerated energy
from braking. There are many research studies on how much energy could be recuperated from
train braking. A study performed on Quasi-Static decoupled load flow modelling of a power
supply network with AC-DC converters applied to light rail system show that up to 40% of the
energy applied to a train could be fed back to the third rail through regenerative braking [2].

The City College of New York 1-9
The New York Metropolitan Transportation Authority (MTA) consumes approximately 2150
GWh electrical energy per year for traction power (Dayton T. Brown in 2013), where the New
York City Transit (NYCT) alone is a consumer of about 80% of the total annual MTA energy
consumption [3]. This continuous high demand for electricity from a single organization opens
research opportunities to search for alternative ways to reduce the energy needs. NYCT
Subways has an existing total rolling stock of 6,418 train cars where more than half of these
existing cars have, and all future cars will have the capability of regenerating energy while
braking [4]. This huge rolling stock operating in a 24/7 active revenue service environment
holds tremendous potential to reduce energy demand by proper capture and use of
regenerative energy from braking trains. For significant energy savings to take place, it is
critical that, during train regeneration, at least one train is either accelerating or cruising in the
same section of the system to use the regenerated energy. In the absence of the other train or
trains, the regenerated energy will be used by the braking train auxiliary equipment, resulting
in minimal energy saving [5]. This massive demand of energy could be reduced with optimal
recuperation of energy from regenerative braking.
Electric buses offer zero-emission energy consumption, quiet operation and better acceleration
compared to traditional buses. battery electric bus is driven by an electric motor and obtains
energy from on-board batteries. They also eliminate infrastructure needed for a constant grid
connection and allow routes to be modified without infrastructure changes compared to a
Trolleybus. With MTA’s announcement made earlier in 2018 to move New York towards a
cleaner, greener future with the start of a three-year pilot program for 10 all-electric buses with
the goal of reducing carbon emissions and modernizing the MTA's bus fleet [6], it has opened
new research areas. MTA has a vision to gradually transition its large bus fleet consisting of
5,700+ buses into zero emission all-electric buses in near future [7]. These MTA NYCT Subways
and bus statistics have influenced to perform a quantitative analysis on the feasibility of this
huge potential to use regenerated energy from braking trains to charge electric buses.
The City College of New York 1-10
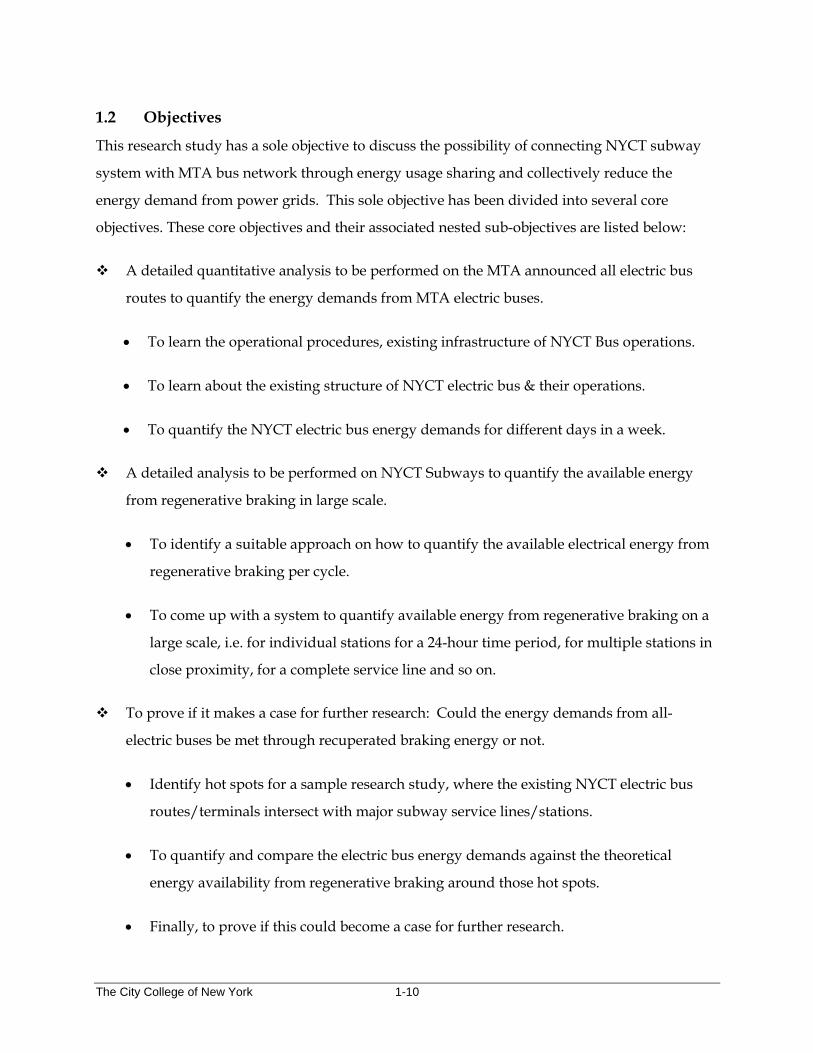
1.2 Objectives
This research study has a sole objective to discuss the possibility of connecting NYCT subway
system with MTA bus network through energy usage sharing and collectively reduce the
energy demand from power grids. This sole objective has been divided into several core
objectives. These core objectives and their associated nested sub-objectives are listed below:
❖ A detailed quantitative analysis to be performed on the MTA announced all electric bus
routes to quantify the energy demands from MTA electric buses.
• To learn the operational procedures, existing infrastructure of NYCT Bus operations.
• To learn about the existing structure of NYCT electric bus & their operations.
• To quantify the NYCT electric bus energy demands for different days in a week.
❖ A detailed analysis to be performed on NYCT Subways to quantify the available energy
from regenerative braking in large scale.
• To identify a suitable approach on how to quantify the available electrical energy from
regenerative braking per cycle.
• To come up with a system to quantify available energy from regenerative braking on a
large scale, i.e. for individual stations for a 24-hour time period, for multiple stations in
close proximity, for a complete service line and so on.
❖ To prove if it makes a case for further research: Could the energy demands from all-
electric buses be met through recuperated braking energy or not.
• Identify hot spots for a sample research study, where the existing NYCT electric bus
routes/terminals intersect with major subway service lines/stations.
• To quantify and compare the electric bus energy demands against the theoretical
energy availability from regenerative braking around those hot spots.
• Finally, to prove if this could become a case for further research.
The City College of New York 2-11
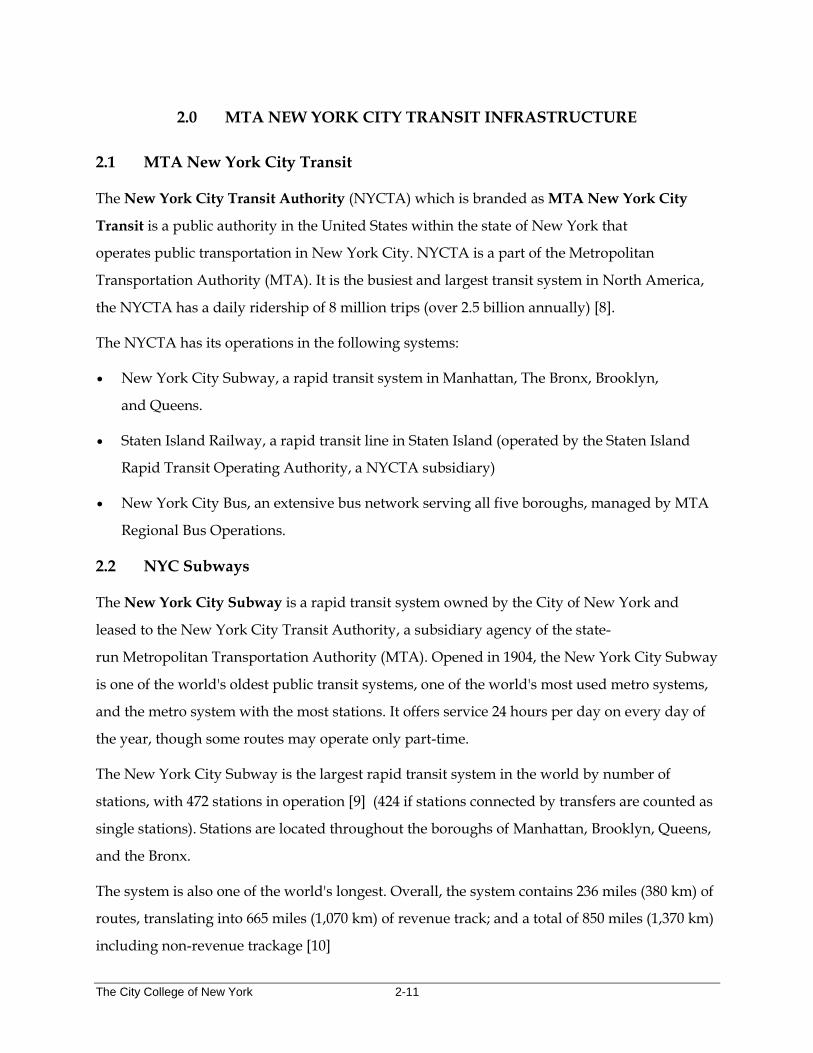
2.0 MTA NEW YORK CITY TRANSIT INFRASTRUCTURE
2.1 MTA New York City Transit
The New York City Transit Authority (NYCTA) which is branded as MTA New York City
Transit is a public authority in the United States within the state of New York that
operates public transportation in New York City. NYCTA is a part of the Metropolitan
Transportation Authority (MTA). It is the busiest and largest transit system in North America,
the NYCTA has a daily ridership of 8 million trips (over 2.5 billion annually) [8].
The NYCTA has its operations in the following systems:
• New York City Subway, a rapid transit system in Manhattan, The Bronx, Brooklyn,
and Queens.
• Staten Island Railway, a rapid transit line in Staten Island (operated by the Staten Island
Rapid Transit Operating Authority, a NYCTA subsidiary)
• New York City Bus, an extensive bus network serving all five boroughs, managed by MTA
Regional Bus Operations.
2.2 NYC Subways
The New York City Subway is a rapid transit system owned by the City of New York and
leased to the New York City Transit Authority, a subsidiary agency of the state-
run Metropolitan Transportation Authority (MTA). Opened in 1904, the New York City Subway
is one of the world's oldest public transit systems, one of the world's most used metro systems,
and the metro system with the most stations. It offers service 24 hours per day on every day of
the year, though some routes may operate only part-time.
The New York City Subway is the largest rapid transit system in the world by number of
stations, with 472 stations in operation [9] (424 if stations connected by transfers are counted as
single stations). Stations are located throughout the boroughs of Manhattan, Brooklyn, Queens,
and the Bronx.
The system is also one of the world's longest. Overall, the system contains 236 miles (380 km) of
routes, translating into 665 miles (1,070 km) of revenue track; and a total of 850 miles (1,370 km)
including non-revenue trackage [10]
The City College of New York 2-12
By the time the first subway opened in 1904, the lines had been consolidated into two privately
owned systems, the Brooklyn Rapid Transit Company (BRT, later Brooklyn–Manhattan Transit
Corporation, BMT) and the Interborough Rapid Transit Company (IRT). The city built most of
the lines and leased them to the companies [11]. The first line of the city-owned and operated
Independent Subway System (IND) opened in 1932 [12].; this system was intended to compete
with the private systems and allow some of the elevated railways to be torn down, but stayed
within the core of the City due to its small startup capital. This required it to be run 'at cost',
necessitating fares up to double the five-cent fare popular at the time [13]
In 1940, the city bought the two private systems. Some elevated lines ceased service
immediately while others closed soon after. Integration was slow, but several connections were
built between the IND and BMT; [14] these now operate as one division called the B Division.
Since the IRT tunnels, sharper curves, and stations are too small and therefore cannot
accommodate B Division cars, the IRT remains its own division, the A Division. However, many
passenger transfers between stations of all three former companies have been created, allowing
the entire network to be treated as a single unit. [15]
During the late-1940s, the system recorded high ridership, and on December 23, 1946, the
system-wide record of 8,872,249 fares was set [16]
By annual ridership, the New York City Subway is the busiest rapid transit rail system in both
the Western Hemisphere and the Western world, as well as the eighth busiest rapid transit rail
system in the world; only the metro (subway) systems
in Beijing, Shanghai, Seoul, Guangzhou, Tokyo, Moscow, and Hong Kong record higher annual
ridership.
2.3 Subway Lines & Services
In New York City, the rapid transit system, known as NYC Subway has 27 train services,
including three short shuttle services. There are two different terminologies used when referred
to NYC subways. The “Line” and the “Service” also known as the “Route”. In many rapid
transit systems all around the world lines and routes/services are often used interchangeably.
However, in New York City these terminologies can’t be used alternatively for quite justified
reasons. The term "line" describes the physical railroad track or series of physically laid up
tracks that one/multiple train "routes" use on their way from one terminal to another. These
The City College of New York 2-13
lines are named mostly based on their demographics. Each section of the system is assigned a
unique line name that begins with its original division (IRT, BMT or IND). For example, the line
passing through Eighth Avenue is the “IND Eighth Avenue Line”, the line passing through
Lexington Avenue is “IRT Lexington Avenue Line” and so on. Thus, these lines have names.
On the other hand, the “Service” also known as “Route” has a letter or a number as it’s name,
such as “7”,”A” etc. Each service/route has a color and a local or express designation
representing the Manhattan trunk line of a particular service. A “Service” refers to the route that
a train takes across various lines. A service may operate along several lines and even along
different divisions. For example, the “F” service operates along the “IND Queens Boulevard
Line”, IND 63rd Street Line” as well as the “IND Sixth Avenue Line” and the “IND Culver
Line”. So, it is very important to understand the difference between “Lines” and “Routes” to
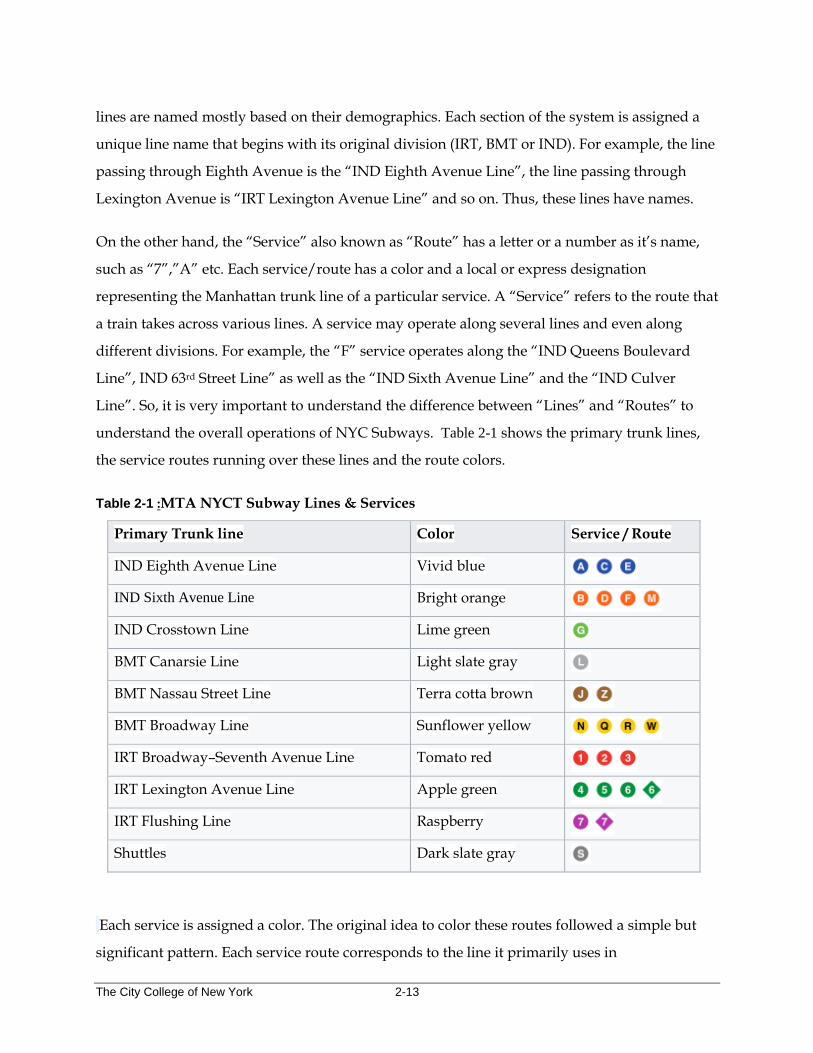
understand the overall operations of NYC Subways. Table 2-1 shows the primary trunk lines,
the service routes running over these lines and the route colors.
Table 2-1 :MTA NYCT Subway Lines & Services
Primary Trunk line Color Service / Route
IND Eighth Avenue Line Vivid blue
IND Sixth Avenue Line Bright orange
IND Crosstown Line Lime green
BMT Canarsie Line Light slate gray
BMT Nassau Street Line Terra cotta brown
BMT Broadway Line Sunflower yellow
IRT Broadway–Seventh Avenue Line Tomato red
IRT Lexington Avenue Line Apple green
IRT Flushing Line Raspberry
Shuttles Dark slate gray
Each service is assigned a color. The original idea to color these routes followed a simple but
significant pattern. Each service route corresponds to the line it primarily uses in
The City College of New York 2-14
Midtown Manhattan—defined as the trunk line. For example, from Figure 2-1 it can be observed
that, the service routes “B,D,F & M” all are of the same color ORANGE as they all use the same
IND Sixth Avenue Line in midtown Manhattan. Another example is service routes “4,5 & 6” all
colored GREEN use the same “IRT Lexington Avenue Line” in midtown Manhattan. Same
methodology was applied to most other services. Such as the RED service routes “1, 2 & 3” [17];
the BLUE colored services “A, C & E”; the YELLOW colored services “N, Q, R & W”. This
method was implemented back in 1979. There are some exceptions too. Such as the IND
Crosstown Line, which doesn't carry services to Manhattan, is colored light green; and
all shuttles are colored dark gray.
Many lines and stations have both express and local services. These lines have three or four
tracks. Normally, the outer two are used for local trains, while the inner one or two are used for
express trains. Stations served by express trains are typically major transfer points or
destinations. The color light green is exclusively assigned to the Crosstown Line route, which
operates entirely outside Manhattan, while the shuttles are all assigned dark gray. Among the
shuttles the Franklin Avenue Shuttle, and the Rockaway Park Shuttle operate out of Manhattan.
Rest of the lines, i.e. 22 lines pass through Manhattan [18]. The lines and services are not
referred to by color (e.g., Blue Line or Green Line) by native New Yorkers or by most New York
City residents, but out-of-towners and tourists often refer to the subway lines by color. Large
portions of the subway outside Manhattan are elevated, on embankments, or in open cuts, and
a few stretches of track run at ground level. In total, 40% of track is above ground, despite the
"subway" moniker.
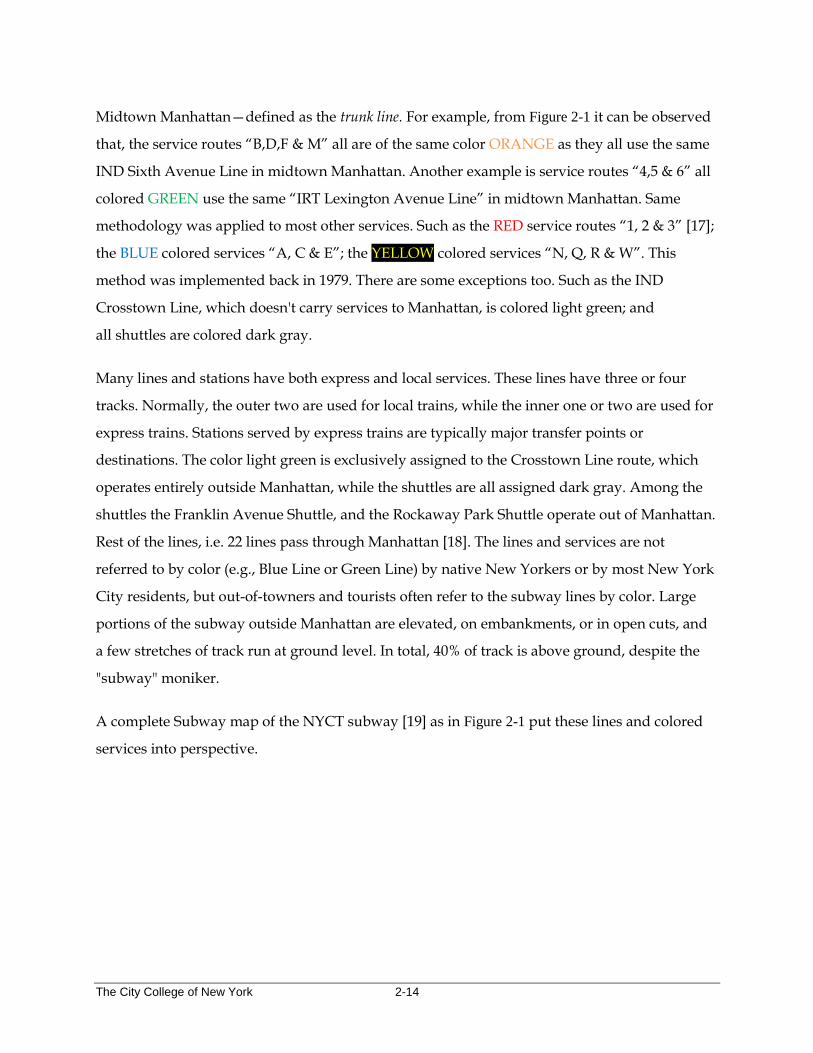
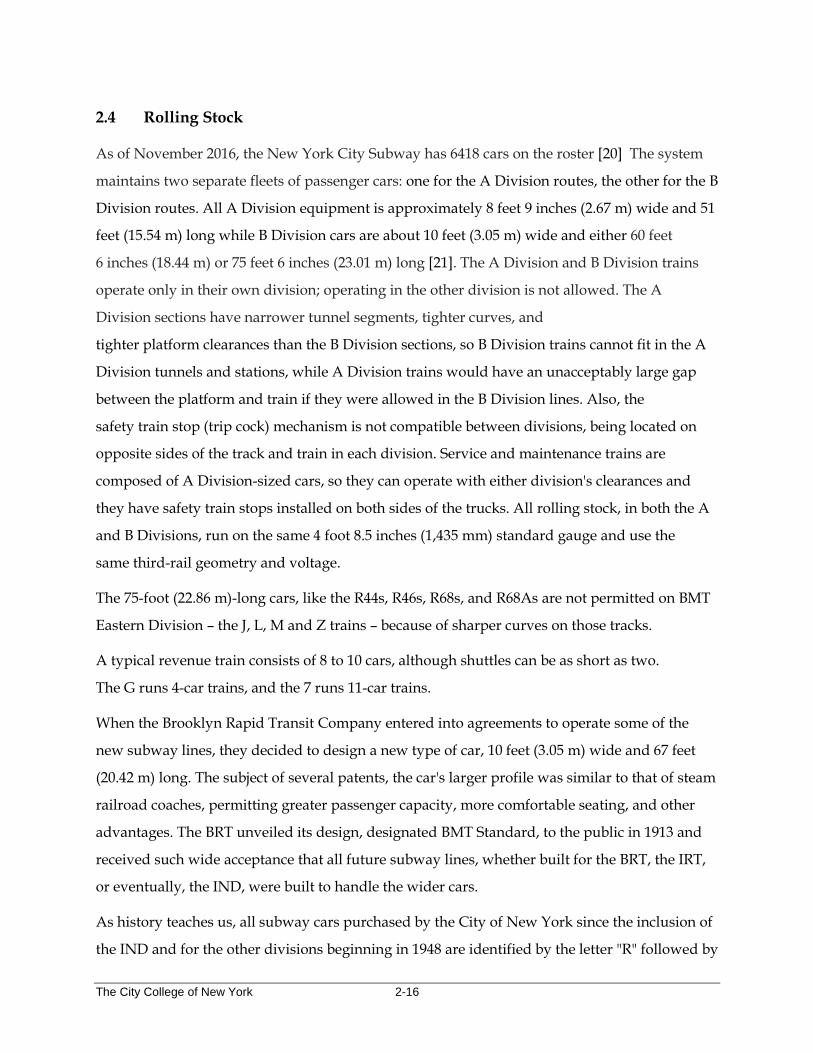
A complete Subway map of the NYCT subway [19] as in Figure 2-1 put these lines and colored
services into perspective.
The City College of New York 2-15
Figure 2-1: NYCT Subway Map
The City College of New York 2-16
2.4 Rolling Stock
As of November 2016, the New York City Subway has 6418 cars on the roster [20] The system
maintains two separate fleets of passenger cars: one for the A Division routes, the other for the B
Division routes. All A Division equipment is approximately 8 feet 9 inches (2.67 m) wide and 51
feet (15.54 m) long while B Division cars are about 10 feet (3.05 m) wide and either 60 feet
6 inches (18.44 m) or 75 feet 6 inches (23.01 m) long [21]. The A Division and B Division trains
operate only in their own division; operating in the other division is not allowed. The A
Division sections have narrower tunnel segments, tighter curves, and
tighter platform clearances than the B Division sections, so B Division trains cannot fit in the A
Division tunnels and stations, while A Division trains would have an unacceptably large gap
between the platform and train if they were allowed in the B Division lines. Also, the
safety train stop (trip cock) mechanism is not compatible between divisions, being located on
opposite sides of the track and train in each division. Service and maintenance trains are
composed of A Division-sized cars, so they can operate with either division's clearances and
they have safety train stops installed on both sides of the trucks. All rolling stock, in both the A
and B Divisions, run on the same 4 foot 8.5 inches (1,435 mm) standard gauge and use the
same third-rail geometry and voltage.
The 75-foot (22.86 m)-long cars, like the R44s, R46s, R68s, and R68As are not permitted on BMT
Eastern Division – the J, L, M and Z trains – because of sharper curves on those tracks.
A typical revenue train consists of 8 to 10 cars, although shuttles can be as short as two.
The G runs 4-car trains, and the 7 runs 11-car trains.
When the Brooklyn Rapid Transit Company entered into agreements to operate some of the
new subway lines, they decided to design a new type of car, 10 feet (3.05 m) wide and 67 feet
(20.42 m) long. The subject of several patents, the car's larger profile was similar to that of steam
railroad coaches, permitting greater passenger capacity, more comfortable seating, and other
advantages. The BRT unveiled its design, designated BMT Standard, to the public in 1913 and
received such wide acceptance that all future subway lines, whether built for the BRT, the IRT,
or eventually, the IND, were built to handle the wider cars.
As history teaches us, all subway cars purchased by the City of New York since the inclusion of
the IND and for the other divisions beginning in 1948 are identified by the letter "R" followed by
The City College of New York 2-17
a number; e.g.: R32. This number is the contract number under which the cars were purchased.
Cars with nearby contract numbers (e.g.: R143 through R160B) may be virtually identical,
simply being purchased under different contracts.
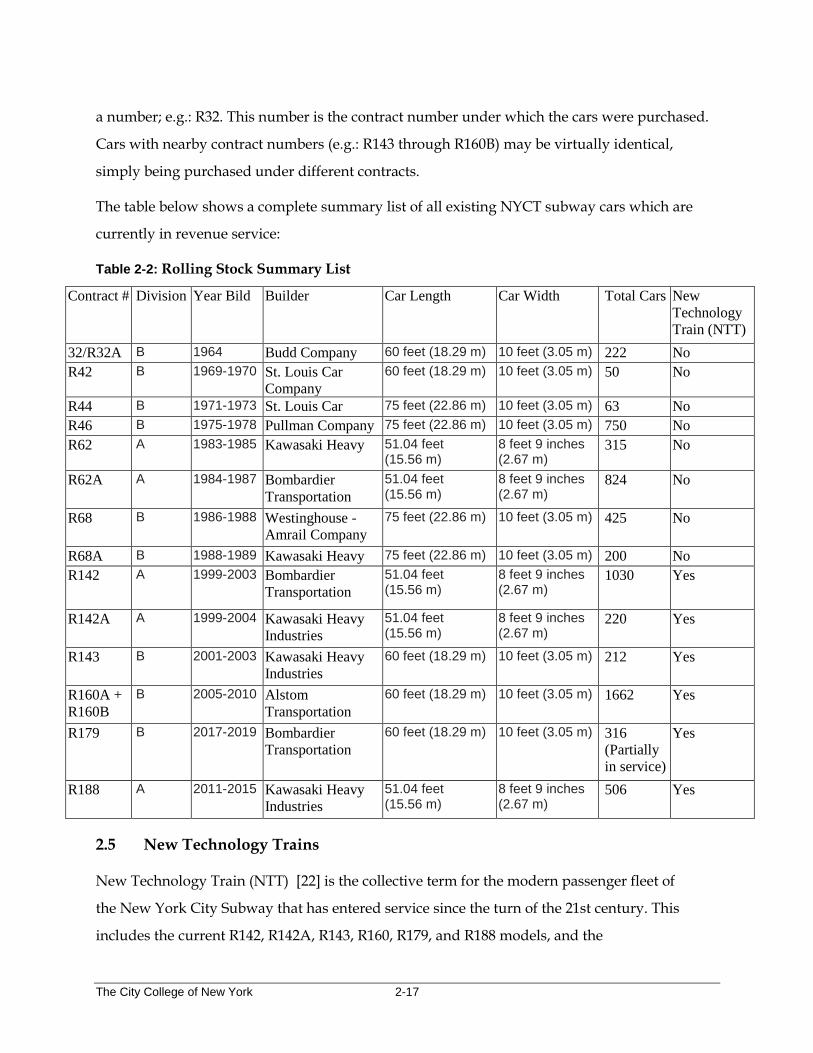
The table below shows a complete summary list of all existing NYCT subway cars which are
currently in revenue service:
Table 2-2: Rolling Stock Summary List
Contract # Division Year Bild Builder Car Length Car Width Total Cars New
Technology
Train (NTT)
32/R32A B 1964 Budd Company 60 feet (18.29 m) 10 feet (3.05 m) 222 No
R42 B 1969-1970 St. Louis Car
Company
60 feet (18.29 m) 10 feet (3.05 m) 50 No
R44 B 1971-1973 St. Louis Car 75 feet (22.86 m) 10 feet (3.05 m) 63 No
R46 B 1975-1978 Pullman Company 75 feet (22.86 m) 10 feet (3.05 m) 750 No
R62 A 1983-1985 Kawasaki Heavy 51.04 feet (15.56 m)
8 feet 9 inches (2.67 m)
315 No
R62A A 1984-1987 Bombardier
Transportation
51.04 feet (15.56 m)
8 feet 9 inches (2.67 m)
824 No
R68 B 1986-1988 Westinghouse -
Amrail Company
75 feet (22.86 m) 10 feet (3.05 m) 425 No
R68A B 1988-1989 Kawasaki Heavy 75 feet (22.86 m) 10 feet (3.05 m) 200 No
R142 A 1999-2003 Bombardier
Transportation
51.04 feet (15.56 m)
8 feet 9 inches (2.67 m)
1030 Yes
R142A A 1999-2004 Kawasaki Heavy
Industries
51.04 feet (15.56 m)
8 feet 9 inches (2.67 m)
220 Yes
R143 B 2001-2003 Kawasaki Heavy
Industries
60 feet (18.29 m) 10 feet (3.05 m) 212 Yes
R160A +
R160B
B 2005-2010 Alstom
Transportation
60 feet (18.29 m) 10 feet (3.05 m) 1662 Yes
R179 B 2017-2019 Bombardier
Transportation
60 feet (18.29 m) 10 feet (3.05 m) 316
(Partially
in service)
Yes
R188 A 2011-2015 Kawasaki Heavy
Industries
51.04 feet (15.56 m)
8 feet 9 inches (2.67 m)
506 Yes
2.5 New Technology Trains
New Technology Train (NTT) [22] is the collective term for the modern passenger fleet of
the New York City Subway that has entered service since the turn of the 21st century. This
includes the current R142, R142A, R143, R160, R179, and R188 models, and the
The City College of New York 2-18
planned R211 model. Two prototypes, the R110A and R110B, were used to test the features that
would be found on all NTT trains today. Sometimes referred to as New Millennium Trains, [23].
they are known for improvements in technology, energy efficiency, reliability, and comfort
along with advanced passenger information systems. Much of the engineering and construction
efforts for the fleet have been done by Kawasaki Heavy Industries and Bombardier
Transportation. Alstom also helped to build some of the trains, specifically the R160A.
All of the New Technology Trains have some common specific features. Which are discussed in
the following:
The NTT models utilize a common car design; stainless-steel car bodies with a black front fascia
on the "A" (cab) cars, open lexan-glass windows on non-cab ends allowing passengers to see
through to the next car, and electronic outer route signs, as opposed to the roll signs used by
previous models. [24] [25] Improvements to the conductors' interface include the addition of
speedometers as well as electronic consoles that monitor mechanical problems that may occur
on the train [25]. The cars feature a white fiberglass interior with blue-gray plastic bench seats
both to combat vandalism, along with bright fluorescent lighting and LED interior passenger
information signs.
The bench-style seats, designed with lumbar supports, also replaced the unpopular bucket-
style seats used on rolling stock built in the 1970s and '80s, which were both uncomfortable for
passengers and hard to clean. The trains utilize an airbag suspension (replacing conventional
springs) for a more comfortable ride, and employ regenerative braking which converts the
energy from brake application into electricity that is fed back into the third rail.
All NTT trains are capable of being equipped with communications-based train control (CBTC)
technology, which is installed in the "A" cars behind the train operator's cab. Currently, only the
R143s and R188s, as well as sixty-eight R160As, have been upgraded for automated service, on
the L and 7 routes.
A small description of all New Technology Trains (NTT) which are currently in revenue service
and are operated by the New York City Subway are given below;
• R142 & R142A: These models of NTT trains were built for the A Division. A summary table of
R142 & R142A Cars is in the Table 2-3 [26] [27],

The City College of New York 2-19
Table 2-3: R142 & R142A Car Summary
Summary: NTT Cars R142 & R142A
Car Type Car Manufacturer Years in Revenue
Service
Total Cars in
Service
Operating Division
Operating Service
Lines
R142 Bombardier 1999-Present 1,030
A
R142A Kawasaki 1999-Present 600
Total Cars 1,630
Specifications
Car Body Stainless steel; fiberglass blind end
bonnets R142
Height 11.89 feet
Width 8.60 feet
Length 51.33 feet
Traction System
R142: Alstom ONIX Propulsion
System
AC Traction Motors Model
4LCA1640A
R142A: Bombardier Propulsion
System
3-Phase AC Traction Motor Model
1508C
Braking System
Dynamic Braking Propulsion System R142: WABCO RT-5 Tread Brake
System
R142A: WABCO RT-96 Tread Brake
System
Doors Per Car 6
Platform Height 3.6458 feet R142A
Maximum Speed 55 mph
Power output 147.5 hp (110.0 kW) per motor axle;
2,065 hp (1,539.87 kW) per 5-car set
Electric System 600V DC Third Rail
Acceleration 2.5 mph/s
Deceleration 2.5 mph/s (In service) 3.2 mph/s (Emergency)
Weight
R142 A Car: 72,000 lbs B Car: 66,300 lbs R142A A Car: 73,300 lbs B Car: 67,800 lbs
The City College of New York 2-20
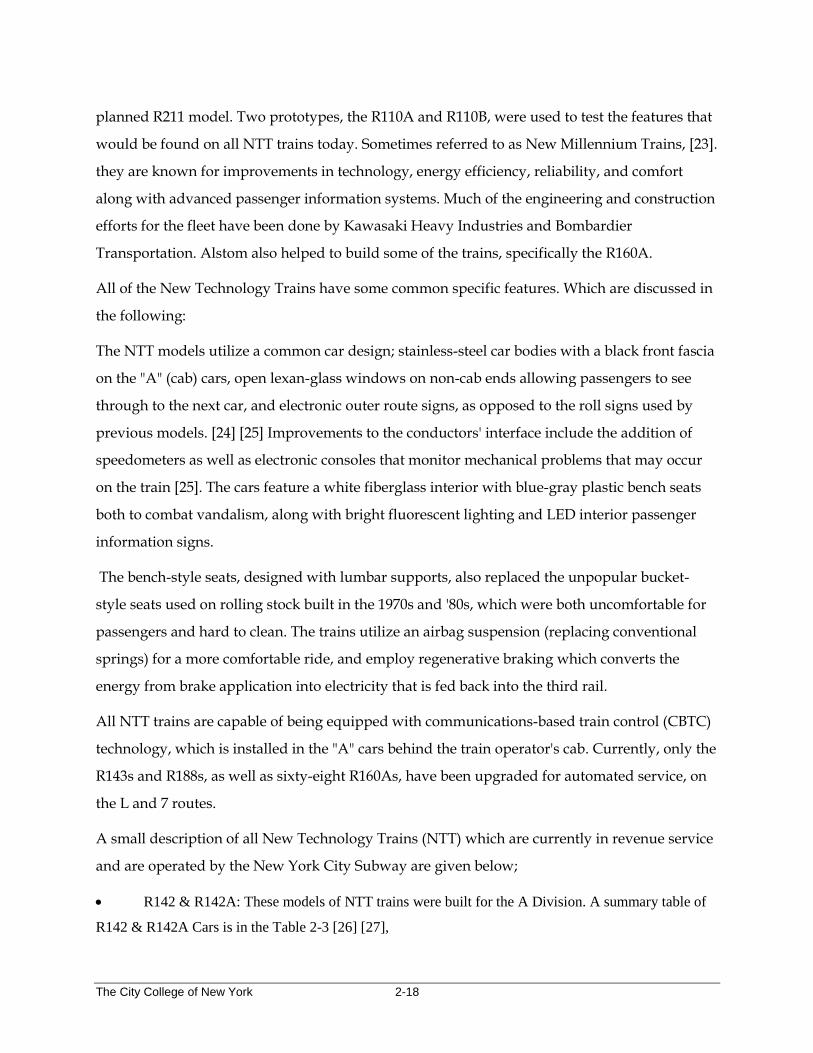
• R188: – Built by the Kawasaki Rail Car Company, this is the fifth model of NTT trains.
Used exclusively on the 7 route of the A Division, and thus is grouped in eleven-car trains. A
summary table of R188 Cars is in Table 2-4 [28] [29] [30],
Table 2-4: R188 Car Summary
Summary: NTT Cars R188
Car Type Car Manufacturer Years in Revenue
Service
Total Cars in
Service
Operating Division
Operating
Service Lines
R188 Kawasaki 2013-Present 506 A
Specifications
Car Body Stainless steel; fiberglass blind end
bonnets
R188
Height 11.89 feet
Width 8.60 feet
Length 51.33 feet
Traction System
Bombardier MITRAC propulsion
System,
3-Phase IGBT-VVVF two-level AC
Traction Motors Model 1508C, Pulse-
width modulation
Braking System
WABCO RT96 Dynamic braking
propulsion system; tread brake system
Doors Per Car 6
Platform Height 3.6458 feet
Maximum Speed 55 mph
Power output
150 hp (111.855 kW) per motor axle
4,500 hp (3,355.649 kW) per 11 car
train
Electric System 600V DC Third Rail
Acceleration 2.5 mph/s
Deceleration 2.5 mph/s (In service) 3.2 mph/s (Emergency)
Weight
"A" car: 73,332 pounds (33,263 kg)
"B" and "C" cars: 67,721 pounds
(30,718 kg)
The City College of New York 2-21
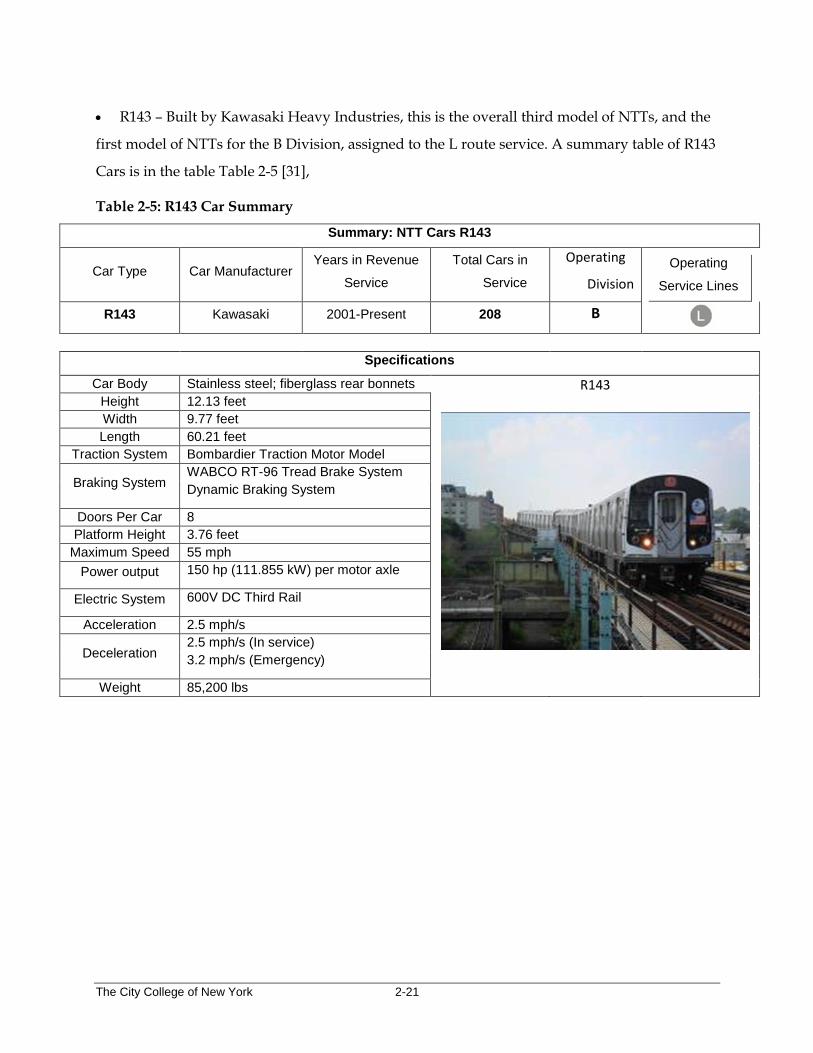
• R143 – Built by Kawasaki Heavy Industries, this is the overall third model of NTTs, and the
first model of NTTs for the B Division, assigned to the L route service. A summary table of R143
Cars is in the table Table 2-5 [31],
Table 2-5: R143 Car Summary
Summary: NTT Cars R143
Car Type Car Manufacturer Years in Revenue
Service
Total Cars in
Service
Operating
Division
Operating
Service Lines
R143 Kawasaki 2001-Present 208 B
Specifications
Car Body Stainless steel; fiberglass rear bonnets R143
R 143
Height 12.13 feet Width 9.77 feet Length 60.21 feet
Traction System Bombardier Traction Motor Model
1508C
Braking System WABCO RT-96 Tread Brake System Dynamic Braking System
Doors Per Car 8 Platform Height 3.76 feet
Maximum Speed 55 mph Power output 150 hp (111.855 kW) per motor axle
Electric System 600V DC Third Rail
Acceleration 2.5 mph/s
Deceleration 2.5 mph/s (In service) 3.2 mph/s (Emergency)
Weight 85,200 lbs

The City College of New York 2-22
• R160 – Built by Alstom and Kawasaki Heavy Industries, this is the fourth model of NTT
trains and has been built to be used by the B Division. There are two subtypes since these cars
were built by two different manufacturers. A summary table of R160A & R160B Cars is in the
Table 2-6 [32] [33].
Table 2-6: R160A & R160B Car Summary:
Summary: NTT Cars R160A & R160B
Car Type Car
Manufacturer
Years in Revenue
Service
Total Cars in
Service
Operating
Division
Operating
Service Lines
R160A (4 Car Sets) Alstom 2005-Present 372
B
R160A (5 Car Sets) Alstom 2005-Present 630
R160B Kawasaki 2005-Present 660
Total Cars 1,662
Specifications
Car Body Stainless steel; fiberglass rear bonnets R160A Height 12.13 feet
Width 9.77 feet
Length 60.21 feet
Traction System R160A: Alstom ONIX AC Traction Motor
R160B (8713-8842, 9103-9232, 9803-
9942): Alstom ONIX AC Traction Motor
R160B (8843-9102): Siemens AC
Traction Motor
Braking System Dynamic Braking Propulsion System
WABCO RT-5 Tread Brake System
R160B
Doors Per Car 8
Platform Height 3.76 feet
Maximum Speed 55 mph
Power output 147.5 hp (110 kW) (Alstom) or
161 hp (120 kW) (Siemens) per axle
All axles motorized
Electric System 600V DC Third Rail
Acceleration 2.5 mph/s
Deceleration 2.5 mph/s (In service)
3.2 mph/s (Emergency)
Weight 85,200 lbs
The City College of New York 2-23
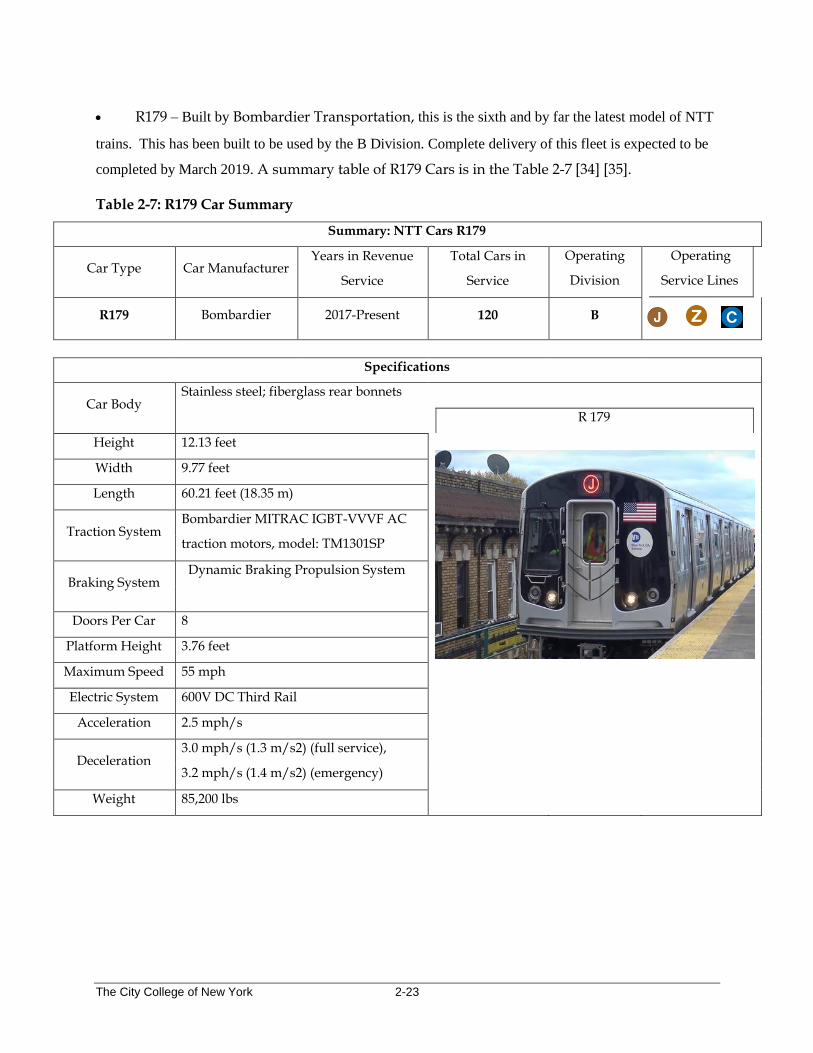
• R179 – Built by Bombardier Transportation, this is the sixth and by far the latest model of NTT
trains. This has been built to be used by the B Division. Complete delivery of this fleet is expected to be
completed by March 2019. A summary table of R179 Cars is in the Table 2-7 [34] [35].
Table 2-7: R179 Car Summary
Summary: NTT Cars R179
Car Type Car Manufacturer Years in Revenue
Service
Total Cars in
Service
Operating
Division
Operating
Service Lines
R179 Bombardier 2017-Present 120 B
Specifications
Car Body Stainless steel; fiberglass rear bonnets
R 179
Height 12.13 feet
Width 9.77 feet
Length 60.21 feet (18.35 m)
Traction System Bombardier MITRAC IGBT-VVVF AC
traction motors, model: TM1301SP
Braking System Dynamic Braking Propulsion System
Doors Per Car 8
Platform Height 3.76 feet
Maximum Speed 55 mph
Electric System 600V DC Third Rail
Acceleration 2.5 mph/s
Deceleration 3.0 mph/s (1.3 m/s2) (full service),
3.2 mph/s (1.4 m/s2) (emergency)
Weight 85,200 lbs

The City College of New York 2-24
2.6 NYCT Buses
MTA Regional Bus Operations bus fleet which includes MTA New York City Bus and MTA
Buses serve Manhattan, Queens, Brooklyn, the Bronx, and Staten Island. According to MTA [36]
Buses have a ridership of 2.4 million riders per average weekday 764 million annual in 2016.
MTA has a total bus fleet of 5,710 in 2016. These Buses operate in a total of 238 local Routes, 13
Select Bus Service, and 74 express bus routes in the five boroughs. Average number of weekday
trips recorded to be nearly 54,000 in 2016. These buses are housed, washed, and maintained at
28 depots [36].
2.7 NYCT Bus Fleet
The fleet of over 5,700 buses of various types and models for fixed-route service, making MTA
RBO's fleet the largest public bus fleet in the United States. The MTA also has over 2,000 vans
and cabs for ADA paratransit service, providing service in New York City, southwestern
Nassau County, and the city of Yonkers. All vehicles (except for paratransit cabs) are fully
accessible to persons with disabilities [37].
Fixed-route buses are dispatched from 28 garages (20 New York City Bus and 8 MTA Bus) and
one annex in New York City. Buses operating on clean or alternative fuels also make up a
significant portion of the fleet, particularly since the establishment of the MTA's "Clean Fuel
Bus" program in June 2000. Buses running compressed natural gas (CNG) were first tested in the
early 1990s, and mass-ordered beginning in 1999. Hybrid-electric buses, operating with a
combination of diesel and electric power, were introduced in September 1998, and mass-ordered
beginning in 2004. Within the current fleet are over 1,600 diesel-electric buses and over 700
buses powered by compressed natural gas, which make up over half of the total fleet [38]. This
is the largest fleet of either kind in the United States.
The MTA is moving New York towards a cleaner, greener future with the start of a three-year
pilot program for 10 all-electric buses with the goal of reducing emissions and modernizing the
MTA's bus fleet. Using lessons learned from the initial phase of the pilot, the MTA intends to
order an additional 60 all-electric buses. Timing of the larger order will be dictated by the buses'
performance during the initial phase of the pilot. The new zero-emission, all-electric buses
support environmental sustainability [39].
The City College of New York 3-25
3.0 RECUPERATION OF REGENERATIVE BRAKING ENERGY
At present, a very important topic in railway transportation research is on how to improve
energy efficiency. Any research on energy efficiency in urban railway transportation revolves
around researches in the exploitation of regenerative energy. Using regenerative braking energy
has a noticeable impact on reduction of energy consumption. Regenerative braking is based on
the ability of an electric motor to act as a generator during deceleration, whereby the kinetic
energy stored in the rotor as mechanical inertia becomes a prime mover, sending electric power
back to the power supply when the train decelerates. Today this approach requires electric train
cars to interface with the third rail through a bi-directional traction inverter. Fortunately, most
of the existing and all future NYCT trains have this capability (See section 2.1 for reference on
NYCT Rolling stock).
Since urban railway systems mostly use DC-power as traction power for urban trains, the
regenerated energy is not always received well by the electric network and gets dissipated
through on-board resistor network as heat. A number of techniques and strategies have been
developed to maximize the capture of regenerated energy from braking and to optimize the use
of it. Methods have been applied by means of train operation [40] [41], electrical operation [42],
improvements in rolling stocks to accommodate on-board energy storage [43] and so on.
Infrastructure modification to increase receptivity of regenerative energy by power grid has also
been thought of. Existing Infrastructure can be improved much by using reversible substations
[44] and by using wayside Energy Storage Systems (ESSs) [45], [46].
Some of the most important solutions to maximize the usage of regenerative energy are
discussed below:
3.1 Train Timetable Optimization
One of the most researched areas in the reuse of regenerative braking energy is Train Timetable
Optimization. This is an approach where the acceleration and braking events of two close
distanced trains are scheduled in such a way that the probability of these events to occur
simultaneously is significantly increased. As a result, some of the energy produced by the
decelerating train could be used by an accelerating one. Many scholars have performed many
studies and research to quantify this reusable energy. Some studies show that up to 14% [47] of
energy saving can be achieved through timetable optimization [48] [49]. Two major
The City College of New York 3-26
classifications have been developed for train timetable optimization according to the objectives
of the performed research and studies. These two classifications are minimizing peak power
demand and maximizing the utilization of regenerative braking energy [50].
Back in early 1960s when the research on timetable optimization was still in its early stages were
mostly focused on how to achieve peak power demand reduction. During that era, most
researches aimed to spread the acceleration time of trains across off-peak times to even the peak
demands. However, the time synchrony among train arrival departures into specific stations
were not targeted. [51], [52]. For example, in the research study [51], train scheduling has been
optimized to set limits to the number of train accelerations at a given time using genetic
algorithm. In the paper [53], the researchers showed potential possibility to reduce peak power
demand by coordinating movement of multiple trains through proposing a control algorithm.
Another approach was taken in another research paper [54]. Where, a dynamic programing
method was utilized to control train running times, thus, reducing peak power demand. The
second classification is more modern. Paper [55] [56] considers optimal underground timetable
design based on power flow for maximizing the use of regenerative-braking energy. Some other
research focused on determining the optimal time overlap between multiple trains [57] [58] [59].
There are ongoing researches on integrated optimization methods, which are based on the idea
to combine train timetable optimization and speed profile optimization. One of the
conventional approaches used to improve the energy efficiency of electric rail transit system
Speed profile optimization. In this approach, the speed profile of a single train is optimized
such that it consumes less energy during the trips between stations. To achieve the best running
time timetable optimization plays a vital role. The results from timetable optimization could be
fed as inputs into speed profile optimization procedures. Since, timetable and speed profile
issues are in synchrony to each other, methods applied to optimize one and results from one
could be used to evaluate the other. Paper [26] demonstrates a technique to achieve integrated
optimization. In that paper, the optimal dwell time at each station, and maximum train speed at
each section was determined. The results showed that 7.31% energy saving could be achieved
using that approach.
3.2 Energy Storage Systems (ESS)
Energy Storage Systems (ESS) is one of the most researched areas in energy efficiency concerns.
An ESS, if properly designed and implemented, would be able to capture maximum
The City College of New York 3-27
regenerated energy from a decelerating train. There are numerous benefits of using ESS in
electric trains depending on the method applied to install ESS into an electric train system. As
one benefit, the amount of energy consumed from the main grid could be reduced [60], [61],
[62]. ESS may reduce the peak power demand of a transportation system, which would not stop
at benefiting an electric rail transportation system only, it would also benefit the power utility
feeding the system. ESS may also benefit main grid by peak shaving [63]. If used, ESS could
capture regenerated energy from a braking train, therefore the need for onboard or wayside
dumping resistor network can be reduced significantly, resulting in cost reduction in heat waste
and ventilation system [64].
ESS can be used in two ways; onboard and wayside. Onboard ESS is usually located on the roof
of each train as accommodating the physical batteries within a train car could be a big challenge
specially when the car was not originally designed to do so. While, wayside ESS is located
outside, on trackside, within a nearby Electrical Distribution Room (EDR), within a nearby
station or anywhere suitable.
Selection of the most suitable storage technology is a key factor in maximizing an ESS
performance for a specified system. There are some important factors that must be considered
when designing an ESS. These factors include but are not limited to: the energy capacity and
specific energy, rate of charge and discharge, durability and life cycle [65].
The three most common and proven energy storage technologies that have been utilized in rail
transit systems are battery storage, supercapacitor and flywheel.
3.2.1 Battery Storage
The oldest and most dependable electric storage medium, battery, can be widely used in
different applications. In practice, a typical battery has multiple electrochemical cells connected
in parallel and/or series forming a single system unit. Each of these electrochemical cells
typically have two electrodes, referred to as anode and cathode, immersed in electrolytic
solutions. There are other types of battery formation too.
The working principle of a battery is very simple, effective and purely chemical. Reversible
chemical reactions between electrodes that creates a potential difference between them attracts
positive and negative charges depending on the chemical criteria. This potential difference
transforms energy reversibly from and to electrical and chemical forms [66], [67]. There are
various types of batteries depending on the material of their electrodes and electrolyte. Among
The City College of New York 3-28
those types, the most commonly used in rail transit systems are: Lead–acid (pbso4), Lithium-ion
(Li-ion), Nickel-metal hydride (Ni-MH) and sodium sulfur (Na-s).
3.2.2 Super Capacitor
The working principle of a super capacitor is basically the same for any form of super capacitor.
Theoretically a super capacitor is a type of electrochemical capacitors consisting of two porous
electrodes immersed in an electrolyte solution by applying voltage across the two electrodes,
the electrolyte solution is polarized [68]. Consequently, two thin layers of capacitive storage are
created near each electrode. There is no chemical reaction, and the energy is stored
electrostatically. Because of the porous electrode structure, the overall surface area of the
electrode is considerably large [68]. Therefore, the capacitance per unit volume of this type of
capacitor is greater than the conventional capacitors [69], [70], [71], [72] [73]. The type of
electrolyte and electrode chosen for a specific application plays a significant role in varying
electrical characteristics of super capacitor for that application [72].
The advantages of using super capacitors in energy storage is enormous. Some of the highest
advantage points of using super capacitors are, high energy efficiency (~95%) [68], large
charge/discharge current capacity, long lifecycle (>50000), high power density (>4000) and low
heating losses [70], [72], [74].
Despite all these advantages, there are a few major limitations in super capacitor technology.
Very low maximum operating voltage and high leakage current. Because of these two major
limitations, super capacitors can’t hold energy for long term [71]. Technological improvements
have brought us new Li-ion capacitor which suffer from lower leakage current and higher
energy densities than batteries and regular super capacitors [71].
3.2.3 Flywheel Energy Storage
Flywheel energy storage (FES) is an electromechanical energy storage system that works by
accelerating a rotor (flywheel) to a very high speed and maintaining the energy in the system as
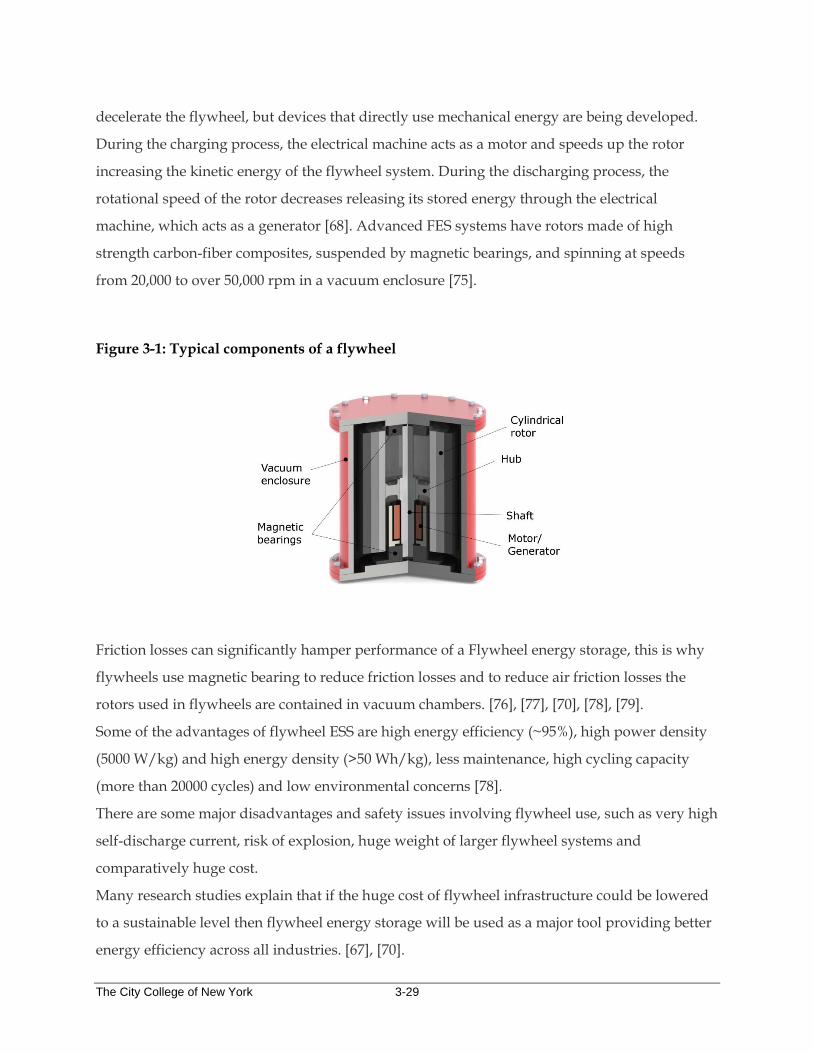
rotational energy. Figure 3-1 shows typical components of a flywheel. When energy is extracted
from the system, the flywheel's rotational speed is reduced as the consequence of the principle
of conservation of energy; adding energy to the system correspondingly results in an increase in
the speed of the flywheel. The amount of energy that can be stored or delivered depends on the
inertia and speed of the rotating mass. Most FES systems use electricity to accelerate and
The City College of New York 3-29
decelerate the flywheel, but devices that directly use mechanical energy are being developed.
During the charging process, the electrical machine acts as a motor and speeds up the rotor
increasing the kinetic energy of the flywheel system. During the discharging process, the
rotational speed of the rotor decreases releasing its stored energy through the electrical
machine, which acts as a generator [68]. Advanced FES systems have rotors made of high
strength carbon-fiber composites, suspended by magnetic bearings, and spinning at speeds
from 20,000 to over 50,000 rpm in a vacuum enclosure [75].
Figure 3-1: Typical components of a flywheel
Friction losses can significantly hamper performance of a Flywheel energy storage, this is why
flywheels use magnetic bearing to reduce friction losses and to reduce air friction losses the
rotors used in flywheels are contained in vacuum chambers. [76], [77], [70], [78], [79].
Some of the advantages of flywheel ESS are high energy efficiency (~95%), high power density
(5000 W/kg) and high energy density (>50 Wh/kg), less maintenance, high cycling capacity
(more than 20000 cycles) and low environmental concerns [78].
There are some major disadvantages and safety issues involving flywheel use, such as very high
self-discharge current, risk of explosion, huge weight of larger flywheel systems and
comparatively huge cost.
Many research studies explain that if the huge cost of flywheel infrastructure could be lowered
to a sustainable level then flywheel energy storage will be used as a major tool providing better
energy efficiency across all industries. [67], [70].
The City College of New York 3-30
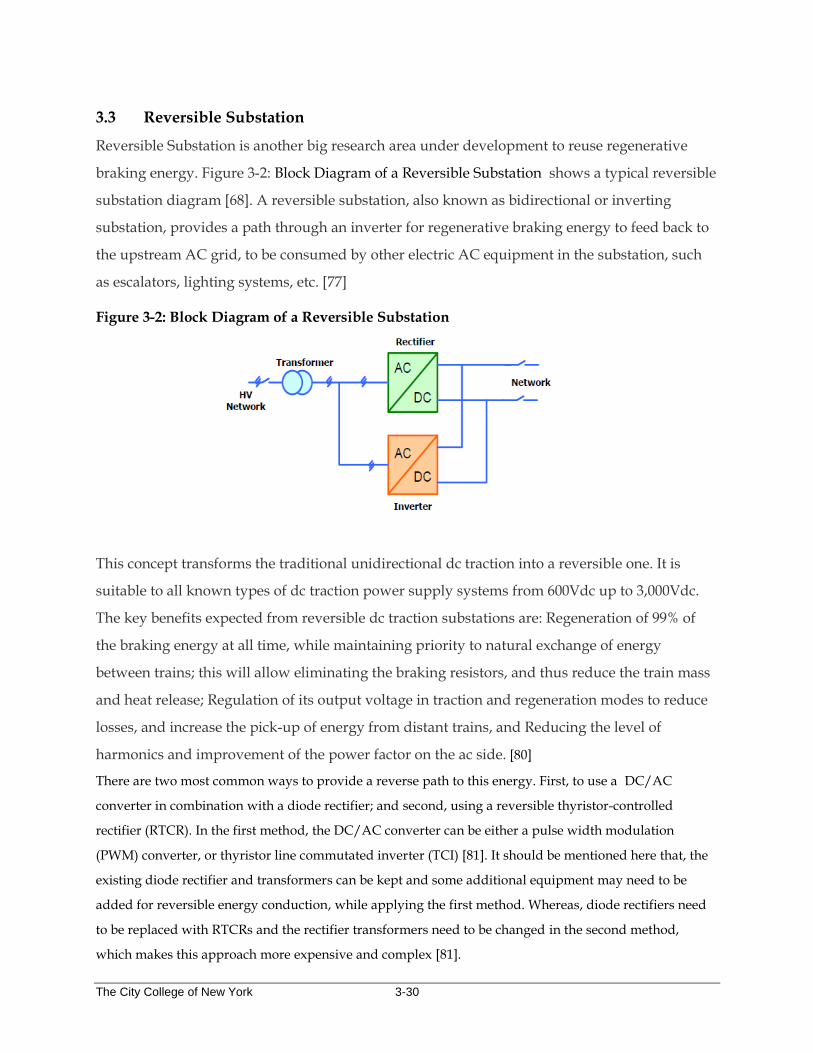
3.3 Reversible Substation
Reversible Substation is another big research area under development to reuse regenerative
braking energy. Figure 3-2: Block Diagram of a Reversible Substation shows a typical reversible
substation diagram [68]. A reversible substation, also known as bidirectional or inverting
substation, provides a path through an inverter for regenerative braking energy to feed back to
the upstream AC grid, to be consumed by other electric AC equipment in the substation, such
as escalators, lighting systems, etc. [77]
Figure 3-2: Block Diagram of a Reversible Substation
This concept transforms the traditional unidirectional dc traction into a reversible one. It is
suitable to all known types of dc traction power supply systems from 600Vdc up to 3,000Vdc.
The key benefits expected from reversible dc traction substations are: Regeneration of 99% of
the braking energy at all time, while maintaining priority to natural exchange of energy
between trains; this will allow eliminating the braking resistors, and thus reduce the train mass
and heat release; Regulation of its output voltage in traction and regeneration modes to reduce
losses, and increase the pick-up of energy from distant trains, and Reducing the level of
harmonics and improvement of the power factor on the ac side. [80]
There are two most common ways to provide a reverse path to this energy. First, to use a DC/AC
converter in combination with a diode rectifier; and second, using a reversible thyristor-controlled
rectifier (RTCR). In the first method, the DC/AC converter can be either a pulse width modulation
(PWM) converter, or thyristor line commutated inverter (TCI) [81]. It should be mentioned here that, the
existing diode rectifier and transformers can be kept and some additional equipment may need to be
added for reversible energy conduction, while applying the first method. Whereas, diode rectifiers need
to be replaced with RTCRs and the rectifier transformers need to be changed in the second method,
which makes this approach more expensive and complex [81].

The City College of New York 4-31
4.0 BUS ENERGY REQUIREMENTS
4.1 MTA Electric Buses
MTA conducted best practices study about systems across the US and around the world and
has confirmed two vendors as its first providers of all-electric buses. According to MTA [6]
these vendors are Proterra and New Flyer.
Proterra has leased five over-night charging electric buses which are operating on route B32 in
Brooklyn and Queens. Proterra is providing six depot charging stations, which are being
installed in the Grand Avenue Depot in Maspeth, Queens, where the buses are recharged
overnight or mid-day. This pilot project starts with one 'on-route' high power charging station,
which is located at Williamsburg Bridge Plaza in Brooklyn, and ideally this charger is to be used
to quickly recharge the buses without the need to return to the depot and in the process
enhancing the range of these buses operational capacity. Williamsburg Bridge Plaza is a large
connection of both MTA Buses and MTA NYC Buses, which serves nine routes in Brooklyn,
Manhattan and Queens.
The second vendor, New Flyer, has provided five buses that is operating on routes M42 and
M50 in midtown Manhattan. There are two depot charging stations, which are being installed in
the Michael J Quill depot, Manhattan, where the buses are recharged overnight or mid-day. The
first installment includes two 'on-route' high power charging stations. One of these fast
charging stations is being installed on East 41 Street and the second one at Pier 83, Circle Line
on West 43 Street.
The future goal of MTA is to learn from these fast power charging stations that if these ‘on-
route' chargers are / will be capable to eventually support 24 hours of operation without having
to return buses to the depot.
4.2 Electric bus specifications
The electric bus model that has been leased to MTA from the vendor Proterra is “Catalyst E2”
[82], [83]. Over the three-year lease, Proterra expects MTA to reduce 2,000 metric tons of
greenhouse gas emissions and save approximately $560,000 on maintenance and operating
costs. Table 4-1 shows the general specification of the selected model [82].

The City College of New York 4-32
Table 4-1: Specifications of Catalyst E2
Battery Capacity 440kWh
Brakes Front & rear air disk brakes
Chassis Carbon-fiber-reinforced composite body
Engine Permanent Magnet Traction Motor
Exterior Height 11 ft. 2 in.
Fuel Options Electric
Fuel Capacity 440kWh
GVWR 39,050 lbs.
Headroom Front axle 90 in.; Rear axle 74 in.
Technology DuoPower DriveTrain
Projected Altoona Efficiency (at SLW, without HVAC) in KWh/Mile
1.44
Nominal Range* Up to 305 Miles per charge
Length 40 ft.
Passenger Capacity 77
Seating Capacity 40
Transmission 2-speed Gearbox
Wheelbase 296 in.
Figure 4-1: Proterra Catalyst E2
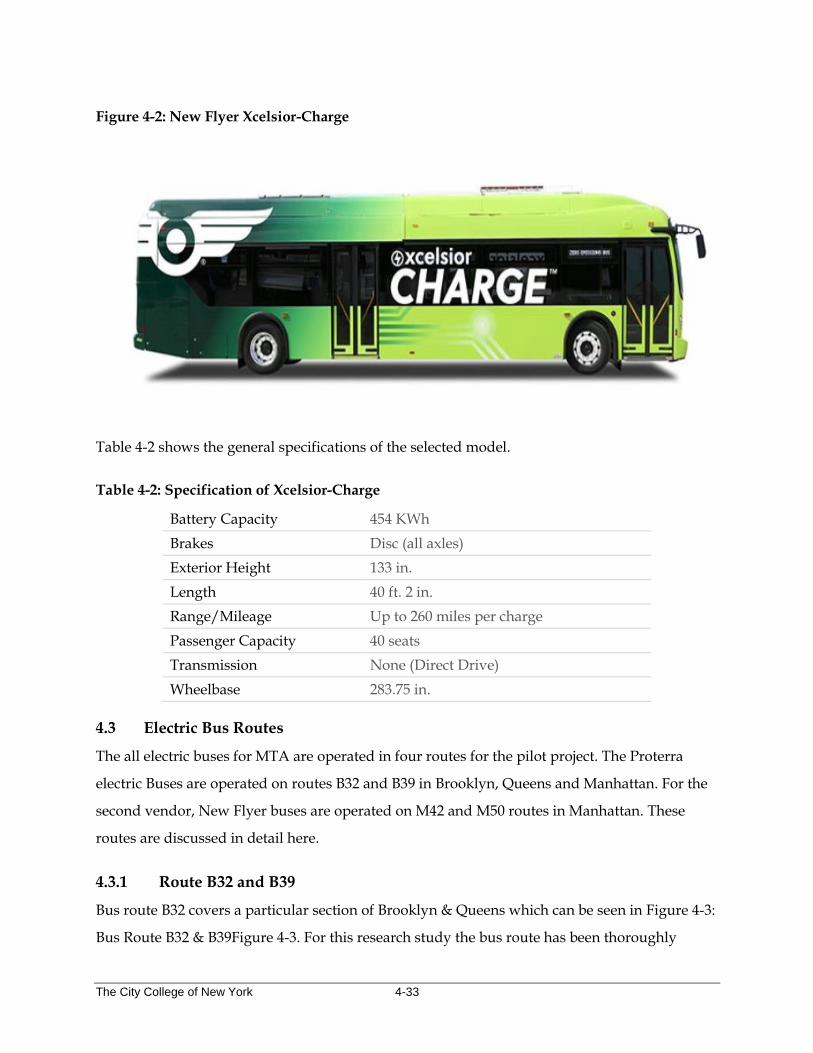
The second vendor for all-electric buses for MTA [84], New Flyer, has leased the bus model
“Xcelsior CHARGE” [85]. According to New flyer official product specs the bus specifications
can be summarized as in Table 4-2.
The City College of New York 4-33
Figure 4-2: New Flyer Xcelsior-Charge
Table 4-2 shows the general specifications of the selected model.
Table 4-2: Specification of Xcelsior-Charge
Battery Capacity 454 KWh
Brakes Disc (all axles)
Exterior Height 133 in.
Length 40 ft. 2 in.
Range/Mileage Up to 260 miles per charge
Passenger Capacity 40 seats
Transmission None (Direct Drive)
Wheelbase 283.75 in.
4.3 Electric Bus Routes
The all electric buses for MTA are operated in four routes for the pilot project. The Proterra
electric Buses are operated on routes B32 and B39 in Brooklyn, Queens and Manhattan. For the
second vendor, New Flyer buses are operated on M42 and M50 routes in Manhattan. These
routes are discussed in detail here.
4.3.1 Route B32 and B39
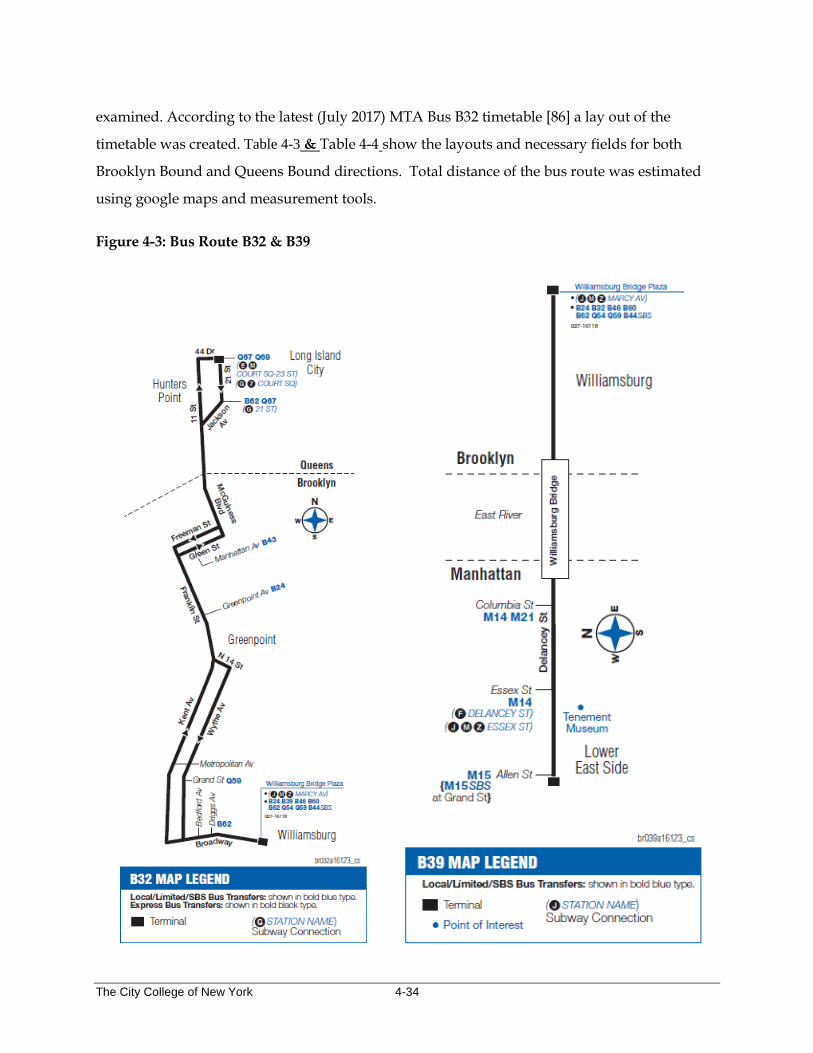
Bus route B32 covers a particular section of Brooklyn & Queens which can be seen in Figure 4-3:
Bus Route B32 & B39Figure 4-3. For this research study the bus route has been thoroughly
The City College of New York 4-34
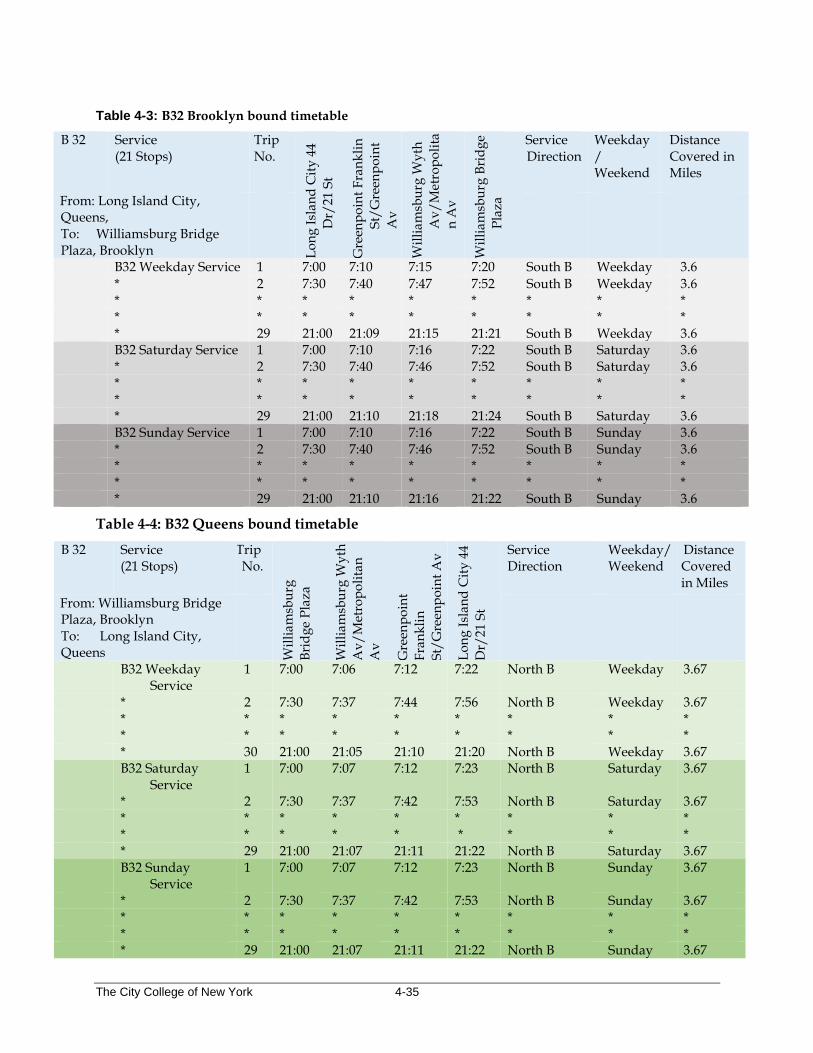
examined. According to the latest (July 2017) MTA Bus B32 timetable [86] a lay out of the
timetable was created. Table 4-3 & Table 4-4 show the layouts and necessary fields for both
Brooklyn Bound and Queens Bound directions. Total distance of the bus route was estimated
using google maps and measurement tools.
Figure 4-3: Bus Route B32 & B39
The City College of New York 4-35
Table 4-3: B32 Brooklyn bound timetable
B 32 Service (21 Stops)
Trip No.
Lo
ng
Isl
and
Cit
y 4
4
Dr/
21
St
Gre
enp
oin
t F
ran
kli
n
St/
Gre
enp
oin
t
Av
Wil
lia
msb
urg
Wy
th
Av
/M
etro
po
lita
n A
v
Wil
lia
msb
urg
Bri
dg
e
Pla
za
Service Direction
Weekday/ Weekend
Distance Covered in Miles
From: Long Island City, Queens, To: Williamsburg Bridge Plaza, Brooklyn
B32 Weekday Service 1 7:00 7:10 7:15 7:20 South B Weekday 3.6
* 2 7:30 7:40 7:47 7:52 South B Weekday 3.6 * * * * * * * * * * * * * * * * * * * 29 21:00 21:09 21:15 21:21 South B Weekday 3.6 B32 Saturday Service 1 7:00 7:10 7:16 7:22 South B Saturday 3.6 * 2 7:30 7:40 7:46 7:52 South B Saturday 3.6 * * * * * * * * * * * * * * * * * * * 29 21:00 21:10 21:18 21:24 South B Saturday 3.6 B32 Sunday Service 1 7:00 7:10 7:16 7:22 South B Sunday 3.6 * 2 7:30 7:40 7:46 7:52 South B Sunday 3.6 * * * * * * * * * * * * * * * * * * * 29 21:00 21:10 21:16 21:22 South B Sunday 3.6
Table 4-4: B32 Queens bound timetable
B 32 Service (21 Stops)
Trip No.
Wil
lia
msb
urg
Bri
dg
e P
laz
a
Wil
lia
msb
urg
Wy
th
Av
/M
etro
po
lita
n
Av
Gre
enp
oin
t
Fra
nk
lin
St/
Gre
enp
oin
t A
v
Lo
ng
Isl
and
Cit
y 4
4
Dr/
21
St
Service Direction
Weekday/ Weekend
Distance Covered in Miles
From: Williamsburg Bridge Plaza, Brooklyn To: Long Island City, Queens
B32 Weekday Service
1 7:00 7:06 7:12 7:22 North B Weekday 3.67
* 2 7:30 7:37 7:44 7:56 North B Weekday 3.67 * * * * * * * * * * * * * * * * * * * 30 21:00 21:05 21:10 21:20 North B Weekday 3.67 B32 Saturday
Service 1 7:00 7:07 7:12 7:23 North B Saturday 3.67
* 2 7:30 7:37 7:42 7:53 North B Saturday 3.67 * * * * * * * * * * * * * * * * * * * 29 21:00 21:07 21:11 21:22 North B Saturday 3.67 B32 Sunday
Service 1 7:00 7:07 7:12 7:23 North B Sunday 3.67
* 2 7:30 7:37 7:42 7:53 North B Sunday 3.67 * * * * * * * * * * * * * * * * * * * 29 21:00 21:07 21:11 21:22 North B Sunday 3.67
The City College of New York 4-36
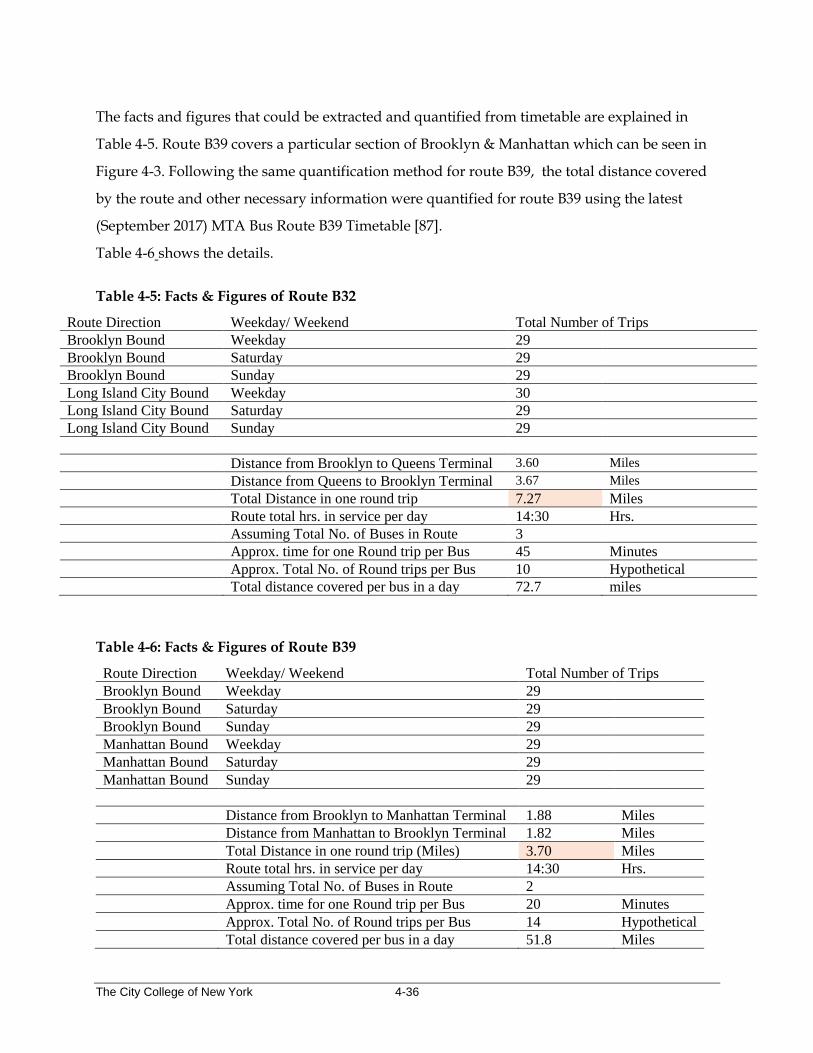
The facts and figures that could be extracted and quantified from timetable are explained in
Table 4-5. Route B39 covers a particular section of Brooklyn & Manhattan which can be seen in
Figure 4-3. Following the same quantification method for route B39, the total distance covered
by the route and other necessary information were quantified for route B39 using the latest
(September 2017) MTA Bus Route B39 Timetable [87].
Table 4-6 shows the details.
Table 4-5: Facts & Figures of Route B32
Route Direction Weekday/ Weekend Total Number of Trips
Brooklyn Bound Weekday 29
Brooklyn Bound Saturday 29
Brooklyn Bound Sunday 29
Long Island City Bound Weekday 30
Long Island City Bound Saturday 29
Long Island City Bound Sunday 29
Distance from Brooklyn to Queens Terminal 3.60 Miles
Distance from Queens to Brooklyn Terminal 3.67 Miles Total Distance in one round trip 7.27 Miles Route total hrs. in service per day 14:30 Hrs. Assuming Total No. of Buses in Route 3
Approx. time for one Round trip per Bus 45 Minutes Approx. Total No. of Round trips per Bus 10 Hypothetical Total distance covered per bus in a day 72.7 miles
Table 4-6: Facts & Figures of Route B39
Route Direction Weekday/ Weekend Total Number of Trips
Brooklyn Bound Weekday 29
Brooklyn Bound Saturday 29
Brooklyn Bound Sunday 29
Manhattan Bound Weekday 29
Manhattan Bound Saturday 29
Manhattan Bound Sunday 29
Distance from Brooklyn to Manhattan Terminal 1.88 Miles Distance from Manhattan to Brooklyn Terminal 1.82 Miles Total Distance in one round trip (Miles) 3.70 Miles Route total hrs. in service per day 14:30 Hrs. Assuming Total No. of Buses in Route 2
Approx. time for one Round trip per Bus 20 Minutes Approx. Total No. of Round trips per Bus 14 Hypothetical Total distance covered per bus in a day 51.8 Miles

The City College of New York 4-37
4.3.2 Electric Bus Routes M42 and M50
Bus route M42 covers a particular area in Manhattan which can be seen in Figure 4-4. For the
route M42, following the latest (September 2018) MTA Bus route M42 timetable [88] a lay out of
the timetable was created using the same method explained above for route B32. Total distance
of the bus route was estimated using google maps and measurement tools. The facts and figures
shown in Table 4-7 were extracted and quantified from timetable.
Table 4-7: Facts & Figures of Route M 42
Route Direction Weekday/ Weekend Total Number of Trips
To East Side Weekday 146
To East Side Saturday 98
To East Side Sunday 85
To Circle Line Weekday 143
To Circle Line Saturday 98
To Circle Line Sunday 85
Distance from East 41 St to West (Circle Line) Terminal 2.08 Miles Distance from West (Circle Line) to East 41 St Terminal 1.92 Miles
Total Distance in one round trip (Miles) 4.00 Miles Route total hrs. in service per day 24 Hrs. (Non-stop)
Assuming Total No. of Buses in Route 3
Approx. time for one Round trip per Bus = 55 Minutes
Approx. Total No. of Round trips per Bus = 15 Hypothetical
Total distance covered per bus in a day = 60 Miles
Following the same method, the
Table 4-8 shows the extracted and quantified information for route M50 using the latest (April
2018) MTA Bus Route M50 Timetable [89].
Table 4-8: Facts & Figures of Route M50
Route Direction Weekday/ Weekend Total Number of Trips
To E 49 St/ 1 Av Weekday 62
To E 49 St/ 1 Av Saturday 34
To E 49 St/ 1 Av Sunday 34
To W 42 St/ 12 Av Weekday 61
To W 42 St/ 12 Av Saturday 34
To W 42 St/ 12 Av Sunday 34
Distance from E49 St/ 1 Av to W42 St/ 12 Av Terminal 2.21 Miles Distance from W42 St/ 12 Av to E49 St/ 1 Av Terminal 2.39 Miles
Total Distance in one round trip (Miles) 4.60 Miles Route total hrs. in service per day 24 Hrs. (Non-stop)
The City College of New York 4-38
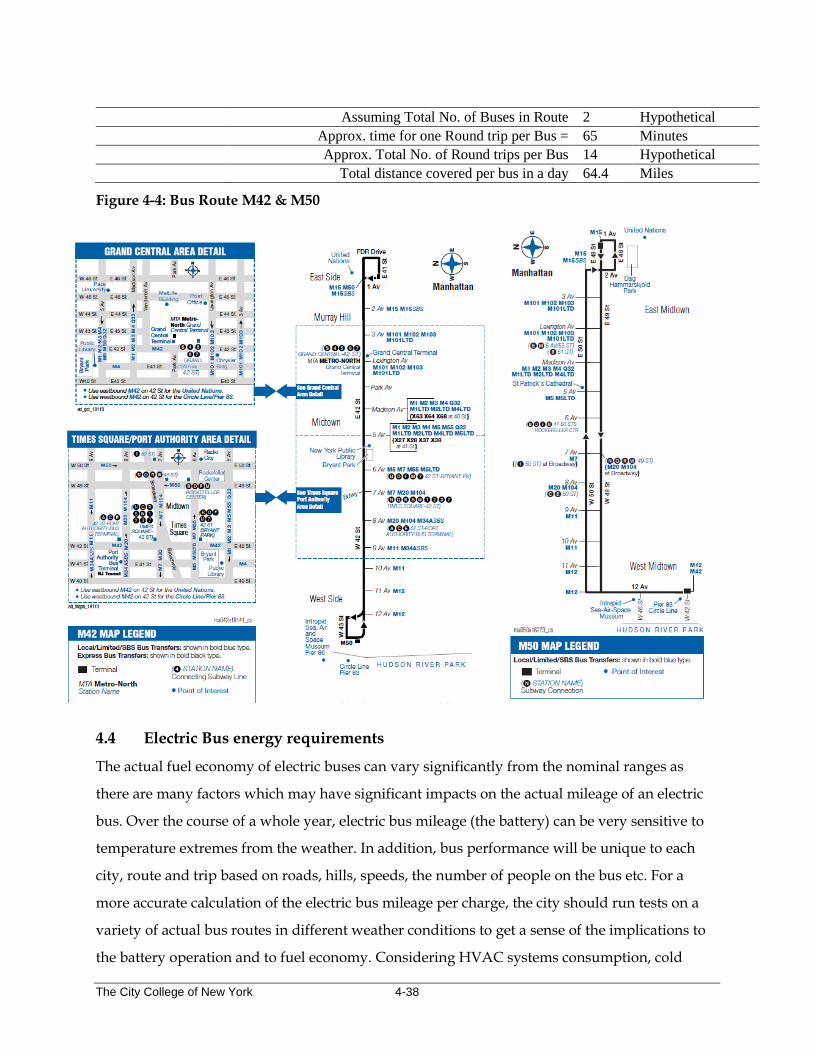
Assuming Total No. of Buses in Route 2 Hypothetical
Approx. time for one Round trip per Bus = 65 Minutes Approx. Total No. of Round trips per Bus 14 Hypothetical
Total distance covered per bus in a day 64.4 Miles
Figure 4-4: Bus Route M42 & M50
4.4 Electric Bus energy requirements
The actual fuel economy of electric buses can vary significantly from the nominal ranges as
there are many factors which may have significant impacts on the actual mileage of an electric
bus. Over the course of a whole year, electric bus mileage (the battery) can be very sensitive to
temperature extremes from the weather. In addition, bus performance will be unique to each
city, route and trip based on roads, hills, speeds, the number of people on the bus etc. For a
more accurate calculation of the electric bus mileage per charge, the city should run tests on a
variety of actual bus routes in different weather conditions to get a sense of the implications to
the battery operation and to fuel economy. Considering HVAC systems consumption, cold

The City College of New York 4-39
weather effects, high traffic areas and times, for this analysis purposes a hypothetical mileage of
120 Miles per charge has been considered. All energy demand calculations for electric buses
have been performed following this hypothetical number.
As per the Proterra all-electric bus specifications (See section 4.2 and Table 4-1) the Table 4-9
describes the route B32 & B39 bus energy profiles.
Table 4-9: Electric Bus energy profiles for Route B32 & B39
Battery capacity = 440 kWh
Projected efficiency = 1.44 kWh/Mile
Max Mileage = 305 Miles
Estimated Charging Time under 60 KW Plug in Charger 5.9 Hrs Overnight Charging
Estimated Charging Time under 125 KW Plug in Charger = 2.8 Hrs En-route Charging
Purchased Depot Charging Stations 60 KW = 5
Depot Charging Station Location = Grand Avenue Depot in Maspeth, Queens,
En Route High-Power Charging Station = 1
High Power Charging Station Location = Williamsburg Bridge Plaza in Brooklyn
The energy requirement for the electric buses in each route is described in Table 4-10.
Table 4-10: Total Energy Requirement for Routes B32 & B39
Energy Requirement for Route B32
Battery Capacity = 440 KWh
Total Distance in one round trip = 7.27 Miles
Hypothetical mileage in one full charge = 120 Miles
Hypothetical efficiency = 3.67 KWh/Mile
Total distance covered per bus = 72.7 miles every 24 Hrs
Assuming Total No. of existing electric Buses in Route = 3
Assuming Total No. of Buses needed for complete route = 3
every 24 Hrs
Hypothetical Energy requirement per bus = 266.57 KWh every 24 Hrs
Hypothetical Total Energy requirement (Existing Electric Buses) = 799.7 KWh every 24 Hrs
Hypothetical Total Energy requirement for all Buses = 799.7 KWh every 24 Hrs
Energy Requirement for Route B39
Battery Capacity = 440 KWh
Total Distance in one round trip = 3.7 Miles
Hypothetical mileage in one full charge = 120 Miles
Hypothetical efficiency = 3.67 KWh/Mile
Total distance covered per bus = 53.65 miles every 24 Hrs
Assuming Total No. of existing electric Buses in Route = 2

The City College of New York 4-40
Assuming Total No. of Buses needed for complete route = 2
every 24 Hrs
Hypothetical Energy requirement per bus = 196.72 KWh every 24 Hrs
Hypothetical Total Energy requirement (Existing Electric Buses) = 393.43 KWh every 24 Hrs
Hypothetical Total Energy requirement for all Buses = 393.43 KWh every 24 Hrs
Hypothetical Total Energy requirement for Route B32 & B39 = 1193.13 KWh Existing Electric Buses
Hypothetical Total Energy requirement for Route B32 & B39 = 1193.13 KWh For Complete Timetable
As per the New Flyer all-electric bus specifications (See section 4.2), the table Table 4-11
describes the route M42 & M50 bus energy [90] [91] profiles.
Table 4-11: Electric Bus energy profiles for M42 & M50 Routes
Battery capacity = 454 kWh
Projected efficiency = 2.06 kWh/Mile
Nominal Mileage = 216 Miles
Estimated Charging Time under average Plug in Charger =
3.9 Hrs Plug-in Charging
Estimated Charging Time under Fast Charger = Avg. 6 minutes Per hour On Route Charging
Purchased Depot Charging Stations 60 KW = 2
Depot Charging Station Locations = Michael J Quill depot, Manhattan
En Route High-Power Charging Station = 2
High Power Charging Station Location = 1) East 41 Street, 2) Pier 83, Circle Line on West 43 Street
The energy requirement for the electric buses in M42 &M50 route is quantified and is described
in Table 4-12.
Table 4-12: Total Energy Requirement for Route M42 & M50
Battery Capacity = 454 KWh
Total Distance in one round trip = 4 Miles
Hypothetical mileage in one full charge = 120 Miles
Hypothetical efficiency = 3.78 KWh/Mile
Total distance covered per bus = 60 miles every 24 Hrs
Assuming Total No. of existing electric Buses in Route = 3
Assuming Total No. of Buses needed for complete route = 10
every 24 Hrs
Hypothetical Energy requirement per bus = 227.00 KWh every 24 Hrs
Hypothetical Total Energy requirement (Existing Electric Buses) = 681 KWh every 24 Hrs
Hypothetical Total Energy requirement for all Buses = 2209.47 KWh every 24 Hrs
Battery Capacity = 454 KWh
Total Distance in one round trip = 4.6 Miles
Hypothetical mileage in one full charge = 120 Miles

The City College of New York 5-41
Hypothetical efficiency = 3.78 KWh/Mile
Total distance covered per bus = 64.4 miles every 24 Hrs
Assuming Total No. of existing electric Buses in Route = 2
Assuming Total No. of Buses needed for complete route = 5
every 24 Hrs
Hypothetical Energy requirement per bus = 243.65 KWh every 24 Hrs
Hypothetical Total Energy requirement (Existing Electric Buses) = 487.29 KWh every 24 Hrs
Hypothetical Total Energy requirement for all Buses = 1218.23 KWh every 24 Hrs
Hypothetical Total Energy requirement for Route M42 & M50 = 1168.29 KWh every 24 Hrs
Hypothetical Total Energy requirement for Route M42 & M50 = 3427.70 KWh every 24 Hrs
5.0 ENERGY RECUPERATION AT NYCT SUBWAYS
5.1 Recuperated Energy Estimation Method
An NYCT new technology train running on an IRT line consumes about 15-20 KWh during a
single acceleration cycle. The same train’s average peak demand is approximated to be around 4
MW. During braking about 78% [68] of that consumed acceleration energy is used by train.
Studies show that NYCT trains could regenerate about ~50% of the consumed energy while
braking [92]. Since trains take only about 20 seconds to brake, this high amount of energy
injected back to third rail is done in a very short period of time, at a very high power.
Regenerative energy can contribute to feeding auxiliary loads onboard the decelerating train.
However, this regeneration of approx. ~50% of consumed (during acceleration) energy would
only be true under ideal conditions, which exists only for short time intervals in a regular
operational day. The term “ideal condition” could be explained as a phenomenon when a
similar load (accelerating train) is present near a braking train, which can consume the
regenerated energy produced by the braking train before an overvoltage situation arises and the
overcurrent is dissipated as heat through the on-board resistor network. Since this ideal
condition phenomenon can’t be predicted throughout a day and is only coincidental, a better
approach must be taken to quantify regenerated energy. Introducing wayside energy storage
system (ESS) could bring this ideal condition for longer periods of time.
Studies show that, with proper design and deployment of wayside ESS this energy savings can
be increased to ~35% [92], since ideal conditions would be guaranteed for a very long duration
in a day. Therefore, wayside energy storage system has been considered for storing the
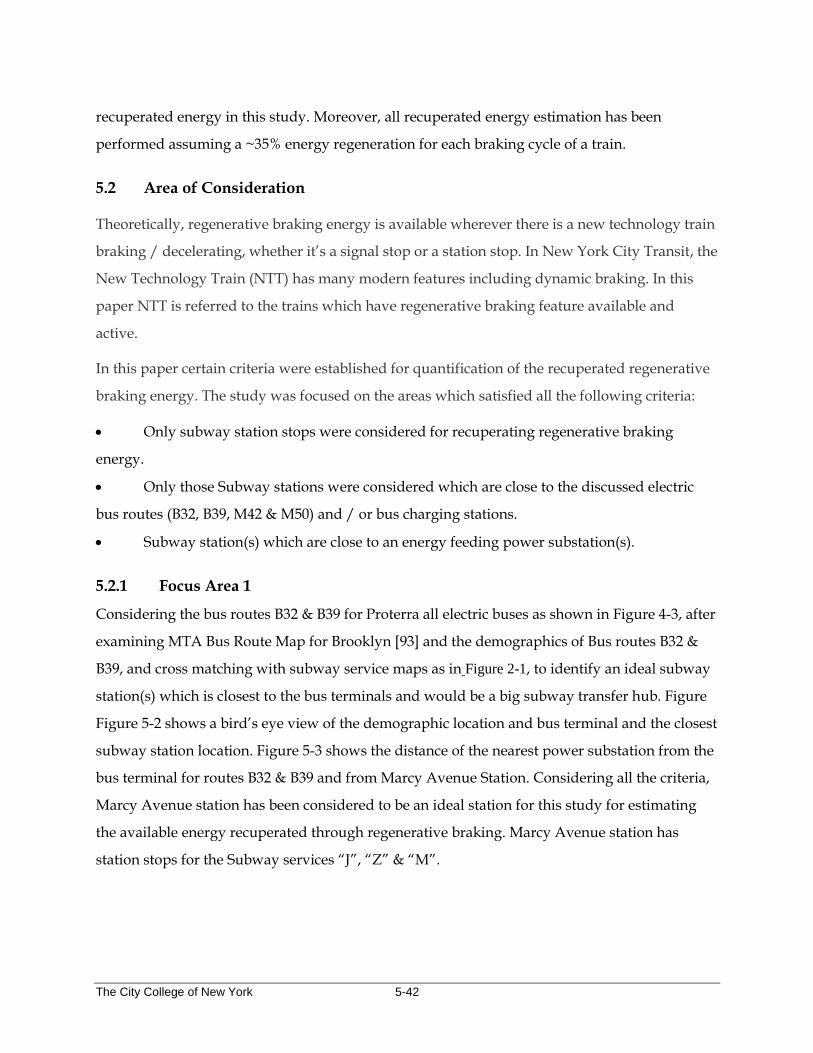
The City College of New York 5-42
recuperated energy in this study. Moreover, all recuperated energy estimation has been
performed assuming a ~35% energy regeneration for each braking cycle of a train.
5.2 Area of Consideration
Theoretically, regenerative braking energy is available wherever there is a new technology train
braking / decelerating, whether it’s a signal stop or a station stop. In New York City Transit, the
New Technology Train (NTT) has many modern features including dynamic braking. In this
paper NTT is referred to the trains which have regenerative braking feature available and
active.
In this paper certain criteria were established for quantification of the recuperated regenerative
braking energy. The study was focused on the areas which satisfied all the following criteria:
• Only subway station stops were considered for recuperating regenerative braking
energy.
• Only those Subway stations were considered which are close to the discussed electric
bus routes (B32, B39, M42 & M50) and / or bus charging stations.
• Subway station(s) which are close to an energy feeding power substation(s).
5.2.1 Focus Area 1
Considering the bus routes B32 & B39 for Proterra all electric buses as shown in Figure 4-3, after
examining MTA Bus Route Map for Brooklyn [93] and the demographics of Bus routes B32 &
B39, and cross matching with subway service maps as in Figure 2-1, to identify an ideal subway
station(s) which is closest to the bus terminals and would be a big subway transfer hub. Figure
Figure 5-2 shows a bird’s eye view of the demographic location and bus terminal and the closest
subway station location. Figure 5-3 shows the distance of the nearest power substation from the
bus terminal for routes B32 & B39 and from Marcy Avenue Station. Considering all the criteria,
Marcy Avenue station has been considered to be an ideal station for this study for estimating
the available energy recuperated through regenerative braking. Marcy Avenue station has
station stops for the Subway services “J”, “Z” & “M”.

The City College of New York 5-43
Figure 5-1: Location of Bus Route B32 & B39 Terminal
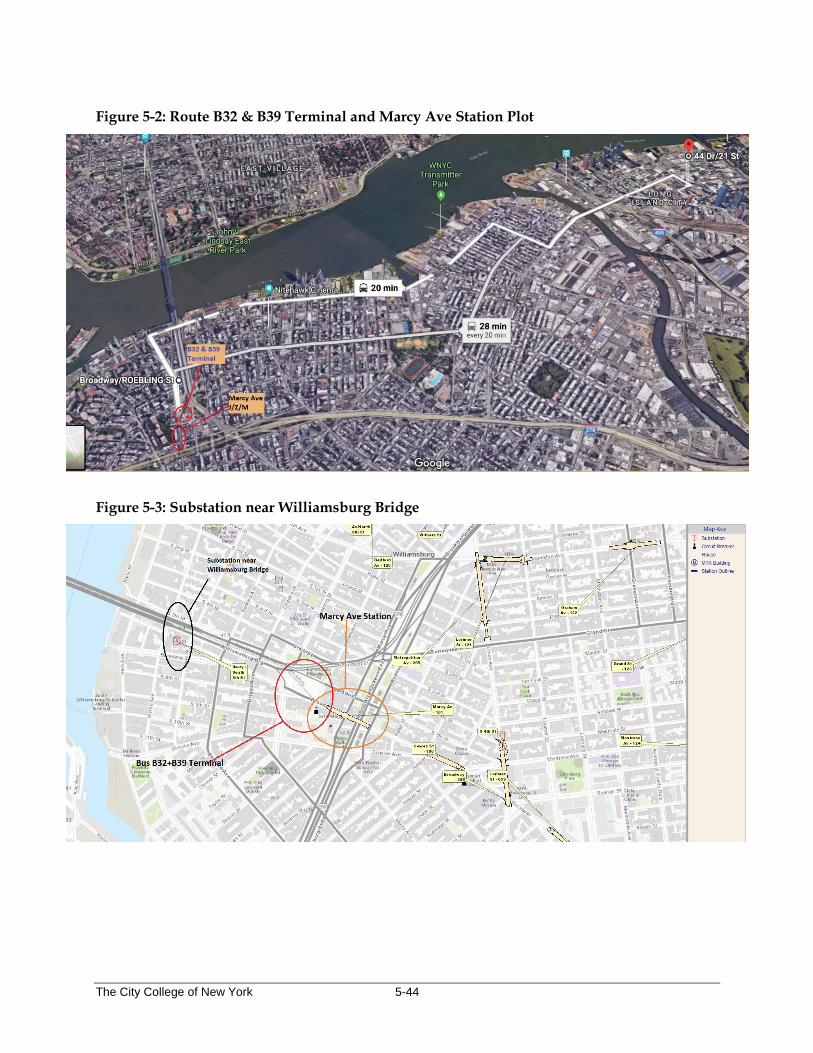
The City College of New York 5-44
Figure 5-2: Route B32 & B39 Terminal and Marcy Ave Station Plot
Figure 5-3: Substation near Williamsburg Bridge
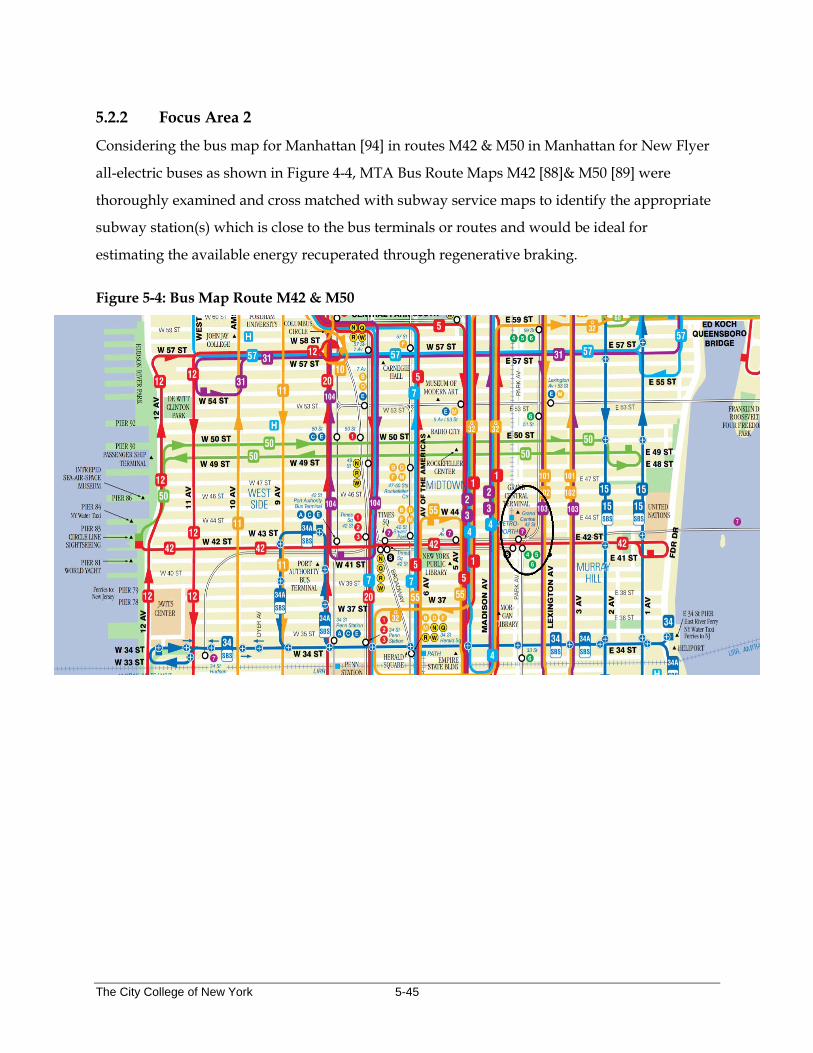
The City College of New York 5-45
5.2.2 Focus Area 2
Considering the bus map for Manhattan [94] in routes M42 & M50 in Manhattan for New Flyer
all-electric buses as shown in Figure 4-4, MTA Bus Route Maps M42 [88]& M50 [89] were
thoroughly examined and cross matched with subway service maps to identify the appropriate
subway station(s) which is close to the bus terminals or routes and would be ideal for
estimating the available energy recuperated through regenerative braking.
Figure 5-4: Bus Map Route M42 & M50
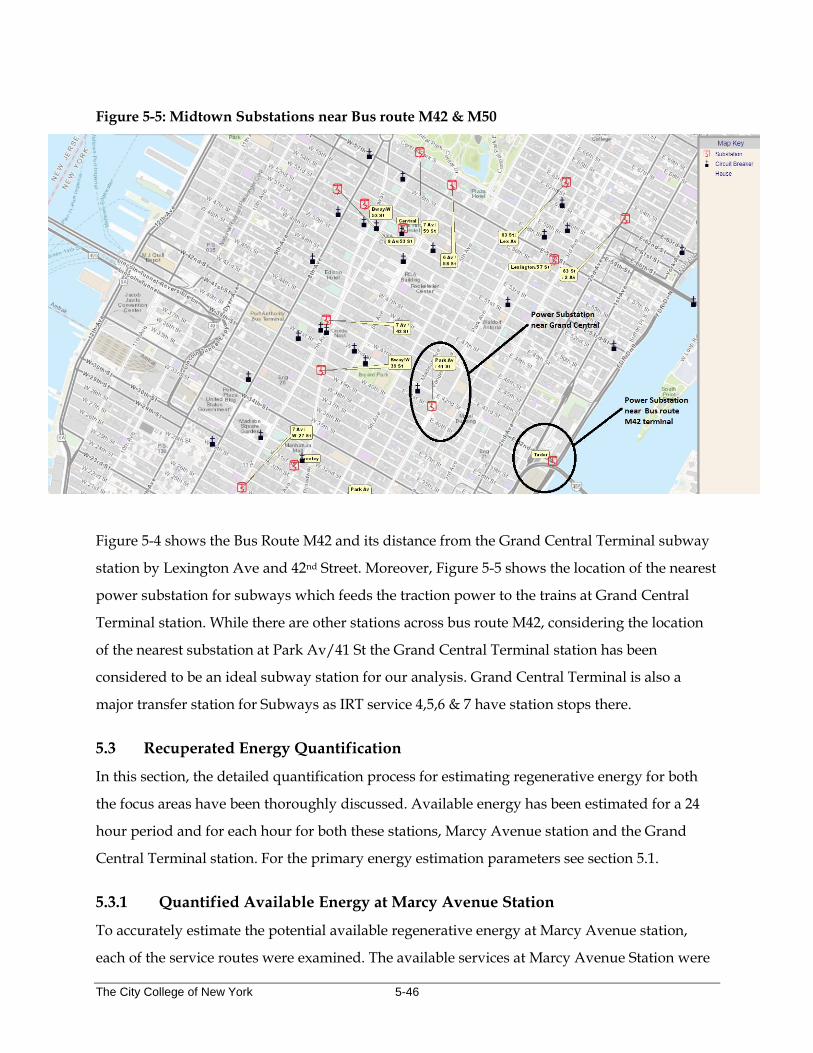
The City College of New York 5-46
Figure 5-5: Midtown Substations near Bus route M42 & M50
Figure 5-4 shows the Bus Route M42 and its distance from the Grand Central Terminal subway
station by Lexington Ave and 42nd Street. Moreover, Figure 5-5 shows the location of the nearest
power substation for subways which feeds the traction power to the trains at Grand Central
Terminal station. While there are other stations across bus route M42, considering the location
of the nearest substation at Park Av/41 St the Grand Central Terminal station has been
considered to be an ideal subway station for our analysis. Grand Central Terminal is also a
major transfer station for Subways as IRT service 4,5,6 & 7 have station stops there.
5.3 Recuperated Energy Quantification
In this section, the detailed quantification process for estimating regenerative energy for both
the focus areas have been thoroughly discussed. Available energy has been estimated for a 24
hour period and for each hour for both these stations, Marcy Avenue station and the Grand
Central Terminal station. For the primary energy estimation parameters see section 5.1.
5.3.1 Quantified Available Energy at Marcy Avenue Station
To accurately estimate the potential available regenerative energy at Marcy Avenue station,
each of the service routes were examined. The available services at Marcy Avenue Station were
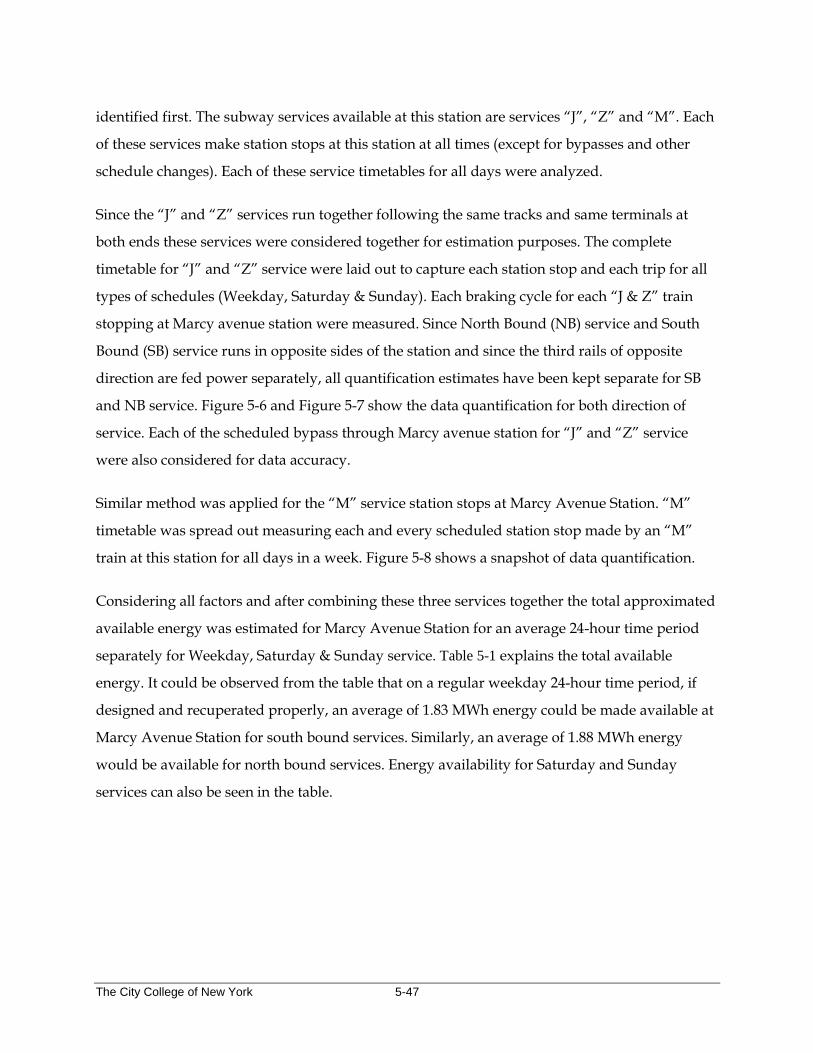
The City College of New York 5-47
identified first. The subway services available at this station are services “J”, “Z” and “M”. Each
of these services make station stops at this station at all times (except for bypasses and other
schedule changes). Each of these service timetables for all days were analyzed.
Since the “J” and “Z” services run together following the same tracks and same terminals at
both ends these services were considered together for estimation purposes. The complete
timetable for “J” and “Z” service were laid out to capture each station stop and each trip for all
types of schedules (Weekday, Saturday & Sunday). Each braking cycle for each “J & Z” train
stopping at Marcy avenue station were measured. Since North Bound (NB) service and South
Bound (SB) service runs in opposite sides of the station and since the third rails of opposite
direction are fed power separately, all quantification estimates have been kept separate for SB
and NB service. Figure 5-6 and Figure 5-7 show the data quantification for both direction of
service. Each of the scheduled bypass through Marcy avenue station for “J” and “Z” service
were also considered for data accuracy.
Similar method was applied for the “M” service station stops at Marcy Avenue Station. “M”
timetable was spread out measuring each and every scheduled station stop made by an “M”
train at this station for all days in a week. Figure 5-8 shows a snapshot of data quantification.
Considering all factors and after combining these three services together the total approximated
available energy was estimated for Marcy Avenue Station for an average 24-hour time period
separately for Weekday, Saturday & Sunday service. Table 5-1 explains the total available
energy. It could be observed from the table that on a regular weekday 24-hour time period, if
designed and recuperated properly, an average of 1.83 MWh energy could be made available at
Marcy Avenue Station for south bound services. Similarly, an average of 1.88 MWh energy
would be available for north bound services. Energy availability for Saturday and Sunday
services can also be seen in the table.

The City College of New York 5-48
Figure 5-6: Route J / Z South Bound timetable with energy mapping
Figure 5-7: Route J / Z North Bound timetable with energy mapping
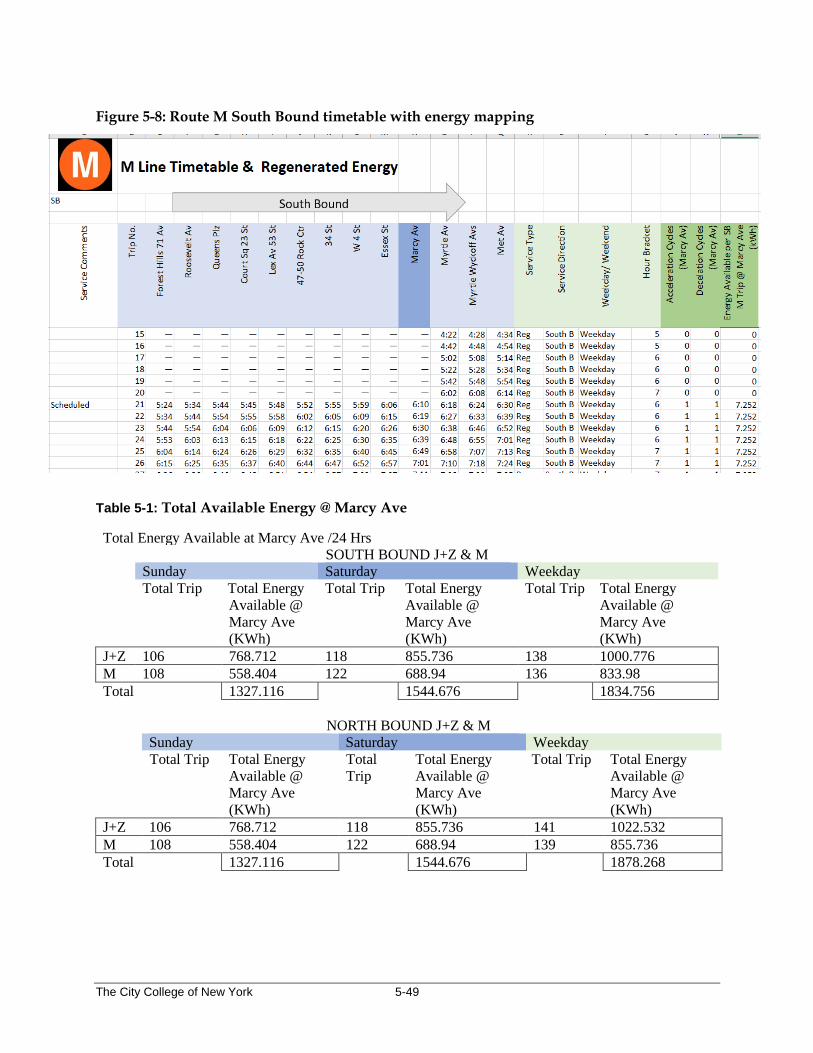
The City College of New York 5-49
Figure 5-8: Route M South Bound timetable with energy mapping
Table 5-1: Total Available Energy @ Marcy Ave
Total Energy Available at Marcy Ave /24 Hrs
SOUTH BOUND J+Z & M
Sunday Saturday Weekday Total Trip Total Energy
Available @
Marcy Ave
(KWh)
Total Trip Total Energy
Available @
Marcy Ave
(KWh)
Total Trip Total Energy
Available @
Marcy Ave
(KWh)
J+Z 106 768.712 118 855.736 138 1000.776
M 108 558.404 122 688.94 136 833.98
Total 1327.116 1544.676 1834.756
NORTH BOUND J+Z & M
Sunday Saturday Weekday Total Trip Total Energy
Available @
Marcy Ave
(KWh)
Total
Trip
Total Energy
Available @
Marcy Ave
(KWh)
Total Trip Total Energy
Available @
Marcy Ave
(KWh)
J+Z 106 768.712 118 855.736 141 1022.532
M 108 558.404 122 688.94 139 855.736
Total 1327.116 1544.676 1878.268
The City College of New York 5-50
5.3.2 Quantified Available Energy at Grand Central Terminal Station
To accurately estimate the potential available regenerative energy at Grand Central Terminal
station, each of the service routes were examined. The available services at Grand Central
Terminal Station were identified first. The subway services available at this station are services
“4”, “5”, “6” and “7”. Each of these services make station stops at this station at all times (except
for bypasses, scheduled express services and other schedule changes). Each of these service
timetables for all days were analyzed. Since each of these services run separately these services
were measured individually for accurate estimation purposes.
The complete timetable for services “4”, “5”, “6” & “7” were laid out to capture each station
stop and each trip for all types of schedules (Weekday, Saturday & Sunday). Each braking cycle
for each train stopping at the Grand Central Terminal station were measured. Since North
Bound (NB) service and South Bound (SB) service runs in opposite sides of the station and since
the third rails in opposite direction are fed power separately, all quantification estimates were
kept separate for SB and NB services. Figure 5-9 and Figure 5-10 show a sample data
quantification for both direction of “4” service. Each of the scheduled bypasses through this
station for all these service routes were considered for data accuracy.
Considering all factors and after combining these four (4,5,6 & 7) services together the total
approximated available energy was estimated for Grand Central Terminal Station for an average 24-
hour time period separately for Weekday, Saturday & Sunday services.
Table 5-2 explains the total available energy. It could be observed from the table that on a
regular weekday 24-hour time period, if designed and recuperated properly, an average of 5.73
MWh energy could be made available at Grand Central Terminal Station for south bound
services. Similarly, an average of 6.03 MWh energy would be available for north bound services.
Energy availability for Saturday and Sunday services could also be seen in the table.
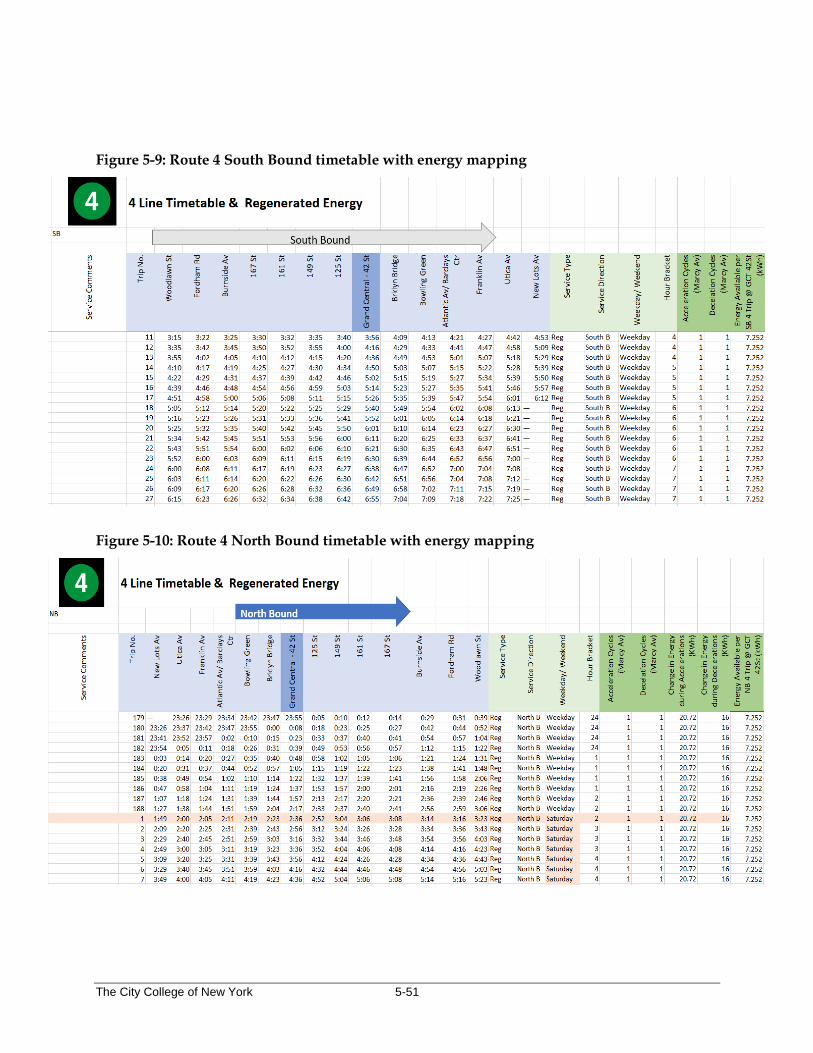
The City College of New York 5-51
Figure 5-9: Route 4 South Bound timetable with energy mapping
Figure 5-10: Route 4 North Bound timetable with energy mapping
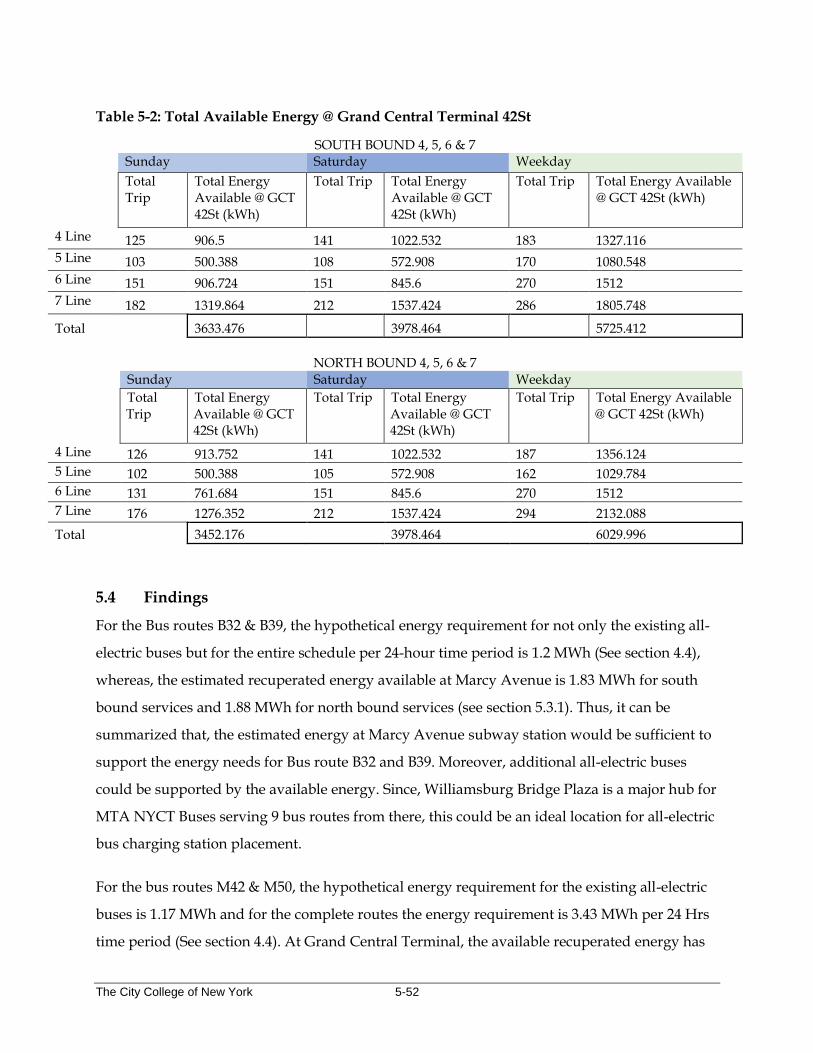
The City College of New York 5-52
Table 5-2: Total Available Energy @ Grand Central Terminal 42St
SOUTH BOUND 4, 5, 6 & 7
Sunday Saturday Weekday
Total Trip
Total Energy Available @ GCT 42St (kWh)
Total Trip Total Energy Available @ GCT 42St (kWh)
Total Trip Total Energy Available @ GCT 42St (kWh)
4 Line 125 906.5 141 1022.532 183 1327.116
5 Line 103 500.388 108 572.908 170 1080.548
6 Line 151 906.724 151 845.6 270 1512
7 Line 182 1319.864 212 1537.424 286 1805.748
Total 3633.476 3978.464 5725.412
NORTH BOUND 4, 5, 6 & 7
Sunday Saturday Weekday Total Trip
Total Energy Available @ GCT 42St (kWh)
Total Trip Total Energy Available @ GCT 42St (kWh)
Total Trip Total Energy Available @ GCT 42St (kWh)
4 Line 126 913.752 141 1022.532 187 1356.124
5 Line 102 500.388 105 572.908 162 1029.784
6 Line 131 761.684 151 845.6 270 1512
7 Line 176 1276.352 212 1537.424 294 2132.088
Total 3452.176 3978.464 6029.996
5.4 Findings
For the Bus routes B32 & B39, the hypothetical energy requirement for not only the existing all-
electric buses but for the entire schedule per 24-hour time period is 1.2 MWh (See section 4.4),
whereas, the estimated recuperated energy available at Marcy Avenue is 1.83 MWh for south
bound services and 1.88 MWh for north bound services (see section 5.3.1). Thus, it can be
summarized that, the estimated energy at Marcy Avenue subway station would be sufficient to
support the energy needs for Bus route B32 and B39. Moreover, additional all-electric buses
could be supported by the available energy. Since, Williamsburg Bridge Plaza is a major hub for
MTA NYCT Buses serving 9 bus routes from there, this could be an ideal location for all-electric
bus charging station placement.
For the bus routes M42 & M50, the hypothetical energy requirement for the existing all-electric
buses is 1.17 MWh and for the complete routes the energy requirement is 3.43 MWh per 24 Hrs
time period (See section 4.4). At Grand Central Terminal, the available recuperated energy has

The City College of New York 6-53
been estimated to be 5.73 MWh from south bound services and 6.03 MWh from north bound
services per weekday (see section 5.3.2). This huge amount of available energy is more than
enough to support both M42 & M50 bus routes.
On-route fast charging stations for electric buses in route M42 could be installed close to Grand
Central Terminal on 42nd street and close to Park Av/41 St Substation for easier energy transfer
from ESS storage to Bus chargers.
6.0 GLOBAL BENCHMARKS
Some of the world’s public transportation leaders have already started thinking of this
possibility of using regenerated energy from braking trains to charge electric buses and/or any
electric vehicles (EV). Only some of the international projects are discussed here.
6.1 Hedgehog Applications
In Europe, a renowned innovative technology research firm “Hedgehog applications” has
devised a way to reuse braking energy to charge electric busses. In 2015 Hedgehog Applications
B.V. has been granted the patent: ENERGY DISTRIBUTION AND CONSUMPTION SYSTEM
FOR RAILWAY STATION NR PCT/NL2014/050160. The patent describes the connection
between all existing technical components necessary to store and reuse the regenerative braking
energy from trains, metro’s and trams. Hedgehog Applications has won an International
Railway Union (UIC) Highspeed Digital Award in this area of innovation earlier this year. The
award was given out during the 10th World Highspeed Congress. In 2017, they have
undertaken a pilot project [95] in Apeldoorn, Amsterdam, which would use a large battery to
store energy regenerated by braking electric trains and use it to recharge electric buses and
cars. This pilot project was undertaken in partnership with ProRail and local authorities in
Netherlands. The energy transfer model used by Hedgehog applications is shown in Figure 6-1.
According to Hedgehog Applications, at the train stations, braking energy are extracted via
physical connections with the overhead lines. This energy is then stored in battery systems
which is internationally patented by Hedgehog System ™. In addition to the (braking) energy
that is extracted from the overhead line, local renewable energy from solar panels is stored in
the battery and a bi-directional smart grid connection with the public energy grid is available.
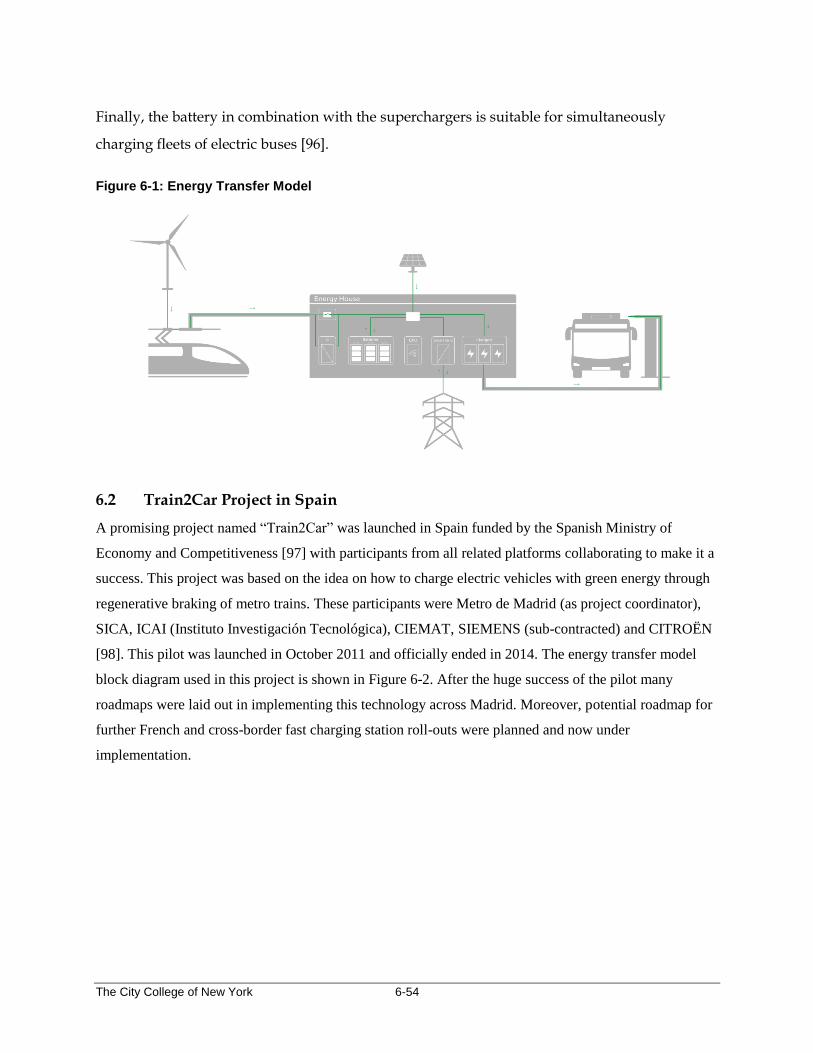
The City College of New York 6-54
Finally, the battery in combination with the superchargers is suitable for simultaneously
charging fleets of electric buses [96].
Figure 6-1: Energy Transfer Model
6.2 Train2Car Project in Spain
A promising project named “Train2Car” was launched in Spain funded by the Spanish Ministry of
Economy and Competitiveness [97] with participants from all related platforms collaborating to make it a
success. This project was based on the idea on how to charge electric vehicles with green energy through
regenerative braking of metro trains. These participants were Metro de Madrid (as project coordinator),
SICA, ICAI (Instituto Investigación Tecnológica), CIEMAT, SIEMENS (sub-contracted) and CITROËN
[98]. This pilot was launched in October 2011 and officially ended in 2014. The energy transfer model
block diagram used in this project is shown in Figure 6-2. After the huge success of the pilot many
roadmaps were laid out in implementing this technology across Madrid. Moreover, potential roadmap for
further French and cross-border fast charging station roll-outs were planned and now under
implementation.
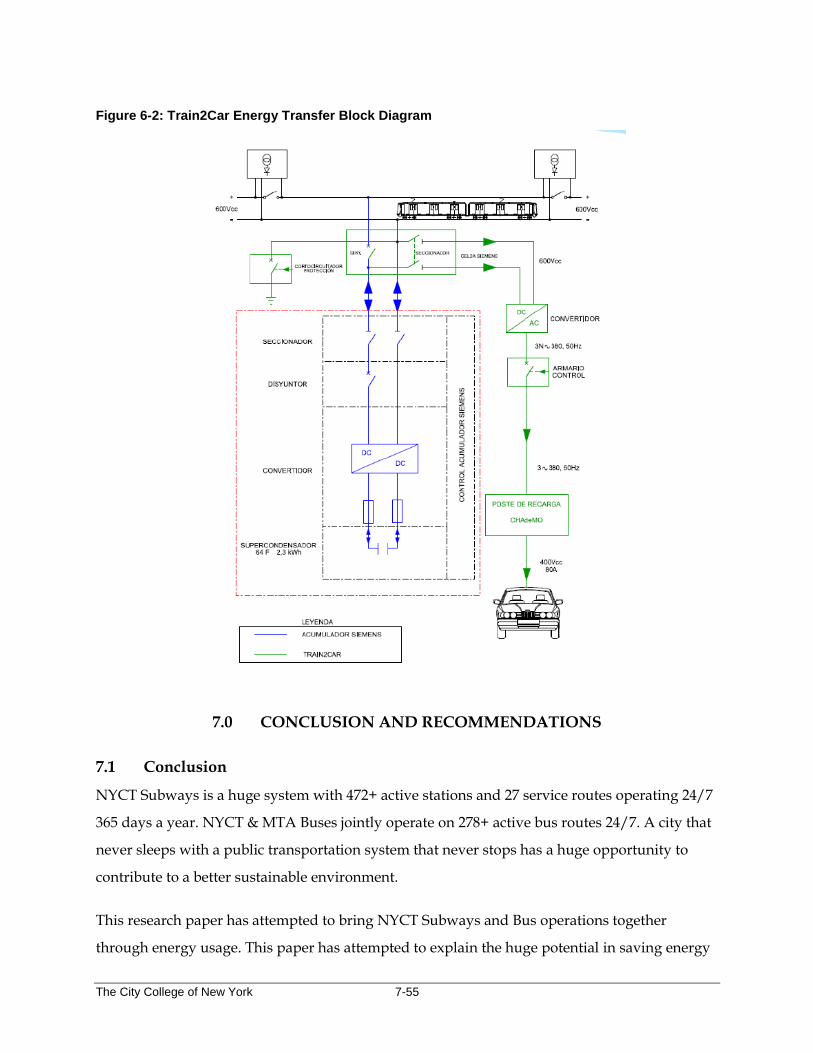
The City College of New York 7-55
Figure 6-2: Train2Car Energy Transfer Block Diagram
7.0 CONCLUSION AND RECOMMENDATIONS
7.1 Conclusion
NYCT Subways is a huge system with 472+ active stations and 27 service routes operating 24/7
365 days a year. NYCT & MTA Buses jointly operate on 278+ active bus routes 24/7. A city that
never sleeps with a public transportation system that never stops has a huge opportunity to
contribute to a better sustainable environment.
This research paper has attempted to bring NYCT Subways and Bus operations together
through energy usage. This paper has attempted to explain the huge potential in saving energy

The City College of New York 7-56
through optimal capture and usage of regenerative braking technology in NYCT Subways and
has explained a potential opportunity to feed this saved energy as an energy source to power
up all-electric transit buses. In an attempt, the structure of NYCT subways and bus operations
were explained with summarizing the details of Subways rolling stock and bus fleet. After
analyzing the existing all-electric bus routes and their charging stations, nearest subway stations
were identified for study purposes. Two individual cases were established considering two
separate focus areas in the NYCT transportation system. Hypothetical all-electric bus energy
demands were quantified. In selected stations, available recuperated regenerative energy was
estimated with close approximation. It was proven that, if captured and used properly
recuperated energy from train braking could be used as a significant energy source for electric
buses satisfying energy demands.
A transportation system as big as NYCT has a huge potential to save energy all around the
system through regenerative braking. This huge available energy could be used as energy
sources systemwide for many bus routes which would transition to all-electric buses. This could
take MTA a step ahead towards achieving its goal of zero-emission transportation system and
could make MTA a huge contributor to achieve a carbon free environment.
7.2 Recommended Future Work
Future study should be performed in all potentially feasible areas within transit where Subways
and buses could be connected through potential energy usage sharing as demonstrated in this
paper.
Research should be conducted to identify the equipment upgrades needed to make this energy
transfer a feasible option.
Existing NYCT all-electric bus performance data should be observed in a periodic manner to
come up with a close estimation of Bus mileage range per charging and discharging cycle.
Energy storage options should be explored to establish a valid measure of energy transfer losses
from energy reproduction to storage and to design a proper storage system that could store the
regenerated energy and supply to power electric buses with minimal transfer losses.
The City College of New York 7-57
Designing a comprehensive energy management system could be explored, which could be
driven by voltage/current regulated algorithms to prioritize energy transfer among ESS,
reversible substation, onboard auxiliary or other options.
Regenerated energy from braking trains could also provide an energy supply in the form of a
battery buffer system in places where there is insufficient power or a need for grid stabilization,
in the case of an overload of the public energy grid.

The City College of New York 8-58
8.0 REFERENCES
[1] A. B. I.-E. H. e. a. Teymourfar R, "Stationary supercapacitor energy storage system to save regenerative braking energy in a
metro line. ; .," Energy Convers Manage, vol. 56, p. 206–214, 2012.
[2] M. S. D. R. a. N. R. S. Chenh, "Quasi-Static Decoupled Load Flow Modelling of a Power Supply Network with AC-DC
Converters Applied to Light Rail System, ,," in IEEE Vehicle Power and Propulsion Conference VPPC, 2008.
[3] Dayton T. Brown, "DTB Report:," 305100-01-R12-0754, 2013.
[4] NYPA, "Contract No. 4500116711, Final Report," Rev. 1.1, May 31, 2008.
[5] NYPA LTK report, "NEW YORK CITY TRANSIT TRACTION POWER SYSTEM STUDY AND ENERGY STORAGE
SYSTEM ANALYSIS," Contract No. 4500117064, Final Report, April 20, 2007.
[6] MTA, "mta-testing-10-new-all-electric-buses-reduce-emissions-modernize-public-transit," 08 01 2018. [Online]. Available:
http://www.mta.info/news/2018/01/08/mta-testing-10-new-all-electric-buses-reduce-emissions-modernize-public-
transit.
[7] J. Little, "City Council Wants MTA To Provide All Electric Buses During L Train Shutdown," BKLYNER, October 1, 2018.
[8] MTA, "NYCT facts: MTA," 2018. [Online]. Available: http://web.mta.info/nyct/facts/ffintro.htm .
[9] MTA, "subway : MTA NYCT," [Online]. Available: http://web.mta.info/nyct/subway/howto_sub.htm.
[10
]
MTA, "Facts_and_Figures: NYC Subway," [Online]. Available:
https://www.nycsubway.org/wiki/Subway_FAQ:_Facts_and_Figures .
[11
]
"www.nycsubway.org: New Subways for New York: The Dual System of Rapid Transit (1913)," 2016. [Online]. Available:
www.nycsubway.org. [Accessed 2018].
[12
]
New York Times, "Gay Midnight Crowd Rides First Trains in New Subway. New York Times," New York Times, p. 1, 10
September 1932.
[13
]
M. S. Feinman, "History of the Independent Subway: nycsubway.org," 2000. [Online]. Available: http://nycsubway.org.
[Accessed 2018].
[14
]
E. Perlmutter, "Subway Changes to Speed Service: Major Alterations in Maps, Routes and Signs Will Take Effect Nov. 26
(PDF): The New York Times," 16 November 1967. [Online]. Available: httl://www.nytimes.com. [Accessed 2018].
[15
]
A. J. Sparberg, "The Journey from Board of Transportation to MTA," in From a Nickel to a Token, Fordham University
Press: ISBN 978-0-8232-6190-1, October 1, 2014.
[16
]
J. Cunningham and L. O. DeHart, A History of the New York City Subway System, 1993.
[17
]
M. N. Y. T. Grynbaum, "Official paint monikers since the colors were fixed in 1979," Take the Tomato 2 Stops to the
Sunflower: New York Times, City Room Blog, 10 May 2010.
[18
]
Metropolitan Transportation Authority, "Subway Service Guide," 25 June 2017.
[19
]
MTA, "Subway Map: NYCT," 2018. [Online]. Available: http://web.mta.info/maps/submap.html . [Accessed 2018].
The City College of New York 8-59
[20
]
www.thejoekorner.com, "Current Cars: NYCT Subway," [Online]. Available: http://www.thejoekorner.com/cars/cars-
current.htm. [Accessed 2018].
[21
]
www.nycsubway.org, "Current Fleet: NYC Subway," 2017. [Online]. Available:
https://www.nycsubway.org/wiki/Current_Fleet . [Accessed 2018].
[22
]
MTA, "The MTA 2006 ANNUAL REPORT: Comprehensive Annual Financial Report for the Year Ended December 31,
2006 Metropolitan Transportation Authority.," May 1, 2007.
[23
]
Metropolitan Transportation Authority, "New York City Transit and the Environment:. Metropolitan Transportation
Authority".
[24
]
C. Seaton, "New York City Bringing Rail Into the 21st Century:," Metro Magazine, 2006.
[25
]
G. Pierre-Pierre, "After a Few Suggestions, City Presents Subway Cars With Seats of Amplitude:," The New York Times, 22
January 1997.
[26
]
nycsubway.org, "Car R142: NYC Subway," [Online]. Available: http://www.nycsubway.org/cars/r142.html. [Accessed
2018].
[27
]
www.nycsubway.org, "New_Technology_Trains_-_A_Division," 2016. [Online]. Available:
https://www.nycsubway.org/wiki/New_Technology_Trains_-_A_Division. [Accessed 2018].
[28
]
Railwaygazette, "cbtc-trials-on-new-yorks-flushing-line," [Online]. Available:
https://www.railwaygazette.com/news/single-view/view/cbtc-trials-on-new-yorks-flushing-line.html. [Accessed
2018].
[29
]
erausa.org, "R188: 2018-07-bulletin," July 2018. [Online]. Available: https://erausa.org/pdf/bulletin/2018-07-bulletin.pdf.
[Accessed 2018].
[30
]
wikipedia, "R188_(New_York_City_Subway_car," [Online]. Available:
https://en.wikipedia.org/wiki/R188_(New_York_City_Subway_car. [Accessed 2018].
[31
]
nycsubway.org, "Subway Cars R143," [Online]. Available: http://www.nycsubway.org/cars/r143.html. [Accessed 2018].
[32
]
nycsubway.org, "New_Technology_Trains_-_B_Division," [Online]. Available:
https://www.nycsubway.org/wiki/New_Technology_Trains_-_B_Division. [Accessed 2018].
[33
]
nycsubway.org, "Subway Cars: R160," [Online]. Available: http://www.nycsubway.org/cars/r160.html. [Accessed 2018].
[34
]
MTA, "Capital Program: MTA Info," [Online]. Available:
http://web.mta.info/mta/news/books/pdf/140728_1200_CPOC.pdf. [Accessed 2018].
[35
]
Metropolitan Transportation Authority, Capital Program Oversight Committee Meeting, NYC, NY, 2018.
[36
]
MTA, "Bus Facts: MTA," [Online]. Available: http://web.mta.info/nyct/facts/ffbus.htm.
[37
]
web.archive.org, "agency_profiles," 2008. [Online]. Available:
https://web.archive.org/web/20110724180542/http://www.ntdprogram.gov/ntdprogram/pubs/profiles/2008/agency_pr
ofiles/2188.pdf. [Accessed 2018].

The City College of New York 8-60
[38
]
web.archive.org, "MTA Bus Info," 2016. [Online]. Available:
https://web.archive.org/web/20160129071849/http://web.mta.info/mta/news/books/pdf/160125_1345_CPOC.pdf.
[Accessed 2018].
[39
]
MTA, "mta-testing-10-new-all-electric-buses-reduce-emissions-modernize-public-transit," 08 01 2018. [Online]. Available:
http://www.mta.info/news/2018/01/08/mta-testing-10-new-all-electric-buses-reduce-emissions-modernize-public-
transit. [Accessed 2018].
[40
]
R. L. R. B. a. G. M. M. C. Falvo, "An innovative proposal toward an integrated and sustainable urban mobility system
including plug-in electric vehicles," Energy management in metro-transit systems: , Electr. Power Syst. Res., vol. 81,
no. 12, p. 2127–2138.
[41
]
P. W. S. H. H. B. G. a. C. R. S. Lu, "Increasing the Regenerative Braking Energy for Railway Vehicles," IEEE Trans. Intell.
Transp. Syst., vol. 15, no. 6, p. 2506–2515, 2014.
[42
]
Á. J. L.-L. e. al, "A Variable No-Load Voltage Scheme for Improving Energy Efficiency in DC-Electrified Mass Transit
Systems, pp. 2–4.," in in Proceedings of the 2014 Joint Rail Conference, Colorado, USA,, 2014.
[43
]
M. C. C. G.-M. a. R. A. P. Arboleya, "On board accumulator model for power flow studies in DC traction networks,"
Electr. Power Syst. Res., vol. 116, p. 266–275, Nov. 2014..
[44
]
]. D. Cornic, "Efficient recovery of braking energy through a reversible dc substation," Railway and Ship Propulsion
Electrical Systems for Aircraft, pp. 1-9, 2010.
[45
]
J. V. M. a. X. T. R. Barrero, "“Energy savings in public transport,”," IEEE Veh. Technol. Mag., vol. 3, no. 3, p. 26–36, Sep.
2008.
[46
]
T. K. a. M. Tobita, "“Fixed energy storage technology applied for DC electrified railway (traction power substation),,"
Railway and Ship Propulsion 2012 Electrical Systems for Aircraft, p. 1–6., 2012.
[47
]
M. Khodaparastan, "Modeling_and_Simulation_of_Regenerative_Braking_Energy_in_DC_Electric_Rail_Systems,"
[Online]. Available:
https://www.researchgate.net/publication/327010682_Modeling_and_Simulation_of_Regenerative_Braking_Energy_
in_DC_Electric_Rail_Systems. [Accessed 2018].
[48
]
M. F. M. a. H. M. Nasri, "“Timetable optimization for maximum usage of regenerative energy of braking in electrical
railway systems,”," SPEEDAM 2010 - Int. Symp. Power Electron. Electr. Drives, Autom. Motion, p. 1218–1221,
2010.
[49
]
D. M. D. F. D. M. a. A. G. H. D. Fournier, "“A greedy heuristic for optimizing metro regenerative energy usage”," in in
iProceedings of the second international conference on railway technology: research, development and maintenance,
2015.
[50
]
X. L. B. N. a. T. T. X. Yang, "“A survey on energy-efficient train operation for urban rail transit,”," IEEE Trans. Intell.
Transp. Syst., vol. 17, no. 1, p. 2–13, 2016.
[51
]
R. L. S. M. a. Y. L. J. Chen, "“Optimization of an MRT train schedule : reducing maximum traction power by using genetic
algorithms,"," IEEE Trans. power Syst., vol. 20, no. 3, p. 1366–1372, 2005.
[52
]
B. S. a. P. Girard, "“Train scheduling desynchronization and power peak optimization in a subway system,”, pp. 75–78,," in
Railr. Conf. Proc. 1995 IEEE/ASME Jt, 1995.

The City College of New York 8-61
[53
]
S. P. Gordon, "“Coordinated train control and energy management control strategies,”, pp. 165–176,," in Railr. Conf. Proc.
1998 ASME/IEEE Jt., 1998.
[54
]
T. Albrecht, "“Reducing power peaks and energy consumption in rail transit systems by simultaneous train running time
control,” , p. 3,," in 2010, Power Supply, Energy Manag. Catenary Probl..
[55
]
A. F. A. P. C. A. R. a. R. R. P. M. Pena-Alcaraz, "“Optimal underground timetable design based on power flow for
maximizing the use of regenerative-braking energy,”," Proc. Inst. Mech. Eng. Part F J. Rail Rapid Transit, vol. 226.
[56
]
Y. H. P. W. W. a. B. S. T. C. S. Chang, "“Economy/regularity fuzzy-logic control of DC railway systems using event-
driven approach,”," IEE Proc. - Electr. Power Appl., vol. 143, p. 9, 1996.
[57
]
X. L. Z. G. H. W. a. T. T. X. Yang, "“A Cooperative scheduling model for timetable optimization in subway systems,”,"
IEEE Trans. Intell. Transp. Syst., vol. 14, no. 1, p. 438–447, 2013.
[58
]
M. T. P. A. F. a. P. C. A. Ramos, "“Mathematical programming approach to underground timetabling problem for
maximizing time synchronization,”," in XI Congreso de Ingeniería de Organización, 2007.
[59
]
K. L. a. S. S. ] L. Zhao, "“A multi-objective timetable optimization model for subway systems,”," Proceedings of the 2013
International Conference on Electrical and Information Technologies for Rail Transportation (EITRT2013), vol. 1, p.
557–565, 2013.
[60
]
K. K. a. M. H. K. Kim, "A model and approaches for synchronized energy saving in timetabling: Korea Railr. Res.
Institute," 2011. [Online]. Available: http//www. Railw. org/IMG/pdf/a4_kim_kyungmin.pdf. [Accessed 2018].
[61
]
A. F. A. P. C. A. R. a. R. R. P. M. Pena-Alcaraz, "“Optimal underground timetable design based on power flow for
maximizing the use of regenerative-braking energy,”," Proc. Inst. Mech. Eng. Part F J. Rail Rapid Transit, vol. 226.
[62
]
M. M. a. H. Ko, "“Numerical analyses of minimum energy operation of multiple trains under DC power feeding circuit,”,"
in 2007 Eur. Conf. Power Electron. Appl. EPE, 2007.
[63
]
K. Holmes, "“Smart grids and wayside energy storage,”," Passeng. Transp, vol. 66, no. 40, 2008.
[64
]
Y. H. P. W. W. a. B. S. T. C. S. Chang, "“Economy/regularity fuzzy-logic control of DC railway systems using event-
driven approach,”," IEE Proc. - Electr. Power Appl., vol. 143, p. 9, 1996.
[65
]
P. Y. a. D. T. M. Schroeder, “Guiding the selection and application of wayside energy storage technologies for rail transit
and electric utilities,”, 2010.
[66
]
R. P. a. P. B. A. Gonzalez-Gil, "“Sustainable urban rail systems: Strategies and technologies for optimal management of
regenerative braking energy,”," Energy Convers. Manag., vol. 75, p. 374–388, 2013.
[67
]
J. W. M. D. a. J. C. X. Luo, "“Overview of current development in electrical energy storage technologies and the
application potential in power system operation,”," Appl. Energy, vol. 137, p. 511–536, 2015.
[68
]
M. Khodaparastan, A. A. Mohamed and W. Brandauer, "“Recuperation of Regenerative Braking Energy in Electric Rail
Transit Systems”," eprint arX, no. eprint arXiv:1808.05938, 2018.
[69
]
R. P. a. P. B. A. Gonzalez-Gil, "“Sustainable urban rail systems: Strategies and technologies for optimal management of
regenerative braking energy,”," Energy Convers. Manag., vol. 75, p. 374–388, 213.
[70
]
J. S. W. a. L. H. S. P. Radcliffe, "“Stationary applications of energy storage technologies for transit systems,”," IEEE Electr.
Power Energy Conf., p. 1–7, 2010.
The City College of New York 8-62
[71
]
F. Ciccarelli and D.Iannuzzi, "“A Novel energy management control of wayside Li-Ion capacitors-based energy storage for
urban mass transit systems,”," in International Symposium on Power Electronics Power Electronics, Electrical
Drives, Automation and Motion, 2012.
[72
]
T. P. Sharma, "“A review on electrochemical double-layer capacitors,”," Energy Convers. Manag., vol. 51, no. 12, p. 2901–
2912, 2010.
[73
]
B. Maher, "“Ultracapacitors provide cost and energy savings for public transportation applications,”," Batter. Power Prod.
Technol. Mag., vol. 10, no. 6, 2006.
[74
]
T. N. C. W. Y. C. T. Y. L. a. Y. D. H. Chen, "“Progress in electrical energy storage system: A critical review,”," Prog. Nat.
Sci., vol. 19, no. 3, p. 291–312, 2009.
[75
]
D. Castelvecchi, " "Spinning into control: High-tech reincarnations of an ancient way of storing energy".," Science News,
vol. 171, no. 20: doi:10.1002/scin.2007.5591712010, p. 312–313, (May 19, 2007.
[76
]
R. P. a. P. B. A. Gonzalez-Gil, "“Sustainable urban rail systems: Strategies and technologies for optimal management of
regenerative braking energy,”," Energy Convers. Manag., vol. 75, p. 374–388, 2013.
[77
]
J. W. M. D. a. J. C. X. Luo, "“Overview of current development in electrical energy storage technologies and the
application potential in power system operation,”," Appl. Energy, vol. 137, p. 511–536, 2015.
[78
]
M. B. Richardson, "“Flywheel energy storage system for traction applications,”," in International Conference on Power
Electronics Machines and Drives 2002, vol. 2002, no. 14, p. 275–279, 2002.
[79
]
F. E. Management, "Federal Energy Management Program, “Flywheel Energy Storage,”," Fed. Technol. Alert,, p. 1–16,
2003.
[80
]
D. Cornic, ""Efficient recovery of braking energy through a reversible dc substation,", pp. 1-9.," in Electrical Systems for
Aircraft, Railway and Ship Propulsion,, Bologna, 2009.
[81
]
G. Vitaly, "“Energy Storage That May Be Too Good to Be True,”," EEE Vehicular Technology Magazine, vol. 8.4, pp. 70-
80, 2013.
[82
]
Proterra, "proterra-introduces-the-duopower-drivetrain-for-its-catalyst-zero-emission-buses-at-apta/," Proterra, 2018.
[Online]. Available: https://www.proterra.com/press-release/proterra-introduces-the-duopower-drivetrain-for-its-
catalyst-zero-emission-buses-at-apta/. [Accessed 2018].
[83
]
Proterra, "Proterra-secures-three-year-lease-program-with-new-york-mta," [Online]. Available:
https://www.proterra.com/press-release/proterra-secures-three-year-lease-program-with-new-york-mta/.
[84
]
Newflyer, "new-york-launch-electric-bus-test-evaluation-program-five-xcelsior-charge-buses," 2018. [Online]. Available:
https://www.newflyer.com/2018/01/new-york-launch-electric-bus-test-evaluation-program-five-xcelsior-charge-
buses/.
[85
]
Newflyer, "XcelsiorCHARGE_1018_NF-compressed," 2018. [Online]. Available: https://www.newflyer.com/site-
content/uploads/2018/10/XcelsiorCHARGE_1018_NF-compressed.pdf.
[86
]
MTA, "Bus Schedule B32," 2018. [Online]. Available: http://web.mta.info/nyct/bus/schedule/bkln/b032cur.pdf.
[87
]
MTA, "Bus Schedule B39," 2018. [Online]. Available: http://web.mta.info/nyct/bus/schedule/bkln/b039cur.pdf.
The City College of New York 8-63
[88
]
MTA, "BUS Schedule M42," 2018. [Online]. Available: http://web.mta.info/nyct/bus/schedule/manh/m042cur.pdf.
[Accessed 2018].
[89
]
MTA, "BUS Schedule M50," 2018. [Online]. Available: http://web.mta.info/nyct/bus/schedule/manh/m050cur.pdf.
[90
]
NewFlyer, "XE40-One-Pager-Tech-Spec_SR1923_2018_NF," 2018. [Online]. Available: https://www.newflyer.com/site-
content/uploads/2018/09/XE40-One-Pager-Tech-Spec_SR1923_2018_NF.pdf. [Accessed 2018].
[91
]
NewFlyer, "new-flyer-becomes-the-first-north-american-bus-manufacturer-outside-the-volvo-group-to-join-oppcharge-
continues-support-of-global-charging-systems-for-electric-buses," 2018. [Online]. Available:
https://www.newflyer.com/2018/08/new-flyer-becomes-the-first-north-american-bus-manufacturer-outside-the-volvo-
group-to-join-oppcharge-continues-support-of-global-charging-systems-for-electric-buses/. [Accessed 2018].
[92
]
ConEd, "Regenerative-braking-energy-recuperation: ConEd," 2017. [Online]. Available: https://www.coned.com/-
/media/files/coned/documents/our-energy-future/our-energy-projects/regenerative-braking-energy-recuperation.pdf.
[Accessed 2018].
[93
]
MTA, "BUS Map Brooklyn," [Online]. Available: http://web.mta.info/nyct/maps/busbkln.pdf.
[94
]
MTA, "BUS Map Manhattan," 2018. [Online]. Available: http://web.mta.info/nyct/maps/manbus.pdf . [Accessed 2018].
[95
]
Railpage, "hedgehog-to-capture-regenerative-braking-energy-for-buses," 2017. [Online]. Available:
http://www.railpage.com.au/news/s/hedgehog-to-capture-regenerative-braking-energy-for-buses. [Accessed 2018].
[96
]
hedgehogapplications, "braking-energy-from-trains-metros-and-trams," 2017. [Online]. Available:
https://www.hedgehogapplications.nl/en/braking-energy-from-trains-metros-and-trams/. [Accessed 2018].
[97
]
B. KANE, "How-to-combine-a-train-and-electric-car-charging-maybe-train2car," Iinsideevs, 8 MAR 2014. [Online].
Available: https://insideevs.com/how-to-combine-a-train-and-electric-car-charging-maybe-train2car/.
[98
]
Eyeonspain, "Electric-cars-that-are-loaded-with-braking-trains-a-Spanish-Metro," 2014. [Online]. Available:
https://www.eyeonspain.com/blogs/luislopezcortijo/12472/Electric-cars-that-are-loaded-with-braking-trains-a-
Spanish-Metro.aspx. [Accessed 2018].