A Psychometric Analysis of the Three Gunas-...
22
A Psychometric Analysis of the Three Gunas David Wolf, PhD 3 A Psychometric Analysis of the Three Gunas by David Wolf Wolf, D. (1999). A Psychometric Analysis of the Three Gunas, Psychological Reports, 84, 1379-1390. Vedic literature contains knowledge about all fields of human endeavor, from physics and psychology to medicine, art and aeronautics (Goswami, 1977). Empirical validation of the Vedas could therefore open storehouses of knowledge in many areas. According to the Vedas, all material elements are infused with the modes of nature, or gunas- sattva, rajas and tamas. Dasgupta (1961) describes the gunas as “the universal characteristics of all kinds of mental tendencies” (p. 468). Broad based confirmation of the Vedic psychological model would reasonably be grounded on a study of the gunas, as this idea underlies the Vedic conception of nature. From the perspective of the Vedas, our psycho-physical disposition consists of mixtures of the gunas (Prabhupada, 1976). This article describes development of the Vedic Personality Inventory (VPI), an instrument that assesses the validity of the three guna constructs. Others, such as Uma, Lakshmi and Parameswaran (1971), Singh (1971), Rao and Harigopal (1979), Mohan and Sandhu (1986, 1988), Das (1991), and Pathak, Bhatt and Sharma (1992), have devised and utilized similar inventories, with inter-guna correlations that indicate differentiation of the three modes. Since the primary purpose of the present study is to examine the validity of Vedic constructs, it incorporates more extensive statistical analyses towards this end than other research on the gunas. Also, the items of this inventory are derived from a Vaisnava, or personalist, understanding of Vedic philosophy. According to this view, the material personality manifested through the gunas is a covering of the original spiritual personality of the living entity.
Transcript of A Psychometric Analysis of the Three Gunas-...

A Psychometric Analysis of the Three Gunas David Wolf, PhD
3
A Psychometric Analysis of the Three Gunas
by David Wolf
Wolf, D. (1999). A Psychometric Analysis of the Three Gunas, Psychological Reports, 84, 1379-1390.
Vedic literature contains knowledge about all fields of human endeavor, from physics
and psychology to medicine, art and aeronautics (Goswami, 1977). Empirical validation of the
Vedas could therefore open storehouses of knowledge in many areas. According to the Vedas, all
material elements are infused with the modes of nature, or gunas- sattva, rajas and tamas.
Dasgupta (1961) describes the gunas as “the universal characteristics of all kinds of mental
tendencies” (p. 468). Broad based confirmation of the Vedic psychological model would
reasonably be grounded on a study of the gunas, as this idea underlies the Vedic conception of
nature. From the perspective of the Vedas, our psycho-physical disposition consists of mixtures
of the gunas (Prabhupada, 1976).
This article describes development of the Vedic Personality Inventory (VPI), an
instrument that assesses the validity of the three guna constructs. Others, such as Uma, Lakshmi
and Parameswaran (1971), Singh (1971), Rao and Harigopal (1979), Mohan and Sandhu (1986,
1988), Das (1991), and Pathak, Bhatt and Sharma (1992), have devised and utilized similar
inventories, with inter-guna correlations that indicate differentiation of the three modes. Since
the primary purpose of the present study is to examine the validity of Vedic constructs, it
incorporates more extensive statistical analyses towards this end than other research on the
gunas.
Also, the items of this inventory are derived from a Vaisnava, or personalist,
understanding of Vedic philosophy. According to this view, the material personality manifested
through the gunas is a covering of the original spiritual personality of the living entity.
A Psychometric Analysis of the Three Gunas David Wolf, PhD
4
Bhagavad-gita [2:12 (Prabhupada, 1986)] asserts that the self is eternally an individual.
Prabhupada explains “Arjuna and all the kings who are assembled on the battlefield are eternally
individual beings ...It is not that they did not exist as individuals in the past, and it is not that they
will not remain eternal persons. Their individuality existed in the past, and their individuality
will continue in the future without interruption” (p. 89).
The personal emphasis of Vaisnava philosophy can provide a guiding ethic for social and
mental health scientists. According to the Vedas, by removing the covering of the modes of
nature the original spiritual personality of each individual will be manifest. Without such
restoration of our spirituality, relationships are mechanically conducted on the basis of the gunas.
According to Vaisnava philosophy, fully spiritual relationships can be achieved only when the
gunas are absent, and replaced with the quality of pure goodness, or suddha sattva, which is the
platform of spiritual existence (Prabhupada, 1976). Consequently, investigating and instituting
methods for extricating the self from the gunas is relevant for the social and mental health
sciences.
To test the validity of the Vedic constructs of the three gunas, it is best to devise an
instrument that covers the domain of personality described in the Vedas themselves. Apart from
studying the gunas as a universal typology, there has been increased skepticism regarding the
applicability of Western psychological constructs for explicating and understanding the
psychology of indigenous peoples (Gergen, Gulerce, Lock, & Misra, 1996). Therefore, a cultural
perspective also dictates examination of the gunas as the Vedas describe them, rather than trying
to understand Vedic concepts by reducing them to constructs originating in Western thought.
Gergen, Gulerce, Lock and Misra have suggested exploration of Vedic psychology with
emphasis on the spiritual ontology of personhood. This is an important perspective, as the Vedas
describe the self as a spiritual entity that is personal and irreducible [Bhagavad-gita 2:12 and
2:24 (Prabhupada, 1986)]. Any theory based on a reductionistic ontology of personhood would
be incompatible with the Vedic paradigm and persons culturally attuned to that paradigm. The
VPI is an attempt to apply the concepts of Vedic personality while preserving the integrity of
guna theory.
A Psychometric Analysis of the Three Gunas David Wolf, PhD
5
Vedic theory asserts that while the classification scheme of the three gunas comprises all
aspects aspects of material, social and psychological reality, the gunas themselves are related to
each other. Specifically, rajas guna is described as an intermediary between tamas guna and
sattva guna (Prabhupada, 1976). Therefore, it is expected that there will be an inverse
relationship between sattva guna and tamas guna. In terms of psychometric theory, this type of
relationship between constructs meets the definition of a weak psychometric theory, wherein the
factors are non-orthogonal (Nunnally & Bernstein, 1994).
Method
Defining Constructs
Descriptions of each guna were compiled from the Bhagavad-gita As It Is (Prabhupada,
1986), Chapters 14, 17 and 18, as well as Dasgupta (1961). Sattva guna is characterized by
qualities such as cleanliness, truthfulness, gravity, dutifulness, detachment, discipline, mental
equilibrium, respect for superiors, contentment, sharp intelligence, sense control, and staunch
determination. Dasgupta describes the sattvic quality as being “free from attachment and vanity
and absolutely unruffled in success and failure” (p. 470). Krsna explains in the Bhagavad-gita
[17:15, p. 783] that the speech of a person predominantly in sattva guna is “truthful, pleasing,
beneficial, and not agitating to others” and that a sattvic person is characterized by “satisfaction,
simplicity, gravity, self-control and purification? [17:16, p. 784].
Attributes of rajas guna include intense activity, desire for sense gratification, little interest
in spiritual elevation, dissatisfaction with one’s position, envy of others, and a materialistic
mentality. Bhagavad-gita [18:24, p. 815] describes rajasic activity as “action performed with
great effort by one seeking to gratify his desires, and enacted from a sense of false ego,” and a
person predominated by rajas guna is described as “greedy, always envious, impure, and moved
by joy and sorrow” [18:27, p. 817].
Qualities associated with tamas guna include mental imbalance, anger, ignorance, arrogance,
depression, laziness, procrastination, and a feeling of helplessness. Dasgupta (1961) explains that
“the quality of tamas overcomes the illumination of knowledge and leads to many errors. Tamas,
A Psychometric Analysis of the Three Gunas David Wolf, PhD
6
being a product of ignorance, blinds all living beings and binds them down with carelessness,
idleness and sleep” (p. 462).
Scale Design and Item Development
From the descriptions of the Bhagavad-gita (Prabhupada, 1986) and Dasgupta (1961), fifty
statements were formulated for each guna. These took the form of sentences with which
someone who is predominated by that mode would strongly agree. Utilizing feedback from a
team of five Vedic scholars, each of whom had more than twenty years experience studying and
teaching the Vedas, the item sample was reduced to ninety items that were considered most
representative of the gunas, and that would best differentiate between the guna constructs.
According to the Vedic experts, these ninety items, comprised of 30 for sattva guna, 28 for rajas
guna, and 32 for tamas guna, adequately covered the domain of attributes for each mode. To
further determine content validity, two Vedic authorities, who had not previously been exposed
to any of the items, each completed three copies of the 90-item questionnaire. On each copy,
they answered as if they were primarily influenced by one of the gunas. Then their responses
were compared to the expected responses for each item. For example, a sattva item would be
expected to receive a response of “very strongly agree” when the Vedic experts answered as if
they were predominated by sattva, and a response of disagreement or less agreement if they were
predominated by rajas or tamas. Based on this analysis, the wording of some items was changed
to accentuate the differences between the modes. Also, this procedure indicated that several
items, while primarily representative of one mode, would be expected to load heavily on another
mode. Specifically, many rajas items were predicted to have strong secondary loadings on
tamas.
A seven-point scale was chosen as a balance between convenience, for the participant and
researcher, and statistical power. Given the relatively large number of items in the instrument,
nine or eleven response choices would not significantly strengthen statistical determinations.
Still, to minimize chances of spurious outcomes, especially in factor analyses, a seven-point
scale was chosen over a five-point scale.
A Psychometric Analysis of the Three Gunas David Wolf, PhD
7
For convergent construct validity, two existing scales, the Verbal Aggressiveness Scale
(VAS) (Infante & Wigley, 1986) and the Satisfaction With Life Scale (SWLS) (Diener,
Emmons, Larsen, & Griffin, 1985), were included at the end of the VPI. Existing personality
inventories based on the gunas were not used for convergent validity because there are no
reliability studies for these instruments. Also, it would have been impractical to administer two
lengthy surveys with similar questions. The scores on the VAS were hypothesized, based on
Vedic theory, to correlate positively with rajas and negatively with sattva, and the scores on the
SWLS were expected to correlate positively with scores on the sattva scale and negatively with
the tamas scale. Also, a single-item indicator, hours of sleep per day, was included at the end of
the survey. This indicator was hypothesized to correlate positively with tamas, as excessive sleep
is a characteristic of one in tamas. Additionally, six demographic questions, pertaining to gender,
age, years of education, ethnicity, religion practiced and religion of parents, were asked. Gender
was included as a measure of discriminant validity, as it was not expected to correlate with any
of the modes, and the other demographic questions were included for possible use in future
analysis of the instrument.
Based on assessment of Cronbach’s alpha reliability, content validity, and confirmatory,
multiple groups centroid factorial analysis (Nunnally & Bernstein, 1994), each item was
evaluated and the 90-item scale was reduced to an 80-item scale, consisting of 28 sattva items,
24 rajas items, and 28 tamas items. In the version of the 80-item VPI that was distributed to
subjects, two additional questions, regarding height and number of siblings, were added to more
thoroughly evaluate discriminant construct validity.
Data Collection
The author and two research assistants administered the questionnaire to voluntary
participants in a mid-sized Southern city in the United States in November of 1996. Anonymity
of subjects was maintained, as surveys were returned to a box, without the participants’ identity
being revealed to the researcher. This was a nonprobability convenience sample of 247 persons,
A Psychometric Analysis of the Three Gunas David Wolf, PhD
8
consisting of 52.5% males and 47.5% females. Eighty-four percent of the sample was Euro-
American, with the remaining 16% being African-American and Asian-American. University
students comprised 41% of the sample, while nurses and doctors constituted 14%. Other
occupations represented in the sample included clerical work, physical labor, and social services.
More than 93% of the participants were raised in Christian homes, and more than 67% currently
practice some form of Christianity. The mean years of education for participants was 14.9, and
their ages ranged from 18 to 64 years, with a mean of 32.5.
A combination of Cronbach’s alpha analyses, multiple groups factor analyses (Nunnally &
Bernstein, 1994) and evaluation of content validity applied to the data from the above sample
resulted in an 80-item scale, consisting of 28 sattva items, 24 rajas items, and 28 tamas items.
During January, 1998, this 80-item scale was administered to 247 persons. For the combined 494
person sample, there were 257 (52%) (females) and 237 (48%) males. Seventy-two percent of
the 494 persons was Euro-American, 20% was African-American, and 8% was Asian-American.
Of the 494 subjects, 287 (58%) were university students and 124 (25%) were medical
professionals. The average number of years of education for participants was 15.3, and their ages
ranged from 18 to 64 years, with a mean of 31.9. For the January, 1998 sample, two items, height
and number of siblings, were added to the survey for assessing discriminant construct validity.
From July through December, 1998, the 80-item VPI was completed by 125 subscribers to a
magazine dealing with Eastern-style spirituality. This version of the VPI did not include any
demographic items or scales for construct validity.
Results and Data Analysis
Descriptive Statistics
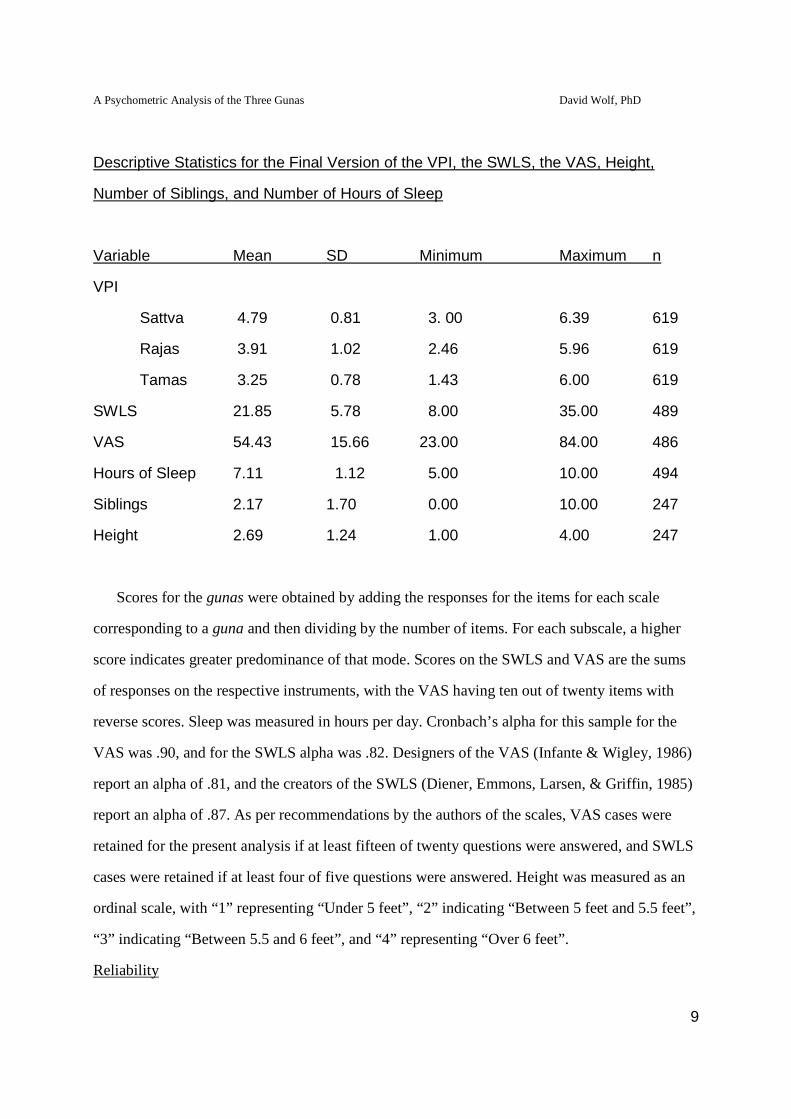
After statistical analysis of all 619 surveys, a final 56-item scale was created1. Table 1
provides descriptive statistics for the revised, 56-item version of the VPI.
Table 1
A Psychometric Analysis of the Three Gunas David Wolf, PhD
9
Descriptive Statistics for the Final Version of the VPI, the SWLS, the VAS, Height,
Number of Siblings, and Number of Hours of Sleep
Variable Mean SD Minimum Maximum n
VPI
Sattva 4.79 0.81 3. 00 6.39 619
Rajas 3.91 1.02 2.46 5.96 619
Tamas 3.25 0.78 1.43 6.00 619
SWLS 21.85 5.78 8.00 35.00 489
VAS 54.43 15.66 23.00 84.00 486
Hours of Sleep 7.11 1.12 5.00 10.00 494
Siblings 2.17 1.70 0.00 10.00 247
Height 2.69 1.24 1.00 4.00 247
Scores for the gunas were obtained by adding the responses for the items for each scale
corresponding to a guna and then dividing by the number of items. For each subscale, a higher
score indicates greater predominance of that mode. Scores on the SWLS and VAS are the sums
of responses on the respective instruments, with the VAS having ten out of twenty items with
reverse scores. Sleep was measured in hours per day. Cronbach’s alpha for this sample for the
VAS was .90, and for the SWLS alpha was .82. Designers of the VAS (Infante & Wigley, 1986)
report an alpha of .81, and the creators of the SWLS (Diener, Emmons, Larsen, & Griffin, 1985)
report an alpha of .87. As per recommendations by the authors of the scales, VAS cases were
retained for the present analysis if at least fifteen of twenty questions were answered, and SWLS
cases were retained if at least four of five questions were answered. Height was measured as an
ordinal scale, with “1” representing “Under 5 feet”, “2” indicating “Between 5 feet and 5.5 feet”,
“3” indicating “Between 5.5 and 6 feet”, and “4” representing “Over 6 feet”.
Reliability
A Psychometric Analysis of the Three Gunas David Wolf, PhD
10
Each guna constitutes a subscale, and internal reliability for each subscale was measured
using Cronbach’s alpha. For the 90-item VPI, alpha for the sattva scale was .85, for rajas it was
.92, and for tamas it was .90.
Using SPSS statistical software for Macintosh, Alpha if Item Deleted was computed for each
item in each subscale. Alpha if Item Deleted values indicate Cronbach’s alpha for the subscale if
the item was not included in the subscale. If Alpha if Item Deleted is lower than alpha for the
subscale, this means that the item increases alpha, and thus adds to the reliability of the subscale.
If Alpha if Item Deleted is higher than alpha for the subscale, this indicates that the item weakens
the reliability of the subscale (Nunnally & Bernstein, 1994).
For the sattva subscale, two items had an Alpha if Item Deleted that was higher than alpha
for the sattva subscale, and these two items were deleted from the subscale. Alpha for the 28-
item sattva subscale was then calculated as .87.
In the rajas subscale, four items had an Alpha if Item Deleted that was higher than alpha for
the subscale, and these four items were removed from the scale. Alpha for the 24-item rajas
subscale was then calculated as .93.
For the tamas subscale, four items had an Alpha if Item Deleted that was higher than alpha
for the subscale, and these four items were removed from the scale. Alpha for the 28-item tamas
subscale was then calculated as .91.
As described above in the data collection section, the 80-item VPI was administered to 372
subjects. Reliability analyses were performed for the entire sample of 619 persons. In this
analysis Alpha if Item Deleted was calculated for each item, as was Corrected Item-Total
Correlation. Hudson and Faul (1997) explain that Corrected Item-Total correlations are an
assessment of convergent construct validity at the item level of analysis, and they recommend a
criteria of .50 as a cutoff point for retention of items. This criteria was applied to the statistical
analysis of the 80-item VPI, as was the criteria that each item had to have an Alpha if Item
Deleted lower than the alpha for the subscale.
A Psychometric Analysis of the Three Gunas David Wolf, PhD
11
Using the criteria described above, the sattva subscale retained 15 items and had an alpha of
.93. The rajas subscale retained 19 items and had an alpha of .94, and the tamas subscale
retained 22 items and had an alpha of .94. This resulted in a final VPI with 56 items, with each
item having a Corrected Item-Total Correlation greater than .50, and each item adding to the
reliability of its subscale, as measured by Cronbach’s alpha2.
Construct Validity
Correlations of the subscales with the VAS and SWLS, as well as with hours of sleep per
day, were calculated as measures of convergent validity. All correlations in this analysis are
Pearson product-moment (r) correlations.
Vedic theory predicts that verbal aggressiveness is positively correlated with rajas and
negatively correlated with sattva, and that life satisfaction correlates positively with sattva and
negatively with tamas (Dasgupta, 1961). Hours of sleep was predicted to be positively correlated
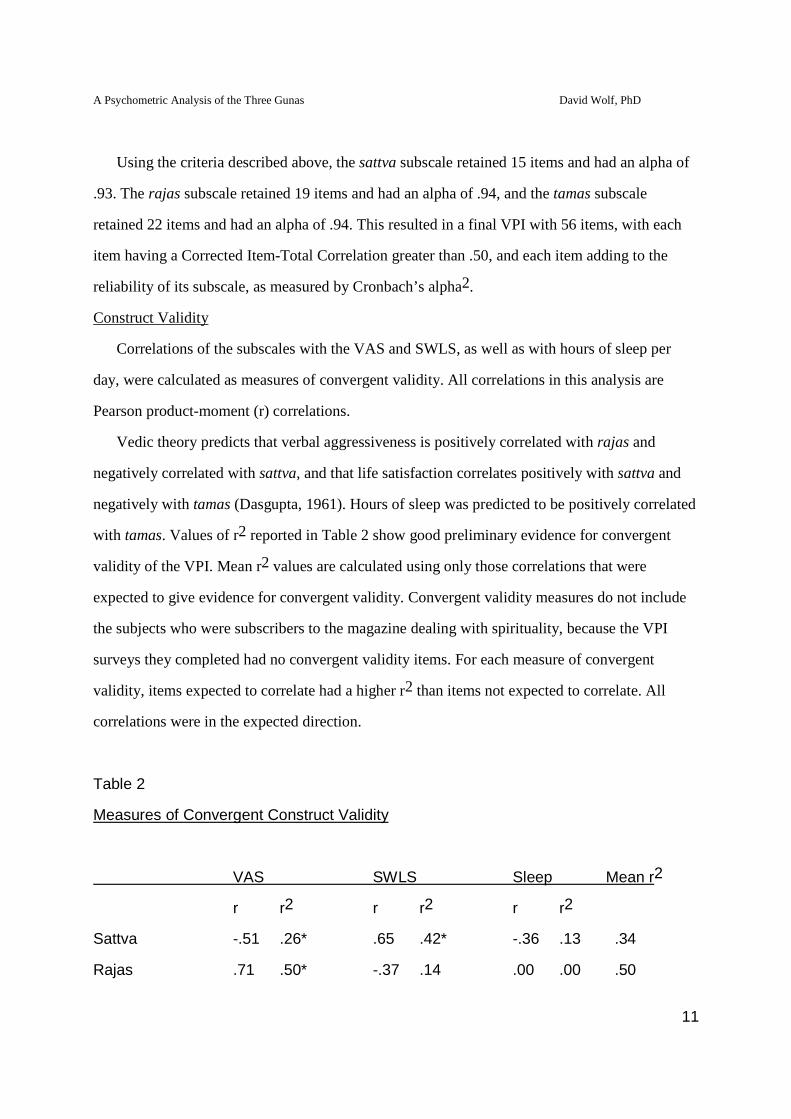
with tamas. Values of r2 reported in Table 2 show good preliminary evidence for convergent
validity of the VPI. Mean r2 values are calculated using only those correlations that were
expected to give evidence for convergent validity. Convergent validity measures do not include
the subjects who were subscribers to the magazine dealing with spirituality, because the VPI
surveys they completed had no convergent validity items. For each measure of convergent
validity, items expected to correlate had a higher r2 than items not expected to correlate. All
correlations were in the expected direction.
Table 2
Measures of Convergent Construct Validity
VAS SWLS Sleep Mean r2
r r2 r r2 r r2
Sattva -.51 .26* .65 .42* -.36 .13 .34
Rajas .71 .50* -.37 .14 .00 .00 .50
A Psychometric Analysis of the Three Gunas David Wolf, PhD
12
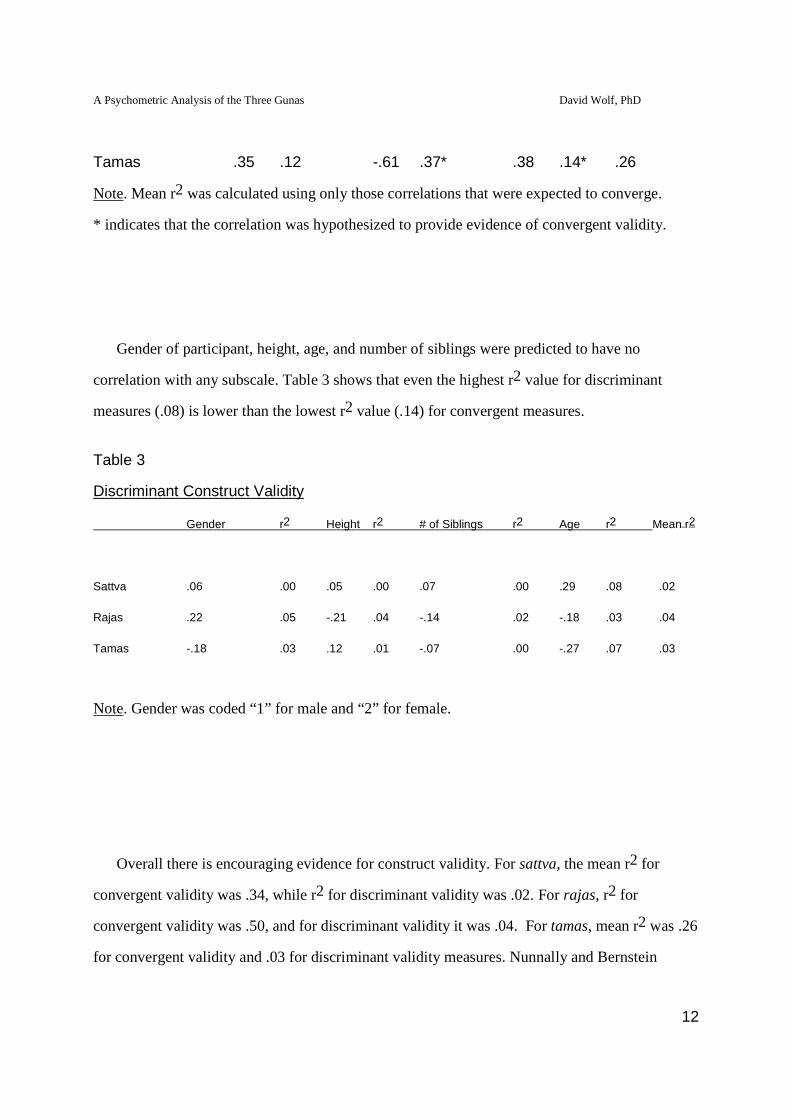
Tamas .35 .12 -.61 .37* .38 .14* .26
Note. Mean r2 was calculated using only those correlations that were expected to converge.
* indicates that the correlation was hypothesized to provide evidence of convergent validity.
Gender of participant, height, age, and number of siblings were predicted to have no
correlation with any subscale. Table 3 shows that even the highest r2 value for discriminant
measures (.08) is lower than the lowest r2 value (.14) for convergent measures.
Table 3
Discriminant Construct Validity
Gender r2 Height r2 # of Siblings r2 Age r2 Mean r2
Sattva .06 .00 .05 .00 .07 .00 .29 .08 .02
Rajas .22 .05 -.21 .04 -.14 .02 -.18 .03 .04
Tamas -.18 .03 .12 .01 -.07 .00 -.27 .07 .03
Note. Gender was coded “1” for male and “2” for female.
Overall there is encouraging evidence for construct validity. For sattva, the mean r2 for
convergent validity was .34, while r2 for discriminant validity was .02. For rajas, r2 for
convergent validity was .50, and for discriminant validity it was .04. For tamas, mean r2 was .26
for convergent validity and .03 for discriminant validity measures. Nunnally and Bernstein
A Psychometric Analysis of the Three Gunas David Wolf, PhD
13
(1994) explain that r2 is a measure of the proportion of variance explained. The low average r2
values, ranging from .02 to .04, indicate that the discriminant measures account for only a trivial
percentage of the variance, as predicted by Vedic theory. Rosenthal (1997) states that r values
about .50 indicate strong association, and r values about .7 indicate very strong association. This
means that the convergent indicators for sattva have a strong to very strong association with
sattva (average r = .58), the indicators for rajas have a very strong association with rajas
(average r = .71), and the indicators for tamas have a strong association with tamas (average r =
.51).
Factorial Validity
Factorial validity for the VPI was assessed using the confirmatory, multiple groups centroid
method. Loadings for each item of the 56-item VPI were computed for each of the three
subscales. Factorial validity indicates the extent to which an item correlates with the subscale
with which it is intended, as compared to other subscales (Nunnally & Bernstein, 1994).
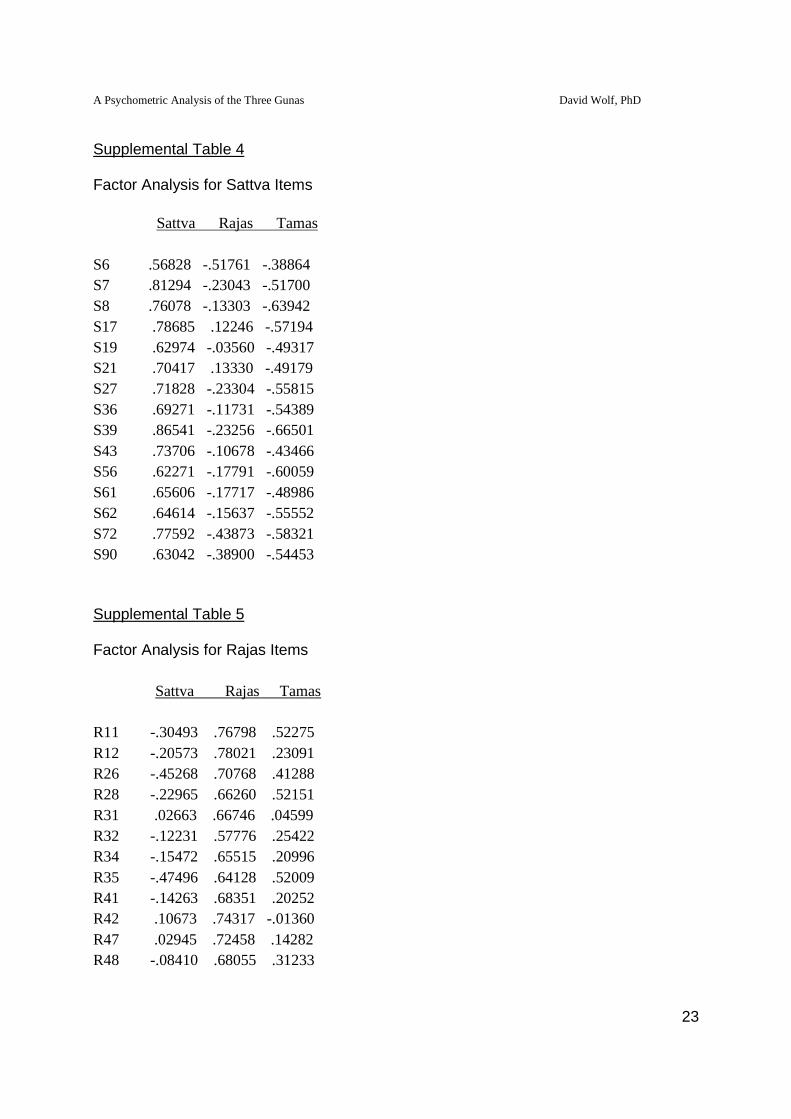
For the 15 items in the sattva subscale, correlations between the items and the sattva subscale
ranged from +.62 to +.87. Absolute values of the correlations of the rajas subscale with
individual items in the sattva subscale ranged from .04 to .51, with only 3 of 15 items having a
correlation with an absolute value greater than .23. Absolute values of the correlations of the
tamas subscale with individual items in the sattva subscale ranged from .43 to .67. All 15 of
these correlations had negative values, and two of them had absolute values greater than .62 (the
lowest value for sattva subscale correlations with sattva items). For these two items, however,
the correlation with the sattva subscale was stronger than the correlation with the tamas subscale.
For the 19 items in the rajas subscale, correlations between the items and the rajas subscale
ranged from +.57 to +.80. Absolute values for the correlations of the sattva subscale with
individual items in the rajas subscale ranged from .02 to .47, with only 3 of 19 correlations
having a correlation with an absolute value greater than .30. Absolute values of the correlations
of the tamas subscale with individual items in the rajas subscale ranged from .01 to .52. Only 1
of these 19 correlations (-.01) had a negative value, and 18 had positive values.
A Psychometric Analysis of the Three Gunas David Wolf, PhD
14
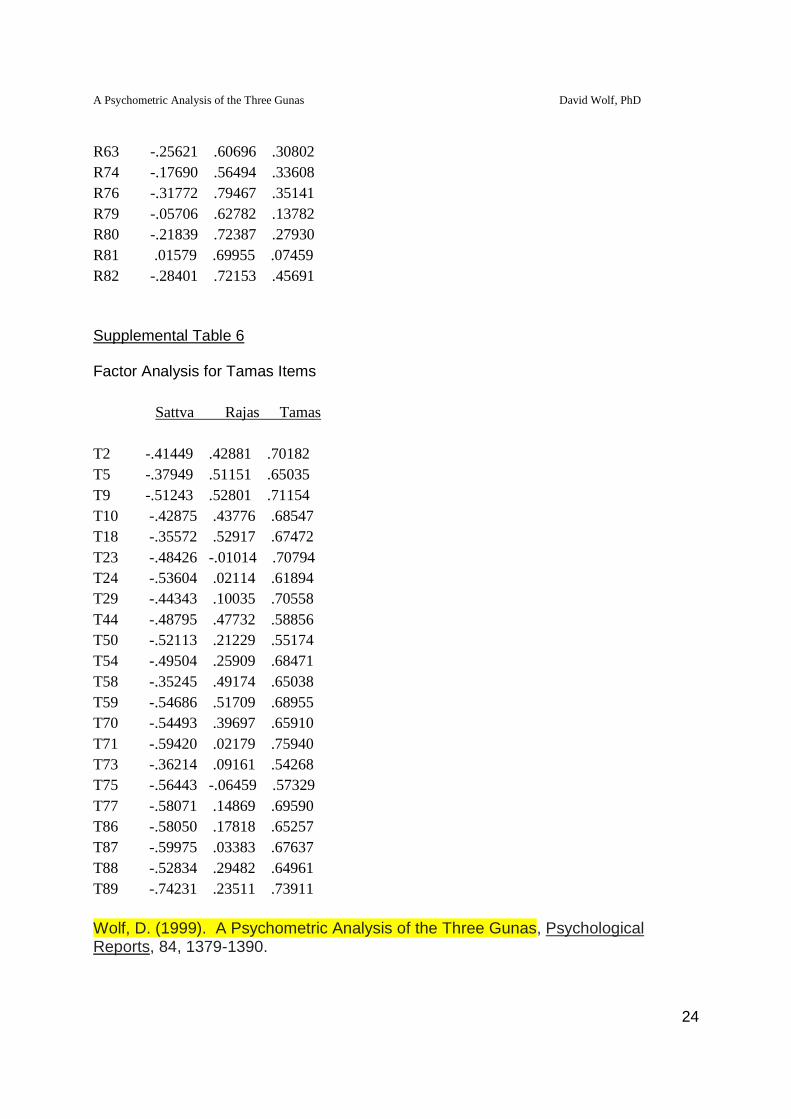
For the 22 items in the tamas subscale, correlations between the individual items and the
tamas subscale ranged from +.55 to +.76. Absolute values for the correlations of the rajas
subscale with individual items in the tamas subscale ranged from .01 to .53. Two of these
correlations had negative values (-.01 and -.06), and 20 had positive values. Absolute values of
the correlations of the sattva subscale with individual items in the tamas subscale ranged from
.35 to .74, with all 22 items possessing negative values. Although some items in the tamas
subscale had correlations with the sattva subscale with an absolute value greater than .55, every
item in the tamas subscale had a correlation with the tamas subscale that was higher than its
correlation with the sattva subscale.
These factor analyses3 demonstrate that every item in the VPI has a strong correlation with
its intended subscale, and the strongest correlation for every item is with its intended subscale.
However, some items in the sattva and tamas subscales have strong negative correlations,
defined as correlations that are stronger than the weakest item’s correlation with the intended
subscale, with an unintended subscale. These results suggest that Vedic guna theory can be
considered a “weak” theory for psychometric purposes. Nunnally and Bernstein (1994) explain
that a “weak” theory is suitably tested with a confirmatory, multiple groups centroid method, as
used in this investigation. A “weak” theory is concerned with whether or not proposed groupings
of variables exist. However, such a theory does not assume that the factor structure underlying
these groupings are the only possible explanatory classification. When assessing a “weak”
theory, independence of factors is not assumed.
With regards to this investigation of the three gunas, analyses of reliability and construct
validity suggest that the three gunas are a viable categorization scheme. That is, the analyses
indicate that the elements comprising each of the gunas as described in the Vedas are congeneric,
with a single factor underlying each of the three combinations of attributes, as delineated by the
items of the VPI. Multiple groups centroid factor analysis (Nunnally & Bernstein, 1994) support
this conclusion, though factor analyses also imply that the constructs are not orthogonal. This is
further evidenced by inter-subscale correlations, which are shown in Table 4. These correlations
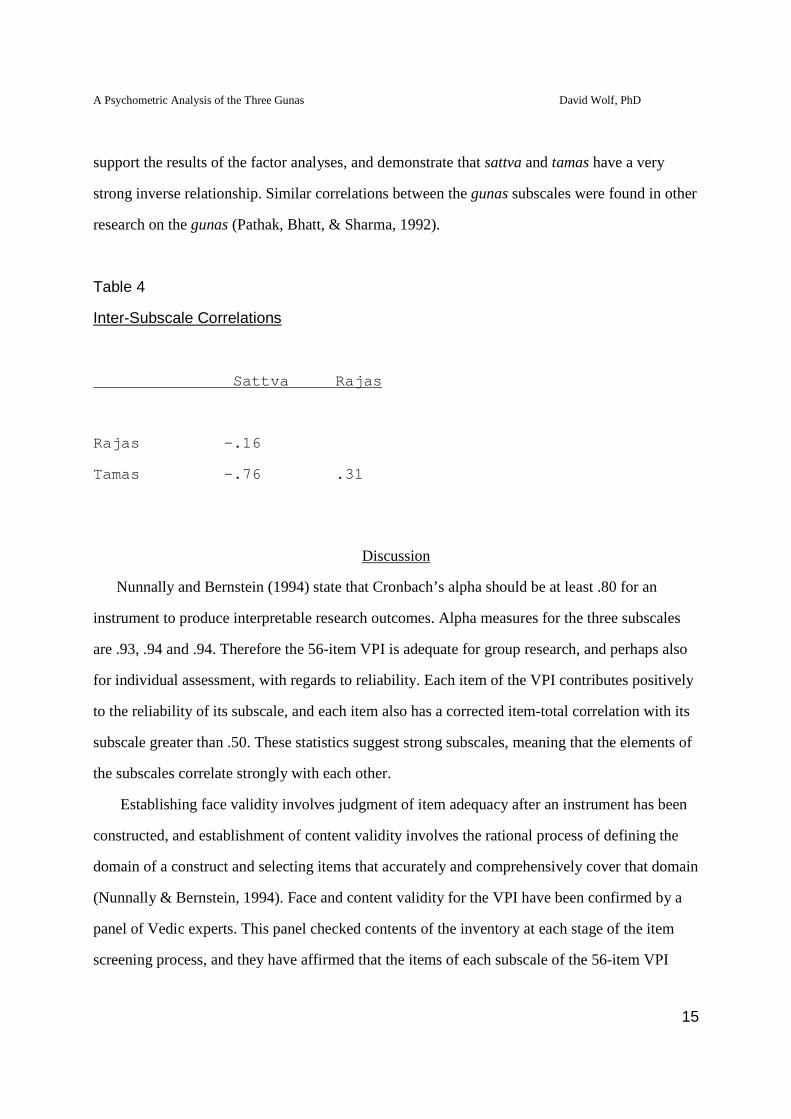
A Psychometric Analysis of the Three Gunas David Wolf, PhD
15
support the results of the factor analyses, and demonstrate that sattva and tamas have a very
strong inverse relationship. Similar correlations between the gunas subscales were found in other
research on the gunas (Pathak, Bhatt, & Sharma, 1992).
Table 4
Inter-Subscale Correlations
Sattva Rajas
Rajas -.16
Tamas -.76 .31
Discussion
Nunnally and Bernstein (1994) state that Cronbach’s alpha should be at least .80 for an
instrument to produce interpretable research outcomes. Alpha measures for the three subscales
are .93, .94 and .94. Therefore the 56-item VPI is adequate for group research, and perhaps also
for individual assessment, with regards to reliability. Each item of the VPI contributes positively
to the reliability of its subscale, and each item also has a corrected item-total correlation with its
subscale greater than .50. These statistics suggest strong subscales, meaning that the elements of
the subscales correlate strongly with each other.
Establishing face validity involves judgment of item adequacy after an instrument has been
constructed, and establishment of content validity involves the rational process of defining the
domain of a construct and selecting items that accurately and comprehensively cover that domain
(Nunnally & Bernstein, 1994). Face and content validity for the VPI have been confirmed by a
panel of Vedic experts. This panel checked contents of the inventory at each stage of the item
screening process, and they have affirmed that the items of each subscale of the 56-item VPI

A Psychometric Analysis of the Three Gunas David Wolf, PhD
16
adequately cover the domain of each mode. The three items assessed for convergent validity-
verbal aggressiveness, life satisfaction, and hours of sleep- all provide evidence for construct
validity of the instrument. Further, the four items evaluated for discriminant validity- gender,
age, height, and number of siblings- also support construct validity of the VPI. Bloom, Fischer,
and Orme (1995) explain that construct validity is a measure of the extent to which empirically
observed relationships between measures of concepts agree with theoretically predicted
interrelationships between concepts. The results of convergent and discriminant validity
measures in this study provide evidence for the construct validity of the VPI. Multiple groups
factor analyses (Nunnally & Bernstein, 1994) support the categorization scheme of the three
gunas, and they also support the assertion of Vedic theory that sattva and tamas are inversely
correlated, with rajas as an intermediary mode.
Overall, the hypotheses of the Vedas concerning the gunas are supported by this research.
Items of each subscale array themselves as a unit, and guna theory is further supported by
measures of constructs such as life satisfaction, verbal aggressiveness and gender.
Test-retest reliability of the VPI should be conducted. Such testing will indicate the potential
usefulness of the instrument for both group experimental work and assessment of individuals.
Also, to facilitate practical utilization, alternate forms of the scale can be developed to remove
testing effects among subjects. For further testing of the validity of the instrument, the VPI can
be correlated with additional measures of convergent validity. For instance, the rajas subscale,
which in this investigation was evaluated for only one measure of convergent validity, can be
correlated with a standardized measure of stress, and tamas can be correlated with a standardized
measure of depression. Future statistical analysis of the VPI should evaluate floor and ceiling
effects of the items and subscales. In addition, the instrument should be tested on a wide variety
of populations, in order to establish norms for the subscales and also to determine the
transcultural value of the VPI.
Currently the VPI is being used in a group experiment on the effects of chanting the maha
mantra, which is a mantra predicted in the Vedas (Prabhupada, 1976) to increase sattva and
A Psychometric Analysis of the Three Gunas David Wolf, PhD
17
decrease rajas and tamas. There are many potential applications of the instrument, in group
experimentation as well as individual analysis. In the Vedic tradition guna theory is the basis for
vocational guidance (Dasgupta, 1961), and the VPI could be applied, experimentally at first, for
that purpose. To do this, the evaluators would need to become acquainted with guna theory as it
applies to career orientation. In individual assessment, the VPI can be used as a measure of
change. For instance, an intervention for a client with a depressive disorder would be expected to
result in an increase in the sattva subscale score and a decrease in the tamas subscale score, and a
client with a stress-related disorder would be expected to decrease the rajas subscale score and
increase the sattva subscale score if therapy is successful.
<end>
References
Bloom, M., Fischer, J., & Orme, J. G. (1995). Evaluating practice: Guidelines for the
accountable professional, (2nd ed). Needham Heights, Massachussets: Allyn and Bacon.
Das, R.C. (1991). Standardization of the Gita Inventory of Personality. Journal of Indian
Psychology, 9, 47-55.
Dasgupta, S. (1961). A History of Indian Philosophy. Great Britain: Cambridge University
Press.
Diener, E., Emmons, R. A., Larsen, R. J., & Griffin, S. (1985). The satisfaction with life scale.
Journal of Personality Assessment, 49, 71-75.
Faul, A. C., & Hudson, W. (1997). The Index of Drug Involvement: A partial validation. Social
Work, 42 (6), 565-572.
Gergen, K.J., Gulerce, A., Lock, A., & Misra, G. (1996). Psychological science in cultural
context. American Psychologist, 51 (5), 496-503.
Goswami, S. D. (1977). Readings in Vedic literature: The tradition speaks for itself. Los
Angeles: Bhaktivedanta Book Trust.
A Psychometric Analysis of the Three Gunas David Wolf, PhD
18
Infante, D. A. & Wigley, C. J., III. (1986). Verbal aggressiveness: An interpersonal model and
measure. Communication Monographs, 53, 61-69.
Mohan, V., & Sandhu, S. (1986). Development of scale to measure sattvic, rajasic and tamasic
guna. Journal of Indian Academy of Applied Psychology, 12, 46-52.
Mohan, V., & Sandhu, S. (1988). Samkhyan tri-guna and Eyesenck’s dimensions of
personality. The Vedic Path, 23-38.
Nunnally, J. C., & Bernstein, I.H. (1994). Psychometric Theory (3rd Ed.). New York: McGraw-
Hill.
Pathak, N. S., Bhatt, I. D., & Sharma, R. (1992). Manual for classifying personality on
tridimensions of gunas- An Indian approach. Indian Journal of Behaviour, 16 (4), 1-14.
Prabhupada, A. C. B. S. (1976). Srimad-Bhagavatam. Hong Kong: Bhaktivedanta Book Trust.
Prabhupada, A. C. B. S. (1986). Bhagavad-gita as it is. Los Angeles: Bhaktivedanta Book Trust.
Rao, P. V. K. & Harigopal, K. (1979). The three gunas and ESP: An exploratory investigation.
Journal of Indian Psychology, 2 (1), 63-68.
Rosenthal, J. A. (1996). Qualitative descriptors of strength of association and effect size. Journal
of Social Service Research, 21 (4), 37-59.
Singh, R. (1971). An inventory from Mahabharata. Indian Journal of Psychiatry, 13, 149-161.
Uma, K., Lakshmi, Y.S., & Parameswaran, E.G. (1971). Construction of a personality
inventory based on doctrine of 3 gunas. Research Bulletin, 6, 49-58.

A Psychometric Analysis of the Three Gunas David Wolf, PhD
19
Supplemental Tables
For supplemental tables, S = Sattva, R = Rajas, and T = Tamas.
The numbers of items correspond with the item numbers as
they appear on the 90-item VPI.

A Psychometric Analysis of the Three Gunas David Wolf, PhD
20
Supplemental Table 1
Corrected Item-total Correlation and Alpha if Item Deleted for
Sattva
Scale Scale Corrected
Mean Variance Item- Alpha
if Item if Item Total if Item
Deleted Deleted Correlation Deleted
S6 60.5919 304.4931 .5021 .9267
S7 60.7212 283.1043 .7569 .9192
S8 60.4687 286.8285 .6762 .9220
S17 60.3010 288.3890 .7458 .9196
S19 59.8182 306.4244 .5827 .9245
S21 60.0667 294.1312 .6347 .9231
S27 60.2182 299.3855 .6790 .9220
S36 60.0162 302.2588 .6520 .9228
S39 60.6788 279.7650 .8299 .9167
S43 60.8242 290.1614 .6861 .9215
S56 60.3030 297.7865 .5543 .9256
S61 60.2768 301.1803 .5981 .9240
S62 59.7273 304.1299 .5996 .9240
S72 60.5293 289.9015 .7334 .9201
S90 60.5657 299.6268 .5645 .9251
N of Items = 15 Alpha = .9273
Every item of this 15 item subscale has a corrected item total correlation above .5, and each item increases alpha.
A Psychometric Analysis of the Three Gunas David Wolf, PhD
21
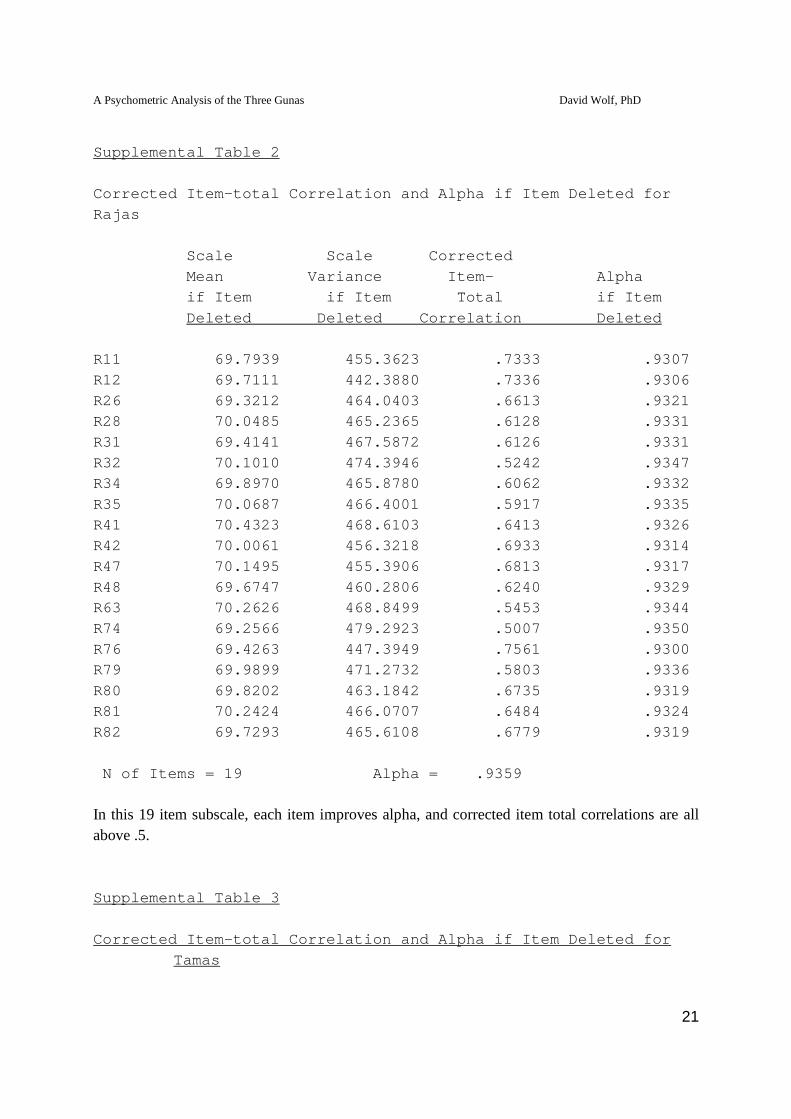
Supplemental Table 2
Corrected Item-total Correlation and Alpha if Item Deleted for
Rajas
Scale Scale Corrected
Mean Variance Item- Alpha
if Item if Item Total if Item
Deleted Deleted Correlation Deleted
R11 69.7939 455.3623 .7333 .9307
R12 69.7111 442.3880 .7336 .9306
R26 69.3212 464.0403 .6613 .9321
R28 70.0485 465.2365 .6128 .9331
R31 69.4141 467.5872 .6126 .9331
R32 70.1010 474.3946 .5242 .9347
R34 69.8970 465.8780 .6062 .9332
R35 70.0687 466.4001 .5917 .9335
R41 70.4323 468.6103 .6413 .9326
R42 70.0061 456.3218 .6933 .9314
R47 70.1495 455.3906 .6813 .9317
R48 69.6747 460.2806 .6240 .9329
R63 70.2626 468.8499 .5453 .9344
R74 69.2566 479.2923 .5007 .9350
R76 69.4263 447.3949 .7561 .9300
R79 69.9899 471.2732 .5803 .9336
R80 69.8202 463.1842 .6735 .9319
R81 70.2424 466.0707 .6484 .9324
R82 69.7293 465.6108 .6779 .9319
N of Items = 19 Alpha = .9359
In this 19 item subscale, each item improves alpha, and corrected item total correlations are all above .5. Supplemental Table 3
Corrected Item-total Correlation and Alpha if Item Deleted for
Tamas
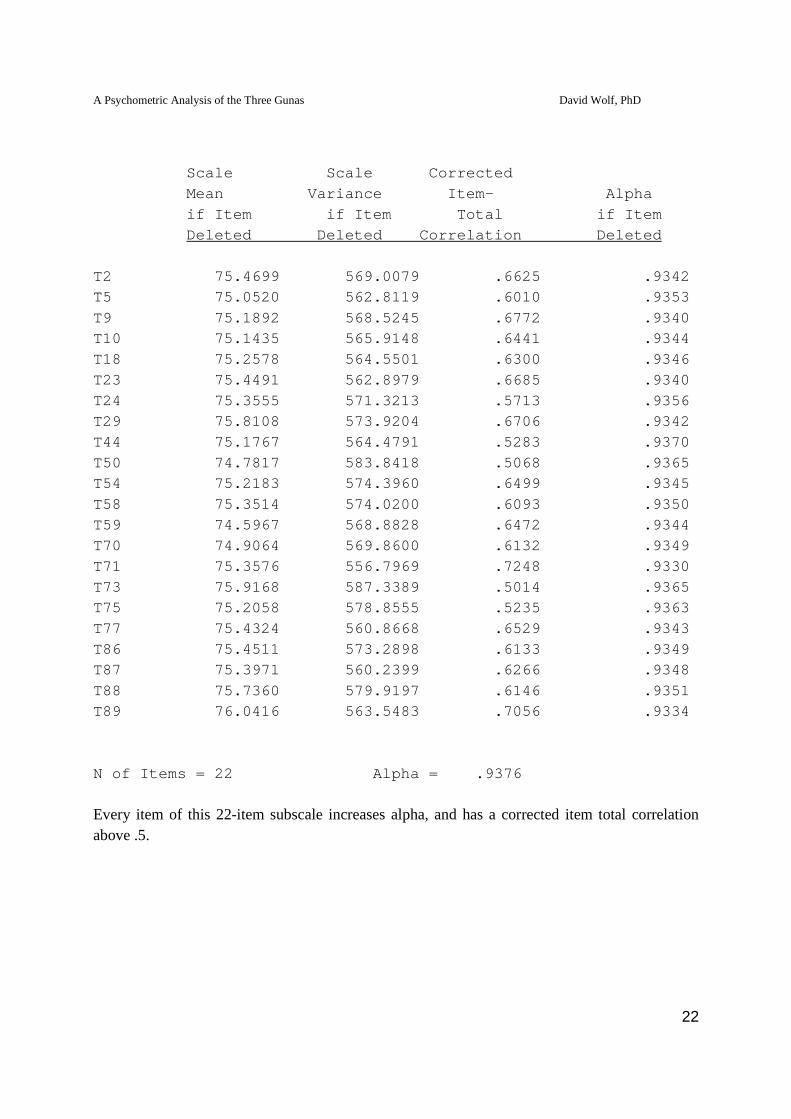
A Psychometric Analysis of the Three Gunas David Wolf, PhD
22
Scale Scale Corrected
Mean Variance Item- Alpha
if Item if Item Total if Item
Deleted Deleted Correlation Deleted
T2 75.4699 569.0079 .6625 .9342
T5 75.0520 562.8119 .6010 .9353
T9 75.1892 568.5245 .6772 .9340
T10 75.1435 565.9148 .6441 .9344
T18 75.2578 564.5501 .6300 .9346
T23 75.4491 562.8979 .6685 .9340
T24 75.3555 571.3213 .5713 .9356
T29 75.8108 573.9204 .6706 .9342
T44 75.1767 564.4791 .5283 .9370
T50 74.7817 583.8418 .5068 .9365
T54 75.2183 574.3960 .6499 .9345
T58 75.3514 574.0200 .6093 .9350
T59 74.5967 568.8828 .6472 .9344
T70 74.9064 569.8600 .6132 .9349
T71 75.3576 556.7969 .7248 .9330
T73 75.9168 587.3389 .5014 .9365
T75 75.2058 578.8555 .5235 .9363
T77 75.4324 560.8668 .6529 .9343
T86 75.4511 573.2898 .6133 .9349
T87 75.3971 560.2399 .6266 .9348
T88 75.7360 579.9197 .6146 .9351
T89 76.0416 563.5483 .7056 .9334
N of Items = 22 Alpha = .9376
Every item of this 22-item subscale increases alpha, and has a corrected item total correlation above .5.
A Psychometric Analysis of the Three Gunas David Wolf, PhD
23
Supplemental Table 4 Factor Analysis for Sattva Items Sattva Rajas Tamas S6 .56828 -.51761 -.38864 S7 .81294 -.23043 -.51700 S8 .76078 -.13303 -.63942 S17 .78685 .12246 -.57194 S19 .62974 -.03560 -.49317 S21 .70417 .13330 -.49179 S27 .71828 -.23304 -.55815 S36 .69271 -.11731 -.54389 S39 .86541 -.23256 -.66501 S43 .73706 -.10678 -.43466 S56 .62271 -.17791 -.60059 S61 .65606 -.17717 -.48986 S62 .64614 -.15637 -.55552 S72 .77592 -.43873 -.58321 S90 .63042 -.38900 -.54453 Supplemental Table 5 Factor Analysis for Rajas Items Sattva Rajas Tamas R11 -.30493 .76798 .52275 R12 -.20573 .78021 .23091 R26 -.45268 .70768 .41288 R28 -.22965 .66260 .52151 R31 .02663 .66746 .04599 R32 -.12231 .57776 .25422 R34 -.15472 .65515 .20996 R35 -.47496 .64128 .52009 R41 -.14263 .68351 .20252 R42 .10673 .74317 -.01360 R47 .02945 .72458 .14282 R48 -.08410 .68055 .31233
A Psychometric Analysis of the Three Gunas David Wolf, PhD
24
R63 -.25621 .60696 .30802 R74 -.17690 .56494 .33608 R76 -.31772 .79467 .35141 R79 -.05706 .62782 .13782 R80 -.21839 .72387 .27930 R81 .01579 .69955 .07459 R82 -.28401 .72153 .45691 Supplemental Table 6 Factor Analysis for Tamas Items Sattva Rajas Tamas T2 -.41449 .42881 .70182 T5 -.37949 .51151 .65035 T9 -.51243 .52801 .71154 T10 -.42875 .43776 .68547 T18 -.35572 .52917 .67472 T23 -.48426 -.01014 .70794 T24 -.53604 .02114 .61894 T29 -.44343 .10035 .70558 T44 -.48795 .47732 .58856 T50 -.52113 .21229 .55174 T54 -.49504 .25909 .68471 T58 -.35245 .49174 .65038 T59 -.54686 .51709 .68955 T70 -.54493 .39697 .65910 T71 -.59420 .02179 .75940 T73 -.36214 .09161 .54268 T75 -.56443 -.06459 .57329 T77 -.58071 .14869 .69590 T86 -.58050 .17818 .65257 T87 -.59975 .03383 .67637 T88 -.52834 .29482 .64961 T89 -.74231 .23511 .73911 Wolf, D. (1999). A Psychometric Analysis of the Three Gunas, Psychological Reports, 84, 1379-1390.