A PROTEOMIC APPROACH FOR IDENTIFYING BORON-STRESS TOLERANT PROTEINS … · 2016-12-23 · A...
98
A PROTEOMIC APPROACH FOR IDENTIFYING BORON-STRESS TOLERANT PROTEINS IN BARLEY GENOTYPES A Thesis Submitted to the Graduate School of Engineering and Sciences of İzmir Institute of Technology in Partial Fulfillment of the Requirements for the Degree of MASTER OF SCIENCE in Chemistry by Ahmet Emin ATİK December 2007 İZMİR
Transcript of A PROTEOMIC APPROACH FOR IDENTIFYING BORON-STRESS TOLERANT PROTEINS … · 2016-12-23 · A...
1
A PROTEOMIC APPROACH FOR IDENTIFYING BORON-STRESS TOLERANT PROTEINS IN
BARLEY GENOTYPES
A Thesis Submitted to the Graduate School of Engineering and Sciences of
İzmir Institute of Technology in Partial Fulfillment of the Requirements for the Degree of
MASTER OF SCIENCE
in Chemistry
by Ahmet Emin ATİK
December 2007
İZMİR
2
We approve the thesis of Ahmet Emin ATİK
______________________________ Assoc. Prof. Dr. Talat YALÇIN Supervisor ______________________________ Assist. Prof. Dr. H. Çağlar KARAKAYA Co-Supervisor ______________________________ Prof. Dr. Bekir SALİH Committee Member ______________________________ Prof. Dr. Figen ZİHNİOĞLU Committee Member ______________________________ Assist. Prof. Dr. Gülşah ŞANLI Committee Member 28 December 2007
Date ______________________________ _______________________ Prof. Dr. Levent ARTOK Prof. Dr. Hasan BÖKE Head of the Chemistry Department Dean of the Graduate School of Engineering and Sciences

3
ACKNOWLEDGEMENTS
First of all, I would like to thank my supervisor Assoc. Prof. Dr. Talat YALÇIN,
for his excellent guidance, understanding, endless support and help throughout this
study. I believe, this thesis will not come into life without his great motivations and
encouragement.
I would like to express my grateful thanks to my co-supervisor Assist. Prof. Dr.
H. Çağlar KARAKAYA, for his generous help and valuable comments during thesis
study.
Special thanks are extended to Assist. Prof. Dr. Ahmet KOÇ, for his valuable
contributions and kind helps. I owe my thanks to Plant Molecular Genetics and
Molecular Genetics Laboratory staff.
I am also grateful to my laboratory friends Çağdaş TAŞOĞLU, Alaattin KAYA,
Ersin AKINCI and Ercan Selçuk ÜNLÜ for their sincere help and kindness during
studies.
Also, I wish to acknowledge my colleagues in Chemistry Department in İYTE
for their friendship for past three years and İYTE Scientific Research Project (2006
BAP 20) for funding. Finally, but not the least, words have no meaning when it comes to express my
gratitude to my family. Thanks for all their motivation, inspiration and cooperation
throughout not only this study and also my hopeless times of all through my life. I
extent my sincere appreciation to my brother İsa Doğan ATİK for his comments and
suggestions throughout this study.
iv
ABSTRACT
A PROTEOMIC APPROACH FOR IDENTIFYING BORON-STRESS TOLERANT PROTEINS IN BARLEY GENOTYPES
Boron is an essential micro-nutrient for plants. However, when boron is present
at high concentrations in the soil or ground water, healthy plant growth and
development can be affected by boron toxicity. Turkey constitutes about 72 % of the
total boron reserves in the world. In Turkey, barley (Hordeum vulgare) is the second
widely grown cereal after wheat. Boron toxicity is one of the major factors limiting the
yield of barley in Central Anatolia of Turkey.
In the present study, proteomic approach was used to investigate the boron-
stress tolerant proteins in Anadolu barley genotype (boron-tolerant). Eight-day-old
barley plants were treated with 10 mM H3BO3 for seven days. Control plants received
no boron treatment during this period. Total proteins of leaves were extracted and
separated by two-dimensional polyacrylamide gel electrophoresis. Control and boron-
treated Anadolu genotype’s proteome maps were compared and the novel proteins were
excised from gels which were newly expressed under boron stress. The proteins were
fragmented into peptides using in-gel digestion technique. Liquid chromatography-
tandem mass spectrometry (LC-MS/MS) analysis and database searching gave way to
identify ten spots representing seven different proteins. Two spots were identified as the
same protein and one protein could not identified. The identified seven proteins are
namely, ribulose 1,5-bisphosphate carboxylase/oxygenase large chain (RuBisCo large
chain), thaumatin-like protein TLP5, basic pathogenesis-related protein PR5, RNase S-
like protein, vacuolar proton-translocating ATPase subunit E, PSI type III chlorophyll
a/b-binding protein, and light-harvesting complex I; LHC I.
Among the identified seven proteins, vacuolar proton-translocating ATPase (V-
ATPase) subunit E is the important one for boron tolerance in tolerant barley genotype.
It is shown that the accumulation of excess boron in the vacuolar compartment of the
plant cell by the help of V-ATPase subunit E protein. This is the known as internal
tolerance mechanisms for Anadolu genotype of barley to survive under boron stress. It
was proposed that, this might be the defense mechanism in boron-tolerant barley
genotype under toxic boron concentrations.
v
ÖZET
ARPA GENOTİPLERİNDE BOR-STRESİNE TOLERANSLI PROTEİNLERİN PROTEOMİK YAKLAŞIM İLE TANIMLANMASI
Bor bitkiler için gerekli bir mikro-besindir. Topraktaki veya yer altı suyundaki
fazla miktardaki bor, bor toksikliğine yol açarak bitkinin sağlıklı bir şekilde büyümesi
ve gelişmesini etkiler. Türkiye’de bulunan bor kaynakları dünya toplam bor rezervinin
yaklaşık olarak %72’sini oluşturmaktadır. Arpa (Hordeum vulgare) Türkiye’de
buğdaydan sonra en çok üretilen tahıldır. Bor toksikliği Türkiye’nin Orta
Anadolu’sunda yapılan arpa tarımında verimi sınırlayan bir faktördür.
Bu çalışmada, Anadolu (bora karşı dirençli) arpa genotipinde bor-stresine
toleranslı proteinler proteomik yaklaşım kullanılarak incelenmiştir. Sekiz-günlük arpa
bitkileri yedi gün boyunca 10 mM borik asite maruz bırakılmıştır. Kontrol bitkilerine bu
süre içinde bor uygulanmamıştır. Yapraktaki toplam proteinler izole edilmiştir ve iki
boyutlu poli akrilamit jel elektroforezi kullanılarak birbirlerinden ayrılmışlardır. Kontrol
ve bora maruz bırakılmış Anadolu genotipinin proteom haritaları karşılaştırılmış ve bor
stresi altında oluşan yeni proteinler jelden kesilip çıkartılmıştır. Jel içinde parçalama
tekniği kullanılarak proteinler peptitlere parçalanmıştır. Sıvı kromatografisi-ikili kütle
spektrometresi (LC-MS/MS) analizi ve veritabanı taraması yedisi farklı olan on tane
proteinin tanımlanmasını sağlamıştır. İki tane protein aynı protein olarak tanımlanmıştır
ve bir protein tanımlanamamıştır. Tanımlanan yedi tane proteinin isimleri şöyledir:
ribuloz 1,5-bifosfat karboksilaz/oksijenaz büyük zincir (RuBisCo büyük zincir),
thaumatin-benzer proteini TLP5, bazik patogenez-ilgili protein PR5, RNaz S-benzer
protein, koful proton-translokasyon ATPaz alt birim E proteini, PSI tipi III klorofil a/b-
bağlayıcı protein, ve ışık-toplayan komleks protein I; LHC I.
Tanımlanan yedi tane protein içinde, bora karşı dirençli arpa genotipinin bor
toleransını sağladığı düşünülen koful proton-translokasyon ATPaz (V-ATPaz) alt birim
E proteini en önemli olanıdır. V-ATPaz alt birim E protein sayesinde hücre içindeki
fazla miktardaki bor hücrenin kofulunda biriktirildiği gösterilmiştir. Anadolu arpa
genotipindeki dahili dayanıklılık mekanizması olarak bilinen bu mekanizma bor stresi
altında bitkinin yaşamasını sağlamıştır ve bora karşı dirençli arpa genotipinin toksik bor
konsantrasyonuna dayanıklılık mekanizması olarak önerilmiştir.

vi
Dedicated to;
the memory of my father, grandmother and grandfather
and
my lovely mother for being with me in all my life...
vii
TABLE OF CONTENTS
LIST OF FIGURES ......................................................................................................... ix
LIST OF TABLES........................................................................................................... xi
CHAPTER 1. INTRODUCTION ..................................................................................... 1
1.1. Boron ..................................................................................................... 1
1.1.1. Physical and Chemical Properties................................................... 1
1.1.2. Major Uses and Distribution in Nature........................................... 2
1.2. Boron in Plant Structure and Function .................................................. 3
1.3. Boron Toxicity....................................................................................... 5
1.3.1. Source of Boron .............................................................................. 5
1.3.2. Visible Symptoms of Boron Toxicity in Plants .............................. 6
1.3.3. Plant Tolerance to Boron Toxicity.................................................. 7
1.4. Barley (Hordeum vulgare L.) ................................................................ 8
CHAPTER 2. PROTEOMICS AND MASS SPECTROMETRY.................................. 10
2.1. Origin of Proteomics............................................................................ 10
2.1.1. Why Proteomics?.......................................................................... 11
2.1.2. Types of Proteomics ..................................................................... 12
2.2. Plant Proteomics .................................................................................. 12
2.3. Two-Dimensional Gel Electrophoresis................................................ 14
2.3.1. First Dimension: Isoelectric Focusing .......................................... 16
2.3.1.1. General Guidelines for IEF with IPGs................................ 18
2.3.1.2. IPG Strip Equilibration ....................................................... 22
2.3.2. Second Dimension: SDS-PAGE................................................... 23
2.4. Detection of Protein Spots and Image Analysis .................................. 24
2.5. In-Gel Digestion .................................................................................. 27
2.6. Mass Spectrometry .............................................................................. 28
2.6.1. An Overview of the Instrumentation ............................................ 29
2.6.1.1. Sample Ionization Methods ................................................ 29
2.6.1.1.a. Electrospray Ionization (ESI)................................. 30
viii
2.6.1.1.b. Matrix-Assisted Laser Desorption/Ionization
(MALDI)................................................................. 31
2.6.1.2. Mass Analyzers................................................................... 33
2.6.1.2.a. Time-of-Flight Mass Analzyer (TOF) ................... 33
2.6.1.2.b. Quadrupole Ion Traps ............................................ 35
2.6.1.3. Detectors ............................................................................. 36
2.7. Previous Studies................................................................................... 37
2.8. The Aim of the Study........................................................................... 39
CHAPTER 3. EXPERIMENTAL................................................................................... 40
3.1. Plant Growth Conditions and Boron Treatment .................................. 40
3.2. Protein Extraction from Leaves ........................................................... 41
3.3. Protein Solubilization with Rehydration Buffer .................................. 43
3.3.1. Bradford Protein Assay for Protein Determination ...................... 43
3.4. 2-DE of Total Proteins from Barley Leaves ........................................ 46
3.4.1. Isoelectric Focusing ...................................................................... 46
3.4.2. Equilibration of Strips................................................................... 48
3.4.3. SDS-PAGE ................................................................................... 48
3.4.4. Staining and Destaining of Gels ................................................... 50
3.4.5. Image and Data Analysis of Gels ................................................. 51
3.5. In-Gel Digestion .................................................................................. 52
3.6. Protein Identification and Mass Spectrometric Analysis..................... 55
CHAPTER 4. RESULTS AND DISCUSSION.............................................................. 57
4.1. Effects of Boron Toxicity on Growth .................................................. 57
4.2. Boron-Stress Responsive Proteins in Barley Leaves........................... 59
4.3. Comparative Proteome Analysis of Sahara Leaves............................. 71
CHAPTER 5. CONCLUSION ....................................................................................... 76
REFERENCES ............................................................................................................... 78
ix
LIST OF FIGURES
Figure Page
Figure 1.1. Cell Wall Boron-Rhamnogalacturonan II (RG-II-B) Complex. .................... 4
Figure 1.2. World Barley Producers by the Year of 2005/06. .......................................... 8
Figure 2.1. Overview of the Currently Available Disciplines for Large-Scale
Analyses of Genes, Transcripts, Proteins and Metabolites........................... 10
Figure 2.2. Schematic Representation of 2-DE SDS-PAGE. ......................................... 16
Figure 2.3. The Picture of IPG Strips with Different pH Ranges and Lengths. ............. 17
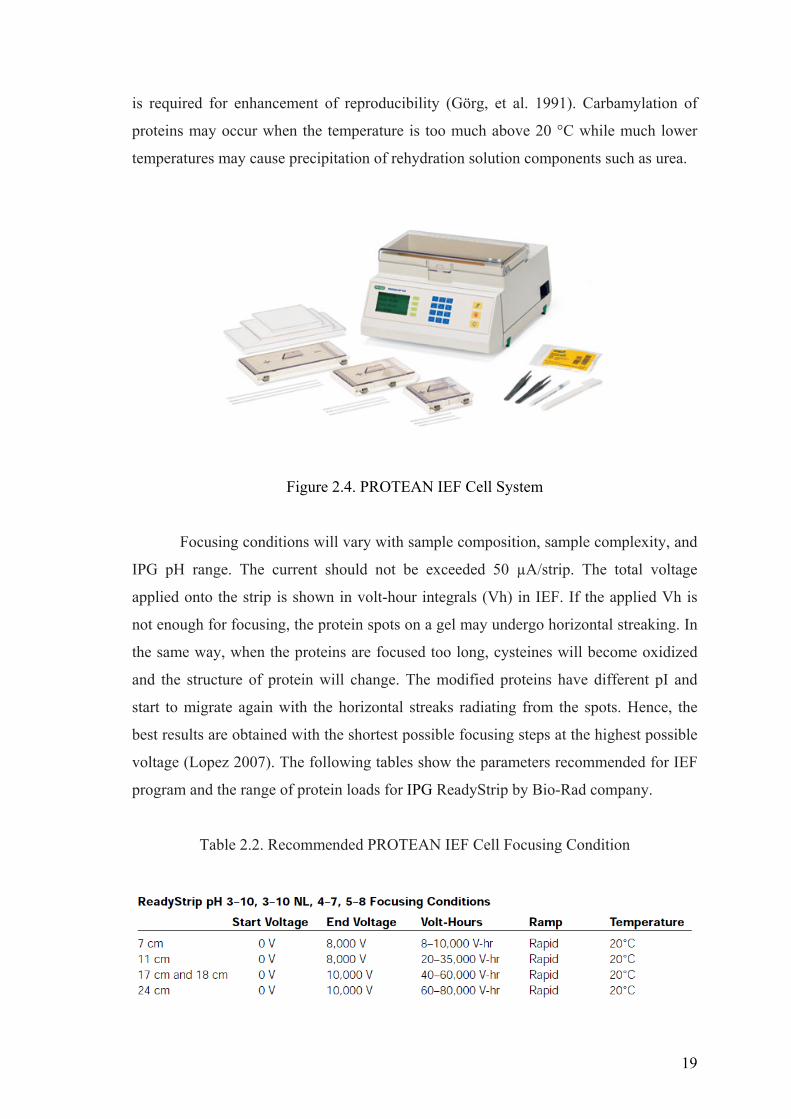
Figure 2.4. PROTEAN IEF Cell System. ....................................................................... 19
Figure 2.5. The Structure of Coomassie Blue Dye ......................................................... 25
Figure 2.6. Schematic Representation of In-Gel Digestion ............................................ 27
Figure 2.7. Schematic Representation of Mass Spectrometer ........................................ 29
Figure 2.8. Schematic Representation of an ESI Source. ............................................... 31
Figure 2.9. Formation of Ions in MALDI. ...................................................................... 32
Figure 2.10. A Schematic of a Time-of-Flight Mass Spectrometer Operatting in
Reflectron Mode. ........................................................................................ 34
Figure 2.11. A MALDI-TOF Instrument Equipped with a Reflectron .......................... 35
Figure 2.12. Schematic Representation of an Ion-Trap. ................................................. 36
Figure 3.1. The Photograph of Control and Boron-Treated Barley Genotypes,
from Left to Right, Hamidiye Control (HC), Hamidiye Boron (HB),
Anadolu Control (AC), Anadolu Boron (AB), respectively. ........................ 41
Figure 3.2. Standard Curve for BSA............................................................................... 46
Figure 3.3. A Schematic Representation of Differential Display using 2D-Gels........... 56
Figure 4.1. Leaf Symptoms in Barley Leaves under Boron Stress.
The First Photography was taken from Anadolu Genotype of
Boron-Stress and Control Leaves, whereas the Second Photograph
was from Hamidiye Genotype under Boron-Stress ..................................... 58
Figure 4.2. 2D-PAGE Gels of Anadolu and Hamidiye Leaf Proteins............................ 60
Figure 4.3. Representative 2-DE Map of Anadolu Boron Leaf Proteins........................ 61
Figure 4.4. Representative 2-DE Map of Anadolu Control Leaf Proteins ..................... 61
Figure 4.5. The Structure of V-ATPase.......................................................................... 70

x
Figure 4.6. Representative 2-DE Map of Sahara Boron Leaf Proteins........................... 72
Figure 4.7. Representative 2-DE Map of Sahara Control Leaf Proteins ........................ 72
Figure 4.8. The Extended Gel Image of Sahara Boron and Sahara Control
in High Mass Region ................................................................................... 73
Figure 4.9. The Extended Gel Image of Sahara Boron and Sahara Control
in Low Mass Region .................................................................................... 74
xi
LIST OF TABLES
Table Page
Table 1.1. Relative Tolerance to Boron Toxicity of Some Crops. ................................... 8
Table 2.1. The Properties of Commercial IPG Dry Strips.............................................. 17
Table 2.2. Recommended PROTEAN IEF Cell Focusing Condition Program.............. 19
Table 2.3. Recommended Range of Protein Loads for ReadyStrip IPG Strips .............. 20
Table 2.4. The Minimum Required Equilibrium Buffers for One Strip ......................... 22
Table 3.1. The Preparation of BSA Standards from 0.2 mg/ml BSA and
Test Sample for the Bradford Protein Assay ................................................. 45
Table 3.2. Absorbance Values for BSA Standars .......................................................... 46
Table 4.1. Boron Responsive Proteins, Identified by nanoLC-ESI-MS/MS.................. 62
1
CHAPTER 1
INTRODUCTION
1.1 . Boron
1.1.1. Physical and Chemical Properties
Boron is a metalloid element whose atomic number is 5 and the atomic mass is
10.81 g/mol with a chemical symbol B. The oxidation state of boron is 3+ and it is a
member of group IIIA in the periodic table. Elemental boron exist as a solid at room
temperature, either as a black monoclinic crystals or as a yellow-brown amorphous
powder. It has two naturally occurring stable isotopes; 10B and 11B isotopes with relative
abundances 19.78 % and 80.22 %, respectively.
The electron configuration of boron is 1s2 2s2 2p1 with three valence electrons. It
is electron-deficient with vacant p-orbital; it does not form ionic bonds whereas forms
stable covalent bonds. It makes bonds with electron-rich substances and always found to
be bound to oxygen in nature. Boron containing compounds generally behave as a
Lewis acid.
Boron compounds occur in the earth’s crusts as a concentration of nearly
0.001%. It is not present in nature in elemental form, but it is found combined in borax
ore or tincal (Na2B4O7.10H2O), boric acid (H3BO3), colemanite (Ca2B6O11.5H2O),
kernite (Na2B4O7.4H2O), ulexite (NaCaB5O9.8H2O), and borates (salts of boric acid).
The solubility of elemental boron is very low in water. In contrast most boron
compounds are soluble in water. Borax is easily dissolved in water to form a mixture of
boric acid and borates. Boric acid is a very weak acid having low dissociation constant
(5.81x 10⁻¹⁰ at 25 °C and pKa=9.24). At low and neutral pHs, H3BO3 exists in unionized
form while B(OH)4¯ (meta-borate ion) form is predominates at high pHs (>9.3). It is
shown that both species exist in equilibrium from pH 7.0 to 11.5; therefore pH is the
main factor to determine which boron species is available at desired value (Darbouret,
et al. 2000). The following equilibrium is established at stated pH range.
B(OH)3 + H2O ↔ B(OH)4¯¯ + H +
2
1.1.2. Major Uses and Distribution in Nature
Boron compounds are mainly used in the manufacture of fiberglass insulation,
borosilicate glass, ceramic glazes, porcelain enamel, laundry products, flame retardants,
herbicides, insecticide, cosmetics, pharmaceuticals (as pH buffers), and as ingredients in
mild antiseptic (Woods 1994). Besides these applications, it is also used in nuclear
chemistry as a radiation shield, boron neutron-detecting instrumentation in cancer and
brain tumor treatment and in agricultural plant fertilizers.
Boron enters the environment through natural processes and from anthropogenic
sources. Natural processes for releasing boron can be classified as weathering of boron
containing rocks, volcanic activity, and as a boric acid vapour from seawater. It also
exits in nature by human activities such as using borates as a fertilizers in agriculture
and using borates in home and industry, release from borate mining operations, glass
and ceramic manufacturing, power generation using coal and sewage disposal of boron.
Turkey has nearly 72 % of total boron reserves of the world having 803 million
tones (Kar, et al. 2006). The other known massive boron deposits are located in the
USA, Argentina, Russia, Chile, China, and Peru. Turkey’s total income from boron
export was $192 million in 2002. Eti Mine Works Management possesses 31 % of total
world production on a B2O3 basis where Turkey’s main boron deposits are along the
Eskişehir, Kütahya, and Balıkesir provinces.
Boron is widely distributed as undissociated boric acid with some borate ions in
natural water. Through the several analysis of groundwater showed that boron
concentration has a range is from 0.3 to 100 mg/L. However, boron concentration in
fresh surface water should be in range from <0.001 to 2.0 mg/L with a mean value
below 0.6 mg/L. It is also shown that seawater has average boron concentration around
4.5 mg/kg (WHO 1998). The average content of borate of all soils is 10-20 mg/kg
where higher values (up to 100 mg/kg) in the Western USA and across the
Mediterranean in Turkey are also indicated. These boron limit values strongly depend
on local geology character of soil, especially in areas of boron mining and volcanic
activity.
Boron forms several chemical compounds with oxygen, but water analysis
reports boron concentration in terms of its elemental boron, without defining the actual
compounds that are present.
3
1.2. Boron in Plant Structure and Function
Plants can be classified into three categories according to their boron
requirement: having lowest demand for boron is called graminaceous plants, having
intermediate demand-the remaining monocots and most dicots-, and the highest boron
requirement is needed for latex-forming plants. It is easily seen that every plant species
require different amount of boron; it can be optimum for one where toxic for other one
(Blevins, et al. 1998).
Boron is known as an essential micronutrient for healthy plant growth and
development for more than 80 years. It has a unique character among the essential
elements by having narrow margin between deficiency and toxicity level. However
effect of boron in plants is not fully clarified up to date but the most important functions
that involved in plant physiology can be classified as a role in cell wall structure,
membrane function, and specific metabolic activities (Bolaños, et al. 2004). Besides
these fundamental aspects; scientists have speculated that boron is also needed for
protein synthesis, sugar transport, cell division, fruit and seed development, hormone
regulation, carbohydrate metabolism and nitrogen regulation, and root development.
Molecular biologists suggested that higher plants contain boron as water-soluble
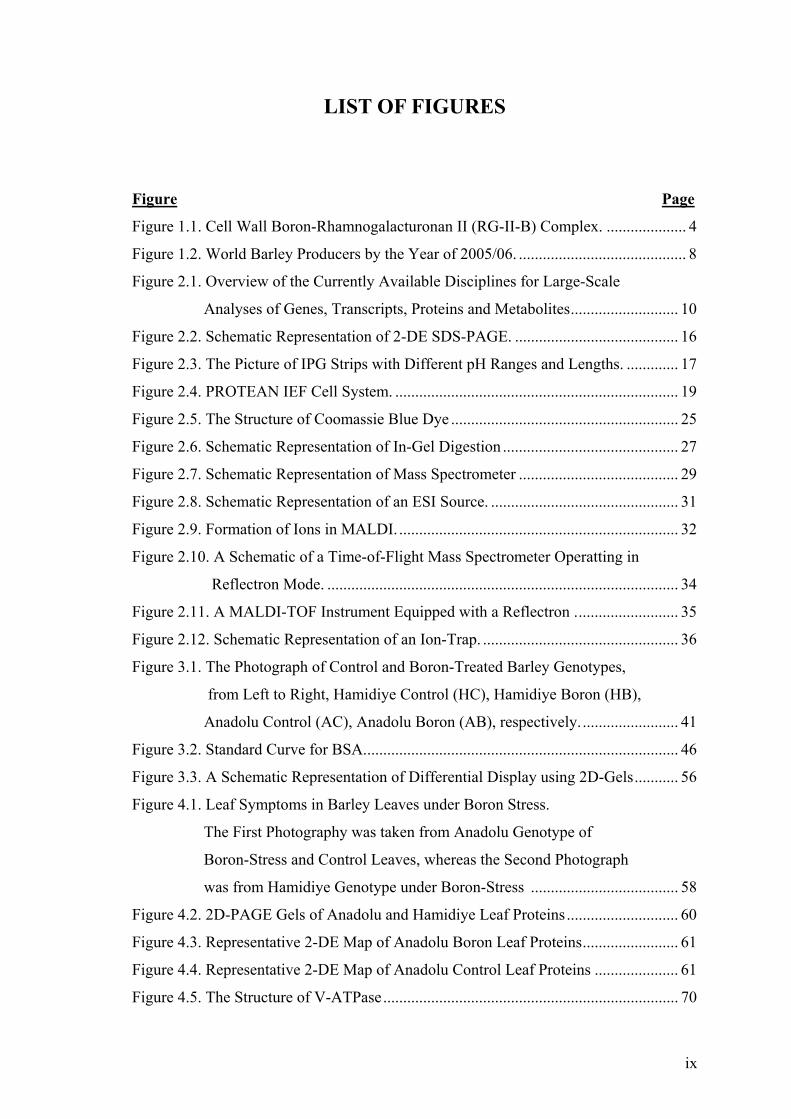
or water-insoluble forms. Nearly all water-soluble boron localized in the apoplastic
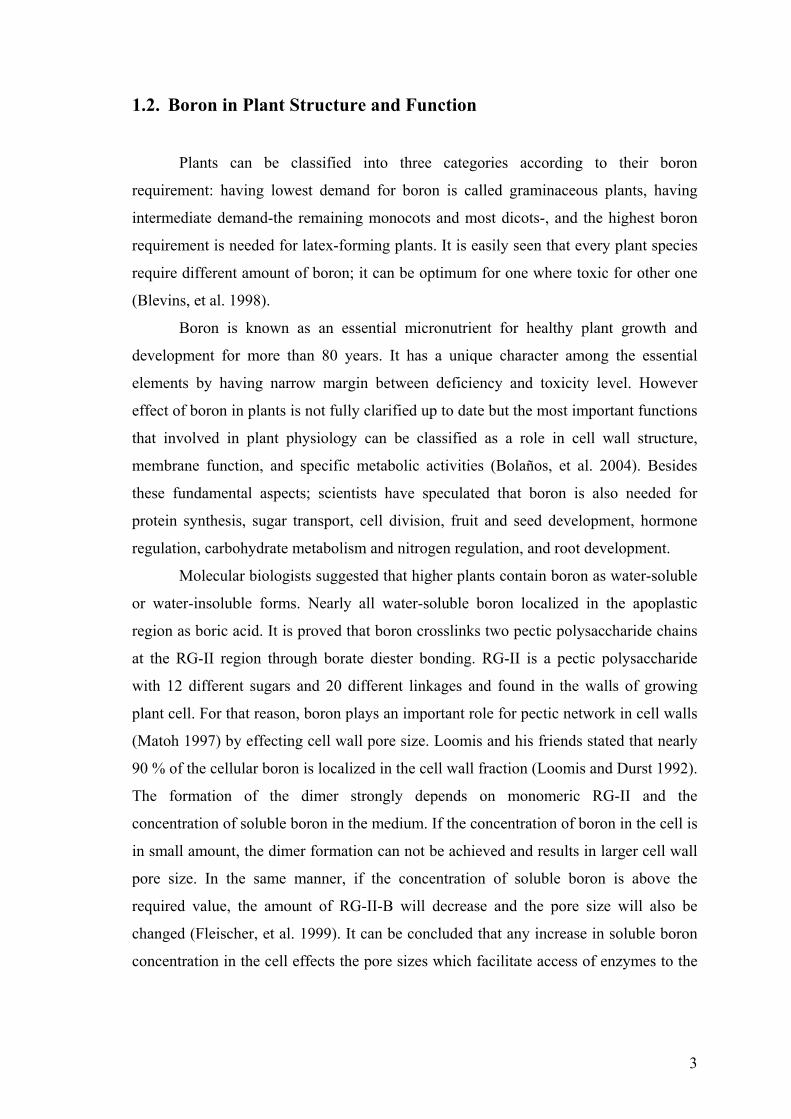
region as boric acid. It is proved that boron crosslinks two pectic polysaccharide chains
at the RG-II region through borate diester bonding. RG-II is a pectic polysaccharide
with 12 different sugars and 20 different linkages and found in the walls of growing
plant cell. For that reason, boron plays an important role for pectic network in cell walls
(Matoh 1997) by effecting cell wall pore size. Loomis and his friends stated that nearly
90 % of the cellular boron is localized in the cell wall fraction (Loomis and Durst 1992).
The formation of the dimer strongly depends on monomeric RG-II and the
concentration of soluble boron in the medium. If the concentration of boron in the cell is
in small amount, the dimer formation can not be achieved and results in larger cell wall
pore size. In the same manner, if the concentration of soluble boron is above the
required value, the amount of RG-II-B will decrease and the pore size will also be
changed (Fleischer, et al. 1999). It can be concluded that any increase in soluble boron
concentration in the cell effects the pore sizes which facilitate access of enzymes to the
4
apoplastic region and less protein could be bound to the cell wall due to a lower amount
of binding sites (Wimmer, et al. 2003).
Figure 1.1. Cell Wall Boron-Rhamnogalacturonan II (RG-II-B) Complex (Source: Bolaños, et al. 2004)
Referring to Hu and co-workers, pectin is showed to bind excess boron, thus
protect the cell against to toxic effect (Hu, et al. 1996)
In addition, boron may affect metabolic activities by making complex with
apoplast proteins and by interfering with manganese-dependent enzymatic reactions
(Blevins, et al. 1998). Bolaños and his friends proposed that main function of boron in
biological systems is stabilization of molecules with cis-diol groups (Bolaños, et al.
2004).
Boron is taken into plants in the form of boric acid. It is transported from roots
to leaves through xylem vessels and accumulates in growing part of leaves and stems.
During transportation some of the boron easily forms complexes with sugars and other
compounds containing cis-hydroxyl groups. Excessive boron can be toxic with having
more boron transport from roots to leaves. It is easily accumulated in the plant cell walls
and extra boron may pass into the cytoplasm and effect cytoplasmic activities which are
resulted as boron toxicity (Matoh 1997). It is important to define the chemistry of boron
and uptake mechanism in plants for understanding the management of boron-toxicity
and boron-deficiency for agriculture and environment.
5
According to the Brown and his colleagues, boron uptake is through passive
permeation of plasma membrane (Brown, et al. 2002). The diffusion of boron is
affected in the cell and in the apoplastic region because of complex formation.
1.3. Boron Toxicity
The mechanism of boron toxicity is still under debate. It is thought that soluble
boron concentration plays an important role in the occurrence of boron toxicity in arid
and semi-arid region of the world (Loomis and Durst 1992). Boron toxicity generally
occurs in dry years with low rainfall regions. Boron can be easily absorbed by plant
roots because of mobility of soluble boron in soils. Several approaches have been
proposed about how boron caused toxicity in plants. Recently Wimmer and co-workers
stated the influx of boron into the cell is easy when the concentration of boron is high in
the medium (Wimmer, et al. 2003). Because of pH dependence of boron and its related
compounds, boron is converted into the borates with complexing with putative ligands
in the symplasm. Pyridine nucleotide coenzymes (NAD+), ATP, RNA and several
sugars are reported molecules that boron binds onto them and changes their function or
changes enzyme activity in the cell (Ralston and Hunt 2000).
1.3.1. Sources of Boron
Boron is found in soils, rocks, surface, ground and ocean waters, and in the
atmosphere. It is released mainly by natural processes all over the world. Large boron
deposits, which are located in West and Central Anatolia of Turkey, may causes boron
toxicity by having high concentration of boron in soils and groundwaters.
Boron enters to the environment mainly from irrigation waters, mining, and
industrial applications.
Irrigation water, that contains high boron concentrations, is the most important
contributor to boron toxicity in plants. The level of boron in irrigation waters is
dependent on the geological conditions of soil. Boron level is well correlated with
salinity where saline irrigation water contributes to an accumulation of boron in soils.
Salinity increases boron toxicity symptoms in many plant species (Grieve and Poss
2000).
6
In Turkey, borate mines are located north of the town of Bigadiç and along the
Simav River. Boron is present in groundwaters and rivers primarily as a result of
leaching from rocks and soils containing boron compounds. The amount of boron in this
river varies between 4 mgB/L to 7 mgB/L due to pollution from waste of boron mines
whereas 0-0.5 mgB/L is the normal value for Simav River before reach to the mining
area. Boron toxicity has also seen while using drainage water in agriculture as an
irrigation that contains high level of boron. It is reported that if hot water extractable
boron concentration exceeds 5.0 mg/kg in soil, it can be toxic to many plants (Nable, et
al. 1997).
The main application of boron is using sodium perborate as laundry products.
The waste of bleaching agents into the environment during production and end use
causes boron accumulation in groundwater. These industrial effluents, irrigation waters,
and surface mining have resulted on boron toxicity which can limit plant growth and
decrease crop yield in soils of arid and semi-arid part of the world.
The form of boron in soil affects its availability to plants. Boron availability is
totally dependent upon soil’s physical and chemical properties such as clay, organic
matter, pH, moisture and amount of leaching and rainfall.
1.3.2. Visible Symptoms of Boron Toxicity in Plants
Boron is known as immobile nutrient within plants which can not be
translocated to new growth leaves. Therefore, boron toxicity symptoms location is in
middle or older leaves. Avcı and his co-workers showed that there were no visible
boron toxicity symptoms on barley plants even high (44.4 mg/L) plant boron
concentration (Avcı, et al. 2005). Visible boron toxicity symptoms can be classified as leaf burn, necrosis of the
leaf tips, and necrotic and/or chlorotic patches along the leaf margins (Nable, et al.
1997). The severity of necrotic and chlorotic spots may vary if boron concentration in
the medium changes. Moreover, leaf burn is not only the indicator for boron toxicity
symptoms.
In contrast to leaves, roots do not show any visible symptoms against to boron
toxicity. It is stated that boron concentration in the roots were low as compared to
7
leaves at high boron supplied soils, therefore it is concluded toxic concentration do not
occur in the root of plants (Nable, et al. 1997).
1.3.3. Plant Tolerance to Boron Toxicity
The physiology of boron tolerance and boron toxicity are not well understood.
However, exclusion mechanisms and internal tolerance mechanisms are thought to be
the physiology of tolerance to boron toxicity in plants.
It is obvious that a level of boron above the optimum range causes significant
changes in the activity of numerous enzymes and, consequently, the metabolism of
higher plants (Shkolnik 1974). The possible boron toxicity tolerance mechanisms have
been reported by many researchers in literature. The exclusion of boron from roots,
reduced translocation to shoots and avoidance by means of shallow root systems are
considered the main mechanisms involved in boron tolerance or resistance (Paull, et al.
1992, Nable 1988). In addition to these mechanisms, Nable also stated that boron
tolerance of plant genotypes is related to their abilities to passively transport of boron as
a result of differences in their membrane composition (Nable 1988).
Recently Hayes and Reid showed results of tolerant and sensitive barley
genotypes to boron toxicity in terms of boron concentrations in their roots, leaves, and
xylem. They demonstrated that tolerant variety able to maintain lower boron
concentration in its structure against susceptible one due to actively boron efflux from
tolerant roots which results lower concentration of boron in the xylem and finally less
accumulation of boron in the shoot. As a conclusion, they proposed two models for
boron efflux as the basis of boron tolerance in barley namely either by anion exchange
or an anion channel. The lack of a capacity to efflux of borate anion in boron sensitive
genotype is the main factor for boron toxicity in that plant species. They concluded that
boron tolerance in barley is mediated by efflux of boron from the roots (Hayes and Reid
2004).
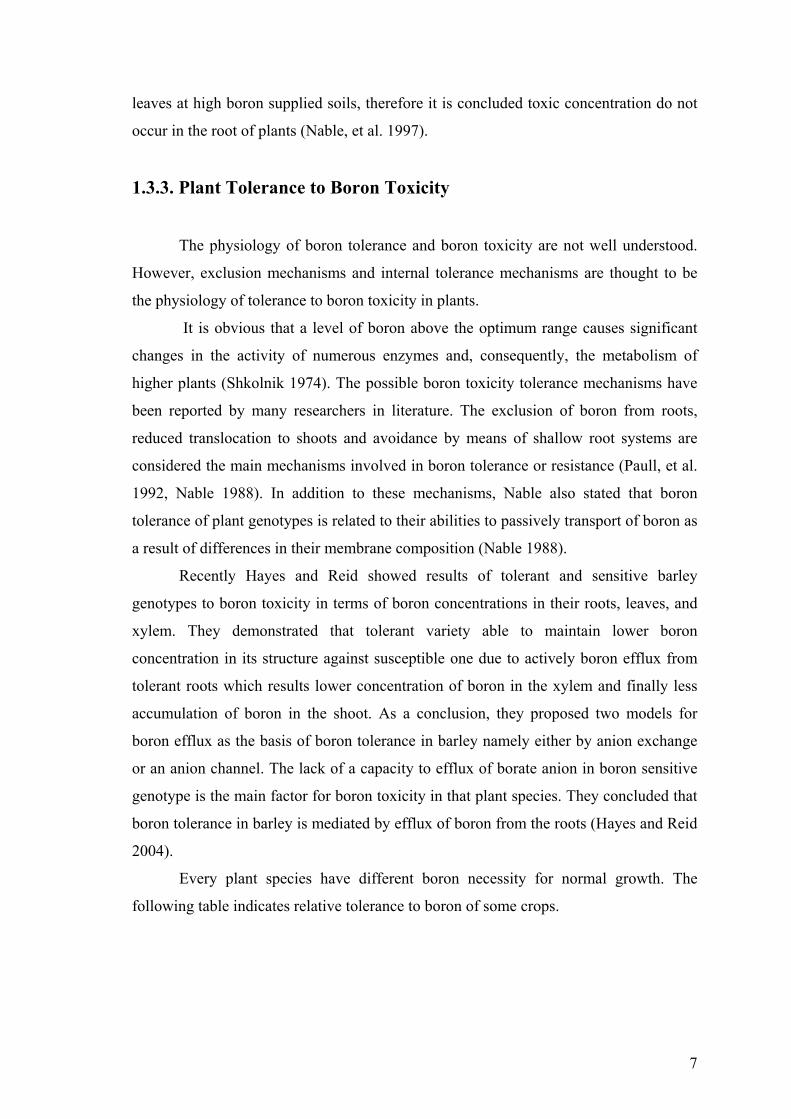
Every plant species have different boron necessity for normal growth. The
following table indicates relative tolerance to boron of some crops.
8
Table 1.1. Relative Tolerance to Boron Toxicity of Some Crops (Source: Keren and Bingham 1985)
Tolerant
(2-4 mg B/L)
Semi-tolerant
(1-2 mg B/L)
Sensitive
(up to 0.3 mg B/L)
Carrot (Daucus carota) Barley (Hordeum vulgare) Bean (Phaseolus vulgaris) Sugar Beet (Beta vulgaris) Maize (Zea mays) Apple (Malus domestica)
Alfalfa (Medicago sativum)
Potato (Solanum tuberosum)
Avocado (Persea americana)
1.4. Barley (Hordeum vulgare L.)
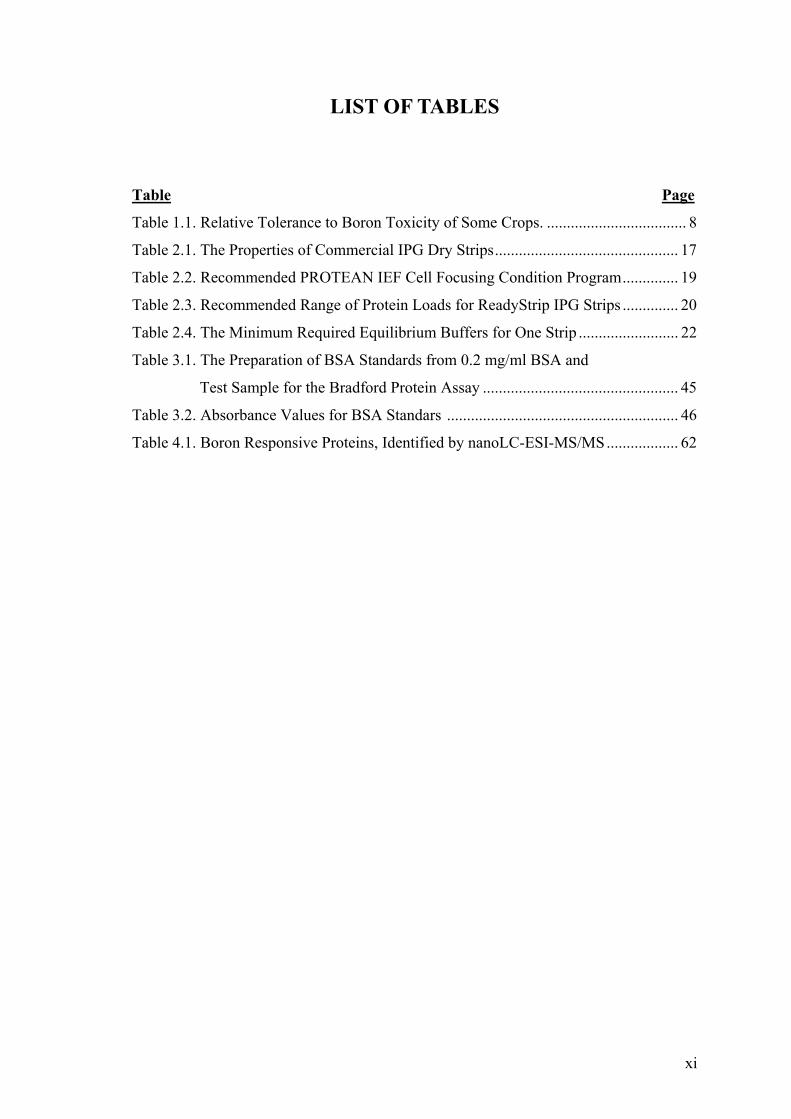
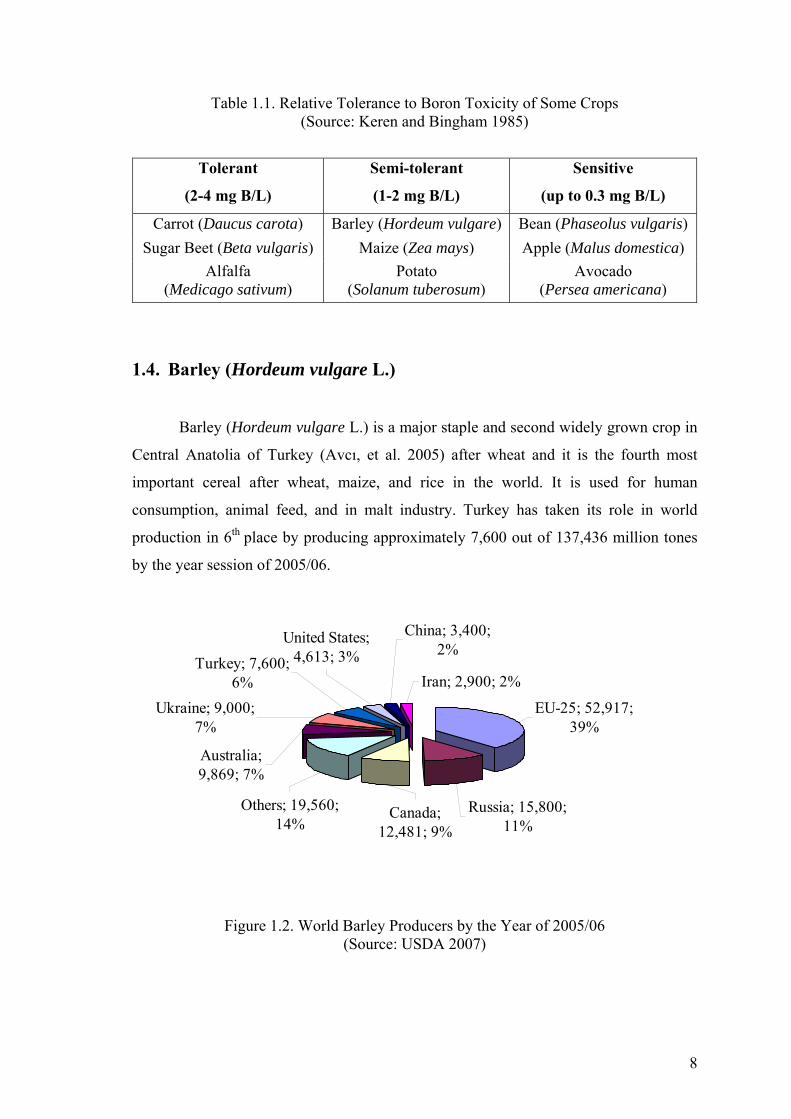
Barley (Hordeum vulgare L.) is a major staple and second widely grown crop in
Central Anatolia of Turkey (Avcı, et al. 2005) after wheat and it is the fourth most
important cereal after wheat, maize, and rice in the world. It is used for human
consumption, animal feed, and in malt industry. Turkey has taken its role in world
production in 6th place by producing approximately 7,600 out of 137,436 million tones
by the year session of 2005/06.
Turkey; 7,600; 6%
United States; 4,613; 3%
China; 3,400; 2%
Iran; 2,900; 2%
Australia; 9,869; 7%
Ukraine; 9,000; 7%
Others; 19,560; 14%
Canada; 12,481; 9%
Russia; 15,800; 11%
EU-25; 52,917; 39%
Figure 1.2. World Barley Producers by the Year of 2005/06 (Source: USDA 2007)
9
It is also stated that barley is also an indicator plant for boron toxicity (Krantz
and Melsted 1964).
In Turkey, there are ten different barley genotypes namely Anadolu, Bülbül,
Cumhuriyet, Erginel, Hamidiye, Obruk, Tarm-92, Tokak, Yea-1868, and Yesevi. There
is large variation in tolerance to boron toxicity among these varieties. When the severity
of toxicity symptoms on leaves, levels of shoot dry matter production, and grain yield
taken into account, Hamidiye and Bülbül were identified as the most sensitive
genotypes. On the other hand Obruk, Yea-1868, Cumhuriyet, and Erginel classified as
moderately tolerant genotypes while Anadolu, Tarm-92, Yesevi, and Tokak are the
most tolerant genotypes against boron toxicity (Torun, et al. 2003).
10
CHAPTER 2
PROTEOMICS AND MASS SPECTROMETRY
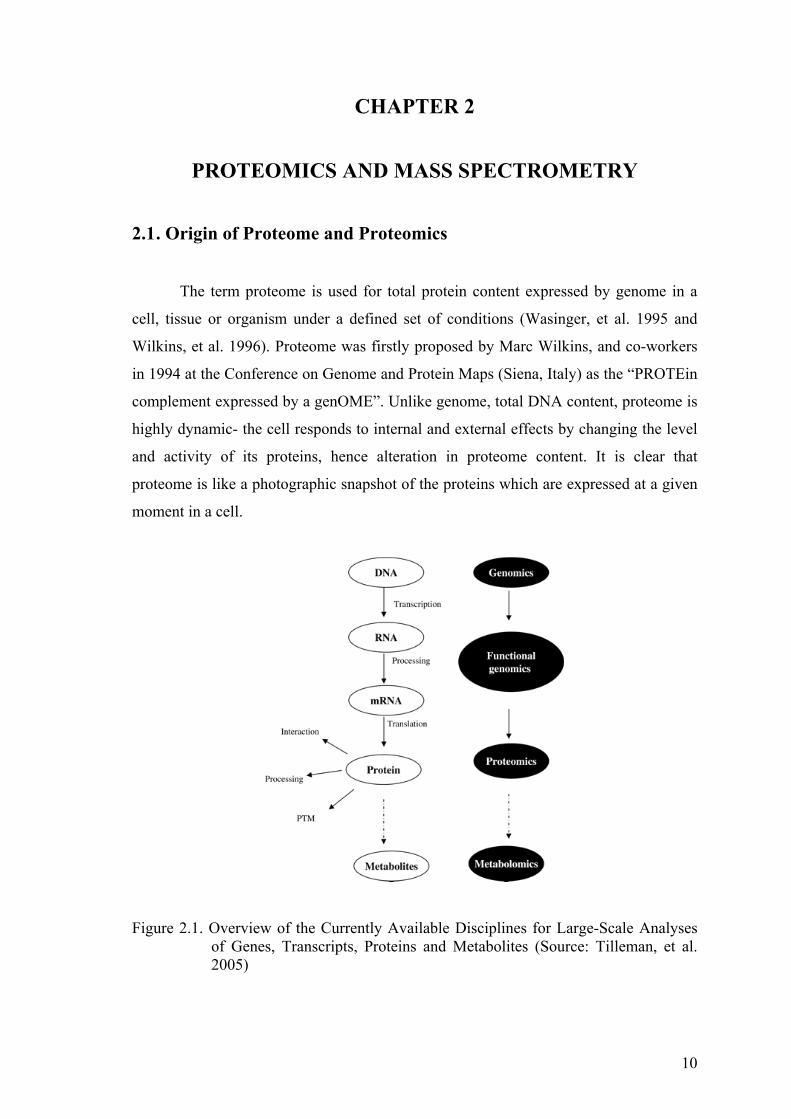
2.1 . Origin of Proteome and Proteomics
The term proteome is used for total protein content expressed by genome in a
cell, tissue or organism under a defined set of conditions (Wasinger, et al. 1995 and
Wilkins, et al. 1996). Proteome was firstly proposed by Marc Wilkins, and co-workers
in 1994 at the Conference on Genome and Protein Maps (Siena, Italy) as the “PROTEin
complement expressed by a genOME”. Unlike genome, total DNA content, proteome is
highly dynamic- the cell responds to internal and external effects by changing the level
and activity of its proteins, hence alteration in proteome content. It is clear that
proteome is like a photographic snapshot of the proteins which are expressed at a given
moment in a cell.
Figure 2.1. Overview of the Currently Available Disciplines for Large-Scale Analyses of Genes, Transcripts, Proteins and Metabolites (Source: Tilleman, et al. 2005)
11
Beyond the proteome, proteomics is the study of proteins with its expression
levels, interactions, and their functions in a given cell, tissue or organism at any given
time (Barbier-Brygoo and Joyard 2004). In deeper, proteomic analysis related with
identification of amino acid sequence of proteins, determination of their relative
amounts, their modification patterns, and their relations with other proteins.
2.1.1. Why Proteomics?
Proteomics is the identification and sequencing of proteins isolated from cell,
tissue, and body fluids. Proteins have performed almost all cellular activities in cells;
therefore it is very important to define the identity of the proteins individually. Proteins
are made up with basic building blocks called amino acids and they are joined together
by peptide bonds. It is well know that each protein is built from different arrangement
of twenty natural amino acids and two modified derivatives of amino acids discovered
until now.
Protein synthesis is two step process namely transcription and translation. Single
strand of messenger RNA (mRNA) is produced in the nucleus by copying one strand
DNA by the help of RNA polymerase enzyme. Then mRNA passes through to the
cytoplasm for translation on the ribosome. Ribosome reads three nucleotides at a time
by matching each three bases to its base pairing anticodon- site for amino acid
attachment- which is located on tRNA. Afterwards tRNA transports the defined amino
acids to the ribosome where each tRNA is specific for one amino acid. Finally amino
acids are linked together by peptide bonds to forms proteins. In the past, it is believed
that every gene is responsible for one protein, but this is not correct anymore. There is a
considerable increase in complexity of proteins when gene expression is analyzed; in
other words proteome is larger than the genome.
It is estimated that human genome consist of approximately 35,000 genes where
expected encoded protein number may vary from 200,000 to 2 millions due to
alternative splicing, post-translation modifications (PTMs) of proteins (phosphorylation,
glycosylation, methylation, etc) and protein degradation (Rose, et al. 2004). The
diversity of protein can not be explained only by gene expression analysis; hence
proteomic analysis is required for identifying cell function in terms of its protein level.
12
Scientists believed that it can be easy to understand the aetiology of human
diseases after completion of human genome sequence in 2002 but this is not come true
in real life. Basicly, proteome of diseased cell will have differences at protein level over
the normal cell proteome where genome remains constant over this period. Molecular
characterization of human diseases can only be accomplished by proteomic based
studies. In the past decade, proteomics is used for investigation infectious diseases and
several cancer tumors (Adam, et al. 2003, Lehrer, et al. 2003, Rai, et al. 2002),
Alzheimer's disease (Choi, et al. 2002, Mattila and Frey 1996) and Down syndrome
(Greber, et al. 1999) by monitoring protein composition in certain body fluids such as
serum, prostatic fluid, and urine.
2.1.2. Types of Proteomics
There are mainly three types of proteomics which are named as expression,
structural, and functional proteomics.
Expression proteomics aims to identify the protein expression level of biological
systems in terms of its response to the any physical and biochemical stresses. In other
words, it deals with change in entire proteome in a cell, tissue, or organism at a certain
time. Structural proteomics seeks to identify all the proteins within the cell or any
organelle with their location. Its major role is mapping out the structure of protein in
three dimensional space using X-ray crystallography and NMR spectroscopy methods.
Functional proteomics is concerned with the identification of functions, activities, and
interactions of all the proteins in proteome.
2.2 . Plant Proteomics
Plant proteomics has entered the functional genomics era after the genome
sequence of thale cress (Arabidopsis thaliana) (The Arabidopsis Genome Initiative
2000) and rice (Oryza sativa) (Goff, et al. 2002, Yu, et al. 2002) were completed.
Although its infancy, it will be a very active field in biology with the increasing
amounts of other plant genome and EST data.
Researchers have focused on protein isolation from cellular compartments of
any cell or tissue instead of dealing with total protein complement. This is just because
13
resolution of protein spots on a 2D (two-dimensional) gel is limited, complete proteome
of a cell divided into sub-proteomes in order to enhance the differentiation of spots
easily. Therefore, in the last two decade researches have been carried out on different
plant organs (Watson, et al. 2003), organelles and individual tissues such as seeds
(Gallardo, et al. 2001), leaves (Donnelly, et al. 2005, Dani, et al. 2005), and roots (Yan,
et al. 2005, Bona, et al. 2007). Proteomic studies in different subcellular compartments
in plants can be classified as: cell wall (Chivasa, et al. 2002, Borderies, et al. 2003),
chloroplast (Peltier, et al. 2000, Ferro, et al. 2003, Zolla, et al. 2002, 2003), chloroplast
membrane (Peltier, et al. 2002, Zolla, et al. 2004), mitochondria (Kruft, et al. 2001,
Millar, et al. 2001), nucleus (Bae, et al. 2003), and plasma membrane (Santoni, et al.
1998, Kawamura and Uemura 2003). Moreover, total protein profile of any part of cell
can be altered due to environmental stresses. Several studies have been carried out with
different plant species with abiotic and biotic stress conditions. Some of the abiotic
stresses are classified as non-optimal temperatures (Amme, et al. 2006, Ferreira, et al.
2006), drought (Salekdeh, et al. 2002), salinity (Kav, et al. 2004), heavy metals
(chemicals) (Ingle, et al. 2005) and soil nutrient problems (Kang, et al. 2004) whereas
bacterial (Jorrin, et al. 2006), fungal (Campo, et al. 2004) and viral diseases (Ventelon-
Debout, et al. 2003) are belong to the biotic stress category. It is well known that plants
are immobile in soil, so they can easily change their leaf’s and root’s physiological and
morphological structures to protect itself against biotic and abiotic stresses. For that
reason, plants develop defense mechanisms to protect itself by changing its protein
types and their expression levels when exposed to any given stress treatment.
Among the stresses, nutritional disorders have taken its role in the preliminary
places. Dealing with nutrient(s) either deficiency or toxicity levels are classified as the
most important problems for the soil management. Plant nutrients are categorized into
two types: macro-nutrients and micro-nutrients. Plants require a right combination of
macro- and micro-nutrients for healthy growth, development and reproduction,
however, nutrient requirement changes among plants. Macro-nutrients are the elements
which required relatively large amounts such as nitrogen, phosphorus, potassium,
calcium, magnesium and sulfur whereas micro-nutrients are the elements that need by
plants only small quantities such as iron, manganese, boron, zinc, copper, molybdenum
and chlorine. On the other hand, carbon, hydrogen and oxygen are the nutrients
absorbed in large amounts from air, water and soil. Up to date, there are 16 elements
that have been found to be essential for healthy plant growth. These elements are
14
generally taken up in their ionic forms by roots of plants. Because of high cost and time
consuming methods, clean-up procedures for excess amount of nutrients from soils have
not been preferred. Similarly it is hard to define the deficiency problems for several
elements in the soil. To manage these toxicity and deficiency problems, proteomic
approach can be used to identify related proteins which are involved in defense and/or
tolerance mechanisms in plants. Two-dimensional (2-DE) gel electrophoresis coupled
with mass spectrometric analysis has been used after development of soft ionization
methods (MALDI and ESI) for mass spectrometry.
2.3 . Two-Dimensional Gel Electrophoresis
One-dimensional sodium dodecyl sulfate polyacrylamide gel electrophoresis (1-
D SDS-PAGE or 1-DE) has been used for several decades to separate total protein
extracts based on protein’s molecular weight (size) difference. However 1-DE can not
resolve more than 80-100 different protein components where cell proteomes are
extremely complex having several thousand of proteins. O’Farrell firstly introduced
high-resolution two-dimensional sodium dodecyl sulfate polyacrylamide gel
electrophoresis (2-D SDS-PAGE or simply 2-DE) for separation complex protein
mixture in 1975 (O’Farrell 1975). 2-DE is not only used for complete protein separation
but also to analyze the protein alterations due to environmental stress conditions and to
detect co- and post-translation modification which can not be determined from genome
sequence. Mainly 2-DE is used as a component of proteomics and is the step used for
separation of proteins for further characterization by mass spectrometry (MS).
2-DE separates protein mixture according to two distinct properties of proteins,
isoelectric point (pI) in the first dimension and molecular mass (Mr) in the second
dimension. More generally, isoelectric focusing (IEF) is coupling with sodium dodecyl
sulfate polyacrylamide gel electrophoresis (SDS-PAGE) for total proteins separation.
Today’s modern 2-DE systems has a capacity to separate up to 10,000 protein spots on
one gel theoretically by capability of approximately 100 protein separation in each
dimension. Depending on the pore size in acrylamide gels and pH gradient used, 2-DE
systems can resolve more than 5000 proteins simultaneously having nearly 2000
proteins routinely and able to detecting and quantifying protein amounts of nearly 1 ng
per spot.
15
The resolution of proteins on gels and reproducibility of gels have been
improved by the development of dry commercial IPG strips for the first dimension of 2-
DE (Görg 1991). The availability of commercial IPG strips of different pH ranges and
lengths, i.e. 3-10, 3-10 NL (nonlinear gradient), 4-7, 3-6, 5-8, 7-10, 3.9-5.1, 4.7-5.9, 5.5-
6.7, 6.3-8.3 and 7, 11, 17, 18, 24 cm in length, respectively enables of broad view of
proteome maps. The theory behind the IEF can be described as follows: protein sample
is loaded to an IPG strips and an electric potential is applied across the strips. As all
know, proteins carry either negative, positive, or zero net charge due to containig
different side chains. Under the influence of electric field, proteins will move along the
strip and will stop at the isolectric point of itself. Isoelectric point of a protein is the
point where the net charge on a protein is zero. If the proteins have net negative charges
they will be pulled to anode-the more positive end of the gel. In contrast, if the proteins
have net positive charges they will be pulled towards the cathode-the more negative side
of the strip.
The second dimension of 2-DE separates proteins according to their molecular
weight, in other words their mobility in polyacrylamide porous gel. SDS-PAGE can be
performed on horizontal or vertical systems (Görg, et al. 1995). Vertical systems are
prefered when multiple runs in parallel are required. Pore size of the polyacryamide gel
can be controlled by varying the total acrylamide content of the gel and cross-linker
content of the total acrylamide. IPG strips having low polyacrylamide content can acts
as a stacking gel due to concentrated, ready and nonrestictive protein zones within.
Therefore there is no need to use stacking gel with vertical 2-DE systems.
16
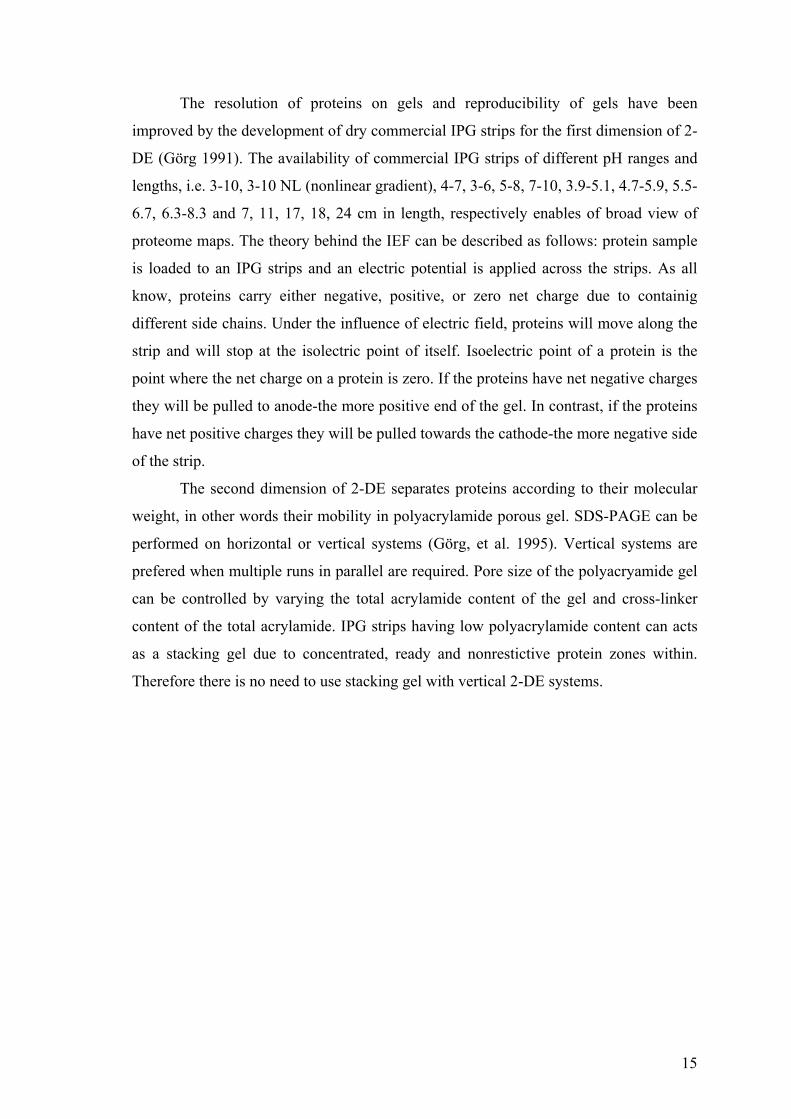
Figure 2.2. Schematic Representation of 2-DE SDS-PAGE
(Source: Liebler 2002)
However, 2-DE system has limitations, such as poor solubility of membrane and
hydrophobic proteins (Adessi, et al. 1997), difficulties in resolving and identifying very
acidic or basic proteins and low-abundance proteins and limited dynamic range.
Although having limitations, 2-DE is still a powerful and versatile method and the most
commonly used technique in proteome analysis.
2.3.1. First Dimension: Isoelectric Focusing
The first dimension in 2-DE system is the separation of proteins according to
their isoelectric point. In the past, IEF was done with thin polyacrylamide gel rods in
glass tubes with the aid of carrier ampholyte-generated pH gradients (O’Farrel 1975).
Carrier ampholytes with the highest pI migrate towards to the anode and the carrier
ampholytes with the lowest pI move to the cathode which provides a linear and
continuous pH gradient. This method does not produce reproducible results. In the
following years, an immobilized pH gradients was introduced to improve the
reproducibility of 2-DE gels (Görg, et al. 2000). They are made with buffering
17
acrylamide derivatives which contain either a free carboxylic acid or tertiary amino
group that is copolymerized with acrylamide and bis-acrylamide. These IPG strips are
mechanically strong and their pH gradient can not drift. Additionally, IPGs can be in
different pH ranges between pH 2.5 to pH 12 such as linear and nonlinear wide range
(e.g. IPG 3-12), medium (e.g. IPG 4-7), narrow (e.g. IPG 4.5-5.5), and ultra-narrow
(e.g. IPG 4.9-5.3) as well as with different lengths.
Table 2.1. The Properties of Commercial IPG Dry Strips
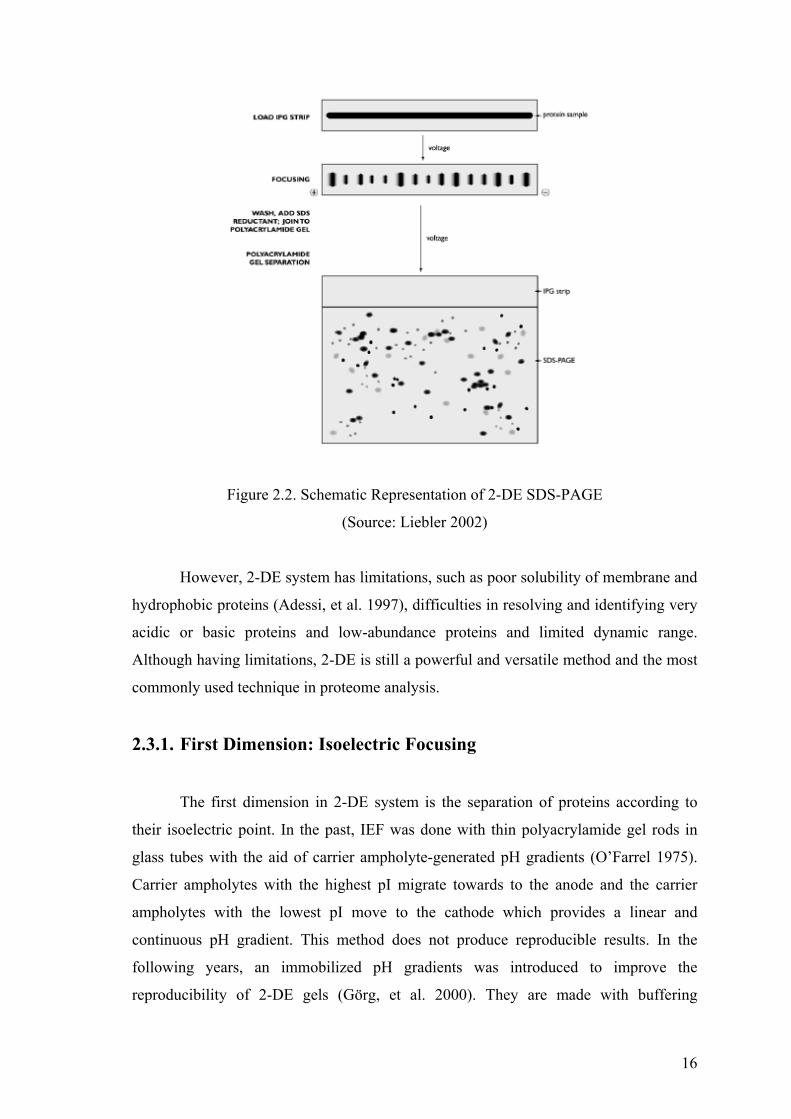
Figure 2.3. The Picture of IPG Strips with Different pH Ranges and Lengths
18
2.3.1.1. General Guidelines for IEF with IPGs
Before IEF, the IPG dry strip needs to be rehydrate (generally 12 hours) to
return it to original thickness of 0.5 mm with a rehydration buffer containing chaotropes
(e.g. urea and thiourea), non-ionic or zwitterionic detergents (e.g. CHAPS), reducing
agents (e.g. DTT) and carrier ampholytes. Sample can be applied to the IPG dry strips
either by including it in the rehydration solution or by applying it directly to the
rehydrated IPG strip through cup-loading method. Cup-loading is commonly used
approach to improve the resolution of basic protein’s separation (Görg, et al. 2000).
This sample loading method is preferred when the samples are contaminated with
nucleic acids or other large non-proteinaceous molecules. There are several advantages
of loading sample onto the IPG strip by including the sample in rehydration solution
such as loading larger quantities of proteins and allows their proper separation, gives
chance to load more dilute samples and minimizes protein precipitation.
The sample-loading/gel rehydration process (in-gel rehydration) can be
accomplished in either a passive or active manner. In passive rehydration, the sample is
put into the one well of focusing tray firstly, then IPG dry strip is placed gel-side down
in the same well, that is, in contact with the protein sample. The strip is then covered
with mineral oil to prevent evaporation and urea crystallization during rehydration and
finally allowed to incubate overnight (12-16 hours). This method allows proteins
loading naturally. In contrast, active rehydration is carried out in the presence of low
voltage (typically 50 V) during rehydration period. It is believed that in-gel rehydration
loading under low voltage procedure provides a more complete uptake of protein in the
sample into the IPG strip and facilitate the entry of large proteins into the gel. The
procedure steps (placing strips gel-side down and covering it with mineral oil) are the
same with the passive rehydration. After overnight incubation time, with voltage or
without any voltage, the IEF cell is programmed using appropriate protocol for focusing
proteins according to their pI.
A common temperature for isoelectric focusing is 20 °C and this precise
temperature control is maintained by peltier cooling within the IEF cell system. The
temperature must be kept constant at specified value because any change in temperature
may affect the pI of sample proteins and this causes spot position change in
polyacrylamide gel. It is proved that 20 °C is the optimal temperature for IEF run and it
19
is required for enhancement of reproducibility (Görg, et al. 1991). Carbamylation of
proteins may occur when the temperature is too much above 20 °C while much lower
temperatures may cause precipitation of rehydration solution components such as urea.
Figure 2.4. PROTEAN IEF Cell System
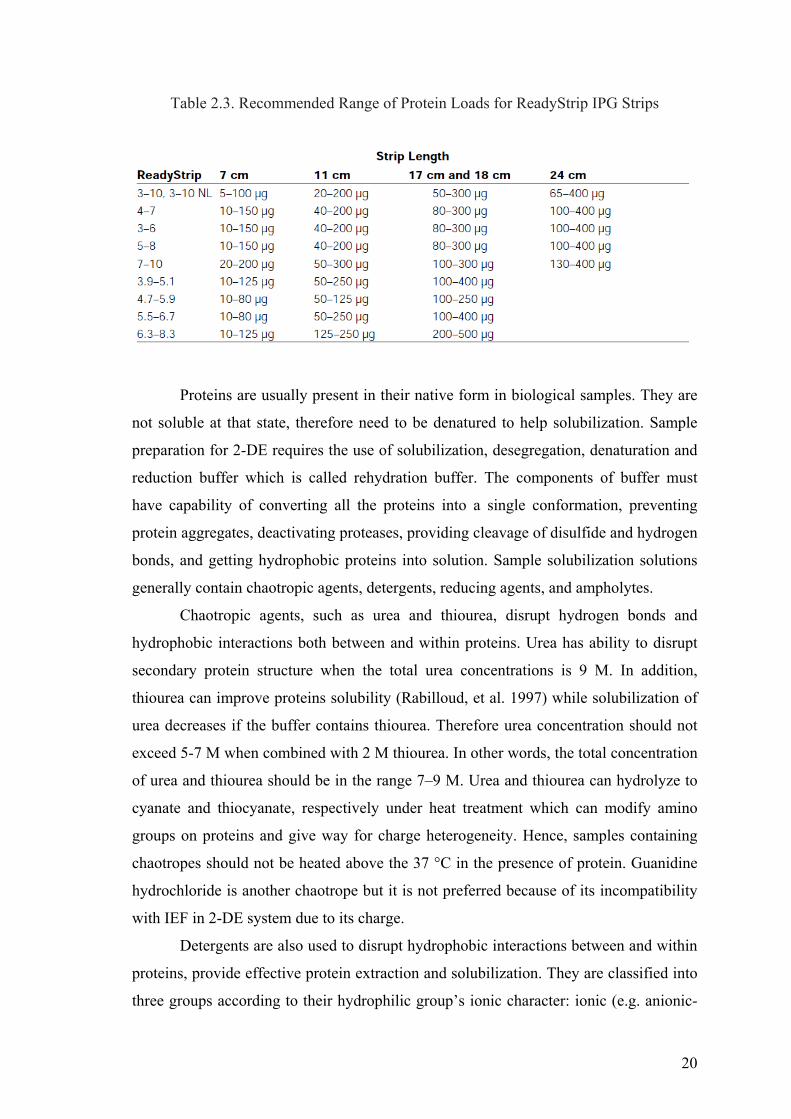
Focusing conditions will vary with sample composition, sample complexity, and
IPG pH range. The current should not be exceeded 50 µA/strip. The total voltage
applied onto the strip is shown in volt-hour integrals (Vh) in IEF. If the applied Vh is
not enough for focusing, the protein spots on a gel may undergo horizontal streaking. In
the same way, when the proteins are focused too long, cysteines will become oxidized
and the structure of protein will change. The modified proteins have different pI and
start to migrate again with the horizontal streaks radiating from the spots. Hence, the
best results are obtained with the shortest possible focusing steps at the highest possible
voltage (Lopez 2007). The following tables show the parameters recommended for IEF
program and the range of protein loads for IPG ReadyStrip by Bio-Rad company.
Table 2.2. Recommended PROTEAN IEF Cell Focusing Condition
20
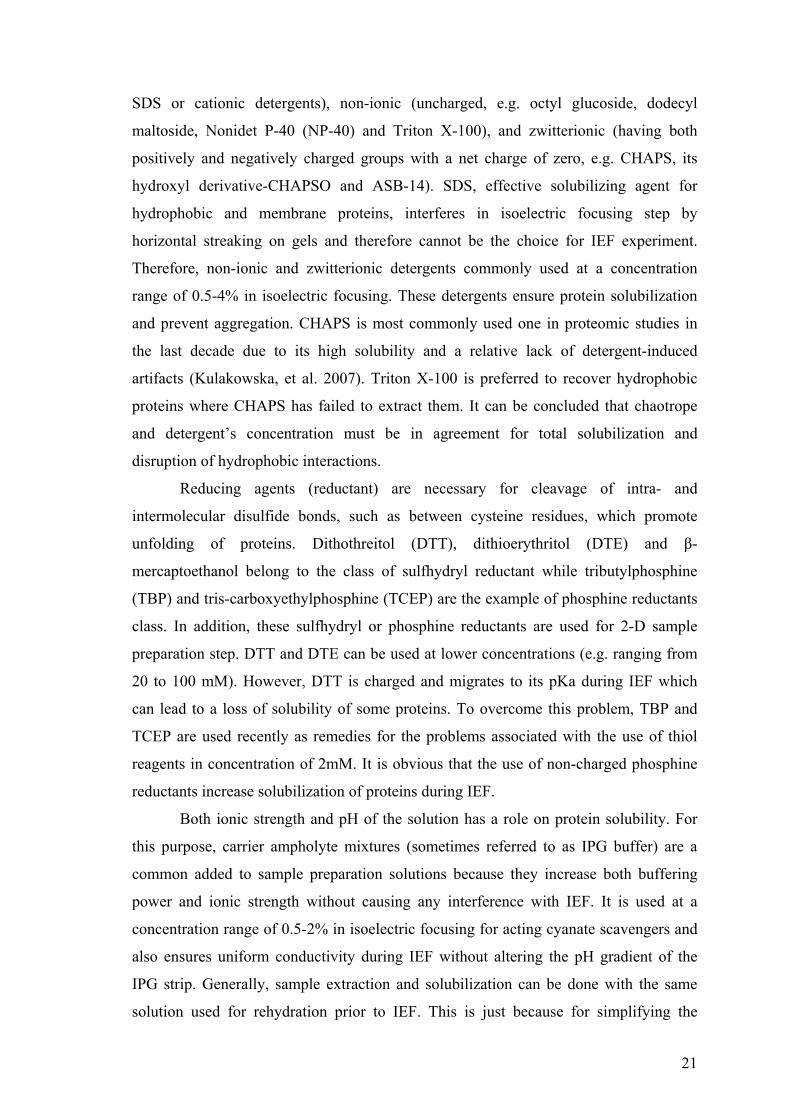
Table 2.3. Recommended Range of Protein Loads for ReadyStrip IPG Strips
Proteins are usually present in their native form in biological samples. They are
not soluble at that state, therefore need to be denatured to help solubilization. Sample
preparation for 2-DE requires the use of solubilization, desegregation, denaturation and
reduction buffer which is called rehydration buffer. The components of buffer must
have capability of converting all the proteins into a single conformation, preventing
protein aggregates, deactivating proteases, providing cleavage of disulfide and hydrogen
bonds, and getting hydrophobic proteins into solution. Sample solubilization solutions
generally contain chaotropic agents, detergents, reducing agents, and ampholytes.
Chaotropic agents, such as urea and thiourea, disrupt hydrogen bonds and
hydrophobic interactions both between and within proteins. Urea has ability to disrupt
secondary protein structure when the total urea concentrations is 9 M. In addition,
thiourea can improve proteins solubility (Rabilloud, et al. 1997) while solubilization of
urea decreases if the buffer contains thiourea. Therefore urea concentration should not
exceed 5-7 M when combined with 2 M thiourea. In other words, the total concentration
of urea and thiourea should be in the range 7–9 M. Urea and thiourea can hydrolyze to
cyanate and thiocyanate, respectively under heat treatment which can modify amino
groups on proteins and give way for charge heterogeneity. Hence, samples containing
chaotropes should not be heated above the 37 °C in the presence of protein. Guanidine
hydrochloride is another chaotrope but it is not preferred because of its incompatibility
with IEF in 2-DE system due to its charge.
Detergents are also used to disrupt hydrophobic interactions between and within
proteins, provide effective protein extraction and solubilization. They are classified into
three groups according to their hydrophilic group’s ionic character: ionic (e.g. anionic-
21
SDS or cationic detergents), non-ionic (uncharged, e.g. octyl glucoside, dodecyl
maltoside, Nonidet P-40 (NP-40) and Triton X-100), and zwitterionic (having both
positively and negatively charged groups with a net charge of zero, e.g. CHAPS, its
hydroxyl derivative-CHAPSO and ASB-14). SDS, effective solubilizing agent for
hydrophobic and membrane proteins, interferes in isoelectric focusing step by
horizontal streaking on gels and therefore cannot be the choice for IEF experiment.
Therefore, non-ionic and zwitterionic detergents commonly used at a concentration
range of 0.5-4% in isoelectric focusing. These detergents ensure protein solubilization
and prevent aggregation. CHAPS is most commonly used one in proteomic studies in
the last decade due to its high solubility and a relative lack of detergent-induced
artifacts (Kulakowska, et al. 2007). Triton X-100 is preferred to recover hydrophobic
proteins where CHAPS has failed to extract them. It can be concluded that chaotrope
and detergent’s concentration must be in agreement for total solubilization and
disruption of hydrophobic interactions.
Reducing agents (reductant) are necessary for cleavage of intra- and
intermolecular disulfide bonds, such as between cysteine residues, which promote
unfolding of proteins. Dithothreitol (DTT), dithioerythritol (DTE) and β-
mercaptoethanol belong to the class of sulfhydryl reductant while tributylphosphine
(TBP) and tris-carboxyethylphosphine (TCEP) are the example of phosphine reductants
class. In addition, these sulfhydryl or phosphine reductants are used for 2-D sample
preparation step. DTT and DTE can be used at lower concentrations (e.g. ranging from
20 to 100 mM). However, DTT is charged and migrates to its pKa during IEF which
can lead to a loss of solubility of some proteins. To overcome this problem, TBP and
TCEP are used recently as remedies for the problems associated with the use of thiol
reagents in concentration of 2mM. It is obvious that the use of non-charged phosphine
reductants increase solubilization of proteins during IEF.
Both ionic strength and pH of the solution has a role on protein solubility. For
this purpose, carrier ampholyte mixtures (sometimes referred to as IPG buffer) are a
common added to sample preparation solutions because they increase both buffering
power and ionic strength without causing any interference with IEF. It is used at a
concentration range of 0.5-2% in isoelectric focusing for acting cyanate scavengers and
also ensures uniform conductivity during IEF without altering the pH gradient of the
IPG strip. Generally, sample extraction and solubilization can be done with the same
solution used for rehydration prior to IEF. This is just because for simplifying the
22
experimental procedure and ensures that there is no IEF incompatible chemicals are
introduced during sample preparation.
2.3.1.2. IPG Strip Equilibration
Prior to the second dimension separation, an equilibration step is necessary to
saturate the IPG strip with SDS and for efficient transfer of the proteins into the SDS-
PAGE gel. Strip equilibration is a two-step process to ensure the proteins are suitable
for SDS-PAGE analysis. Equilibration buffer I, which contains 50 mM Tris-HCl (pH
8.8), 2% (w/v) SDS, 1% (w/v) DTT, 6 M urea and 30% (w/v) glycerol, is initially added
onto focused IPG strips for 10-15 minutes (Görg, et al. 1988). This is followed by a
further 10–15 minute equilibration in the same solution containing 4% (w/v)
iodoacetamide instead of DTT which is called equilibration buffer II. Urea and glycerol
is required to reduce electroendosmotic effects. Electroendosmosis is the movement of
buffer within the IPG strip and is due to the fixed charge associated with the ampholytes
contained within the strip. The usage of DTT in the first equilibrium buffer is cleavage
of sulfhydryl bonds between cysteine residues within a protein. In contrast,
iodoacetamide is alkylated any thiol groups in the protein preventing their reoxidation
where reoxidation can result in streaking within the gels. Besides reoxidation, it also
alkylates any remaining DTT to prevent point streaking.
The treatment of strips with these two equilibrium buffer is strongly
recommended, since it considerably simplifies further protein identification with in-gel
digestion procedure by mass spectrometry. After equilibration steps, the IPG strips are
applied onto the surface of the second dimension vertical SDS-PAGE gels.
Table 2.4. The Minimum Required Equilibrium Buffers for One Strip
23
2.3.2. Second Dimension: SDS-PAGE
SDS-PAGE, sodium dodecyl sulfate-polyacrylamide gel electrophoresis, gives a
rapid and relatively accurate way to determine the protein’s molecular weight. The
theory is simply based on electrophoretic mobility of proteins within polyacrylamide gel
pores where smaller proteins move more rapidly through the gel than larger proteins
such that mixtures of proteins are separated according to their molecular size.
Proteins are found into a variety of shapes such as compact or elongated in their
native form. Therefore, protein mixture is firstly solubilized with a buffer solution
containing SDS, an anionic detergent, which denatures secondary and tertiary protein
structures. During mixing, the SDS binds to the protein in a ratio of 1.4 g SDS per gram
of protein to form micelles. This creates a uniform mass-to-charge ratio between
different proteins which allows separation on a polyacrylamide gel only by mass.
Without SDS, proteins that are similar in molecular weights can move differently in
polyacrylamide gels because of difference in folding pattern. SDS masks the charge of
the proteins themselves by surrounding proteins with its negative charge. The
magnitude of negative charge on a protein is proportional to the protein’s molecular
weight. The principle underlying SDS solubilization is the fact that all proteins are
negatively charged for movement in the same direction, towards the positive electrode.
The most commonly used buffer for the second dimension is the discontinuous
Tris–chloride/Tris–glycine buffer system of Läemmli (Läemmli 1970). In the classical
SDS-PAGE, the gel divided into an upper “stacking” gel with low percentage and pH of
6.8 by having large pore size and a lower “resolving” gel with pH 8.8 with much
smaller pores. However, development and usage of IPG strips have solved two stage gel
preparation case, because proteins are already pre-separated by the IEF. Hence, today’s
2-DE systems do not needed stacking gel.
Polyacrylamide gels are simple to prepare with sufficient number of parameters,
which can be changed to optimize the specific separation, being considered. The
parameters include the total acrylamide content, the degree of cross-linking in the
polyacrylamide and the thickness and length of the gel. Total acrylamide content and
the cross-linker content of the gel can be represented by % T and % C, respectively. At
certain polyacrylamide percentage, there is a linear relationship between molecular
weight and the relative migration distance of proteins in gels. The pore size can be
24
controlled by varying the % T from 4 % to 20 % T with constant % C at 2.7. The most
appropriate acrylamide concentration is 12 % due to correct and linear separation of
proteins from 7 kDa to 202 kDa. Gels with lower percentages have not good protein
resolution in 2-DE maps and higher percentages makes extraction of proteins from gels
more difficult for further protein identification, such as mass spectrometric analysis. In
addition, the molecular weight of proteins can be roughly estimated by running standard
of known molecular weights in the same gel.
Polyacrylamide gels are mainly composed of chains of polymerized acrylamide
that cross-linked by a bifunctional agent that is called N, N΄-methylenebisacrylamide,
SDS, Tris-buffers, N, N, N΄, N΄ -tetramethylethylenediamine (TEMED) and ammonium
persulfate (APS). The size of pores decreases as the bisacrylamide to acrylamide ratio
increases. Additionally, APS provides the free radicals that drive polymerization of
acrylamide and bisacrylamide while TEMED accelerates the polymerization of
acrylamide and bisacrylamide by catalyzing the formation of these free radicals formed.
Overall, 2-DE is an analytical method for determining isoelectric point,
molecular weight, and the relative amount of protein in mixture. The focused proteins
on IPG strip is saturated with SDS and transferred to the molecular weight gel for the
second dimension. The final gel is a kind of protein map that represent the separated
proteins according to pI across the x-axis and according to molecular weight across the
y-axis. Additionally, these gels are displayed with acidic side of the gel oriented on the
left while basic side of the gel oriented on the right, and the protein’s molecular weights
decreasing from the top to the bottom of the gel.
2.4. Detection of Protein Spots and Image Analysis
The final component of 2-DE experiment is visualization of separated protein
spots on gels either by universal or by specific staining methods. Universal staining
methods for protein detection on two-dimensional gels include staining with Coomassie
blue dye, silver staining, negative staining with metal cations (e.g. zinc imidazole),
staining or labeling with organic or fluorescent dyes, detection by radioactive isotopes,
and by immunological detection. Specific staining methods are used for detecting PTMs
(e.g. phosphorylation, methylation, etc.) either employed directly on gel or after
transferring onto an immobilizing membrane. Coomassie blue staining, silver staining
25
and fluorescence staining are the most preferred detection methods for proteomic
researches. There are important properties required for ideal protein detection on two-
dimensional gel. It should be sensitive (low detection limit), reproducible, compatible
with mass spectrometry and it should also have linear and wide dynamic range.
Unfortunately, there is no method currently that meets all these requirements together.
Moreover, the gels are generally fixed overnight in ethanol/acetic acid/water mixture to
eliminate any interfere compound which may come from detergents, carrier ampholytes,
etc. before staining step.
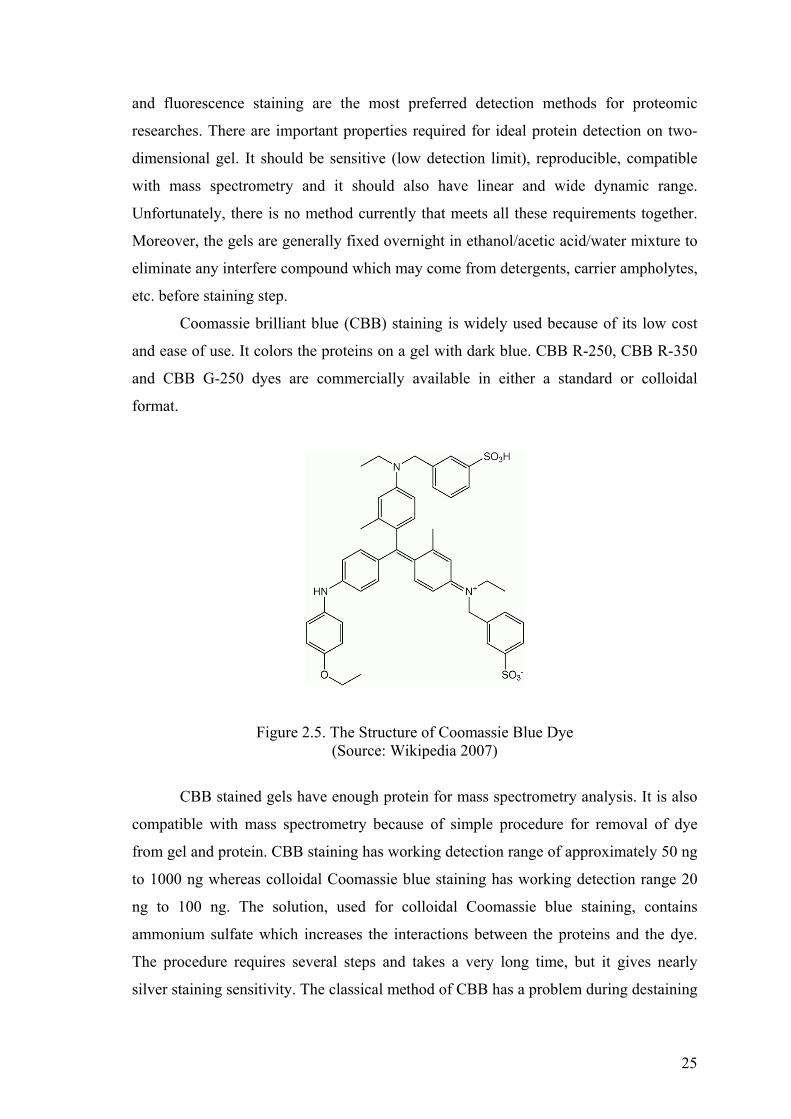
Coomassie brilliant blue (CBB) staining is widely used because of its low cost
and ease of use. It colors the proteins on a gel with dark blue. CBB R-250, CBB R-350
and CBB G-250 dyes are commercially available in either a standard or colloidal
format.
Figure 2.5. The Structure of Coomassie Blue Dye (Source: Wikipedia 2007)
CBB stained gels have enough protein for mass spectrometry analysis. It is also
compatible with mass spectrometry because of simple procedure for removal of dye
from gel and protein. CBB staining has working detection range of approximately 50 ng
to 1000 ng whereas colloidal Coomassie blue staining has working detection range 20
ng to 100 ng. The solution, used for colloidal Coomassie blue staining, contains
ammonium sulfate which increases the interactions between the proteins and the dye.
The procedure requires several steps and takes a very long time, but it gives nearly
silver staining sensitivity. The classical method of CBB has a problem during destaining
26
due to spots are also partially destained. Quantification cannot be accurate and
reproducible for this type of staining because steady state between dye and protein is
not established totally.
Silver staining is another technique for detection proteins that have low
abundance (less than 1.0 ng) while colloidal CBB staining detects approximately 50 ng
of protein. Silver staining improves this protein detection value up to fifty-fold and it
has a linear response over 0.02-0.8 ng/mm2 (Merril 1990). It has a two-step process for
color development. In the first step, silver is bound to the protein by soaking the gel in a
dilute silver nitrate solution. In the second step, protein-bound silver is detected by
reduction with formaldehyde. Some modifications are required to make silver staining
compatible with mass spectrometry by eliminating glutaraldehyde and formalin from
silver staining solutions. Glutaraldehyde and formalin fix the proteins in the gel,
prevents both digestion and the recovery of any peptides formed. Therefore, the gels can
not be fixed by with these chemicals. The most important advantage of silver staining is
its sensitivity. Silver staining is estimated 50-fold more sensitive than Coomassie blue
staining. Due to its high sensitivity, it is useful when dealing with qualitative variations
such as presence or absence of protein spots. However, Coomassie blue staining is more
preferable when the aim is to detect the quantitative changes on protein spots.
In the last years, fluorescent dyes were introduced and provide high detection
sensitivity, dynamic range and reproducibility. Proteins can be stained with a
fluorescent dye such as ruthenium II tris (bathophentroline disulfonate) (RuBPS) and
SYPRO Ruby (Rabilloud, et al. 2001) after the electrophoretic separation. The detection
limit is nearly 1-2 ng protein per spot, and it is compatible with mass spectrometry.
However, their usage remains relatively limited due to their cost and technical
difficulties.
After staining the gel, the gel images have to be converted into digital data using
a scanner or camera and then analyzed with a computer program such as, PD Quest,
Bio-Rad and Delta2D, Decodon. These programs have a capability for spot detection,
spot filtering, spot editing, background correction, gel matching, normalization,
quantification, etc.
Finally it can be concluded that the position of protein spots in polyacrylamide
gel do not provide exact identification of it. For that reason, protein spots (i.e. newly
expressed and up- or down-regulated) are excised from gel and digested (in-gel
27
digestion) into peptide fragments with specific enzyme (generally trypsin) and then
identified using mass spectrometry and database searches.
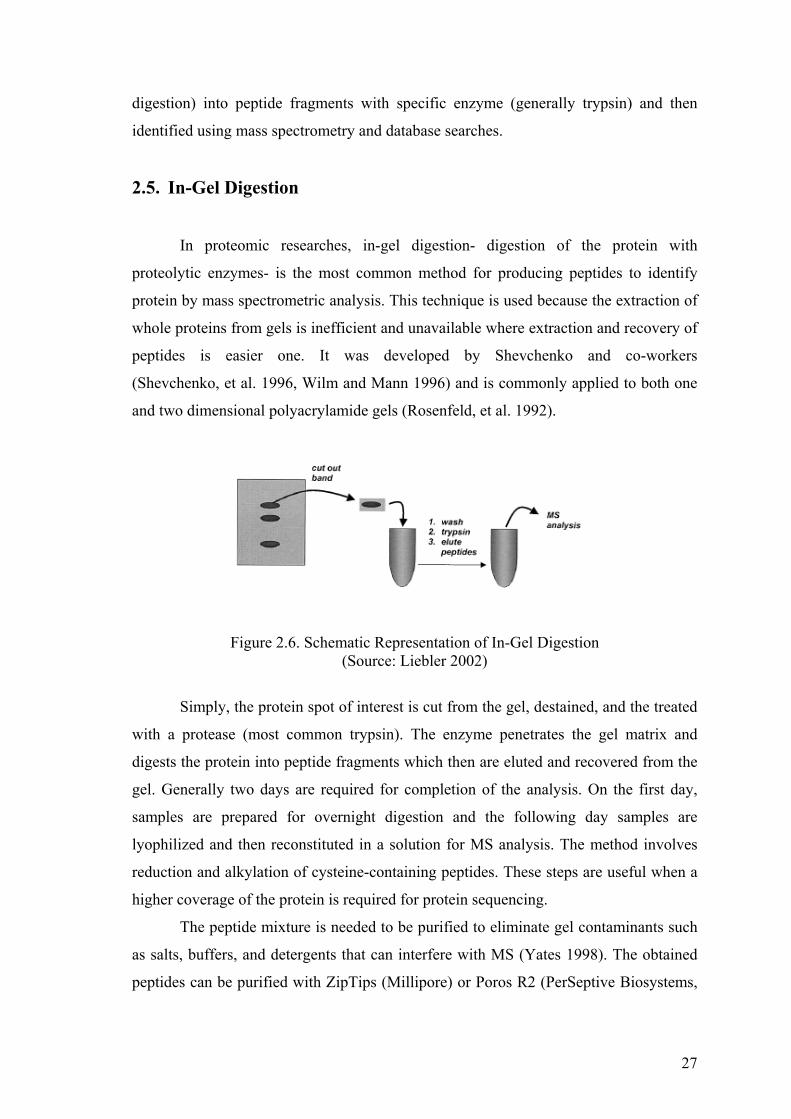
2.5. In-Gel Digestion
In proteomic researches, in-gel digestion- digestion of the protein with
proteolytic enzymes- is the most common method for producing peptides to identify
protein by mass spectrometric analysis. This technique is used because the extraction of
whole proteins from gels is inefficient and unavailable where extraction and recovery of
peptides is easier one. It was developed by Shevchenko and co-workers
(Shevchenko, et al. 1996, Wilm and Mann 1996) and is commonly applied to both one
and two dimensional polyacrylamide gels (Rosenfeld, et al. 1992).
Figure 2.6. Schematic Representation of In-Gel Digestion (Source: Liebler 2002)
Simply, the protein spot of interest is cut from the gel, destained, and the treated
with a protease (most common trypsin). The enzyme penetrates the gel matrix and
digests the protein into peptide fragments which then are eluted and recovered from the
gel. Generally two days are required for completion of the analysis. On the first day,
samples are prepared for overnight digestion and the following day samples are
lyophilized and then reconstituted in a solution for MS analysis. The method involves
reduction and alkylation of cysteine-containing peptides. These steps are useful when a
higher coverage of the protein is required for protein sequencing.
The peptide mixture is needed to be purified to eliminate gel contaminants such
as salts, buffers, and detergents that can interfere with MS (Yates 1998). The obtained
peptides can be purified with ZipTips (Millipore) or Poros R2 (PerSeptive Biosystems,
28
Framingham, Mass.) (Wilm and Mann 1996) or by high-pressure liquid
chromatography (HPLC).
Several other enzymes are also be used in in-gel digestion approach such as
chymotrypsin, endoprotease Lys-C, endoprotease Arg-C, etc. The most commonly used
protease is trypsin for sequencing experiments with tandem mass spectrometry
(MS/MS). Because trypsin cleaves amide bonds in proteins at the C-terminal side of
lysine (K) and arginine (R) residues, unless either of these is followed by a proline
residue in the C-terminal direction. It also produces small peptides, generally in the
mass range of 600-2500 Da.
The ideal protein digestion method would cleave proteins at certain specific
amino acid residues to produce highest yield of peptides of optimal length for MS
analysis. Peptides of between about 6-20 amino acid length are optimal for MS analysis
and database comparisons. If the peptides are shorter than six amino acids, it may not
produce unique sequence matches in database searches.
2.6. Mass Spectrometry
MS can be described as the study of gas-phase ions, and the main goal of mass
spectrometric experiments is to characterize the structure of a molecules. MS became a
valuable tool in the field of biochemistry by the development of fast atom bombardment
(FAB) in 1981 (Barber, et al. 1981). Since early 1990’s, MS has been living its golden
age with the introduction of new soft ionization techniques, namely electrospray
ionization by Fenn and co-workers (ESI) (Fenn, et al. 1989) and matrix-assisted laser
desorption/ionization by Karas and Hillenkamp (MALDI) (Karas and Hillenkamp
1988). MS currently plays a central role in the identification and characterization of
large biomolecules such as proteins and peptides. The most attractive properties of MS
with these new ionization methods are high informational content of MS data, high
sensitivity (low attomole levels), rapidity, versatility, and the accuracy of the method in
the field of biological science.
29
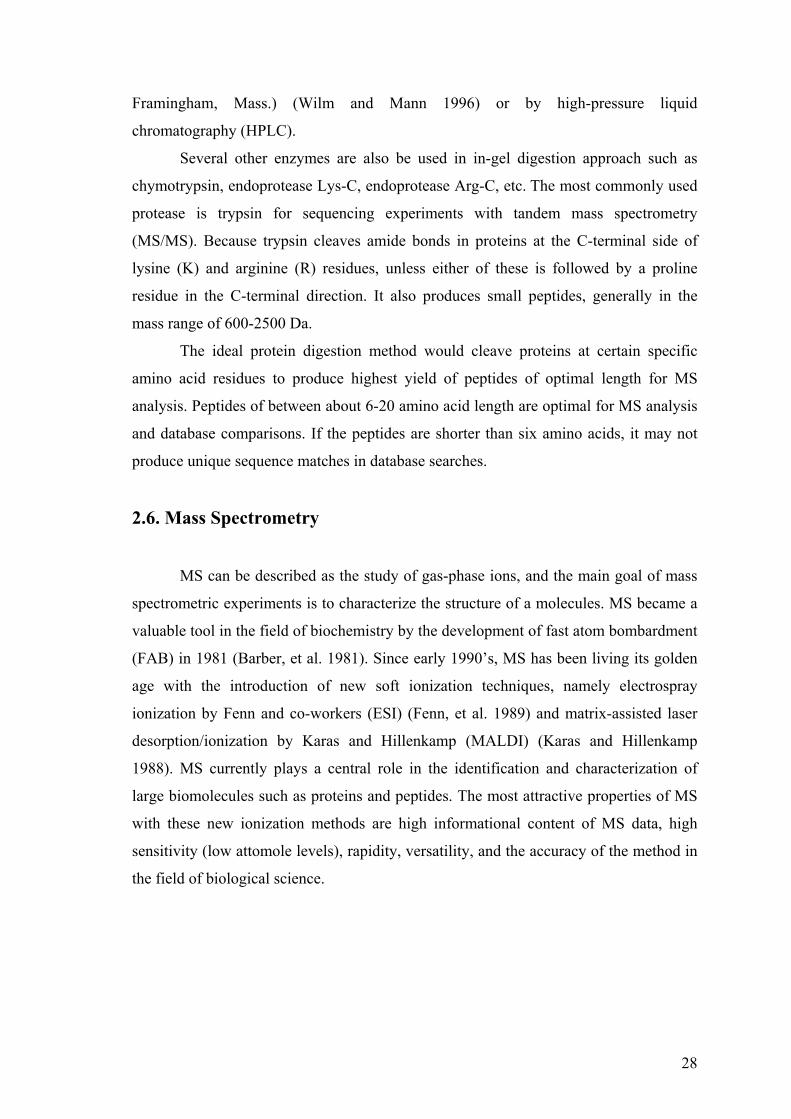
2.6.1. An Overview of the Instrumentation
Mass spectrometers have mainly three essential parts, namely the ionization
source, the mass analyzer, and the detector.
Figure 2.7. Schematic Representation of Mass Spectrometer (Source: Liebler 2002)
The first part is the ionization source (e.g. ESI, MALDI) which produces ions
from liquid and solid the sample. The second part is the mass analyzer (e.g. quadrupole,
time-of-flight (TOF)) which resolves ions based on their mass-to-charge ratio (m/z).
The third and last part is the detector (photomultiplier, microchannel plate, electron
multiplier) which detects the ions resolved by the mass analyzer. In short, the basic
process associated with a mass spectrometer is generation of gas-phase ions derived
from an analyte and the measurement of those ions according to their mass-to-charge
ratio. Each of these three parts of mass spectrometer is under vacuum-pump systems
which is required for their function.
2.6.1.1. Sample Ionization Methods
The molecules have to be charged and dry for biological samples to be analyzed
the by MS. As mentioned above, the two most common methods for converting sample
molecules to desolvated ions are electrospray ionization and matrix-assisted laser
30
desorption/ionization. ESI and MALDI are called a “soft” ionization techniques, due to
ionization without fragmentation which allow the formation of ions without significant
loss of sample integrity and therefore provides molecular weight information. Ions are
formed in both methods by the addition or loss of one or more protons.
2.6.1.1.a. Electrospray Ionization (ESI)
The design and working principle of electrospray ion sources used in today’s
mass spectrometers is firstly described by Fenn and co-workers in 1985 (Whitehouse, et
al. 1985). In the electrospray ionization of peptides, acidic aqueous solution is sprayed
through a small needle. A positive and high voltage is applied to this needle to produce
a Taylor cone from which droplets of the solution are sputtered. At that moment
droplets take protons from acidic medium which causes to move from the needle
towards the negatively charged instrument. During this movement, solvent evaporates
and the sizes of the droplets decrease resulting in the formation of desolvated ions by
the help of uncharged warm carrier gas such as nitrogen flowing around the outside of
the capillary. As the solvent evaporates, the analyte molecules are forced closer
together, repel each other and break up the droplets. The process continues until the
analyte is free of solvent, and finally they can be directed into the mass analyzer of mass
spectrometer by appropriate electric fields.
Nanospray and microspray are additional ESI ionization techniques used in the
mass spectrometric analysis of peptides (Wilm and Mann 1996, Wilm, et al. 1996). In
nanospray ionization, the microcapillary tube has a spraying orifice of 1 to 2 µm and
flow rates nearly 5 to 10 nL/min. The advantage of low flow rates in nanospray
ionization is reducing the amount of sample that consumed and increasing the time that
required for analysis.
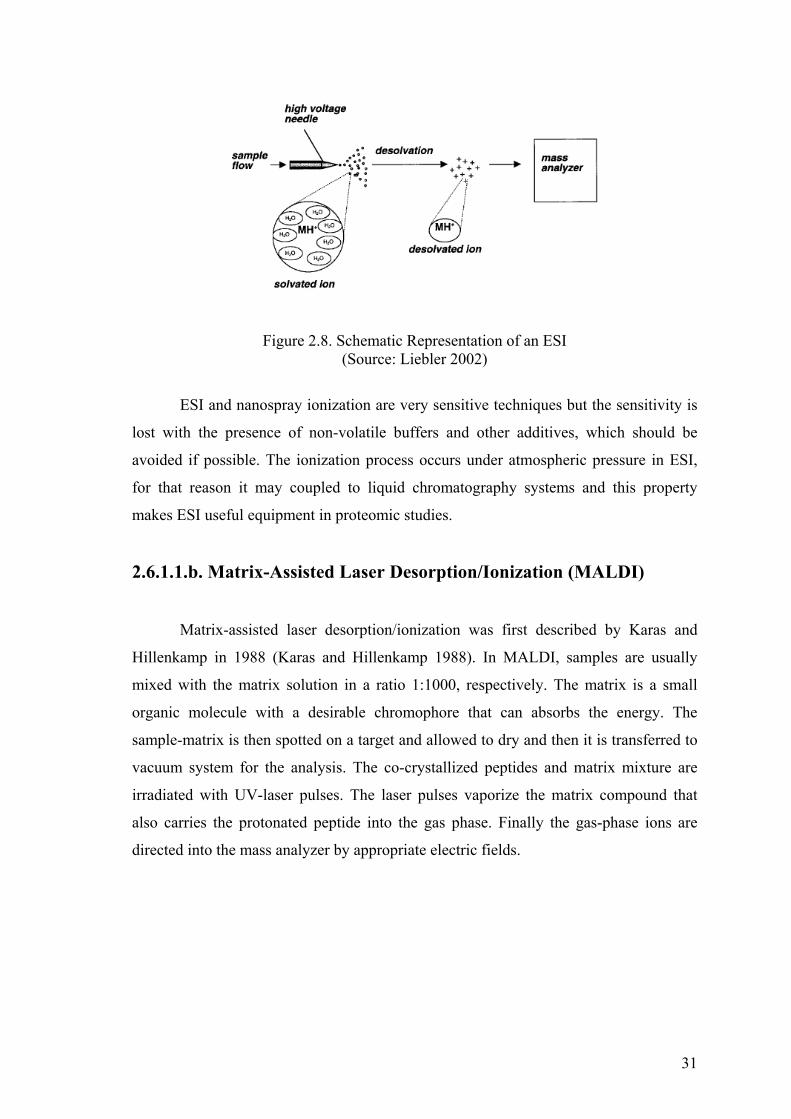
31
Figure 2.8. Schematic Representation of an ESI (Source: Liebler 2002)
ESI and nanospray ionization are very sensitive techniques but the sensitivity is
lost with the presence of non-volatile buffers and other additives, which should be
avoided if possible. The ionization process occurs under atmospheric pressure in ESI,
for that reason it may coupled to liquid chromatography systems and this property
makes ESI useful equipment in proteomic studies.
2.6.1.1.b. Matrix-Assisted Laser Desorption/Ionization (MALDI)
Matrix-assisted laser desorption/ionization was first described by Karas and
Hillenkamp in 1988 (Karas and Hillenkamp 1988). In MALDI, samples are usually
mixed with the matrix solution in a ratio 1:1000, respectively. The matrix is a small
organic molecule with a desirable chromophore that can absorbs the energy. The
sample-matrix is then spotted on a target and allowed to dry and then it is transferred to
vacuum system for the analysis. The co-crystallized peptides and matrix mixture are
irradiated with UV-laser pulses. The laser pulses vaporize the matrix compound that
also carries the protonated peptide into the gas phase. Finally the gas-phase ions are
directed into the mass analyzer by appropriate electric fields.
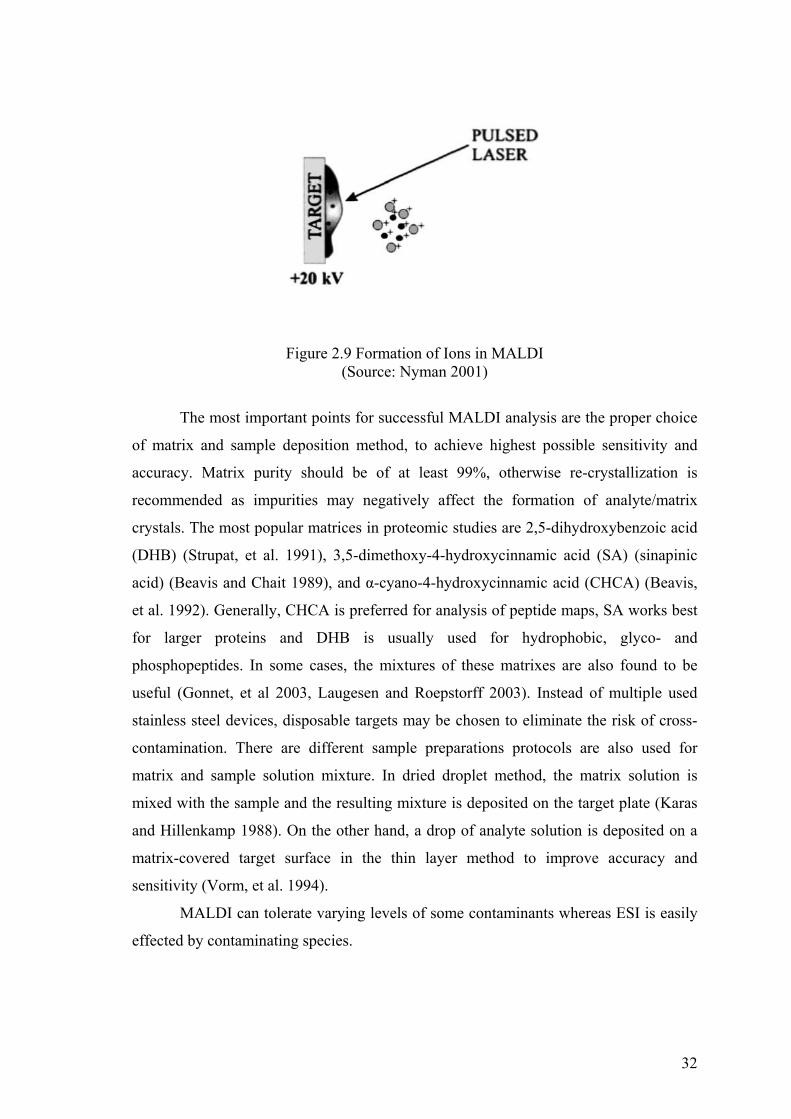
32
Figure 2.9 Formation of Ions in MALDI (Source: Nyman 2001)
The most important points for successful MALDI analysis are the proper choice
of matrix and sample deposition method, to achieve highest possible sensitivity and
accuracy. Matrix purity should be of at least 99%, otherwise re-crystallization is
recommended as impurities may negatively affect the formation of analyte/matrix
crystals. The most popular matrices in proteomic studies are 2,5-dihydroxybenzoic acid
(DHB) (Strupat, et al. 1991), 3,5-dimethoxy-4-hydroxycinnamic acid (SA) (sinapinic
acid) (Beavis and Chait 1989), and α-cyano-4-hydroxycinnamic acid (CHCA) (Beavis,
et al. 1992). Generally, CHCA is preferred for analysis of peptide maps, SA works best
for larger proteins and DHB is usually used for hydrophobic, glyco- and
phosphopeptides. In some cases, the mixtures of these matrixes are also found to be
useful (Gonnet, et al 2003, Laugesen and Roepstorff 2003). Instead of multiple used
stainless steel devices, disposable targets may be chosen to eliminate the risk of cross-
contamination. There are different sample preparations protocols are also used for
matrix and sample solution mixture. In dried droplet method, the matrix solution is
mixed with the sample and the resulting mixture is deposited on the target plate (Karas
and Hillenkamp 1988). On the other hand, a drop of analyte solution is deposited on a
matrix-covered target surface in the thin layer method to improve accuracy and
sensitivity (Vorm, et al. 1994).
MALDI can tolerate varying levels of some contaminants whereas ESI is easily
effected by contaminating species.
33
2.6.1.2. Mass Analyzers
There are several mass analyzers for MS, but the most common and useful ones
for biomolecules are quadrupole mass analyzer, time-of-flight (TOF), quadrupole ion
traps, and Fourier transform ion cyclotron resonance (FT-ICR) mass spectrometry. The
main function of the mass analyzer is to separate the ions formed in the ionization
source of the mass spectrometer according to their mass-to-charge (m/z) ratios.
Generally, TOF is connected to MALDI and triple quadrupole-TOF or ion traps coupled
to ESI for analyzing large biomolecules. In most proteomic works, MALDI-TOF
instruments and the ESI-tandem MS instruments are used where they completely
operate in different ways and generate different but complementary information.
MALDI-TOF MS enables for identification of proteins by peptide masses (peptide mass
fingerprints; PMF) where ESI MS/MS describes peptide fragmentation.
In some cases, hybrid instruments are also used for structural and sequencing
studies. There is more than one analyzer in this hybrid tandem mass spectrometry
systems. More popular designs are quadrupole-quadrupole, magnetic sector-quadrupole,
and quadrupole-time-of-flight geometries.
In proteomic approach, there are three types of tandem mass analyzers coupled
to ESI source, namely triple quadrupole, quadrupole-ion trap, and quadrupole-TOF. The
general theory behind them is generation of peptide ions in ESI source followed by
analyzing in tandem MS analyzer which select a single m/z species. Meanwhile, the
selected ion is subjected to collision-induced dissociation (CID) which produces
fragment ions and neutral fragments. Then, the fragment ions are analyzed on the basis
of their m/z to yield a product ion spectrum. Finally, the sequence of the peptide can be
deduced from information which is collected in tandem mass spectrum.
2.6.1.2.a. Time-of-Flight Mass Analyzer (TOF)
A time-of-flight instrument is one of the simplest mass analyzers among them.
Basically, the ions are introduced directly from the source of the instrument as a pulse.
All the ions are given the same initial kinetic energy by the extraction pulse. Following
acceleration, the ion enters a field-free region where it travels at a velocity that is
inversely proportional to its m/z. In other words, ions with low m/z travel more rapidly
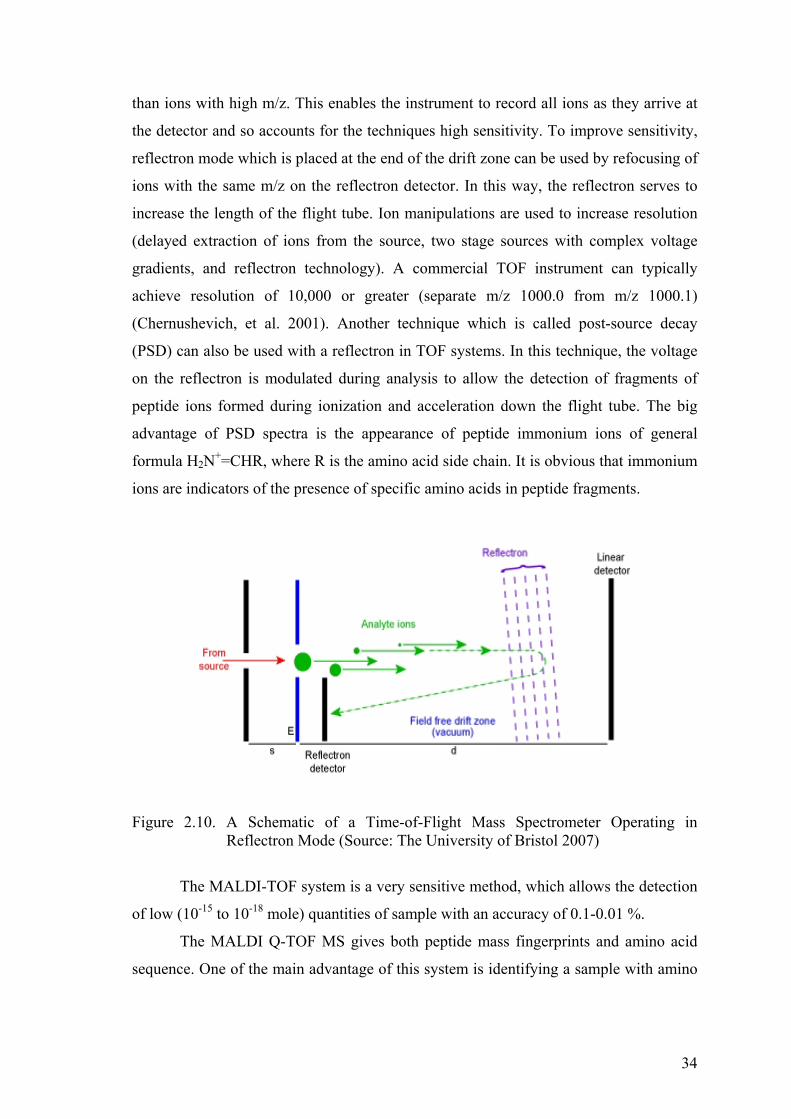
34
than ions with high m/z. This enables the instrument to record all ions as they arrive at
the detector and so accounts for the techniques high sensitivity. To improve sensitivity,
reflectron mode which is placed at the end of the drift zone can be used by refocusing of
ions with the same m/z on the reflectron detector. In this way, the reflectron serves to
increase the length of the flight tube. Ion manipulations are used to increase resolution
(delayed extraction of ions from the source, two stage sources with complex voltage
gradients, and reflectron technology). A commercial TOF instrument can typically
achieve resolution of 10,000 or greater (separate m/z 1000.0 from m/z 1000.1)
(Chernushevich, et al. 2001). Another technique which is called post-source decay
(PSD) can also be used with a reflectron in TOF systems. In this technique, the voltage
on the reflectron is modulated during analysis to allow the detection of fragments of
peptide ions formed during ionization and acceleration down the flight tube. The big
advantage of PSD spectra is the appearance of peptide immonium ions of general
formula H2N+=CHR, where R is the amino acid side chain. It is obvious that immonium
ions are indicators of the presence of specific amino acids in peptide fragments.
Figure 2.10. A Schematic of a Time-of-Flight Mass Spectrometer Operating in Reflectron Mode (Source: The University of Bristol 2007)
The MALDI-TOF system is a very sensitive method, which allows the detection
of low (10-15 to 10-18 mole) quantities of sample with an accuracy of 0.1-0.01 %.
The MALDI Q-TOF MS gives both peptide mass fingerprints and amino acid
sequence. One of the main advantage of this system is identifying a sample with amino
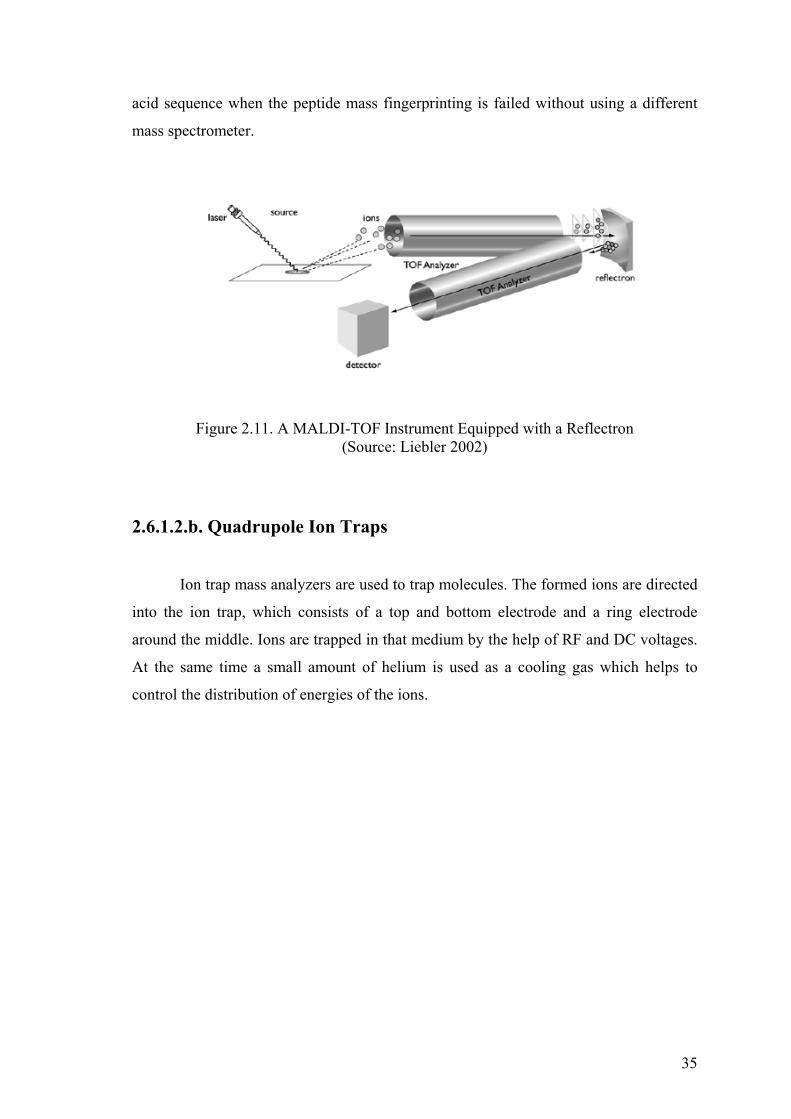
35
acid sequence when the peptide mass fingerprinting is failed without using a different
mass spectrometer.
Figure 2.11. A MALDI-TOF Instrument Equipped with a Reflectron (Source: Liebler 2002)
2.6.1.2.b. Quadrupole Ion Traps
Ion trap mass analyzers are used to trap molecules. The formed ions are directed
into the ion trap, which consists of a top and bottom electrode and a ring electrode
around the middle. Ions are trapped in that medium by the help of RF and DC voltages.
At the same time a small amount of helium is used as a cooling gas which helps to
control the distribution of energies of the ions.
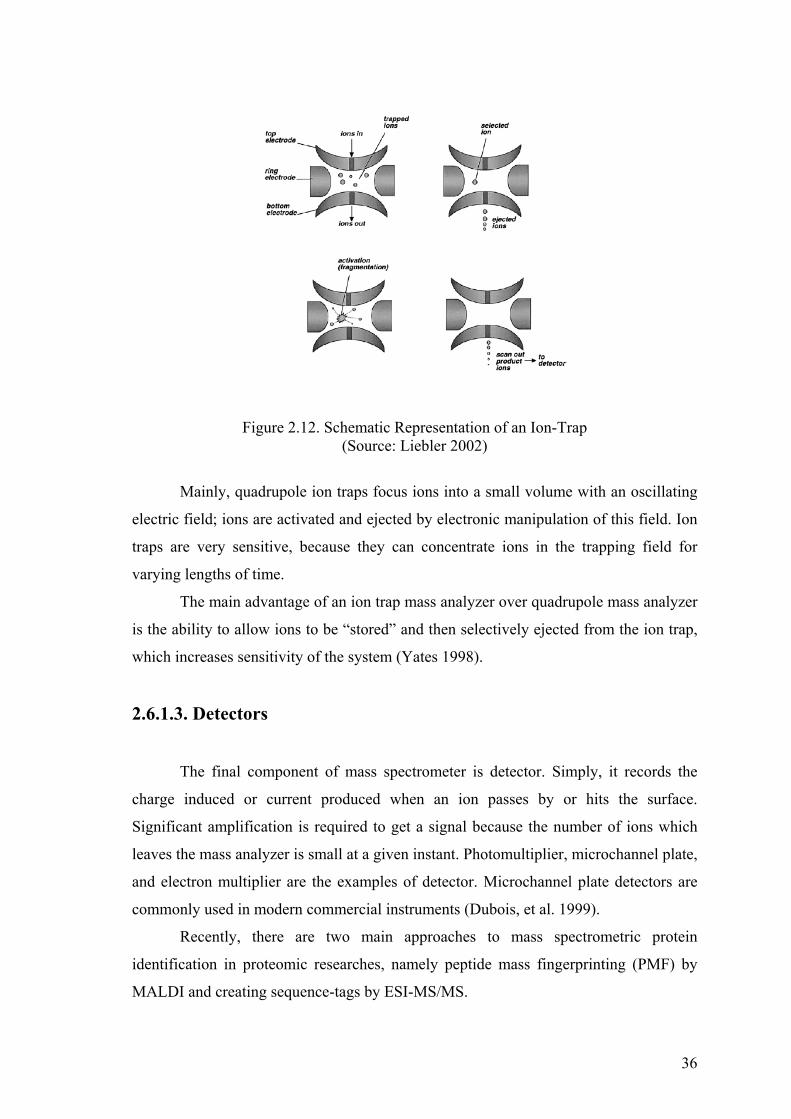
36
Figure 2.12. Schematic Representation of an Ion-Trap (Source: Liebler 2002)
Mainly, quadrupole ion traps focus ions into a small volume with an oscillating
electric field; ions are activated and ejected by electronic manipulation of this field. Ion
traps are very sensitive, because they can concentrate ions in the trapping field for
varying lengths of time.
The main advantage of an ion trap mass analyzer over quadrupole mass analyzer
is the ability to allow ions to be “stored” and then selectively ejected from the ion trap,
which increases sensitivity of the system (Yates 1998).
2.6.1.3. Detectors
The final component of mass spectrometer is detector. Simply, it records the
charge induced or current produced when an ion passes by or hits the surface.
Significant amplification is required to get a signal because the number of ions which
leaves the mass analyzer is small at a given instant. Photomultiplier, microchannel plate,
and electron multiplier are the examples of detector. Microchannel plate detectors are
commonly used in modern commercial instruments (Dubois, et al. 1999).
Recently, there are two main approaches to mass spectrometric protein
identification in proteomic researches, namely peptide mass fingerprinting (PMF) by
MALDI and creating sequence-tags by ESI-MS/MS.
37
In PMF, the protein spot of interest is in-gel digested with an enzyme followed
by recovering of the peptides from gel. The masses of peptides obtained from the
proteolytic digestion of an unknown protein are then compared to the predicted masses
of peptides form the theoretical digestion of proteins in a database search programs. If
enough peptides from the real mass spectrum and the theoretical one overlap, it can be
said that successful protein identification is achieved. However, PMF does not work
well with protein mixtures. When a protein mixture is converted to a peptide mixture, it
increases the complexity of the peptide mass fingerprint and limits the identification of
protein.
In the second approach, peptides are fragmented into partial amino acid
sequences in the mass spectrometer after in-gel digestion step. If the amino acid
sequence of a peptide can be identified, it can be used to search databases to find the
protein from which it was derived. A partial amino acid sequence is obtained by
interpretation MS/MS spectrum (the sequence tag). Peptide mass tag searching is a
more specific tool for protein identification than peptide mass fingerprinting.
Additionally, one of the biggest advantages of utilizing MS/MS to obtain peptide amino
acid sequence is that, unlike PMF, it is compatible with protein mixtures. The ability to
identify proteins in mixtures is one of the great advantages of using MS as a protein
identification tool.
2.7. Previous Studies
There are only limited studies which are related with barley and boron in
literature. According to the Hayes and Reid, boron tolerance is mediated by efflux of
boron from roots in barley. They carried out experiments with two Australian barley
genotypes, namely Sahara (boron-tolerant genotype) and Schooner (boron-sensitive
genotype). Sahara genotype was shown to be able to maintain root boron concentration
up to 50 % lower than in the Schooner genotype. They stated that boron accumulation
was rapid and reached a steady-state concentration in roots within 3 hours while this
concentration was similar to the external medium in Sahara whereas the root
concentration was maintained at a lower concentration in Schooner (Hayes and Reid
2004)
38
On the other hand, Torun and co-workers examined ten barley Turkish cultivars
on soils containing normal and very high soluble boron concentration to study
genotypic variation in tolerance to boron toxicity. They showed that among the barley
genotypes examined Hamidiye and Bülbül were the most sensitive, and Anadolu and
Tarm-92 the most tolerant ones. They found that boron tolerant and boron sensitive
genotypes had very close tissue concentrations of boron, and even though Hamidiye
contained the lowest boron concentration in flag leaves. As a conclusion, they showed
that boron concentration in shoot and leaf are not reliable parameters in screening barley
genotypes to boron tolerance whereas severity of boron toxicity leaf symptoms reflected
much better results (Torun, et. al. 2003).
Recently, an Australian group worked for investigation of boron toxicity in
barley using metabolomic approach. They explained the metabolite profiles of two
genotypes, Clipper (boron-sensitive) and Sahara (boron-tolerant). The metabolic
differences in roots were greater in Clipper than in Sahara at 200 and 1000 µM boron
concentration. In contrast, leaf metabolites of both genotypes only responded at 1000
µM treatment. Additionally, metabolite levels were changed in the tips of leaves of the
Clipper after growth in 1000 µM B compared to Sahara. This is in agreement with a
gradual accumulation of boron from leaf base to tip in sensitive genotype (Roessner, et
al. 2006).
According to the Mahboobi and colleagues cell wall uronic acid concentration,
which is involved in binding of excess boron, were analyzed in leaf and root cell walls
of Anadolu and Hamidiye genotypes. It is found that the cell wall uronic acid content
has similar value under normal and excess supply of boron (Mahboobi, et al. 2001).
Similarly, activity of nitrogen assimilating enzymes such as nitrate reductase and
glutamate dehydrogenize did not correlate with boron toxicity susceptibility/tolerance of
barley genotypes (Mahboobi, et al. 2002). In an other work, Karabal and co-workers
were also studied antioxidant responses of tolerant and sensitive barley genotypes to
boron toxicity. They suggested that antioxidant enzymes such as superoxide dismutase
(SOD), catalase (CAT), ascorbate peroxidase (APX) and glutathione reductase (GR), do
not have a role in boron toxicity tolerance mechanism (Karabal, et al. 2003).
The closest work to our study was done by Mahboobi and co-workers in 2000.
They studied the changes in total protein profiles of barley genotypes, Anadolu (boron-
tolerant) and Hamidiye (boron-sensitive) in response to toxic boron concentration. In
root protein profile, one newly synthesized protein (molecular weight of nearly 35.0
39
kDa and pI value of 7.8) was detected in tolerant genotype while the same protein was
not shown up in sensitive genotype. The amount of three proteins (Mr: 23.0, 45.0, and
45.0 kDa; and pI values of 6.1, 6.0, and 6.1 respectively) were increased as a boron
treatment in both genotypes. In contrast, there were remarkable changes in total protein
profile after boron treatment relative to control ones in leaf tissues. The amount of seven
proteins (Mr: 14.0, 32.5, 33.0, 32.5, 34.2, 15.8, 15.8 kDa; and pI values of 5.0, 6.5, 6.7,
7.3, 7.7, 5.4, 8.0 respectively) were increased in tolerant genotype but the same proteins
were unchanged in the susceptible one. Additionally there were two proteins (Mr: 22.5
and 29.0 kDa; and pI values of 4.5, and 4.9 respectively) increased in amount in tolerant
and sensitive genotypes relative to control seedlings. They concluded that boron stress
caused increases or decreases in a number of proteins in root and leaf tissues and these
proteins may be involved in tolerance to boron toxicity (Mahboobi, et al. 2000).
2.8. The Aim of the Study
In this study, proteomic approach was used to identify boron-stress tolerant
proteins in leaves of Anadolu (boron-tolerant) over Hamidiye (boron-sensitive) barley
genotype and to explain the tolerance mechanism in boron-tolerant barley genotype.
Eight-day-old seedlings of two barley genotypes were treated with 10 mM boric acid for
seven days. Control plants received no boron treatment during this period. Total
proteins of leaf tissues were extracted from control and treated plants and separated by
two-dimensional gel electrophoresis (2-DE PAGE). Evaluation of two-dimensional gel
patterns revealed several proteins to be differentially expressed as a result of boron
stress in both genotypes. The protein spots of interest were excised from the gel and in-
gel digested. The obtained peptides were analyzed by mass spectrometry and each
protein was identified by the help of database search programs. Proteomic study
provides an excellent opportunity to identify boron-stress responsive proteins and to
explain the defense mechanism in boron-tolerant barley genotype (Anadolu) to boron
toxicity. The understanding of plant stress physiology is well correlated with the
changes in proteome content of cells.
In addition, newly synthesized, up-regulated, down-regulated, or totally
disappeared proteins were compared in boron treated and control plants of an Australian
boron-sensitive barley genotype, Sahara.
40
CHAPTER 3
EXPERIMENTAL
3.1. Plant Growth Conditions and Boron Treatment
In this study, three genotypes of barley (Hordeum vulgare; Anadolu, Hamidiye,
and Sahara) were used. These three genotypes were designated as boron-tolerant
(Anadolu and Sahara) or boron-sensitive (Hamidiye). Seeds were firstly washed with
water, and then they were put into petri dishes that contain wet filter paper. They were
allowed to germinate approximately for three days under sterile conditions without
letting filter paper to dry. A plastic beaker containing half-strength Hoagland’s solution
which was covered with stretchable parafilm was prepared. After germination;
approximately 15-20 seeds then were planted onto that beaker such that roots of the
plants were in the solution whereas shoots and leaves were on the stretch film as it can
be seen in figure 3.1. This solution contains all essential plant nutrients including
macro- and micro-nutrients in balanced proportions. It consisted of 3.5 mM
Ca(NO3)2.4H2O, 2.5 mM KNO3, 1 mM KH2PO4, 1 mM MgSO4.7H2O, 22 µM H3BO3,
4.5 µM MnCl2.4H2O, 0.35 µM ZnSO4.7H2O, 0.2 µM CuSO4.5H2O, 0.07 µM NaMoO4,
and a mixture of 15 µM EDTA.2Na, 14 µM FeSO4.7H2O and 0.5 mM KOH whose pH
was adjusted to 5.5. They were grown for 5 days under controlled environmental
condition (23±2 ˚C with 16-h light/8-h dark photoperiod at a light intensity of 40 µmol
m-2 s-1). The nutrient solution was changed every five days and the water lost by
evapotranspiration was compensated daily by addition of deonized water.
At the 8th day of growth, boron was applied to a final concentration of 10 mM as
boric acid. The control plants of each genotype continued to grow under normal
Hoagland solution. Control plants (no boric acid treatment) and boron stressed plants
were grown with the same physical parameters for additional 7 days. At the end of
growing period, the leaf tissues of 15 days old seedlings were harvested and quickly
wrapped with an aluminum foil, and immediately submerging them in liquid nitrogen to
minimize proteolytic activity. The samples were taken from Anadolu, Hamidiye, and
Sahara genotypes of both treated and control plants (Anadolu Control-AC, Anadolu
Boron-AB, Hamidiye Control-HC, Hamidiye Boron-HB, Sahara Control-SC, and
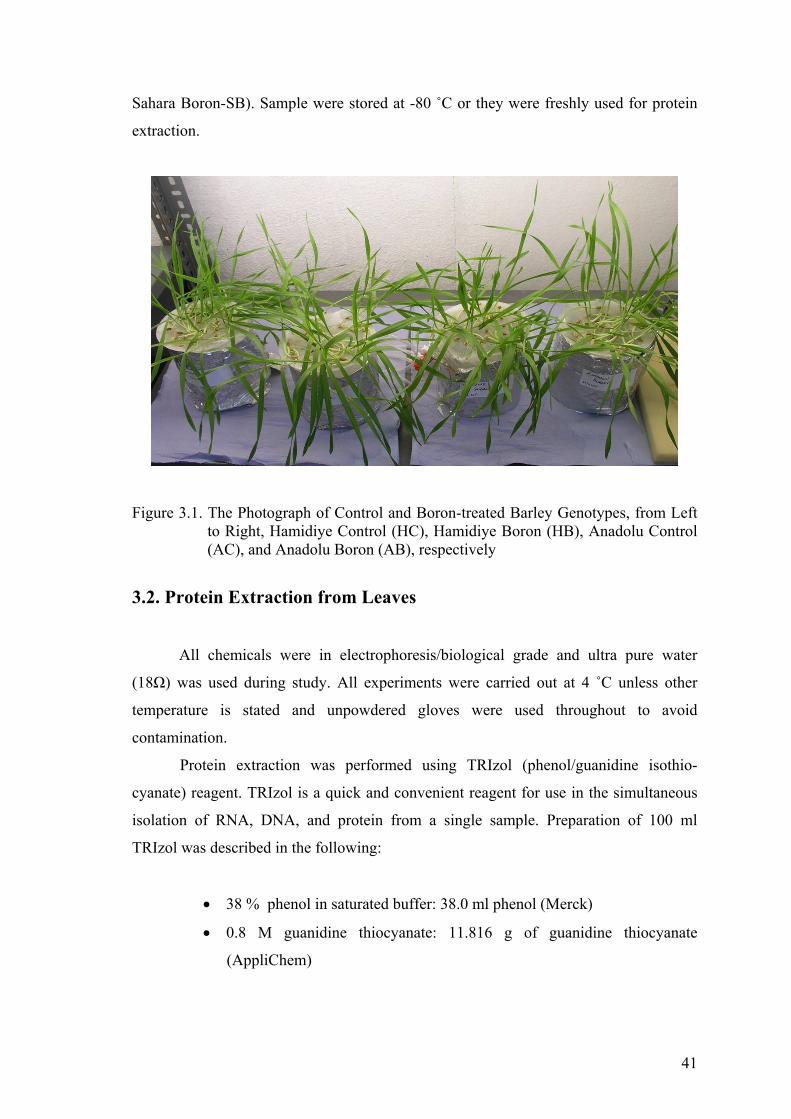
41
Sahara Boron-SB). Sample were stored at -80 ˚C or they were freshly used for protein
extraction.
Figure 3.1. The Photograph of Control and Boron-treated Barley Genotypes, from Left to Right, Hamidiye Control (HC), Hamidiye Boron (HB), Anadolu Control (AC), and Anadolu Boron (AB), respectively
3.2. Protein Extraction from Leaves
All chemicals were in electrophoresis/biological grade and ultra pure water
(18Ω) was used during study. All experiments were carried out at 4 ˚C unless other
temperature is stated and unpowdered gloves were used throughout to avoid
contamination.
Protein extraction was performed using TRIzol (phenol/guanidine isothio-
cyanate) reagent. TRIzol is a quick and convenient reagent for use in the simultaneous
isolation of RNA, DNA, and protein from a single sample. Preparation of 100 ml
TRIzol was described in the following:
• 38 % phenol in saturated buffer: 38.0 ml phenol (Merck)
• 0.8 M guanidine thiocyanate: 11.816 g of guanidine thiocyanate
(AppliChem)
42
• 0.4 M ammonium thiocyanate: 7.612 g of ammonium thiocyanate
(AppliChem)
• 0.1 M sodium acetate: 0.8203 g of sodium acetate (Merck)
• 5 % Glycerol: 5.0 ml (AppliChem)
• dH2O to 100 ml
After mixing of first five chemicals in a given amounts and homogenization, pH
was adjusted to 5 for effective and complete protein extraction from tissues. And then
the mixture was fulfilled to 100 ml with ultra pure water. It can be stored at 2-8 ˚C for
several months.
Approximately 3 grams of frozen leaf samples of control and treated for each
cultivars was ground by a mortar and pestle with liquid nitrogen to a powder. 30 ml
TRIzol reagent was added to 3 grams of crushed leaf tissues for homogenization and the
mixture was allowed to stand for 5 minutes at room temperature. Then 6.0 ml of
chloroform (AppliChem) was added into homogenate, shaken vigorously for 15 seconds
and allowed to stand for 2-15 minutes at room temperature. The resulting mixture was
centrifuged at 13,000 x g for 17 minutes at 4 ˚C. By doing centrifugation, the mixture
was separated into the 3 phases: a colorless upper aqueous phase containing RNA, an
interphase containing DNA, and lower phase containing protein. Nearly 10 ml of
aqueous protein phase were taken to a new and clean centrifuge tube and 40 ml of
isopropanol (AppliChem) was added and allowed the samples to stand for at least 10
minutes at room temperature. Afterwards, the sample mixture was centrifuged again at
12,000 x g for 10 minutes at 4 ˚C. The supernatant was discarded and the pellet was
washed 3 times with 40 ml of 0.3 M guanidine hydrochloride/95 % ethanol solution.
• Preparation of 0.3 M guanidine hydrochloride/95 % ethanol solution:
5.732 grams of guanidine hydrochloride (AppliChem) was taken and
diluted to the 200 ml with 95 % of ethanol solution (AppliChem).
During each wash, samples were stored in wash solution for 20 minutes at room
temperature and centrifuged at 7,500 x g for 5 minutes at 4 ˚C. At the end of the
centrifugations, pellets were taken from centrifuge tube to the 1.5 ml eppendorf tube
and covered with sufficient absolute ethanol (AppliChem). At this stage, pellets can be
43
stored -80 ˚C for further usage or immediately used in IEF, after solubilization of pellet
with rehydration buffer.
3.3. Protein Solubilization with Rehydration Buffer
The excess ethanol above the pellets was taken carefully and the pellet was
finally vacuum-dried in SpeedVac (Thermo Electron Corporation) not more than 5
minutes, until all ethanol was completely evaporated. Then the lyophilized pellet was
dissolved in rehydration buffer that consist of urea, thiourea, CHAPS, DTT
(AppliChem), and Ampholyte pH 3-10 (Fluka).
• The preparation of rehydration stock solution: 4.2 g of urea, 1.52 g of
thiourea, and 0.4 g of CHAPS were weighed and dissolved in ultra pure
water to a final solution volume of 10 ml. The solution can be gently
heated to dissolve, but must not be heated above 30 ˚C to prevent urea
breakdown. This stock solution can be stored at 4 ˚C up to one month.
• Just prior to use, 1 ml of stock solution was taken and followed by
addition of 0.01 g of DTT and 25 µl of Ampholyte. DTT and ampholyte
must be added fresh just before use.
The final concentration individual components are; 7 M urea, 2 M thiourea, 4 %
(w/v) CHAPS, 65 mM DTT, and 2.5 % Ampholyte pH 3-10. The rehydration buffer
was added to the lyophilized pellet in a sufficient amount for complete solubilization.
Approximately, 600 µl of rehydration buffer was used per one leaf sample pellet
throughout experiments. After addition enough buffer to pellet, it was thoroughly mixed
and followed by vortexing for 10 minutes. Then the eppendorf tubes were centrifuged at
8,000 x g for 5 minutes at 4 ˚C and the supernatant was taken for IEF experiment.
Before IEF, protein concentration was determined by Bradford method.
3.3.1. Bradford Protein Assay for Protein Determination
The Bradford protein assay is one of the spectroscopic analytical methods used
to determine the total protein concentration of a sample (Bradford 1976). This method is
44
based on the absorption shift from 470 nm to 595 nm in the Coomassie brilliant blue G-
250 dye when it binds to protein. Upon addition of sample, the dye will bind protein,
resulting in a color change from green to blue. For that reason, the Bradford method is
also known as colorimetric protein assay as the protein concentration increases; the
color of the test sample becomes darker. The CBB G-250 dye is thought to bind to
protein through an electrostatic attraction of the dye’s sulfonic groups, theoretically to
arginine, lysine, and histidine residues. Additionally, the dye also binds weakly to the
tyrosine, tryptophan, and phenylalanine via van der Waals forces and hydrophobic
interactions.
The Bradford assay has a linear dyanmic range, generally from 2µg/ml to 120
µg/ml, it is usually necessary to make dilutions of sample before analysis. As an
analytical rule, a series of protein standards is needed to determine the protein
concentration of a test sample. Thus, it is important to generate a standard curve using a
protein of known concentration. Bovine serum albumin (BSA) was used as a standard
protein to compare with sample protein concentration.
• Preparation of Coomassie Reagent: 10.0 mg of CBB G-250 (AppliChem)
was dissolved in 5 ml of 95 % ethanol to which 10.0 ml of 85 %
phosphoric acid (AppliChem) had been added and the whole was diluted
to 100 ml with ultra pure water. The final solution was filtered through
filter paper (Whatman No. 1) and was stored in an amber bottle at 4 ºC.
• Preparation of 200 µg/ml stock BSA standard: 0.0200 g of BSA was
weighed and dissolved in water to a final volume of 1.0 ml.
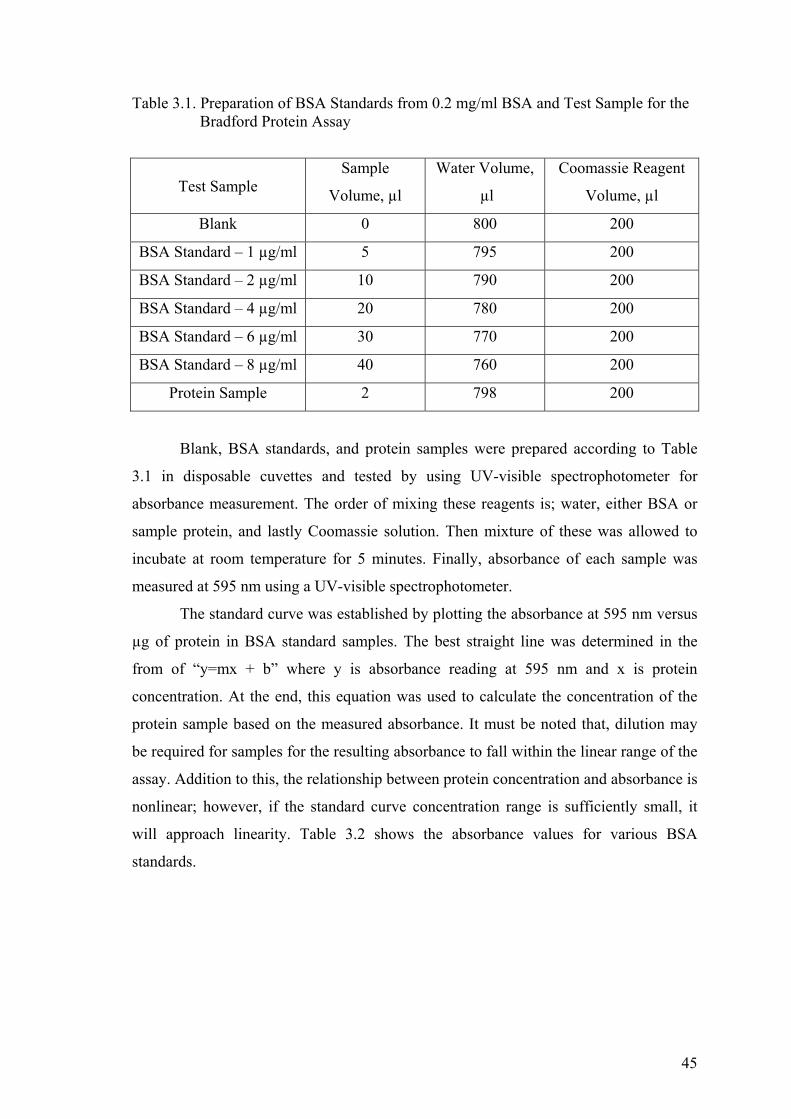
45
Table 3.1. Preparation of BSA Standards from 0.2 mg/ml BSA and Test Sample for the Bradford Protein Assay
Test Sample Sample
Volume, µl
Water Volume,
µl
Coomassie Reagent
Volume, µl
Blank 0 800 200
BSA Standard – 1 µg/ml 5 795 200
BSA Standard – 2 µg/ml 10 790 200
BSA Standard – 4 µg/ml 20 780 200
BSA Standard – 6 µg/ml 30 770 200
BSA Standard – 8 µg/ml 40 760 200
Protein Sample 2 798 200
Blank, BSA standards, and protein samples were prepared according to Table
3.1 in disposable cuvettes and tested by using UV-visible spectrophotometer for
absorbance measurement. The order of mixing these reagents is; water, either BSA or
sample protein, and lastly Coomassie solution. Then mixture of these was allowed to
incubate at room temperature for 5 minutes. Finally, absorbance of each sample was
measured at 595 nm using a UV-visible spectrophotometer.
The standard curve was established by plotting the absorbance at 595 nm versus
µg of protein in BSA standard samples. The best straight line was determined in the
from of “y=mx + b” where y is absorbance reading at 595 nm and x is protein
concentration. At the end, this equation was used to calculate the concentration of the
protein sample based on the measured absorbance. It must be noted that, dilution may
be required for samples for the resulting absorbance to fall within the linear range of the
assay. Addition to this, the relationship between protein concentration and absorbance is
nonlinear; however, if the standard curve concentration range is sufficiently small, it
will approach linearity. Table 3.2 shows the absorbance values for various BSA
standards.
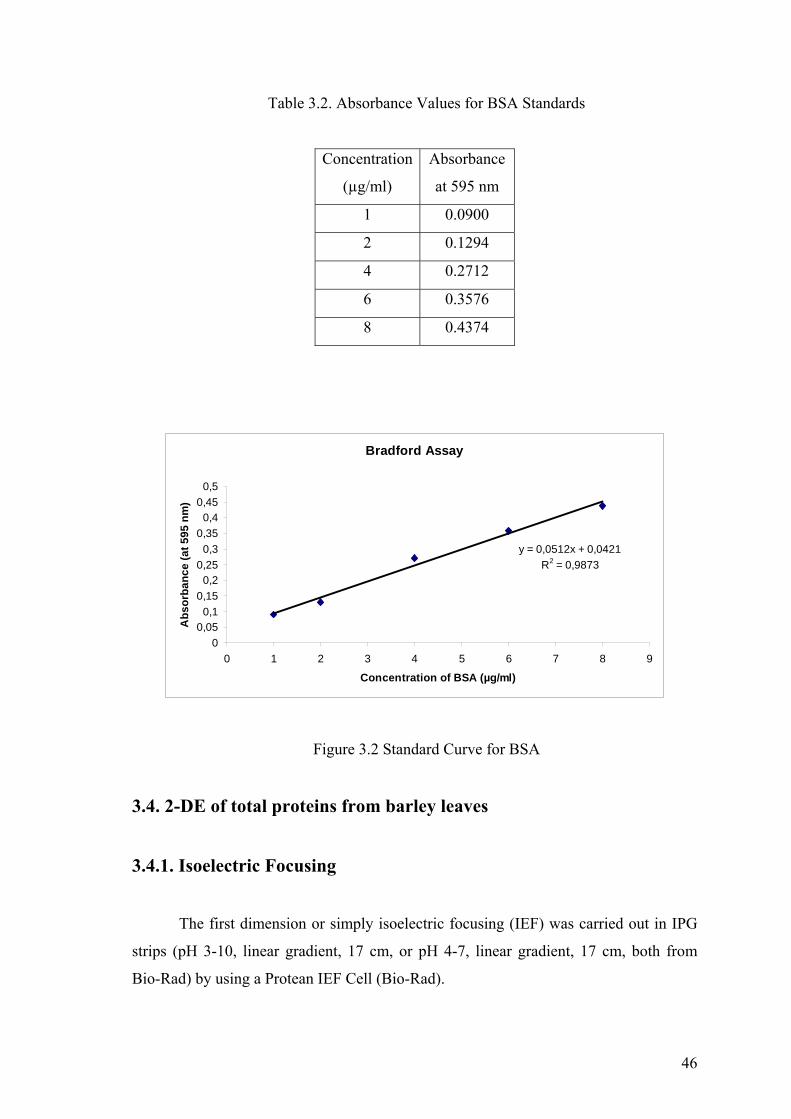
46
Table 3.2. Absorbance Values for BSA Standards
Concentration
(µg/ml)
Absorbance
at 595 nm
1 0.0900
2 0.1294
4 0.2712
6 0.3576
8 0.4374
Bradford Assay
y = 0,0512x + 0,0421R2 = 0,9873
00,05
0,10,15
0,20,25
0,30,35
0,40,45
0,5
0 1 2 3 4 5 6 7 8 9
Concentration of BSA (µg/ml)
Abs
orba
nce
(at 5
95 n
m)
Figure 3.2 Standard Curve for BSA
3.4. 2-DE of total proteins from barley leaves
3.4.1. Isoelectric Focusing
The first dimension or simply isoelectric focusing (IEF) was carried out in IPG
strips (pH 3-10, linear gradient, 17 cm, or pH 4-7, linear gradient, 17 cm, both from
Bio-Rad) by using a Protean IEF Cell (Bio-Rad).
47
The focusing tray was selected corresponding to the IPG strip length chosen for
the experiment and it must be clean and dry before IEF. Paper wicks were placed onto
the electrodes and wetted with approximately 8 µl of nano-pure water which was
supplied from Bio-Rad. Appropriate amount of protein sample and rehydration buffer,
as described previous chapter, were placed into one well of the focusing tray. In our
work, IEF experiments were carried out in parallel manner, i.e. Anadolu-Boron and
Anadolu-Control at the same experimental conditions. Same amount of protein (350 µg)
were loaded onto strips to compare up- and down-regulated proteins in treated and
control plant’s leaf protein samples. Rehydration buffer was also prepared as described
in protein solubilization part. The mixture of buffer and protein sample, a rehydration
buffer containing 350 µg protein/350 µL, was put slowly at a central point in the well
and any bubbles, if formed, was removed which causes serious problems while focusing
of proteins. Afterwards, strips were taken out from -20 ºC and let it to thaw for 5
minutes at room temperature. Then, the protective cover of the strip was peeled off and
the strip was positioned with gel side down followed by laid onto the solution holding
one end with forceps, and placed with the positive end of the strip on the positive
electrode. In order to coat the entire strip, it was gently lift and lowered in the same well
of focusing tray to ensure that the gel was completely contact with sample protein and
rehydration buffer. The strip was then covered with 2 ml of mineral oil to minimize
evaporation and urea crystallization. The cover of the focusing tray was placed and let it
to stay one-hour on a bench.
After one-hour, IPG strips were actively rehydrated for 12 hours. Active
rehydration was carried out in the presence of 50 V during rehydration period. After
rehydration step, IEF voltage settings for 17-cm IPG strips was programmed as follows:
phase 1, linear gradient up to 250 Volts in 15 minutes; phase 2, linear gradient up to 500
Volts in 30 minutes; phase 3, rapid gradient up to 1000 Volts in 1 hour; phase 4, linear
gradient up to 5000 Volts in 3 hours; phase 5, linear gradient up to 10,000 Volts in 3
hours; and phase 6, linear gradient up 10,000 Volts at 70,000 Volts h-1. Working
temperature was set to 20 ºC in IEF. Total focusing time was almost 20 hours without
rehydration step.
After the IEF run was complete, strips were removed from IEF focusing tray and
were placed at -80 ºC or immediately equilibrated with equilibrium buffers for second
dimension of the experiment.
48
3.4.2. Equilibration of Strips
The strips containing the focused proteins were equilibrated in equilibrium
buffers which contain SDS for transforming the focused proteins into SDS-protein
complexes. They had completely unfolded structure and carried only negative charges.
Beside SDS, equilibrium buffer I had Tris-HCl pH 8.8, glycerol, urea, DTT, while
equilibrium buffer II had iodoacetamide instead of DTT. DTT is necessary for cleavage
of sulfhydryl bonds between cysteine residues within a protein, as a reductant.
Iodoacetamide was used as an alkylation for reduced sulfhydryl groups in the protein
and as a scavenger of the excess reductant.
• Preparation of equilibrium buffer I: 1.81 g of urea, 1.25 ml of Tris-HCl
pH 8.8, 0.1 g of SDS, 1 ml of glycerol, and 0.1 g of DTT. The final
volume was adjusted to 5 ml with water for one strip. The final
concentration for equilibrium buffer I was 6 M urea, 0.375 M Tris-HCl,
2 % SDS, 20 % glycerol, and 2 % DTT.
• Preparation of equilibrium buffer II: 1.81 g of urea, 1.25 ml of Tris-HCl
pH 8.8, 0.1 g of SDS, 1 ml of glycerol, and 0.125 g of iodoacetamide
(AppliChem). The final volume was adjusted to 5 ml with water for one
strip. The final concentration for equilibrium buffer II was 6 M urea,
0.375 M Tris-HCl, 2 % SDS, 20 % glycerol, and 2.5 % iodoacetamide.
After preparation of equilibrium buffers, strip was laid gel side up into the
disposable equilibrium tray and treated with equilibrium buffer I for 15 minutes with
gentle shaking. After 15 minutes, strip was taken from one well of tray and placed into
another dry well and treated with equilibrium buffer II for 15 minutes with gentle
shaking again.
3.4.3. SDS-PAGE
After removing strip from equilibrium buffers, strip needed to be rinsed with 1X
Tris-Glycine-SDS (TGS) running buffer before attaching into the polyacrylamide gel.
49
• Preparation of 5X Tris-Glycine-SDS (TGS) running buffer: 15.1 g of
Tris-base (AppliChem) and 94 g of glycine (AppliChem) were weighed
and dissolved in 900 ml of water. Then, 50 ml of a 10 % (w/v) SDS
solution was added and the final volume was adjusted to 1000 ml with
water. It can be stored at 4 ºC.
To prepare 100 ml of 1X TGS buffer, 20 ml of 5X TGS buffer was diluted to a
final volume of 100 ml with ultra pure water. The graduated cylinder was filled to a 100
ml with 1X TGS buffer and any bubbles on the surface of the buffer was removed by
the help of plastic pasteur pipette. The equilibrated strip was rinsed with 1X TGS buffer
for 15 seconds. Now, strip was ready for second dimension- separation of proteins
according to their molecular weight differences.
Separation in the second dimension by SDS-PAGE was carried out in
PROTEAN II xi Cell (Bio-Rad). 12 % polyacrylamide gel slabs containing 1.5 M Tris-
HCl buffer, pH 8.8, 10 % SDS, 10 % ammonium per sulfate, TEMED were used and
the running buffer being composed of 1X TGS buffer. Glass plate sizes are 16 cm cells
with 16 x 20 cm for inner plate and 18.3 x 20 cm for outer plate. Solutions for preparing
resolving gel for SDS-PAGE were described in the following.
• Preparation of 30 % acrylamide mixture: 29.0 g of acrylamide
(AppliChem) and 1.0 g of N, N΄-methylenebisacrylamide (AppliChem)
were dissolved in a total volume of 60 ml of water and the solution was
heated to 37 ºC to dissolve the chemicals. The total volume was fulfilled
to 100 ml with water. This solution can be stored at 4 ºC in dark bottles
not more than 1 month. During storage, acrylamide and bisacrylamide
are slowly converted to acrylic acid and bisacrylic acid.
• Preparation of 1.5 M Tris-HCl, pH 8.8: 3.634 g of Tris-base was
dissolved in 15 ml of water and pH was adjusted to 8.8 with concentrated
(~6 M) HCl. Then the volume was fulfilled to 20 ml with water. It can be
stored at 4 ºC.
• Preparation of 10 % SDS: 1.0 g of SDS was dissolved in water to a final
volume of 1.0 ml.
50
• Preparation of 10 % ammonium per sulfate (APS): 1.0 g of APS was
dissolved in water to a final volume of 1.0 ml. This solution should be
prepared just before use.
12 % polyacrylamide gel was prepared by mixing 16.5 ml of water, 20.0 ml of
30 % acrylamide mixture, 12.5 ml of 1.5 M Tris-HCl (pH 8.8), 500 µl of 10 % SDS,
500 µl of 10 % ammonium per sulfate, 20 µl of TEMED were mixed to a final volume
of 50 ml. Polymerization was started immediately after adding APS and TEMED. The
mixture was then poured between two glass plates.
The casted SDS-polyacrylamide gel was kept for at least one day at 4 ºC prior to
electrophoresis in order to reduce protein modifications caused by free acrylamide or
reagents involved in the polymerization process.
Equilibrated IPG strip was placed onto the polyacrylamide slabs and sealed with
1 ml of 0.5 % (w/v) melted agarose (AppliChem) (0.5% agarose in 1X Tris-Glycine-
SDS with traces of bromophenol blue). There must not be any air bubbles between the
IPG strip and the resolving gel interface. Once the overlay has solidified, the gel was
placed in a buffer tank and central cooling core was cooled with circulating water to
hold the temperature near 10 ºC. The reservoirs were half filled with 1X TGS running
buffer and electrophoresis was begun. Electrophoresis run was made at constant current
at 16 mA/gel for 45 minutes and followed by constant voltage at 150 Volts for at least 7
hours until the blue dye front reached the bottom of the gel.
3.4.4. Staining and Destaining of Gel
After electrophoresis was finished, the gel was taken out from two glass plates
carefully into a large tray for staining and destaining steps. Coomassie colloidal blue
staining was used throughout the study.
• Preparation of Staining Solution: 40 g of ammonium sulfate
(AppliChem) was dissolved in 280 ml of ultra pure water and mixed with
8 ml of 85 % phosphoric acid (AppliChem). Then 100 ml of methanol
(Merck) was added and the final volume is adjusted to 500 ml with ultra
51
pure water. Finally, 0.5 g of CBB G-250 was added and mix thoroughly.
It can be stored at 4 °C.
• Preparation of Neutralization Buffer: 0.1 M of Tris-phosphate, pH 6.5
was prepared by dissolving 10.96 g of Tris-dihydrogen phosphate
(AppliChem) in water to a final volume of 500 ml. The pH was adjusted
with NaOH to 6.5. It can be stored at 4 ºC.
• Preparation of Destaining Solution: 25 % methanol solution was
prepared by mixing 125 ml methanol with 375 ml water. It can be stored
at 4 ºC.
• Preparation of Fixation Solution: 20 % of ammonium sulfate
(AppliChem) was prepared by dissolving 100 g of ammonium sulfate in
water to a final volume of 500 ml. It can be stored at 4 ºC.
Firstly, gel was stained with sufficient staining solution at least 12 hours with
gentle shaking. After overnight staining step, the solution was poured and the gel was
washed with water. Then, gel was treated with neutralization buffer for three minutes
with gentle shaking. The buffer solution was again poured and the gel was washed with
water. The gel was mixed with destaining solution for less than one minute with gentle
shaking again. After pouring the destaining solution gel was washed properly with
water and treated with fixation solution for at least one day.
3.4.5. Image and Data Analysis of Gel
After staining and destaining steps, the photograph of the gel was taken by
camera. PD Quest 8.0.1 version of image analysis software was downloaded from the
Company’s web site for one month free-trial use (Bio-Rad) for gel scanning and
analysis. All available background subtraction and smoothing algorithms can be done
with this program. It has a capability of the generation of statistical data concerning
differentially expressed proteins while comparing sample’s gels.
52
3.5. In-Gel Digestion
In gel digestion, excising protein spot from SDS-PAGE gel and cleavage of
protein into peptides and sequencing of these fragments, is an central part of the
proteomic studies. Shevchenko and co-workers described a protocol that is well adapted
with further identification instruments (Shevchenko, et al. 1996). It is presented as a
three-day procedure in which an initial washing of the protein spot and digestion
reaction are carried out overnight. Recently, robotic instruments have been introduced,
including spot detection, cutting from gel and with in-gel digestion steps in the same
system. The preparation of in-gel digestion chemicals are described in the following:
• Preparation of wash solution: 10 ml of methanol (Merck) was added to 5
ml of water followed by addition of 1 ml of acetic acid and the total
volume was adjusted to 20 ml with water. The final concentrations are 50
% (v/v) methanol and 5 % (v/v) acetic acid.
• Preparation of 100 mM ammonium bicarbonate: 0.2 g of ammonium
bicarbonate (AppliChem) was dissolved in 20 ml of water.
• Preparation of 50 mM ammonium bicarbonate: 2 ml of 100 mM
ammonium bicarbonate was mixed with 2 ml of water.
• Preparation of 10 mM DTT: 1.5 mg of dithiothreitol was placed in a 1.5
ml plastic centrifuge tube followed by addition of 1 ml of 100 mM
ammonium bicarbonate for complete dissolving of DTT.
• Preparation of 100 mM iodoacetamide: 18 mg of iodoacetamide was
placed in a 1.5 ml plastic centrifuge tube followed by addition of 1 ml of
100 mM ammonium bicarbonate for complete dissolving of
iodoacetamide.
• Preparation of trypsin solution: 1 ml of ice cold 50 mM ammonium
bicarbonate was added to 20 µg of sequencing-grade modified trypsin
(V5111; Promega) and dissolved by drawing the solution into and out of
the pipette. The trypsin solution was kept on ice until use. The final
concentration is 20 ng/ml trypsin.
• Preparation of extraction buffer: 10 ml of acetonitrile (Merck) was added
to 5 ml of water followed by addition of 1 ml of formic acid (Merck) and
53
the final volume was adjusted to 20 ml with water. The final
concentrations were 50 % (v/v) acetonitrile and 5 % (v/v) formic acid.
The following digestion procedure was suitable for spots cut from 2D gel, on the
order of 2mm to 4 mm diameter with a gel thickness of 1 mm, and have total volumes
nearly ~20 µL.
Day One: Cutting Protein Spot and Washing the Gel Pieces
- Protein spot was cut from the gel as closely as possible with a sharp scalpel, and
divided into smaller pieces. The gel pieces were placed in a 1.5 ml of plastic
micro centrifuge tube. 200 µL of wash solution was added and the gel pieces
were rinsed overnight at room temperature.
Day Two: Reduction, Alkylation, Washing out Reagents and Exchange of Buffers
Followed by Digestion with Trypsin
- Wash solution was carefully removed from the sample and discarded.
- 200 µL of wash solution was added and the gel pieces were rinsed for additional
2-3 hours at room temperature. Then, wash solution was carefully removed from
the sample and discarded.
- 200 µL of acetonitrile was added and the gel pieces were dehydrated for ~ 5
minutes at room temperature. When dehydrated, the gel pieces were an opaque
white color and were smaller in size.
- Acetonitrile was carefully removed from the sample and discarded. The gel
pieces were completely dried at ambient temperature in a vacuum centrifuge for
2-3 minutes.
- 30 µL of 10 mM DTT was added and the protein was reduced for 30 minutes at
room temperature. Then, DTT was carefully removed from the sample and
discarded.
- 30 µL of 100 mM iodoacetamide was added and the protein was alkylated for 30
minutes at room temperature. Then, iodoacetamide was carefully removed from
the sample and discarded.
54
- 200 µL of acetonitrile was added and the gel pieces were dehydrated for ~5
minutes at room temperature. Acetonitrile was carefully removed from the
sample and discarded.
- The gel pieces were rehydrated with 200 µL of 100 mM ammonium bicarbonate,
incubating the samples for 10 minutes at room temperature. Then, ammonium
bicarbonate was carefully removed from the sample and discarded.
- 200 µL of acetonitrile was added and the gel pieces were dehydrated for ~5
minutes at room temperature. Acetonitrile was carefully removed from the
sample and discarded. The gel pieces were completely dried at ambient
temperature in a vacuum centrifuge for 2-3 minutes.
- 30 µL of the trypsin solution was added to the sample and the gel pieces were
allowed to rehydrate on ice for 10 minutes with occasional vortex mixing.
- The gel pieces were driven to the bottom of the tube by centrifuging the sample
for 30 seconds. Excess trypsin solution was carefully removed from the sample
and discarded.
- 5 µL of 50 mM ammonium bicarbonate was added to the sample and the mixture
was vortexed. The sample was driven to the bottom of the tube by centrifuging
the sample for 30 seconds. Digestion was carried out overnight at 37 ºC.
Day Three: Extraction of Peptides for Analysis
- 30 µL of 50 mM ammonium bicarbonate was added to the digest and the sample
was incubated for 10 minutes with occasional gentle vortex mixing. The digest
was driven to the bottom of the tube by centrifuging the sample for 30 seconds.
The supernatant was carefully collected and the sample was transferred to a 0.5
ml plastic micro centrifuge tube.
- 30 µL of extraction buffer was added to the tube containing the gel pieces and
incubated for 10 minutes with occasional gentle vortex mixing. The extract was
driven to the bottom of the tube by centrifuging the sample for 30 seconds. The
supernatant was carefully collected and combined the extract in the 0.5 ml
plastic micro centrifuge tube.
- 30 µL of aliquot of the extraction buffer was added to the tube containing the gel
pieces, and incubated for 10 minutes with occasional gentle vortex mixing. The
extract was driven to the bottom of the tube by centrifuging the sample for 30
55
seconds followed by carefully collection of supernatant and combination of the
extract in the 0.5 ml plastic micro centrifuge tube.
- The volume of the extract was reduced to less than 20 µL by evaporation in a
vacuum centrifuge at ambient temperature. The extract must not be allowed to
dry completely.
- The volume of the digest was adjusted to ~20 µL with acetic acid. Finally, the
sample was ready for mass spectrometric analysis.
3.6. Protein Identification and Mass Spectrometric Analysis
Protein identification using nanoLC-ESI-MS/MS was performed by Proteome
Factory (Proteome Factory AG, Berlin, Germany). The MS system consisted of an
Agilent 1100 nanoLC system (Agilent, Boeblingen, Germany), PicoTip emitter (New
Objective, Woburn, USA) and an Esquire 3000 plus ion trap MS (Bruker, Bremen,
Germany). Protein spots were in-gel digested by trypsin (Promega, Mannheim,
Germany) or thermolysine (Fluka, Seelze, Germany) and applied to nanoLC-ESI-
MS/MS. After trapping and desalting the peptides on enrichment column (Zorbax SB
C18, 0.3 x 5 mm, Agilent) using 1% acetonitrile/0.5% formic acid solution for five
minutes, peptides were separated on Zorbax 300 SB C18, 75 µm x 150 mm column
(Agilent) using an acetonitrile/0.1% formic acid gradient from 5% to 40% acetonitrile
within 40 minutes. MS spectra were automatically taken by Esquire 3000 plus
according to manufacturer's instrument settings for nanoLC-ESI-MS/MS analyses.
Proteins were identified using MS/MS ion search of Mascot search engine (Matrix
Science, London, England) and NCBInr protein database (National Center for
Biotechnology Information, Bethesda, USA). Ion charge in search parameters for ions
from ESI-MS/MS data acquisition were set to "1+, 2+ or 3+" according to the
instrument's and method's common charge state distribution.
The following figure was summarized the overall procedure starting from plant
growth to identification of proteins with mass spectrometry.
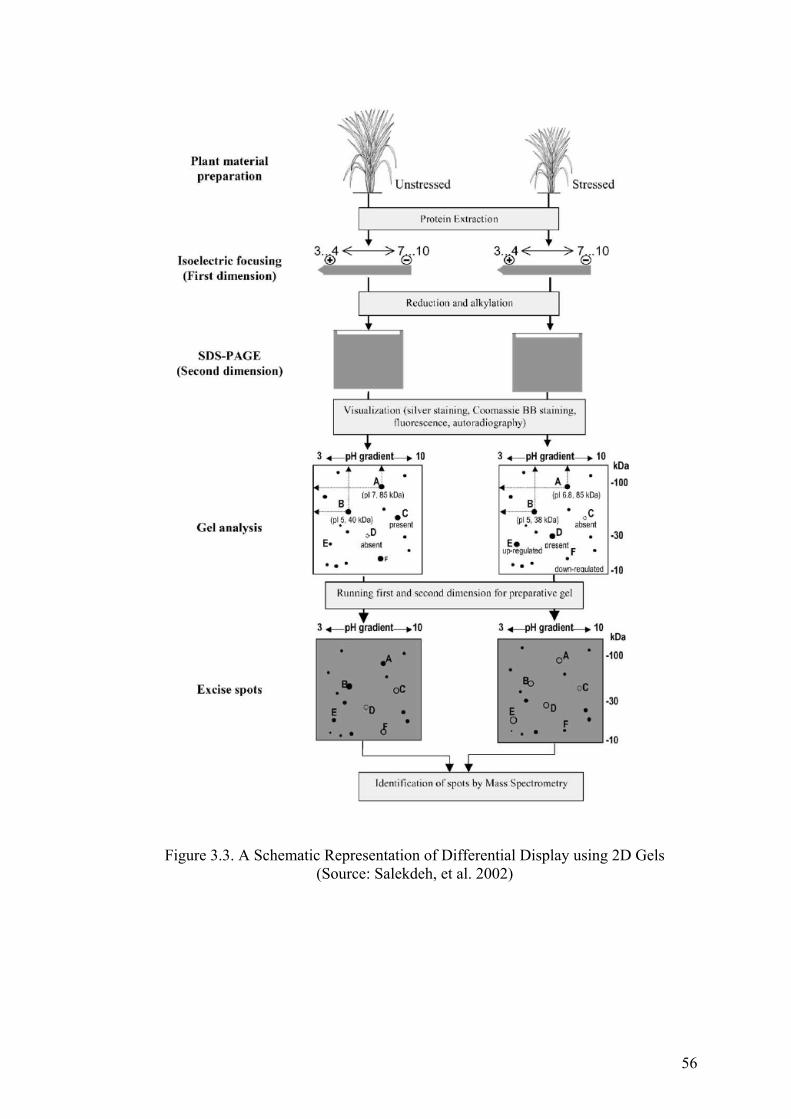
56
Figure 3.3. A Schematic Representation of Differential Display using 2D Gels (Source: Salekdeh, et al. 2002)
57
CHAPTER 4
RESULTS AND DISCUSSION
The study was divided into two parts; namely, identification of boron-stress
tolerant proteins in Anadolu (boron-tolerant) over Hamidiye (boron-sensitive) barley
genotype by nanoLC-ESI-MS/MS and comparison of boron-treated and control plants
of Sahara (boron-tolerant) barley genotype in terms of its up- and down-regulated,
totally disappeared, and newly formed proteins.
In literature, the usability of TRIzol-extracted proteins in proteomic applications,
such as identification with mass spectrometry is still largely unknown. In our study,
however, we were successful in identifying of proteins which were extracted by TRIzol.
4.1. Effects of Boron Toxicity on Growth
Plant response to boron in the soil varies widely among species, and as well as
among genotypes within a species. After 10 mM boric acid treatment, boron tolerant
genotypes were able to grow well in hydroponic solution media in which boron
sensitive genotype was adversely affected by boron stress.
Boron toxicity manifests itself in a several ways in barley; including decreased
shoot and root growth, reduced leaf chlorophyll, low photosynthetic rates due to loss of
green leaf area as it can been in the figure 4.1. Leaf symptoms of toxicity in barley were
characterized by chlorotic and/or necrotic patches, generally at the margins and tips of
older leaves. This showed that the accumulation of boron at the end of transpiration
stream. In addition, fewer leaves were developed and roots were browner compared to
control plants. Plant growth was retarded and this leads to a reduction in total yield of
crop when the soil has long-term exposure of high boron.
According to our observations, the barley genotypes Anadolu, Hamidiye and
Sahara greatly differed in severity of leaf symptoms of boron toxicity. Approximately
80 % of Hamidiye genotype leaves showed reddish-brown neurotic spots and chlorotic
spots whereas only 50 % of Anadolu genotype leaves showed similar symptoms under
boron stress. On the other hand, Sahara genotype showed no neurotic spots along to its
leaves, while the tip of older leaves only turned yellow.
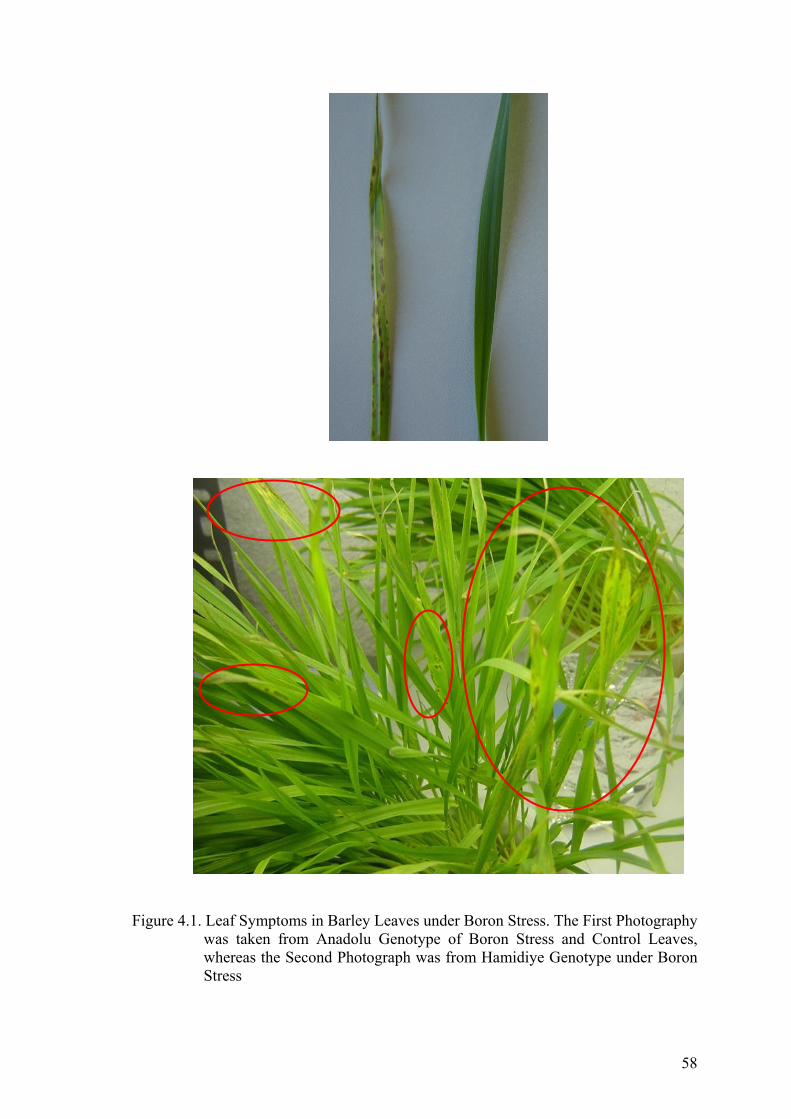
58
Figure 4.1. Leaf Symptoms in Barley Leaves under Boron Stress. The First Photography was taken from Anadolu Genotype of Boron Stress and Control Leaves, whereas the Second Photograph was from Hamidiye Genotype under Boron Stress
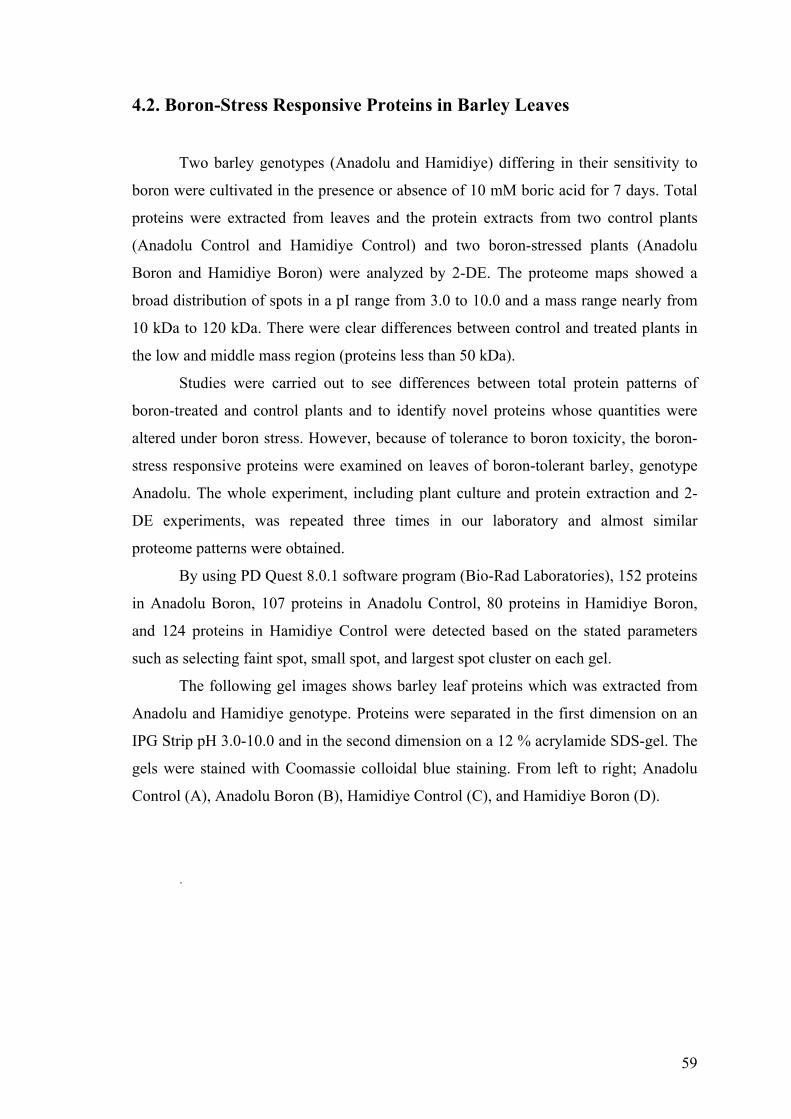
59
4.2. Boron-Stress Responsive Proteins in Barley Leaves
Two barley genotypes (Anadolu and Hamidiye) differing in their sensitivity to
boron were cultivated in the presence or absence of 10 mM boric acid for 7 days. Total
proteins were extracted from leaves and the protein extracts from two control plants
(Anadolu Control and Hamidiye Control) and two boron-stressed plants (Anadolu
Boron and Hamidiye Boron) were analyzed by 2-DE. The proteome maps showed a
broad distribution of spots in a pI range from 3.0 to 10.0 and a mass range nearly from
10 kDa to 120 kDa. There were clear differences between control and treated plants in
the low and middle mass region (proteins less than 50 kDa).
Studies were carried out to see differences between total protein patterns of
boron-treated and control plants and to identify novel proteins whose quantities were
altered under boron stress. However, because of tolerance to boron toxicity, the boron-
stress responsive proteins were examined on leaves of boron-tolerant barley, genotype
Anadolu. The whole experiment, including plant culture and protein extraction and 2-
DE experiments, was repeated three times in our laboratory and almost similar
proteome patterns were obtained.
By using PD Quest 8.0.1 software program (Bio-Rad Laboratories), 152 proteins
in Anadolu Boron, 107 proteins in Anadolu Control, 80 proteins in Hamidiye Boron,
and 124 proteins in Hamidiye Control were detected based on the stated parameters
such as selecting faint spot, small spot, and largest spot cluster on each gel.
The following gel images shows barley leaf proteins which was extracted from
Anadolu and Hamidiye genotype. Proteins were separated in the first dimension on an
IPG Strip pH 3.0-10.0 and in the second dimension on a 12 % acrylamide SDS-gel. The
gels were stained with Coomassie colloidal blue staining. From left to right; Anadolu
Control (A), Anadolu Boron (B), Hamidiye Control (C), and Hamidiye Boron (D).
.
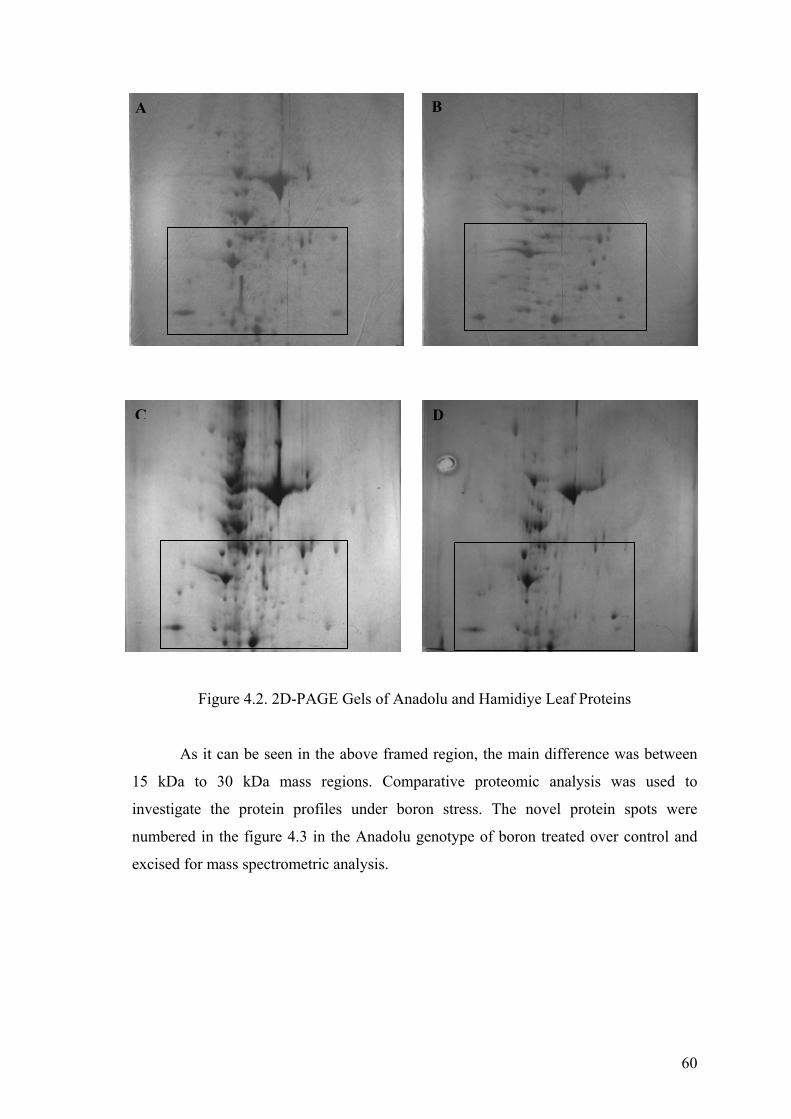
60
Figure 4.2. 2D-PAGE Gels of Anadolu and Hamidiye Leaf Proteins
As it can be seen in the above framed region, the main difference was between
15 kDa to 30 kDa mass regions. Comparative proteomic analysis was used to
investigate the protein profiles under boron stress. The novel protein spots were
numbered in the figure 4.3 in the Anadolu genotype of boron treated over control and
excised for mass spectrometric analysis.
A B
C D
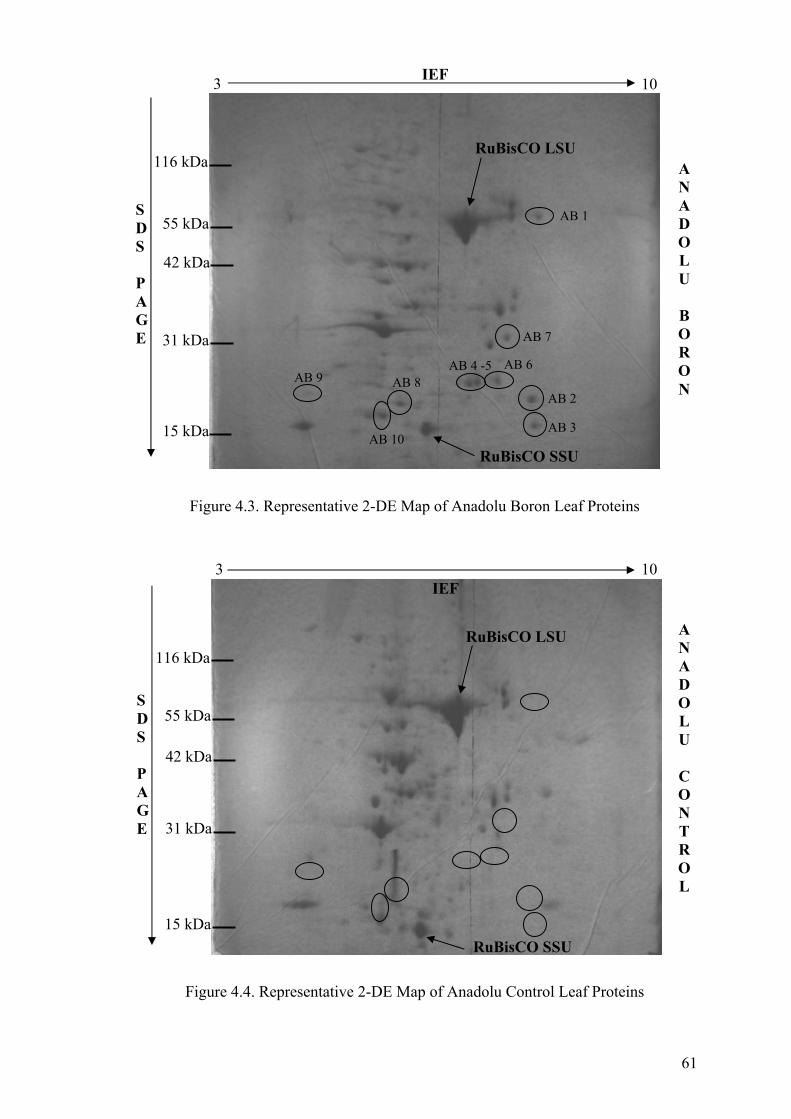
61
Figure 4.3. Representative 2-DE Map of Anadolu Boron Leaf Proteins
Figure 4.4. Representative 2-DE Map of Anadolu Control Leaf Proteins
10 3
116 kDa
55 kDa
42 kDa
31 kDa
15 kDa
A N A D O L U
B O R O N
AB 1
AB 2
AB 3
AB 7
AB 4 -5 AB 6
AB 10
AB 8 AB 9
A N A D O L U
C O N T R O L
10 3
116 kDa
55 kDa
42 kDa
31 kDa
15 kDa
IEF
S D S P A G E
IEF
S D S P A G E
RuBisCO LSU
RuBisCO SSU
RuBisCO LSU
RuBisCO SSU
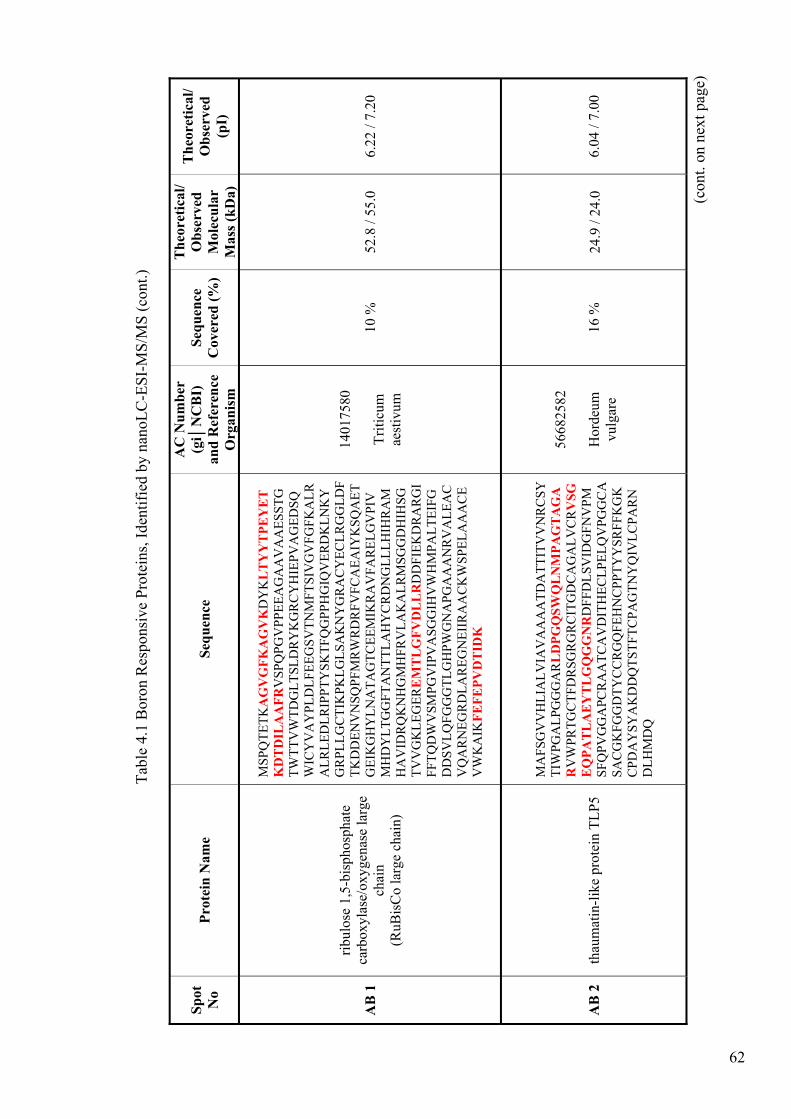
62
T
able
4.1
Bor
on R
espo
nsiv
e Pr
otei
ns, I
dent
ified
by
nano
LC-E
SI-M
S/M
S (c
ont.)
Spot
N
o Pr
otei
n N
ame
Sequ
ence
AC
Num
ber
(gi
NC
BI)
an
d R
efer
ence
O
rgan
ism
Sequ
ence
C
over
ed (%
)
The
oret
ical
/O
bser
ved
Mol
ecul
ar
Mas
s (kD
a)
The
oret
ical
/O
bser
ved
(pI)
AB
1
rib
ulos
e 1,
5-bi
spho
spha
te
carb
oxyl
ase/
oxyg
enas
e la
rge
chai
n (R
uBis
Co
larg
e ch
ain)
MSP
QTE
TKA
GV
GFK
AG
VK
DY
KL
TY
YT
PEY
ET
KD
TD
ILA
AFR
VSP
QPG
VPP
EEA
GA
AV
AA
ESST
GTW
TTV
WTD
GLT
SLD
RY
KG
RC
YH
IEPV
AG
EDSQ
WIC
YV
AY
PLD
LFEE
GSV
TNM
FTSI
VG
VFG
FKA
LRA
LRLE
DLR
IPPT
YSK
TFQ
GPP
HG
IQV
ERD
KLN
KY
GR
PLLG
CTI
KPK
LGLS
AK
NY
GR
AC
YEC
LRG
GLD
FTK
DD
ENV
NSQ
PFM
RW
RD
RFV
FCA
EAIY
KSQ
AET
GEI
KG
HY
LNA
TAG
TCEE
MIK
RA
VFA
REL
GV
PIV
MH
DY
LTG
GFT
AN
TTLA
HY
CR
DN
GLL
LHIH
RA
MH
AV
IDR
QK
NH
GM
HFR
VLA
KA
LRM
SGG
DH
IHSG
TVV
GK
LEG
ERE
MT
LG
FVD
LL
RD
DFI
EKD
RA
RG
IFF
TQD
WV
SMPG
VIP
VA
SGG
IHV
WH
MPA
LTEI
FGD
DSV
LQFG
GG
TLG
HPW
GN
APG
AA
AN
RV
ALE
AC
VQ
AR
NEG
RD
LAR
EGN
EIIR
AA
CK
WSP
ELA
AA
CE
VW
KA
IKFE
FEPV
DT
IDK
1401
7580
Triti
cum
ae
stiv
um
10 %
52
.8 /
55.0
6.
22 /
7.20
AB
2
th
aum
atin
-like
pro
tein
TLP
5
MA
FSG
VV
HLI
ALV
IAV
AA
AA
TDA
TTIT
VV
NR
CSY
TIW
PGA
LPG
GG
AR
LD
PGQ
SWQ
LN
MPA
GT
AG
AR
VW
PRTG
CTF
DR
SGR
GR
CIT
GD
CA
GA
LVC
RV
SGE
QPA
TL
AE
YT
LG
QG
GN
RD
FFD
LSV
IDG
FNV
PMSF
QPV
GG
APC
RA
ATC
AV
DIT
HEC
LPEL
QV
PGG
CA
SAC
GK
FGG
DTY
CC
RG
QFE
HN
CPP
TYY
SRFF
KG
KC
PDA
YSY
AK
DD
QTS
TFTC
PAG
TNY
QIV
LCPA
RN
DLH
MD
Q
5668
2582
Hor
deum
vu
lgar
e
16 %
24
.9 /
24.0
6.
04 /
7.00
(con
t. on
nex
t pag
e)
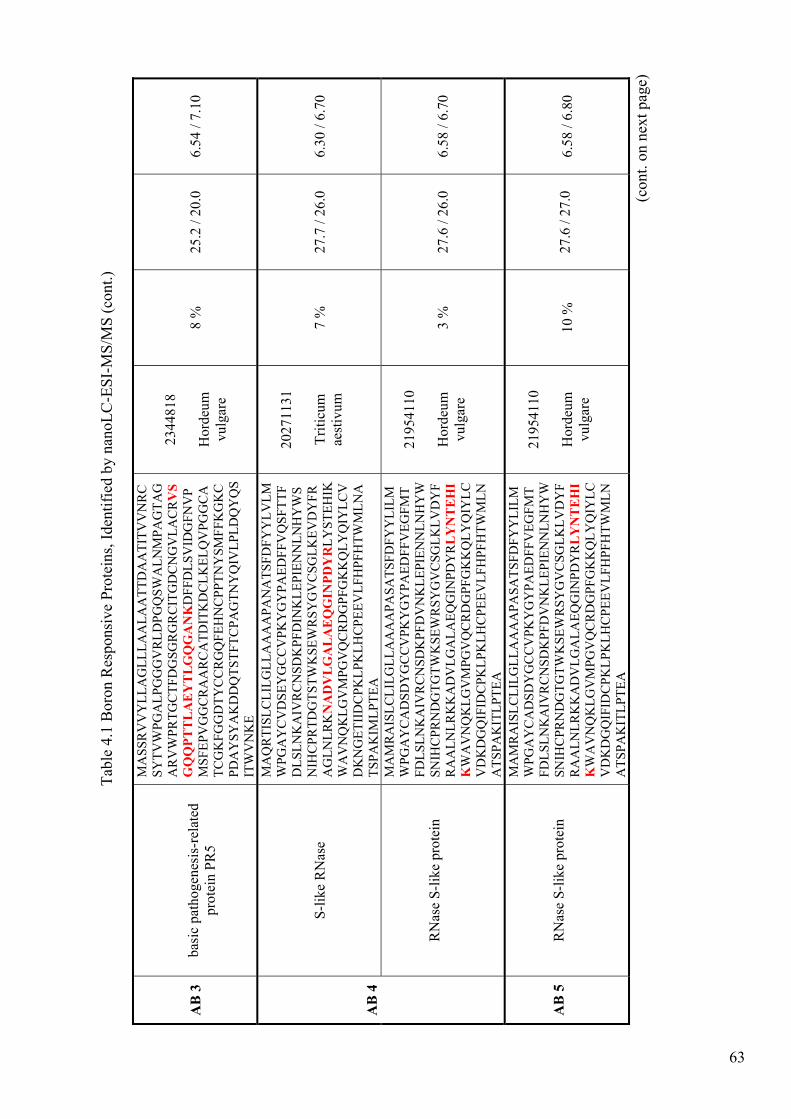
63
AB
3
ba
sic
path
ogen
esis
-rel
ated
pr
otei
n PR
5
MA
SSR
VV
YLL
AG
LLLA
ALA
ATT
DA
ATI
TVV
NR
CSY
TVW
PGA
LPG
GG
VR
LDPG
QSW
ALN
MPA
GTA
GA
RV
WPR
TGC
TFD
GSG
RG
RC
ITG
DC
NG
VLA
CR
VS
GQ
QPT
TL
AE
YT
LG
QG
AN
KD
FFD
LSV
IDG
FNV
PM
SFEP
VG
GC
RA
AR
CA
TDIT
KD
CLK
ELQ
VPG
GC
ATC
GK
FGG
DTY
CC
RG
QFE
HN
CPP
TNY
SMFF
KG
KC
PDA
YSY
AK
DD
QTS
TFTC
PAG
TNY
QIV
LPLD
QY
QS
ITW
VN
KE
2344
818
H
orde
um
vulg
are
8 %
25
.2 /
20.0
6.
54 /
7.10
S-lik
e R
Nas
e
MA
QR
TISL
CLI
LGLL
AA
AA
PAN
ATS
FDFY
YLV
LMW
PGA
YC
VD
SEY
GC
CV
PKY
GY
PAED
FFV
QSF
TTF
DLS
LNK
AIV
RC
NSD
KPF
DIN
KLE
PIEN
NLN
HY
WS
NIH
CPR
TDG
TSTW
KSE
WR
SYG
VC
SGLK
EVD
YFR
AG
LNLR
KN
AD
VL
GA
LA
EQ
GIN
PDY
RLY
STEH
IKW
AV
NQ
KLG
VM
PGV
QC
RD
GPF
GK
KQ
LYQ
IYLC
VD
KN
GET
IID
CPK
LPK
LHC
PEEV
LFH
PFH
TWM
LNA
TSPA
KIM
LPTE
A
2027
1131
Triti
cum
ae
stiv
um
7 %
27
.7 /
26.0
6.
30 /
6.70
AB
4
RN
ase
S-lik
e pr
otei
n
MA
MR
AIS
LCLI
LGLL
AA
AA
PASA
TSFD
FYY
LILM
WPG
AY
CA
DSD
YG
CC
VPK
YG
YPA
EDFF
VEG
FMT
FDLS
LNK
AIV
RC
NSD
KPF
DV
NK
LEPI
ENN
LNH
YW
SNIH
CPR
ND
GTG
TWK
SEW
RSY
GV
CSG
LKLV
DY
FR
AA
LNLR
KK
AD
VLG
ALA
EQG
INPD
YR
LY
NT
EH
IK
WA
VN
QK
LGV
MPG
VQ
CR
DG
PFG
KK
QLY
QIY
LCV
DK
DG
QIF
IDC
PKLP
KLH
CPE
EVLF
HPF
HTW
MLN
ATS
PAK
ITLP
TEA
2195
4110
Hor
deum
vu
lgar
e
3 %
27
.6 /
26.0
6.
58 /
6.70
AB
5
R
Nas
e S-
like
prot
ein
MA
MR
AIS
LCLI
LGLL
AA
AA
PASA
TSFD
FYY
LILM
WPG
AY
CA
DSD
YG
CC
VPK
YG
YPA
EDFF
VEG
FMT
FDLS
LNK
AIV
RC
NSD
KPF
DV
NK
LEPI
ENN
LNH
YW
SNIH
CPR
ND
GTG
TWK
SEW
RSY
GV
CSG
LKLV
DY
FR
AA
LNLR
KK
AD
VLG
ALA
EQG
INPD
YR
LY
NT
EH
IK
WA
VN
QK
LGV
MPG
VQ
CR
DG
PFG
KK
QLY
QIY
LCV
DK
DG
QIF
IDC
PKLP
KLH
CPE
EVLF
HPF
HTW
MLN
ATS
PAK
ITLP
TEA
2195
4110
Hor
deum
vu
lgar
e
10 %
27
.6 /
27.0
6.
58 /
6.80
(con
t. on
nex
t pag
e)
Tabl
e 4.
1 B
oron
Res
pons
ive
Prot
eins
, Ide
ntifi
ed b
y na
noLC
-ESI
-MS/
MS
(con
t.)
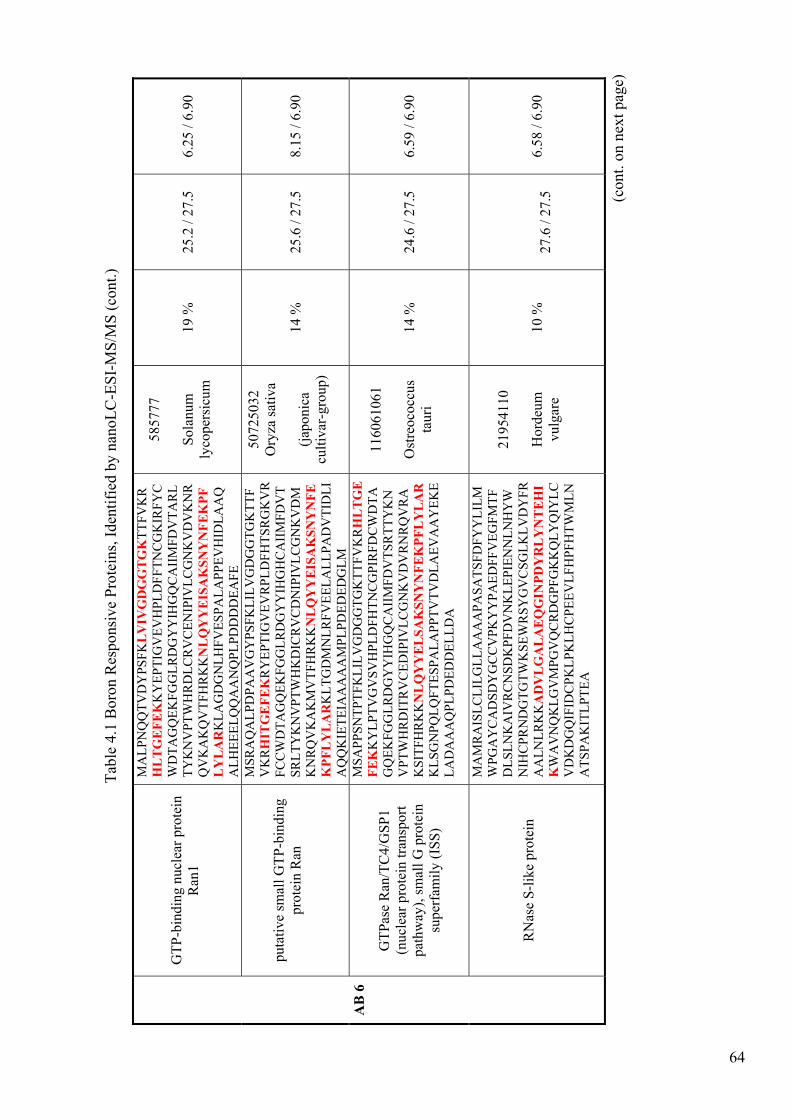
64
G
TP-b
indi
ng n
ucle
ar p
rote
in
Ran
1
MA
LPN
TVD
YPS
FKL
VIV
GD
GG
TG
KTT
FVK
RH
LT
GE
FEK
KY
EPTI
GV
EVH
PLD
FFTN
CG
KIR
FYC
WD
TAG
QEK
FGG
LRD
GY
YIH
GQ
CA
IIM
FDV
TAR
LTY
KN
VPT
WH
RD
LCR
VC
ENIP
IVLC
GN
KV
DV
KN
RQ
VK
AK
QV
TFH
RK
KN
LQ
YY
EIS
AK
SNY
NFE
KPF
LY
LA
RK
LAG
DG
NLH
FVES
PALA
PPEV
HID
LAA
QA
LHEE
ELQ
QA
AN
QPL
PDD
DD
EAFE
5857
77
So
lanu
m
lyco
pers
icum
19 %
25
.2 /
27.5
6.
25 /
6.90
puta
tive
smal
l GTP
-bin
ding
pr
otei
n R
an
MSR
AQ
ALP
DPA
AV
GY
PSFK
LILV
GD
GG
TGK
TTF
VK
RH
ITG
EFE
KR
YEP
TIG
VEV
RPL
DFH
TSR
GK
VR
FCC
WD
TAG
QEK
FGG
LRD
GY
YIH
GH
CA
IIM
FDV
TSR
LTY
KN
VPT
WH
KD
ICR
VC
DN
IPIV
LCG
NK
VD
MK
NR
QV
KA
KM
VTF
HR
KK
NL
QY
YE
ISA
KSN
YN
FEK
PFL
YL
AR
KLT
GD
MN
LRFV
EELA
LLPA
DV
TID
LIA
KIE
TEIA
AA
AA
MPL
PDED
EDG
LM
5072
5032
O
ryza
sativ
a
(ja
poni
ca
culti
var-
grou
p)
14 %
25
.6 /
27.5
8.
15 /
6.90
GTP
ase
Ran
/TC
4/G
SP1
(nuc
lear
pro
tein
tran
spor
t pa
thw
ay),
smal
l G p
rote
in
supe
rfam
ily (I
SS)
MSA
PPSN
TPTF
KLI
LVG
DG
GTG
KTT
FVK
RH
LT
GE
FEK
KY
LPTV
GV
SVH
PLD
FHTN
CG
PIR
FDC
WD
TAG
QEK
FGG
LRD
GY
YIH
GQ
CA
IIM
FDV
TSR
TTY
KN
VPT
WH
RD
ITR
VC
EDIP
IVLC
GN
KV
DV
RN
RQ
VR
AK
SITF
HR
KK
NL
QY
YE
LSA
KSN
YN
FEK
PFL
YL
AR
KLS
GN
PQLQ
FTES
PALA
PPTV
TVD
LAEV
AA
YEK
ELA
DA
AA
QPL
PDED
DEL
LDA
1160
6106
1
Ost
reoc
occu
s ta
uri
14 %
24
.6 /
27.5
6.
59 /
6.90
AB
6
R
Nas
e S-
like
prot
ein
MA
MR
AIS
LCLI
LGLL
AA
AA
PASA
TSFD
FYY
LILM
WPG
AY
CA
DSD
YG
CC
VPK
YY
PAED
FFV
EGFM
TFD
LSLN
KA
IVR
CN
SDK
PFD
VN
KLE
PIEN
NLN
HY
WN
IHC
PRN
DG
TGTW
KSE
WR
SYG
VC
SGLK
LVD
YFR
AA
LNLR
KK
AD
VL
GA
LA
EQ
GIN
PDY
RL
YN
TE
HI
KW
AV
NQ
KLG
VM
PGV
QC
RD
GPF
GK
KQ
LYQ
IYLC
VD
KD
GQ
IFID
CPK
LPK
LHC
PEEV
LFH
PFH
TWM
LNA
TSPA
KIT
LPTE
A
2195
4110
Hor
deum
vu
lgar
e
10 %
27
.6 /
27.5
6.
58 /
6.90
Tabl
e 4.
1 B
oron
Res
pons
ive
Prot
eins
, Ide
ntifi
ed b
y na
noLC
-ESI
-MS/
MS
(con
t.)
(con
t. on
nex
t pag
e)
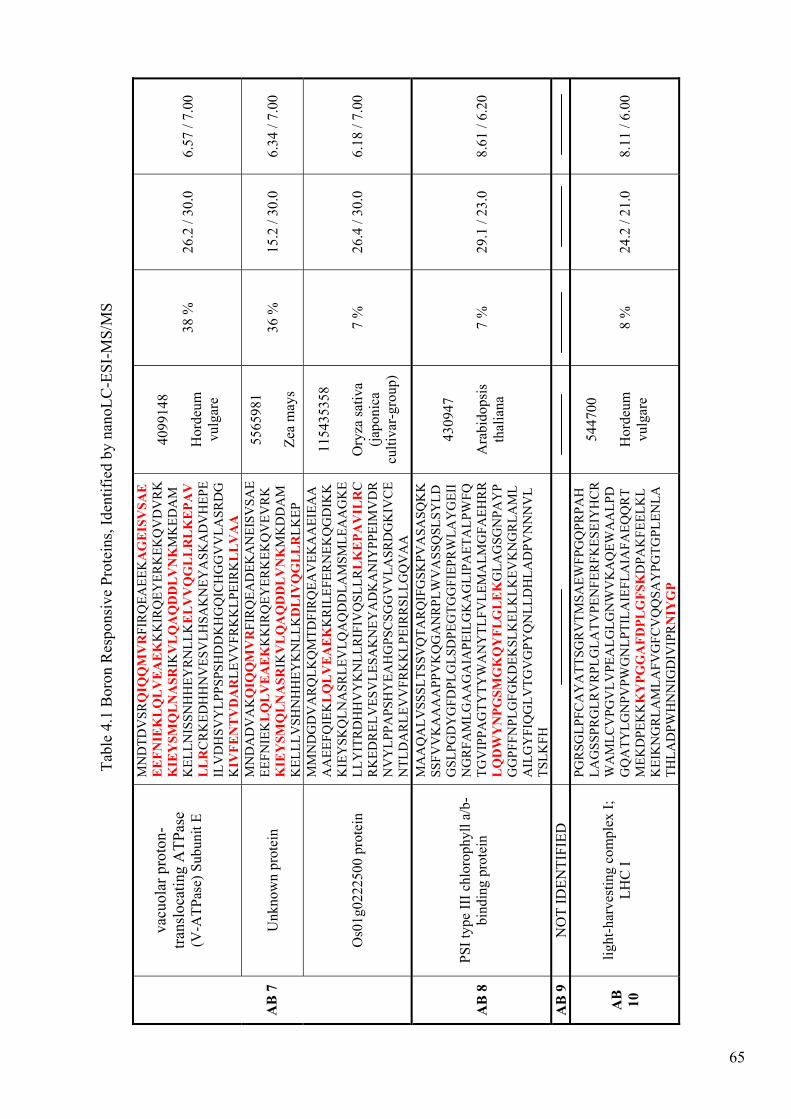
65
va
cuol
ar p
roto
n-tra
nslo
catin
g A
TPas
e (V
-ATP
ase)
Sub
unit
E
MN
DTD
VSR
QIQ
QM
VR
FIR
QEA
EEK
AG
EIS
VSA
EE
EFN
IEK
LQ
LV
EA
EK
KK
IRQ
EYER
KEK
QV
DV
RK
KIE
YSM
QL
NA
SRIK
VL
QA
QD
DL
VN
KM
KED
AM
KEL
LNIS
SNH
HEY
RN
LLK
EL
VV
QG
LL
RL
KE
PAV
LL
RC
RK
EDH
HN
VES
VLH
SAK
NEY
ASK
AD
VH
EPE
ILV
DH
SVY
LPPS
PSH
DD
KH
GQ
ICH
GG
VV
LASR
DG
KIV
FEN
TV
DA
RLE
VV
FRK
KLP
EIR
KL
LV
AA
4099
148
H
orde
um
vulg
are
38 %
26
.2 /
30.0
6.
57 /
7.00
U
nkno
wn
prot
ein
MN
DA
DV
AK
QIQ
QM
VR
FIR
QEA
DEK
AN
EISV
SAE
EEFN
IEK
LQ
LV
EA
EK
KK
IRQ
EYER
KEK
QV
EVR
KK
IEY
SMQ
LN
ASR
IKV
LQ
AQ
DD
LV
NK
MK
DD
AM
KEL
LLV
SHN
HH
EYK
NLL
KD
LIV
QG
LL
RLK
EP
5565
981
Ze
a m
ays
36 %
15
.2 /
30.0
6.
34 /
7.00
A
B 7
O
s01g
0222
500
prot
ein
MM
ND
GD
VA
RQ
LKQ
MTD
FIR
QEA
VEK
AA
EIEA
AA
AEE
FQIE
KL
QL
VE
AE
KK
RIL
EFER
NEK
QG
DIK
KK
IEY
SKQ
LNA
SRLE
VLQ
AQ
DD
LAM
SMLE
AA
GK
ELL
YIT
RD
HH
VY
KN
LLR
IFIV
QSL
LRL
KE
PAV
ILR
CR
KED
REL
VES
VLE
SAK
NEY
AD
KA
NIY
PPEI
MV
DR
NV
YLP
PAPS
HY
EAH
GPS
CSG
GV
VLA
SRD
GK
IVC
EN
TLD
AR
LEV
VFR
KK
LPEI
RR
SLLG
QV
AA
1154
3535
8
Ory
za sa
tiva
(japo
nica
cu
ltiva
r-gr
oup)
7 %
26
.4 /
30.0
6.
18 /
7.00
AB
8
PSI t
ype
III c
hlor
ophy
ll a/
b-bi
ndin
g pr
otei
n
MA
AQ
ALV
SSSL
TSSV
QTA
RQ
IFG
SKPV
ASA
SQK
KSS
FVV
KA
AA
APP
VK
QG
AN
RPL
WV
ASS
QSL
SYLD
GSL
PGD
YG
FDPL
GLS
DPE
GTG
GFI
EPR
WLA
YG
EII
NG
RFA
MLG
AA
GA
IAPE
ILG
KA
GLI
PAET
ALP
WFQ
TGV
IPPA
GTY
TYW
AN
YTL
FVLE
MA
LMG
FAEH
RR
LQ
DW
YN
PGSM
GK
QY
FLG
LE
KG
LAG
SGN
PAY
PG
GPF
FNPL
GFG
KD
EKSL
KEL
KLK
EVK
NG
RLA
ML
AIL
GY
FIQ
GLV
TGV
GPY
QN
LLD
HLA
DPV
NN
NV
LTS
LKFH
4309
47
A
rabi
dops
is
thal
iana
7 %
29
.1 /
23.0
8.
61 /
6.20
AB
9
NO
T ID
ENTI
FIED
AB
10
light
-har
vest
ing
com
plex
I;
LHC
I
PGR
SGLP
FCA
YA
TTSG
RV
TMSA
EWFP
GQ
PRPA
HLA
GSS
PRG
LRV
RPL
GLA
TVPE
NFE
RFK
ESEI
YH
CR
WA
MLC
VPG
VLV
PEA
LGLG
NW
VK
AQ
EWA
ALP
DG
QA
TYLG
NPV
PWG
NLP
TILA
IEFL
AIA
FAEQ
QR
TM
EKD
PEK
KK
YPG
GA
FDPL
GFS
KD
PAK
FEEL
KL
KEI
KN
GR
LAM
LAFV
GFC
VQ
QSA
YPG
TGPL
ENLA
THLA
DPW
HN
NIG
DIV
IPR
NIY
GP
5447
00
H
orde
um
vulg
are
8 %
24
.2 /
21.0
8.
11 /
6.00
Tabl
e 4.
1 B
oron
Res
pons
ive
Prot
eins
, Ide
ntifi
ed b
y na
noLC
-ESI
-MS/
MS
66
In Table 4.1., the sequence of the each protein was shown with its other
characteristic properties. The red colored amino acid sequence indicates the identified
sequence by LC-MS/MS. This sequence was then entered into the database to identify
and to name the protein.
Mass spectrometry analysis and database searching helped to identify 10 spots
representing 7 different proteins. These seven proteins were consequence of boron
stress. Two spots were identified as the same protein and one protein was not identified.
The identified 7 proteins are namely, ribulose 1,5-bisphosphate carboxylase/oxygenase
large chain (RuBisCo large chain), thaumatin-like protein TLP5, basic pathogenesis-
related protein PR5, RNase S-like protein, vacuolar proton-translocating ATPase
subunit E, PSI type III chlorophyll a/b-binding protein, and light-harvesting complex I;
LHC I.
The identified three protein, thaumatin-like protein TLP5, basic pathogenesis-
related protein PR5 and RNase S-like protein, are environmental stress related proteins
that expressed in plant leaves under boron treatment. Other three protein, RuBisCo large
chain, PSI type III chlorophyll a/b-binding protein and light-harvesting complex I, are
photosynthesis related proteins. Toxic concentration of boron in plants causes reducing
normal growth and development, leaf area loss due to inhibition of photosynthesis by
decreasing of chlorophyll concentrations and CO2 fixation. Vacuolar proton-
translocating ATPase subunit E protein is the most important one which provides the
living of plant under boron stress.
After boron stress, green leaf area was decreased due to neurotic and chlorotic
patches in barley genotypes. To counteract boron stress, plants can change their gene
expression and protein accumulation. In our study, it was obvious that barley leaves
need to increase their photosynthesis activity to maintain their lives. This observation
was confirmed by identification of three proteins which are related to photosynthetic
mechanism. These proteins are ribulose 1,5-bisphosphate carboxylase/oxygenase large
chain (RuBisCo large chain), PSI type III chlorophyll a/b-binding protein, and light-
harvesting complex I; LHC I, spot 1, spot 8, spot 10, respectively.
In figure 4.3 and 4.4, RuBisCO LSU and RuBisCO SSU stand for large subunit
of RuBisCO and small subunit of RuBisCO, respectively. These subunit’s molecular
weights are at approximately 55 kDa (for large chain) and 14 kDa (for small chain). In
our study, spot 1 is identified as RuBisCO large subunit. To our knowledge, the
expression of this protein is mainly due to demand of maintaining lives of barley leaves
67
under boron stress. Because of losing green leaf area, plants want to enhance its
photosynthetic rate and this causes the expression of photosynthesis-related protein,
RuBisCO.
RuBisCO, a critical enzyme in the photosynthesis, a short for ribulose 1,5-
bisphosphate carboxylase/oxygenase. It catalyzes reaction between carbon dioxide
(CO2) and the five-carbon sugar ribulose 1, 5-bisphospate (RuBP), the first major step
of carbon fixation in Calvin cycle. RuBisCO catalyzes the carboxylation or oxygenation
of RuBP with carbon dioxide or oxygen, respectively. RuBisCO is probably the most
abundant protein in leaves due to being 16 % of the protein content of the chloroplast,
and it may be the most abundant on Earth. RuBisCO is slow compared to many
enzymes; it is able to fix only a few carbon dioxide molecules per second whereas some
enzymes can catalyze thousands of chemical reactions per second. In addition,
RuBisCO is the primary rate-limiting enzyme of the Calvin cycle when the light is off.
RuBisCO is only active during the day because RuBP is not being produced in the dark
due to the regulation of several other enzymes in the Calvin cycle.
However, the dynamic range of protein accumulation is very large; this is a
problem for leaf proteomic analysis because the preponderance of RuBisCO which
masks the detection of proteins in small amount. There are some methods to get rid of
RuBisCO while protein extraction was carried out from plant leaves.
Spot 2 is identified as thaumatin-like protein, TLP5. Thaumatin-like proteins
(TLPs) are polypeptides of about 200 residues synthesized by plants in response to
fungal infection. Their name is derived from the first member isolated from the seeds of
the plant Thaumatococcus danielli. Some scientists have demonstrated that TLPs’s
action against pathogenic microorganism has been related to endo-β-1,3-glucanase
activity and α-amylase inhibiting properties (Brandazza, et al. 2004). However, not all
plant TLPs show glucanase activity. TLPs were assigned TLP1-TLP8 in order of
increasing isoelectric points where TLP5 is thought to be a basic protein. These TLPs
belong to the family of PR-5. N-terminal region of TLP5 closely resembles that a
protein called avematin, a TLP isolated as an antifungal protein from oat seeds (Avena
sativa) (Reiss, et al. 2001). TLP5 shows a C-terminal structure differing from that of the
other TLPs by having additional nine residues on that side of the chain.
Spot 3 is found as basic pathogenesis-related protein, PR-5. Pathogenesis-related
(PR) proteins are involved in plant responses to biotic and abiotic stress and they are a
large group of low molecular mass proteins. PR proteins were originally identified in
68
tobacco plants infected with tobacco mosaic virus (TMV) (van Loon and van Kammen,
1970) and they have been known since then. Based on their primary structures,
immunologic relationships, and enzymatic properties, PR proteins are currently grouped
into seventeen families (PR-1 through 17) (Zhang 2006). PR proteins play an important
role in protecting plants from pathogen infection and also has functions to alleviate the
harmful effects to cells and organisms caused by natural stresses, such as cold, drought,
osmotic stress, UV light, and metal toxicity. PR-5 proteins are a family of proteins that
are induced by different phyto-pathogens in many plants. The family of PR-5 proteins
includes proteins with several functions, such as roles in development, protection
against osmotic stress and freezing tolerance in plants. There have been found three
classes of PR-5 protein group in some plant, namely acid, basic and neutral isoforms.
The proteins of the PR-5 family are also called thaumatin-like proteins (TLPs)
as they have a high degree of homology to thaumatin, a sweet-tasting protein. PR-5
proteins have been suggested to bind β-1,3-glucans, and hence they might have
carbohydrate-binding properties that may result present in membrane-permeabilizing
activity.
Spot 4-5-6 are identified as the same protein, RNase S-like protein. It is the
member of plant’s RNase T2 family. S-like RNases are homologous to S-RNases, other
member of RNase T2 family, and it is not involved in self-incompatibility. The majority
of S-like RNases in higher plants are induced during both senescence and phosphate
starvation. They are believed to be components of a phosphate remobilization system
that recycles phosphates during senescence or phosphate starvation to supplement the
limited supply of phosphate available from soil. However, the main function of RNase-
related proteins (RRPs) in plants remains largely unknown. The barley RRP gene was
found specifically expressed in leaves and was induced by light, but its role has not yet
been defined (Shimizu, et al. 2001, Gausing 2000).
Spot 8 and spot 10 were identified as PSI type III chlorophyll a/b-binding
protein and light-harvesting complex I; LHC I, respectively. Photosystems are protein
complexes involved in photosynthesis, simply uses light to reduce molecules. During
oxygenic photosynthesis, photosystem I (PSI) and photosystem II (PSII) operate in
series. They are located in distinct thylakoid membrane regions and have different light
absorption properties. Under changing light conditions, the reversible phosphorylation
of light harvesting chlorophyll a/b binding proteins (LHC II) represents a system for
balancing the excitation energy between the two photosystems (Liu, et al. 2004). A
69
light-harvesting complex is one or more polypeptide chains containing photosynthetic
pigments, which surrounds a photosystem and focuses light inward toward its core.
Chlorophylls, with the carotenoids, are the most important in light-harvesting
complexes in plants. Chlorophyll b is nearly identical to chlorophyll a except it formyl
group instead of methyl group. This makes chlorophyll b absorb light at 400 and 500
nm wavelengths efficiently. Green plants have chloroplast, which is called a
photosynthetic area, holds the pigment protein complexes, known as LHC, light-
harvesting complexes, I and II in their thylakoid membrane.
Spot 7 is identified as vacuolar proton-translocating ATPase (H+ V-ATPases or
V-ATPase) subunit E. The plant V-ATPase is a primary-active proton pump located at
the vacuolar membrane (tonoplast) and various other components of the endomembrane
system of the plant cell (Li and Zhang 2004).
V-ATPases affect several cellular processes such as cell expansion, cytoplasmic
pH and ion homeostasis and transient or permanent deposition of toxic ions, excess
nutrients and metabolites in the vacuolar lumen. V-ATPase is known as a house-
keeping enzyme by maintaining cytosolic ion homeostasis and cellular metabolism. On
the other hand, it has functions as a stress response enzyme under environmental stress
by changing expression levels of subunits.
V-ATPases consists of 14 different polypeptide subunits which are organized in
two domains and they work together as a rotary machine (Inoue, et al. 2005). The V1
domain is a membrane-peripheral complex of 650 kDa, which carries out ATP
hydrolysis, is located on the cytoplasmic side of the membrane and it is composed of
eight subunits (A, B, C, D, E, F, G and H). In addition to this, the V0 domain is a
membrane-integral complex of 260 kDa which is responsible for the translocation of
protons from the cytoplasm to the vacuole and it contains six subunits (a, c, c', c'', d and
e). The following figure indicates the parts of the V-ATPase membrane protein.
The V1 domain consists of 3 copies of subunits A and B that form a ring, 2
copies of E and G subunits, 1 or 2 copies of subunit of H and single copies of the
remaining subunits. Three copies of subunit A (catalytic subunit) and subunit B (non-
catalytic ATP binding) mediate the hydrolysis of ATP at three reaction sites (Golldack
and Dietz 2001). The other remaining subunits are arranged between fixed peripheral
stalk and central rotational stalk which connect the V1 with V0 domain. The V0 domain
composed of 4 or 5 copies of proteolipid subunits (c, c', and c'') and single copies of the
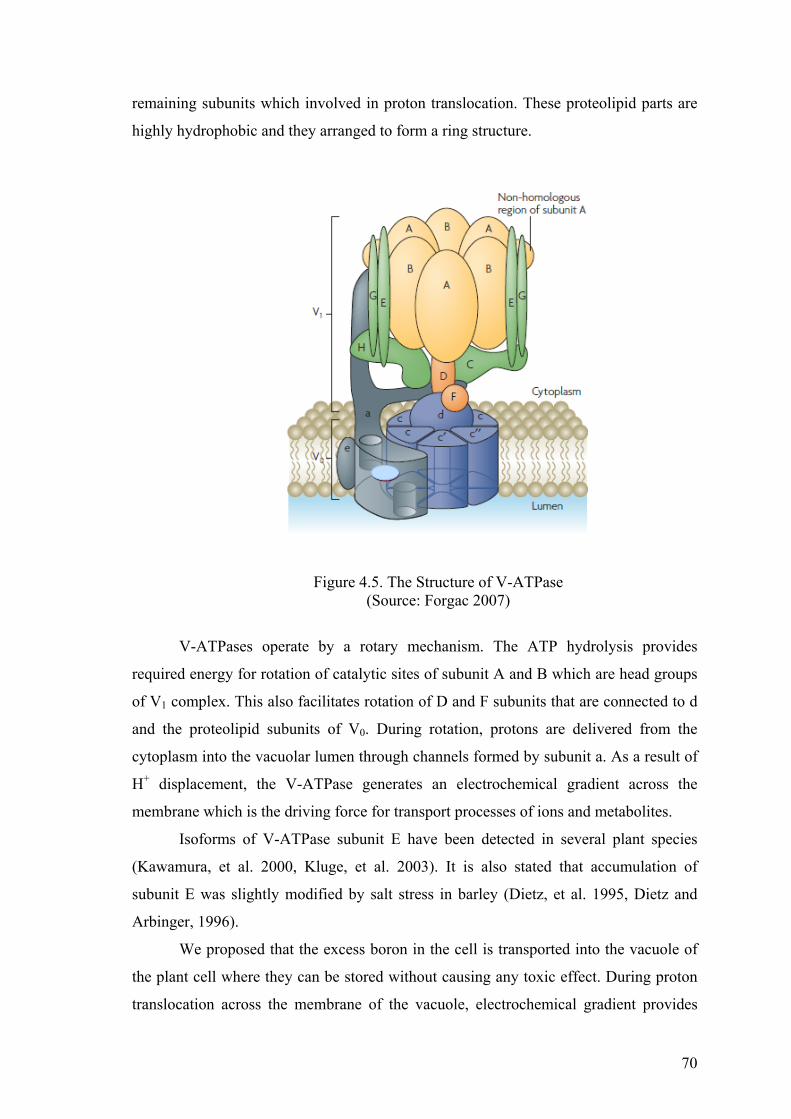
70
remaining subunits which involved in proton translocation. These proteolipid parts are
highly hydrophobic and they arranged to form a ring structure.
Figure 4.5. The Structure of V-ATPase (Source: Forgac 2007)
V-ATPases operate by a rotary mechanism. The ATP hydrolysis provides
required energy for rotation of catalytic sites of subunit A and B which are head groups
of V1 complex. This also facilitates rotation of D and F subunits that are connected to d
and the proteolipid subunits of V0. During rotation, protons are delivered from the
cytoplasm into the vacuolar lumen through channels formed by subunit a. As a result of
H+ displacement, the V-ATPase generates an electrochemical gradient across the
membrane which is the driving force for transport processes of ions and metabolites.
Isoforms of V-ATPase subunit E have been detected in several plant species
(Kawamura, et al. 2000, Kluge, et al. 2003). It is also stated that accumulation of
subunit E was slightly modified by salt stress in barley (Dietz, et al. 1995, Dietz and
Arbinger, 1996).
We proposed that the excess boron in the cell is transported into the vacuole of
the plant cell where they can be stored without causing any toxic effect. During proton
translocation across the membrane of the vacuole, electrochemical gradient provides
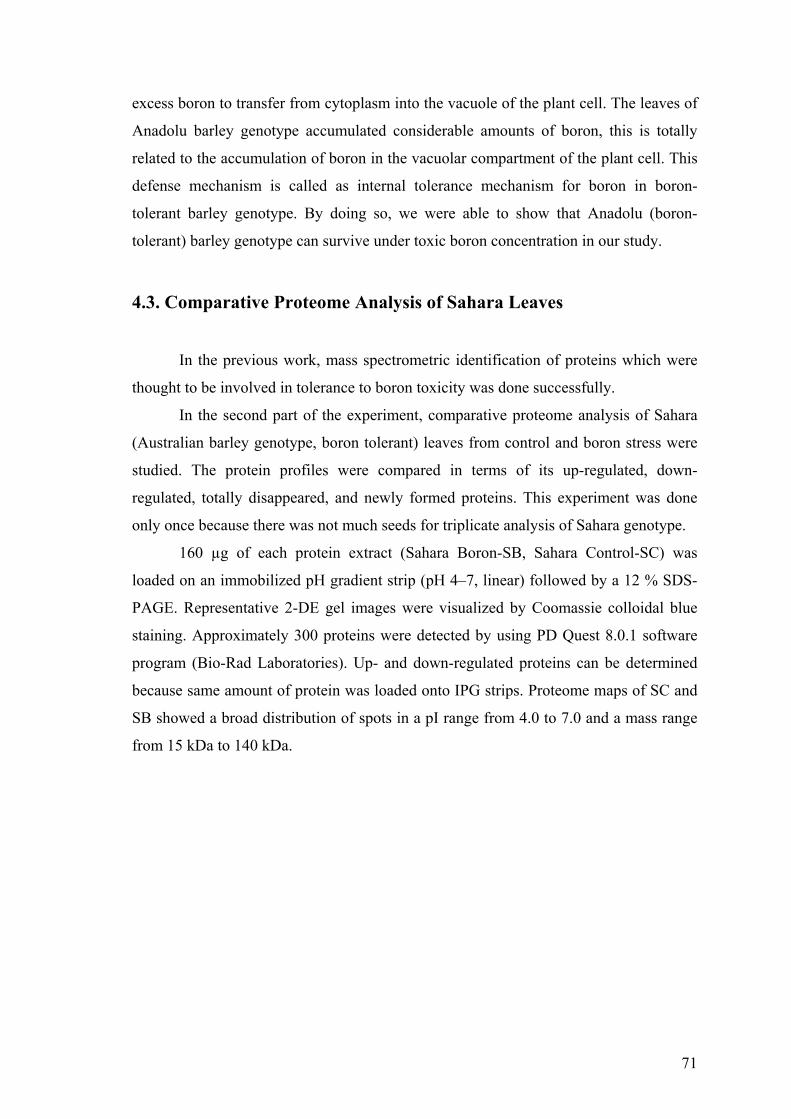
71
excess boron to transfer from cytoplasm into the vacuole of the plant cell. The leaves of
Anadolu barley genotype accumulated considerable amounts of boron, this is totally
related to the accumulation of boron in the vacuolar compartment of the plant cell. This
defense mechanism is called as internal tolerance mechanism for boron in boron-
tolerant barley genotype. By doing so, we were able to show that Anadolu (boron-
tolerant) barley genotype can survive under toxic boron concentration in our study.
4.3. Comparative Proteome Analysis of Sahara Leaves
In the previous work, mass spectrometric identification of proteins which were
thought to be involved in tolerance to boron toxicity was done successfully.
In the second part of the experiment, comparative proteome analysis of Sahara
(Australian barley genotype, boron tolerant) leaves from control and boron stress were
studied. The protein profiles were compared in terms of its up-regulated, down-
regulated, totally disappeared, and newly formed proteins. This experiment was done
only once because there was not much seeds for triplicate analysis of Sahara genotype.
160 µg of each protein extract (Sahara Boron-SB, Sahara Control-SC) was
loaded on an immobilized pH gradient strip (pH 4–7, linear) followed by a 12 % SDS-
PAGE. Representative 2-DE gel images were visualized by Coomassie colloidal blue
staining. Approximately 300 proteins were detected by using PD Quest 8.0.1 software
program (Bio-Rad Laboratories). Up- and down-regulated proteins can be determined
because same amount of protein was loaded onto IPG strips. Proteome maps of SC and
SB showed a broad distribution of spots in a pI range from 4.0 to 7.0 and a mass range
from 15 kDa to 140 kDa.
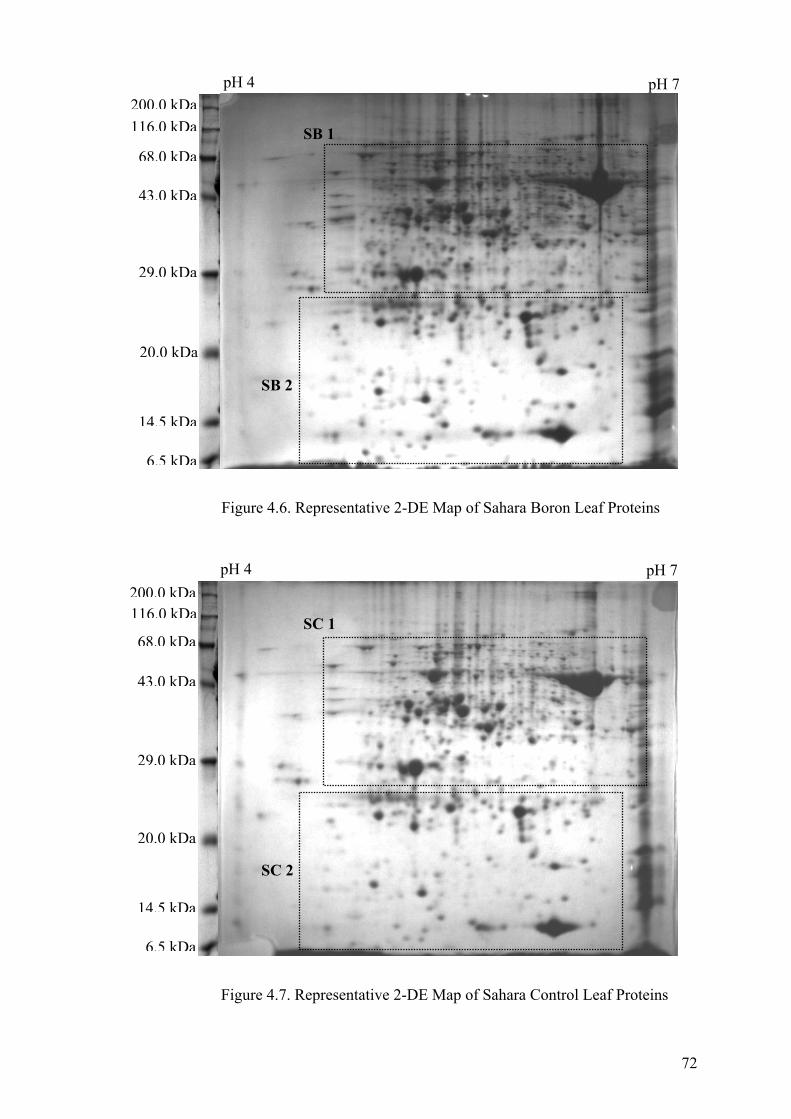
72
Figure 4.6. Representative 2-DE Map of Sahara Boron Leaf Proteins
Figure 4.7. Representative 2-DE Map of Sahara Control Leaf Proteins
pH 7 pH 4
6.5 kDa
14.5 kDa
20.0 kDa
29.0 kDa
43.0 kDa
68.0 kDa
116.0 kDa
pH 4 pH 7
6.5 kDa
14.5 kDa
20.0 kDa
29.0 kDa
43.0 kDa
68.0 kDa
116.0 kDa200.0 kDa
SB 1
SB 2
SC 2
SC 1
200.0 kDa
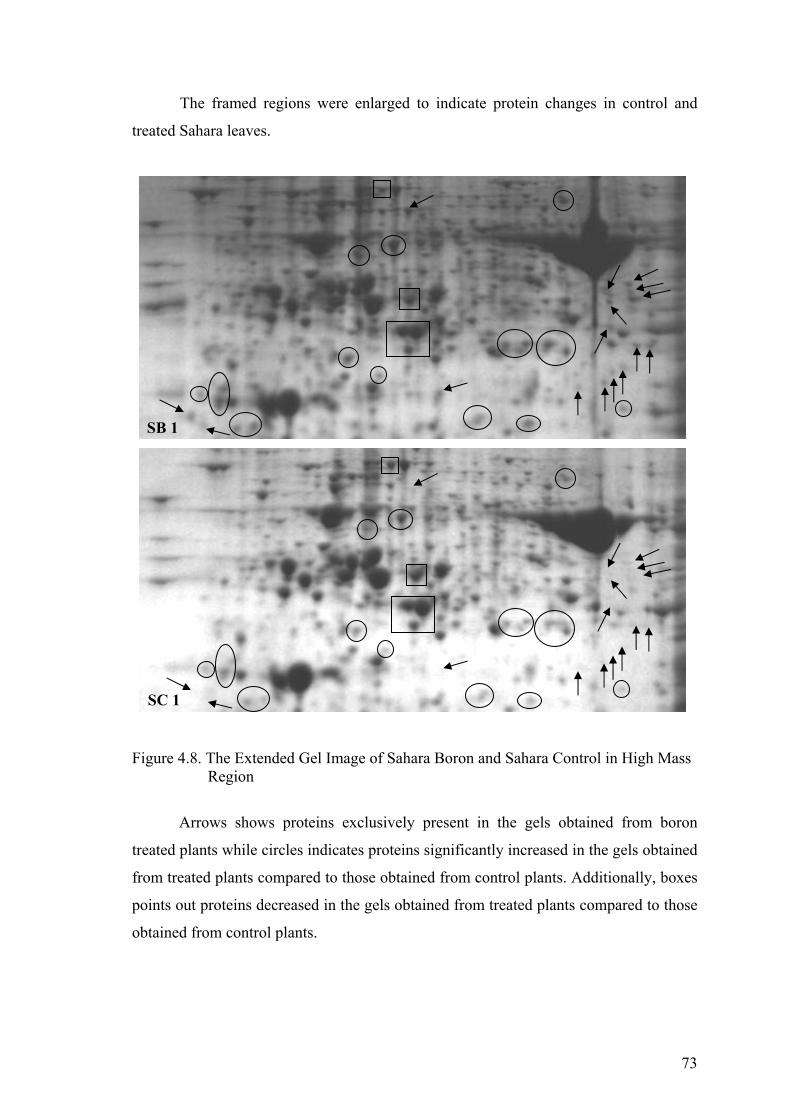
73
The framed regions were enlarged to indicate protein changes in control and
treated Sahara leaves.
Figure 4.8. The Extended Gel Image of Sahara Boron and Sahara Control in High Mass Region
Arrows shows proteins exclusively present in the gels obtained from boron
treated plants while circles indicates proteins significantly increased in the gels obtained
from treated plants compared to those obtained from control plants. Additionally, boxes
points out proteins decreased in the gels obtained from treated plants compared to those
obtained from control plants.
SC 1
SB 1
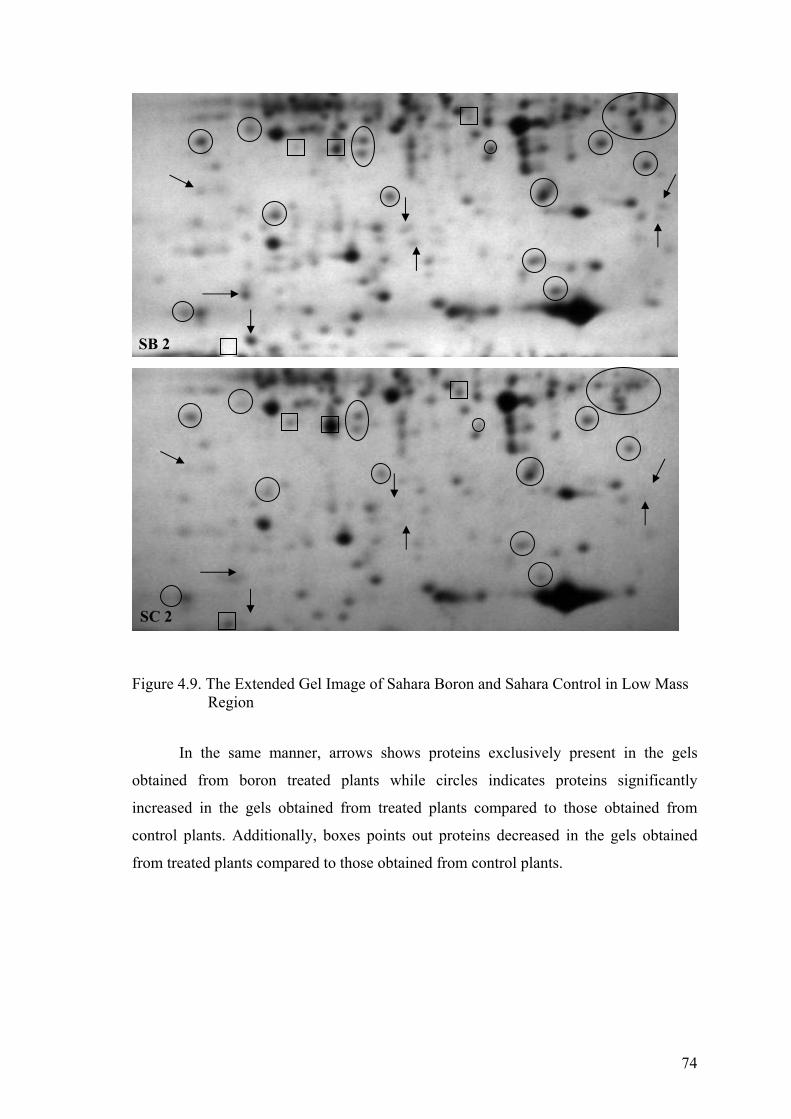
74
Figure 4.9. The Extended Gel Image of Sahara Boron and Sahara Control in Low Mass Region
In the same manner, arrows shows proteins exclusively present in the gels
obtained from boron treated plants while circles indicates proteins significantly
increased in the gels obtained from treated plants compared to those obtained from
control plants. Additionally, boxes points out proteins decreased in the gels obtained
from treated plants compared to those obtained from control plants.
SB 2
SC 2
75
It can be said that disappearance of the protein spots may be interpreted as the
“turning off” of protein synthetic genetic machinery (genes) in response to boron
treatments. Additionally, down-regulated proteins can also be explained with the same
reason.
To our observations, the growth of three genotypes were reduced under boron
treatments; more, however for the sensitive Hamidiye than for Anadolu and Sahara.
Lastly, comparative proteome analysis of Sahara leaf proteins under control and stress
conditions provided to detect up-regulated, down-regulated, newly expressed and
completely disappeared proteins. For deeper analysis, mass spectrometric identification
of these proteins could be done to explain defense mechanism to toxic boron
concentrations.
The main theory is that every condition produces a unique set of proteins in the
organisms. Proteins are the primary effector macromolecules of all living systems, and
therefore virtually and adaptive response to environmental, physiological or
pathological conditions will be reflected by alterations in protein activity, location and
concentration. It is obvious that stress conditions have been shown to alter the protein
composition of cells both qualitatively and quantitatively. In addition, higher plants
synthesize new proteins which are involved in the stress tolerance mechanisms. Such
proteins are thought to be potential markers for boron tolerance of barley genotypes in
breeding program. For that reason, understanding the effect of boron on barley is an
important issue for the improvement of the quality of these crops in boron rich soils.
76
CHAPTER 5
CONCLUSION
In this study, the main goal was to identify boron-stress tolerant proteins in
boron-tolerant barley genotype by proteomic approach. One of the identified protein
name as V-ATPase subunit E is the most important one for defense mechanism in
boron-tolerant barley genotype. It is shown that excess boron ion in the cytoplasm of the
cell is translocated into the vacuole of the plant cell by the help of V-ATPase subunit E.
V-ATPases works by a rotary mechanisms. During rotation of head group of V-ATPase
(subunits A and B), two-protons are transferred from the cytoplasm into the vacuolar
lumen through channels. This generates an electrochemical gradient across the
membrane which is driving force for transport boron ion into the vacuole of the plant
cell. This is called internal tolerance mechanism without causing the plant cell to die
under toxic boron concentrations. It is proposed that this might be the tolerance
mechanism for boron in Anadolu genotype of barley.
In addition of V-ATPase protein, six more proteins were also identified by mass
spectrometry. Three of them are photosynthetic mechanism related proteins due to the
decreasing leaf green area which can be monitored as necrotic and chlorotic spots along
the leaf margins and tips of leaves. In order to survive under these conditions plants
needs to increase their photosynthesis mechanism. Photosynthesis can be effected by
excess boron because it may causes activation or over expression of some genes in
chloroplast genome. Other identified three proteins are generally expressed proteins
under any environmental stresses.
Barley leaf proteins of Australian boron-tolerant genotype (Sahara) from control
and 10 mM boric acid treatment stress group were also studied. It was shown that level
of several proteins were changed after stress application such as up- and down-
regulation and novel proteins were observed. Mass spectrometry must be conducted to
this analysis for identifying boron-stress responsive proteins and to clarify the tolerance
mechanism.
These two works indicates that certain proteins may be involved in tolerance to
boron toxicity. Several proteins can be altered under boron treatment. The further step
of this kind of studies is the identification of genes whose expression is induced or

77
enhanced under boron stress by identifying boron tolerant proteins firstly. These genes
might be used in the breeding program for barley to improve crop tolerance to boron
toxicity.
78
REFERENCES
Adam, P.J., Boyd, R., Tyson, K.L., Fletcher, G.C., Stamps, A., and Hudson, L. 2003. Comprehensive proteomic analysis of breast cancer cell membranes reveals unique proteins with potential roles in clinical cancer. Journal of Biological Chemistry 278:6482-6489.
Adessi, C., Miege, C., Albrieux, C., and Rabilloud, T. 1997. Two-dimensional
electrophoresis of membrane proteins: A current challenge for immobilized pH gradients. Electrophoresis 8:127-135.
Amme, S., Matros, A., and Schlesier, H.M. 2006. Proteome analysis of cold stress
response in Arabidopsis thaliana using DIGE-technology. Journal of Experimental Botany 57:1537-1546.
Avcı, M. and Akar, T. 2005. Severity and spatial distribution of boron toxicity in barley
cultivated areas of Central Anatolia and transitional zones. Turkish Journal of Agriculture 29:377-382.
Bae, M.S., Cho, E.J., Choi, E.Y., and Park, O.K. 2003. Analysis of the arabidopsis
nuclear proteome and its response to cold stress. Plant Journal 36:652-663. Barber, M., Bordoli, R.S., Sedgwick, R.D., and Taylor, A.N. 1981. Fast atom
bombardment of solids as an ion source in mass spectrometry. Nature 293:270-275. Barbier-Brygoo, H. and Joyard, J. 2004. Focus on plant proteomics. Plant Physiology
and Biochemistry 42:913-917. Beavis, R.C. and Chait, B.T. 1989. Cinnamic acid derivatives as matrices for ultraviolet
laser desorption mass spectrometry of proteins. Rapid Communication in Mass Spectrometry 3:432-435.
Beavis, R.C., Chaudhary, T., and Chait, B.T. 1992. α-cyano-4-hydroxycinnamic acid as
a matrix for matrix-assisted laser desorption mass spectrometry. Organic Mass Spectrometry 27:156-158.
Blevins, D.G. and Lukaszewski, K.M. 1998. Boron in plant structure and function.
Annunal Review of Plant Physiology and Plant Molecular Biology 49:481-500. Bolaños, L., Lukaszewski, K., Bonilla, I., and Blevins, D. 2004. Why boron?. Plant
Physiology and Biochemistry 42:907-912. Bona, E., Marsano, F., Cavaletto, M., and Berta, G. 2007. Proteomic characterization of
copper stress response in Cannabis sativa roots. Proteomics 7:1121-1130.

79
Borderies, G., Jamet, E., Lafitte, C., Rossignol, M., Jauneau, A., and Boudart, G. 2003. Proteomics of loosely bound cell wall proteins of Arabidopsis thaliana cell suspension cultures: A critical analysis. Electrophoresis 24:3421-3432.
Bradford, M.M. 1976. A rapid and sensitive method for the quantitation of microgram
quantities of protein utilizing the principle of protein-dye binding. Analytical Biochemistry 72:248-254.
Brandazza, A., Angeli, S., Tegoni, M., Cambillau, C., and Pelosi, P. 2004. Plant stress
proteins of the thaumatin-like family discovered in animals. FEBS Letters 572:3-7. Brown, P.H., Bellaloui, N., Wimmer, M.A., Basil, E.S., Ruiz, J., Hu, H., Pfeffer, H.,
Dannel, F., and Römheld, V. 2002. Boron in plant biology. Plant Biology 4:211-229.
Campo, S., Carrascal, M., Coca, M., Abian, J., and San Sequndo, B. 2004. The defense
response of germinating maize embryos against fungal infection: A proteomic approach. Proteomics 4:383-396.
Chernushevich, I.V., Loboda, A.V., and Thomson, B.A. 2001. An introduction to
quadrupole time-of-flight mass spectrometry. Journal of Mass Spectrometry 36:849-865.
Chivasa, S., Ndimba, B. K., Simon, W.J., Robertson, D., Yu, X. L., Knox, J. P.,
Bolwell, P., and Slabas, A.R. 2002. Proteomic analysis of the Arabidopsis thaliana cell wall. Electrophoresis 23:1754-1765.
Choi, J., Malakowsky, C., Talent, J., Conrad, C. and Gracy, R.W. 2002. Identification
of oxidized plasma proteins in alzheimer’s disease. Biochemical and Biophysical Research Communication 293:1566-1570.
Dani, V., Simon, W.J., Duranti, M., and Croy, R.R.D. 2005. Changes in the tobacco leaf
apoplast proteome in response to salt stress. Proteomics 5:737-745. Darbouret, D. and Kano, I. 2000. Ultrapure water blank for boron trace analysis.
Journal of Analytical Atomic Spectrometry 15:1395-1399. Dietz, K.J., Rudloff, S., Ageorges, A., Eckerskorn, C., Fischer, K., and Arbinger, B.
1995. Subunit E of the vacuolar H+-ATPase of Hordeum vulgare L.: cDNA cloning, expression and immunological analysis. Plant Journal 8:521–529.
Dietz, K. J. and Arbinger, B. 1996. cDNA sequence and expression of SuE of the
vacuolar H+-ATPase in the inducible crassulacean acid metabolism plant Mesembryanthemum crystallinum. Biochimica et Biophysica Acta 1281:134-138.
Donnelly B. E., Madden R. D., Ayoubi P., Porter D.R., and Dillwith J.W. 2005. The
wheat (Triticum aestivum L.) leaf proteome. Proteomics 5:1624-1633.
80
Dubois, F., Knochenmuss, R., Zenobi, R., Brunelle, A., Deprun, C., and Beyec, Y.L. 1999. A comparison between ion-to-photon and microchannel plate detectors. Rapid Communications in Mass Spectrometry 13:786-791.
Fenn, J.B., Mann, M., Meng, C.K., Wong, S.F., and Whitehouse, C.M. 1989.
Electrospray ionization for mass spectrometry of large biomolecules. Science 246:64-71.
Ferreira, S., Hjerno, K., Larsen, M., Wingsle, G., Larsen, P., and Fey, S. 2006.
Proteome profiling of Populus euphratica oliv. upon heat stress. Annals of Botany 98:361-377.
Ferro, M., Salvi, D., Brugiere, S., Miras, S., Kowalski, S., Louwagie, M., Garin, J.,
Joyard, J., and Rolland, N. 2003. Proteomics of the chloroplast envelope membranes from Arabidopsis thaliana. Molecular & Cellular Proteomics 2:325-345.
Fleischer, A., O’Neill, M. A., and Ehwald, R. 1999. The pore size of non-
graminaceaous plant cell walls is rapidly decreased by borate ester cross-linking of the pectic polysaccharide rhamnogalacturonan II. Plant Physiology 121:829-838.
Forgac. M. 2007. Vacuolar ATPases: Rotary proton pumps in physiology and
pathophysiology. Nature Review 8:917-929 Gallardo, K., Job, C., Groot, S.P., Puype, M., Demol, H., and Vandekerckhove, J. 2001.
Proteomic analysis of arabidopsis seed germination and priming. Plant Physiology 126:835-848.
Gausing, K. 2000. A barley gene (rsh1) encoding a ribonuclease S-like homologue
specifically expressed in young light-grown leaves. Planta 210:574-579. Goff, S.A., Ricke, D., Lan, T.-H., Presting, G., Wang, R., Dunn, M., Glazebrook, J.,
Sessions, A., Oeller, P., Varma, H., Hadley, D., Hutchison, D., Martin, C., Katagiri, F., Lange, B.M., Moughamer T., Xia, Y., Budworth, P., Zhong, J., Miguel, T., Paszkowski, U., Zhang, S., Colbert, M., Sun, W.L., Chen, L., Cooper, B., Park, S., Wood, T.C., Mao, L., Quail, P., Wing, R., Dean, R., Yu, Y., Zharkikh, A., Shen, R., Sahasrabudhe, S., Thomas, A., Cannings, R., Gutin, A., Pruss, D., Reid, J., Tavtigian, S., Mitchell, J., Eldredge, G., Scholl, T., Miller, R.M., Bhatnagar, S., Adey, N., Rubano, T., Tusneem, N., Robinson, R., Feldhaus, J., Macalma, T., Oliphant, A., and Briggs, S. 2002. A draft sequence of the rice genome (Oryza sativa L. ssp. japonica). Science 296:92-100.
Golldack, D. and Dietz, K. J. 2001. Salt-induced expression of the vacuolar H+-ATPase
in the common ice plant is developmentally controlled and tissue specific. Plant Physiology 125:1643-1654
Gonnet, F., Lemaitre, G., Waksman, G., and Tortajada, J. 2003. MALDI/MS peptide
mass fingerprinting for proteome analysis: Identification of hydrophobic proteins attached to eucaryote keratinocyte cytoplasmic membrane using different matrices in concert. Proteome Science 1:1-7.
81
Görg, A., Postel, W., and Günther, S. 1988. Two-dimensional electrophoresis. The current state of two-dimensional electrophoresis with immobilized pH gradients. Electrophoresis 9:531-546.
Görg, A. 1991. Two-dimensional electrophoresis. Nature 349:545-546. Görg, A., Postel, W., Friedrich, C., Kuick, R., Strahler, J.R., and Hanash, S. M. 1991.
Temperature-dependent spot positional variability in two-dimensional polypeptide patterns. Electrophoresis 12:653-658.
Görg, A., Boguth, G., Obermaier, C., Posch, A., and Weiss, W. 1995. Two-dimensional
polyacrylamide gel electrophoresis with immobilized pH gradients in the first dimension (IPG-Dalt): The State of the art and the controversy of vertical versus horizontal systems. Electrophoresis 16:1079-1108.
Görg, A., Obermaier, C., Boguth, G., Harder, A., Scheibe, B., Wildgruber, R., and
Weiss, W. 2000. The current state of two-dimensional electrophoresis with immobilized pH gradients. Electrophoresis 21:1037-1053.
Greber, S., Lubec, G., Cairns, N., and Fountoulakis, M. 1999. Decreased levels of
synaptosomal associated protein 25 in the brain of patients with down syndrome and alzheimer's disease. Electrophoresis 20:928-934.
Grieve, C.M. and Poss, J.A. 2000. Wheat response to interactive effects of boron and
salinity. Journal of Plant Nutrition 23:1217-1226. Hayes, J.E. and Reid, R.J. 2004. Boron tolerance in barley is mediated by efflux of
boron from the roots. Plant Physiology 136:3376-3382. Hu, H., Brown, H. P., and Labavitch, J. M. 1996. Species variability in boron
requirements in correlated with cell wall pectin. Journal of Experimental Botany 295:227-232.
Ingle, R., Smith, J., and Sweetlove, L. 2005. Responses to nickel in the proteome of the
hyperaccumulator plant Alyssum lesbiacum. Biometals 18:627-641. Inoue, T., Wang, Y., Jefferies, K., Qi, J., Hinton, A., and Forgac, M. 2005. Structure
and regulation of the V-ATPases. Journal of Bioenergetics and Biomembranes 37: 393-398
Jorrin, J.V., Rubiales, D., Dumas-Gaudot, E., Recorbet, G., Maldonado, A., and
Castillejo, M.A. 2006. Proteomics: a promising approach to study abiotic interaction in legumes: A review. Euphytica 147:37-47.
Kang, J.G., Pyo, Y.J., Cho, J.W., and Cho, M.H. 2004. Comparative analysis of
differentially expressed proteins induced by K+ deficiency in Arabidopsis thaliana. Proteomics 4:3549-3559.
82
Kar, Y., Şen, N., and Demirbaş, A. 2006. Boron minerals in Turkey, their application areas and importance for the country's economy. Minerals & Energy-Raw Materials Report 20:2-10.
Karabal, E., Yücel, M., and Öktem, H. 2003. Antioxidant responses of tolerant and
sensitive barley cultivars to boron toxicity. Plant Science 164:925-933. Karas, M. and Hillenkamp F. 1988. Laser desorption ionization of proteins with
molecular masses exceeding 10,000 daltons. Analytical Chemistry 60:2299-2301. Kav, N.N.V., Srivastava, S., Goonewardene, L., and Blade, S.F. 2004. Proteome level
changes in the root of Pisum sativum in response to salinity. Annals of Applied Biology 145:217-230.
Kawamura, Y., Arakawa, K., Maeshima, M., and Yoshida, S. 2000. Tissue specificity
of E subunit isoforms of plant vacuolar H+-ATPase and existence of isotype enzymes. Journal of Biological Chemistry 275:6515–6522.
Kawamura, Y. and Uemura, M. 2003. Mass spectrometric approach for identifying
putative plasma membrane proteins of arabidopsis leaves associated with cold acclimation. Plant Journal 36:141-154.
Keren, R., and Bingham, F.T. 1985. Boron in water, soils, and plants. Advanced Soil
Science 1:230-276. Kluge, C., Lahr, J., Hanitzsch, M., Bolte, S., Golldack, D., and Dietz, K.J. 2003. New
insight into the structure and regulation of the plant vacuolar H+-ATPase. Journal of Bioenergetics and Biomembranes 35:377–388.
Kranz, B.A. and Melsted, S.W., eds. 1964. Nutrient deficiencies in corn, sorghums and
small Grains. New York: 3rd edition. Kruft, V., Eubel, H., Jansch, L., Werhahn, W., and Braun, H.P. 2001. Proteomic
approach to identify novel mitochondrial proteins in arabidopsis. Plant Physiology 127:1694-1710.
Kulakowska, A.B., Krzysik, A.B., Dylag, T., Drabik, A., Suder, P., Noga, M.,
Jarzebinska, J., and Silberring, J. 2007. Methods for samples preparation in proteomic research. Journal of Chromatography B 849:1-31.
Läemmli, U.K. 1970. Cleavage of structural proteins during the assembly of the head of
bacteriophage T4. Nature 227:680-685. Laugesen, S. and Roepstorff, P. 2003. Combination of two matrices results in improved
performance of MALDI MS for peptide mass mapping and protein analysis. Journal of the American Society for Mass Spectrometry 14:992-1002.
Lehrer, S., Roboz, J., Ding, H., Zhao, S., Diamond, E.J., and Holland, J.F. 2003.
Putative protein markers in the sera of men with prostatic neoplasms. Britain Journal of Urology International 92:223-225.
83
Li, Z. and Zhang X. 2004. Electron-microscopic structure of the V-ATPase from mung
bean. Planta 219:948-954. Liebler, Daniel C. 2002. Introduction to Proteomics-Tools for the New Biology.
Totowa, NJ: Humana Press. Liu, X.D. and Shen, Y. G. 2004. NaCl-induced phosphorylation of light harvesting
chlorophyll a/b proteins in thylakoid membranes from the halotolerant green alga, Dunaliella salina. FEBS Letters 569:337-340.
Loomis, W. D. and Durst, R.W. 1992. Chemistry and biology of boron. Biofactors
3:229-239. L´opez, L.J. 2007. Two-dimensional electrophoresis in proteome expression analysis.
Journal of Chromatography B 849:190-202. Mahboobi, H., Yücel, M., and Öktem, H.A. 2000. Changes in total protein profiles of
barley cultivars in response to toxic boron concentration. Journal of Plant Nutrition 23:391-399.
Mahboobi, H., Yücel, M., and Öktem, H.A. 2001. Cell wall uronic acid concentration of
resistant and sensitive cultivars of wheat and barley under boron toxicity. Journal of Plant Nutrition 24:1965-1973.
Mahboobi, H., Yücel, M., and Öktem, H.A. 2002. Nitrate reductase and glutamate
dehydrogenase activities of resistant and sensitive cultivars of wheat and barley under boron toxicity. Journal of Plant Nutrition 25:1829-1837.
Matoh, T. 1997. Boron in plant cell walls. Plant and Soil 193:59-70. Mattila, K.M. and Frey, H. 1996. Biomarkers in alzheimer’s disease?. Pathological
Biology 44:685-688. Merril, C. R. 1990. Gel-staining techniques. Methods in Enzymology 182:477-488. Millar, A.H., Sweetlove, L.J., Giege, P., and Leaver, C. 2001. Analysis of the
arabidopsis mitochondrial proteome. Plant Physiology 127:1711-1727. Nable, R. O., Baňuelos, G. S., and Paull, J.G. 1997. Boron toxicity. Plant and Soil
193:181-198. Nable, R.O. 1988. Resistance to boron toxicity amongst several barley and wheat
cultivars: A preliminary examination of the resistance mechanism. Plant Soil 112:45-52.
Nyman, T. A. 2001. The role of mass spectrometry in proteome studies. Biomolecular
Engineering 18:221-227.
84
O'Farrell, P.H. 1975. High resolution two-dimensional electrophoresis of proteins. Journal of Biological Chemistry 250:4007-4021.
Paull, J.G., Nable, R.O., and Rathjen, A.J. 1992. Physiological and genetic control of
the tolerance of wheat to high concentration of boron and implications for plant breeding. Plant Soil 146:251-260.
Peltier, J. B., Friso, G., Kalume, D. E., Roepstorff, P., Nilsson, F., Adamska, I., and Van
Wijk, K. J. 2000. Proteomics of the chloroplast: Systematic identification and targeting analysis of lumenal and peripheral thylakoid proteins. Plant Cell 12:319-342.
Peltier, J.B., Emanuelsson, O., Kalume, D.E., Ytterberg, J., Friso, G., and Rudella, A.
2002. Central functions of the lumenal and peripheral thylakoid proteome of arabidopsis determined by experimentation and genome-wide prediction. Plant Cell 14:211-36.
Rabilloud, T., Adessi, C., Giraudel, A., and Lunardi, J. 1997. Improvement of the
solubilization of proteins in two-dimensional electrophoresis with immobilized pH gradients. Electrophoresis 18:307-316.
Rabilloud, T., Strub, J.M., Sylvie, L., Dorsselaer, A.A., and Lunardi, J. 2001. A
comparison between sypro ruby and ruthenium II tris (bathophenanthroline disulfonate) as fluorescent stains for protein detection in gels. Proteomics 1:699-704.
Rai, A.J., Zhang, Z., Rosenzweig, J., Shih, I., Pham, T., and Fung, E.T. 2002. Proteomic
approaches to tumor marker discovery. Archives of Pathology and Laboratory Medicine 126:1518-1526.
Ralston, N.V.C. and Hunt, C.D. 2000. Biological boron interactions: Charge and
structure characteristic required for boroester formation with biomolecules. FASEB Journal 14:A538.
Reiss, E. and Horstmann, C. 2001. Drechslera teres-infected barley (Hordeum vulgare
L.) leaves accumulate eight isoforms of thaumatin-like proteins. Physiology and Molecular Plant Pathology 58:183-188.
Roessner, U., Patterson, J.H., Forbes, M.G., Fincher, G.B., Langridge, P., and Bacic, A.
2006. An investigation of boron toxicity in barley using metabolomics. Plant Physiology 142:1087-1101.
Rose, J.C., Bashir, S., Giovannoni, J.J, Jahn, M.M., and Saravanan, R.S. 2004. Tackling
the plant proteome: Practical approaches, hurdles and experimental tools. Plant Journal 39:715-733.
Rosenfeld, J.J., Capdevielle, J., Guillemot, C., and Ferrara, P. 1992. In-gel digestion of
proteins for internal sequence analysis after one-or two-dimensional gel electrophoresis. Analytical Biochemistry 203:173-179.
85
Salekdeh, G. H, Siopongco, J., Wade, L.J., Ghareyazie, B., and Bennett, J. 2002. A proteomic approach to analyzing drought and salt-responsiveness in rice. Field Crops Research 76:199-219.
Salekdeh, G.H., Siopongco, J., Wade, L.J., Ghareyazie, B., and Bennett, J. 2002.
Proteomic analysis of rice leaves during drought stress and recovery. Proteomics 2:1131-1145.
Santoni, V., Rouquie, D., Doumas, P., Mansion, M., Boutry, M., Degand, H., Dupree,
P., Packman, L., Sherrier, J., Prime, T., Bauw, G., Posada, E., Rouze, P., Dehais, P., Sahnoun, I., Barlier, I., and Rossignol, M. 1998. Use of a proteome strategy for tagging proteins present at the plasma membrane. Plant Journal 16:633-641.
Shevchenko, A.M., Wilm, O.V., and Mann, M. 1996. Mass spectrometric sequencing of
proteins from silver-stained polyacrylamide gels. Analytical Chemistry 68:850-858. Shimizu, T., Inoue, T., and Shiraishi, H. 2001. A senescence-associated S-like RNase in
the multicellular green alga Volvox carteri. Gene 274:227-235. Shkolnik, M.Y. 1974. General conception of physiological role of boron in plants. Plant
Physiology 21:174–186. Strupat, K., Karas, M., and Hillenkamp, F. 1991. 2,5-dihydroxybenzoic acid: A new
matrix for laser desorption-ionization mass spectrometry. International Journal of Mass Spectrometry and Ion Processes 111:89-102.
The Arabidopsis Genome Initiative. 2000. Analysis of the genome sequence of the
flowering plant Arabidopsis thaliana. Nature 408:796-815. The University of Bristol, School of Chemistry. 2007.
http://www.chm.bris.ac.uk/ms/theory/tof-massspec.html (accessed November 23, 2007).
Tilleman, K., Deforce, D., and Elewaut, D. 2005. A close encounter with proteomics.
Rheumatology 44:1217-1226. Torun, B., Kalaycı, M., Öztürk, L., Torun, A., Aydın, M., and Çakmak, İ. 2003.
Differences in shoot boron concentrations, leaf symptoms, and yield of Turkish barley cultivars grown on boron-toxic soil in field. Journal of Plant Nutrition 26:1735-1747.
United States Department of Agriculture (USDA) Foreign Agricultural Service. 2007.
World Barley Production, Consumption, and Stocks http://www.fas.usda.gov/psdonline/psdgetreport.aspx?hidReportRetrievalName=B S&hidRportRetrievalID=378&hidReportRetrievalTemplateID=7 (accessed August 23, 2007).
86
Van Loon, L.C. and Van Kammen, A. 1970. Polyacrylamide disc electrophoresis of the soluble leaf proteins from Nicotiana tabacum var. “Smsun” and “Samsun NN” II. Changes in protein constitution after infection with tobacco mosaic virus. Virology 40:199-206.
Ventelon-Debout, M., Nguyen, T.T.H., Wissocq, A., Berger, C., Laudie, M., and Piegu,
B. 2003. Analysis of the transcriptional response to rice yellow mottle virus infection in Oryza sativa indica and japonica cultivars. Molecular Genetics and Genomics 270:253-262.
Vorm, O., Roepstorff, P., and Mann, M. 1994. Improved resolution and very high
sensitivity in MALDI-TOF of matrix surfaces made by fast evaporation. Analytical Chemistry 66:3281-3287.
Wasinger, V.C., Cordwell, S. J., Cepa-Poljak, A., Yan, J.X., Gooley, A.A., Wilkins,
M.R., Duncan, M.W., Harris, R., Williams, K.L., and Humphery-Smith, I. 1995. Progress with gene-product mapping of the mollicutes: Mycoplasma genitalium Electrophoresis 16:1090-1094.
Watson B.S., Asirvatham V.S., Wang L.J., and Sumner L.W. 2003. Mapping the
proteome of barrel medic (Medicago truncatula). Plant Physiology 131:1104-1123. Whitehouse, C.M., Dreyer, R.N., Yamashita, M., and Fenn, J.B. 1985. Electrospray
interface for liquid chromatographs and mass spectrometers. Analytical Chemistry 57:675-679.
Wikipedia contributors, "Coomassie". 2007. Wikipedia, The Free Encyclopedia.
http://en.wikipedia.org/wiki/ Coomassie (accessed November 23, 2007). Wilkins, M. R, Sanchez, J. C., and Gooley, A.A. 1996. Progress with proteome projects:
Why all proteins expressed by a genome should be identified and how to do it. Biotechnology& Genetic Engineering Reviews 3:19-50.
Wilm, M. and Mann, M. 1996. Analytical properties of the nano-electrospray ion
source. Analytical Chemistry 68:1-8. Wilm, M., Shevchenko, A., Houthaeve, T., Breit, S., Schweigerer, L., Fotsis, T., and
Mann, M. 1996. Femtomole sequencing of proteins from polyacrylamide gels by nano-electrospray mass spectrometry. Nature 379:466-469.
Wimmer, M.A., Mühling, K.H., Läuchli, A., Brown P.H., and Goldbach, H.E. 2003.
The interaction between salinity and boron toxicity affects the subcellular distribution of ions and proteins in wheat leaves. Plant, Cell & Environment 26:1267-1274.
Woods, W.G. 1994. An introduction to boron: History, sources, uses, and chemistry.
Environmental Health Perspective 102:5-11.
87
World Health Organization, 1998. “Guidelines for Drinking-Water Quality”, 2nd ed. Addendum to Vol. 2. Health Criteria and Other Supporting Information, Geneva, Switzerland, p. 2
Yan, S., Tang, T., Su, W., and Sun, W. 2005. Proteomic analysis of salt stress-
responsive proteins in rice root. Proteomics 5:235-244. Yates, J. R. 1998. Mass spectrometry and the age of the proteome. Journal of Mass
Spectrometry 33:1-19. Yu, J.S., Hu, J., Wang, G.K., Wong, S., Li, B., Liu, Y., Deng, L., Dai, Y., Zhou, X.,
Zhang, M., Cao, J., Liu, J., Sun, J., Tang, Y., Chen, X., Huang, W., Lin, C., Ye, W., Tong, L., Cong, J., Geng, Y., Han, L., Li, W., Li, G., Hu, X., Huang, W., Li, J., Li, Z., Liu, L., Li, J., Liu, Q., Qi, J., Liu, L., Li, T., Li, X., Wang, H., Lu, T., Wu, M., Zhu, P., Ni, H., Han, W., Dong, X., Ren, X., Feng, P., Cui, X., Li, H., Wang, X., Xu, W., Zhai, Z., Xu, J., Zhang, S., He, J., Zhang, J., Xu, K., Zhang, X., Zheng, J., Dong, W., Zeng, L., Tao, J., Ye, J., Tan, X., Ren, X., Chen, J., He, D., Liu, W., Tian, C., Tian, H., Xia, Q., Bao, G., Li, H., Gao, T., Cao, J., Wang, W., Zhao, P., Li, W., Chen, X., Wang, Y., Zhang, J., Hu, J., Wang, S., Liu, J., Yang, G., Zhang, Y., Xiong, Z., Li, L., Mao, C., Zhou, Z., Zhu, R., Chen, B., Hao, W., Zheng, S., Chen, W., Guo, G., Li, S., Liu, M., Tao, J., Wang, L., Zhu, L., and Yuan, H. 2002. A draft sequence of the rice genome (Oryza sativa L. ssp. indica). Science 296:79-92.
Zhang, Y. 2006. Studies of pathogenesis-related proteins in the strawberry plant: Partial
purification of a chitinase-containing protein complex and analysis of an osmotin-like protein gene. Nankai University thesis of PhD.
Zolla, L., Rinalducci, S., Timperio, A. M., and Huber, C. G. 2002. Proteomics of light-
harvesting proteins in different plant species. Analysis and comparison by liquid chromatography electrospray ionization mass spectrometry, photosystem I. Plant Physiology 130:1938-1950.
Zolla, L., Timperio, A.M., Walcher, W., and Huber, C. G. 2003. Proteomics of light-
harvesting proteins in different plant species. Analysis and comparison by liquid chromatography electrospray ionization mass spectrometry, photosystem II. Plant Physiology 131:198-214.
Zolla, L., Rinalducci, S., Timperio, A.M., Huber, C.G., and Righetti, P.G. 2004. Intact
mass measurements for unequivocal identification of hydrophobic photosynthetic photosystems I and II antenna proteins. Electrophoresis 25:1353-1366.