
A Promising Partner - University of Technology Sydney Chinese... · 2017-08-11 · Agreement; 44%...
12
research services MARCH 2015 How Chinese Elites View Australia A Promising Partner
Transcript of A Promising Partner - University of Technology Sydney Chinese... · 2017-08-11 · Agreement; 44%...
research services MARCH 2015
How Chinese Elites View AustraliaA Promising Partner

Zogby Research Services, LLCDr. James ZogbyElizabeth ZogbySarah Hope Zogby
© 2015
Cover image Chinese Garden by Eleleleven.
1
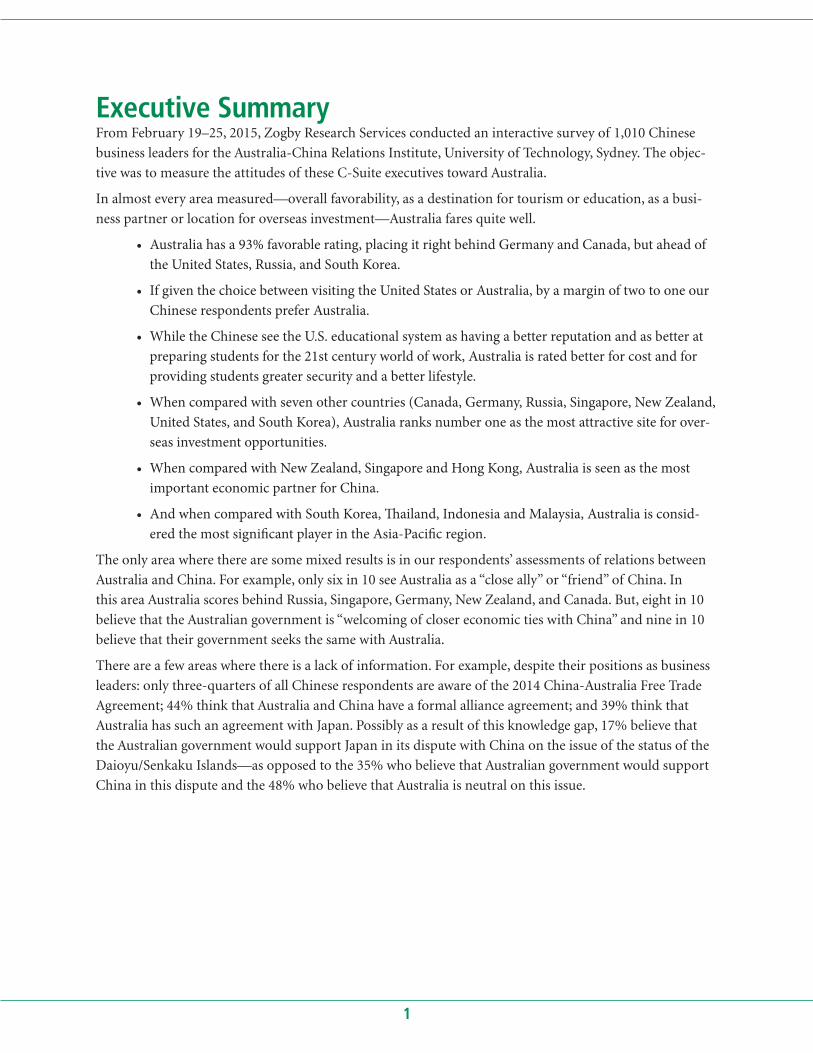
Executive SummaryFrom February 19–25, 2015, Zogby Research Services conducted an interactive survey of 1,010 Chinese
business leaders for the Australia-China Relations Institute, University of Technology, Sydney. The objec-
tive was to measure the attitudes of these C-Suite executives toward Australia.
In almost every area measured—overall favorability, as a destination for tourism or education, as a busi-
ness partner or location for overseas investment—Australia fares quite well.
• Australia has a 93% favorable rating, placing it right behind Germany and Canada, but ahead of the United States, Russia, and South Korea.
• If given the choice between visiting the United States or Australia, by a margin of two to one our Chinese respondents prefer Australia.
• While the Chinese see the U.S. educational system as having a better reputation and as better at preparing students for the 21st century world of work, Australia is rated better for cost and for providing students greater security and a better lifestyle.
• When compared with seven other countries (Canada, Germany, Russia, Singapore, New Zealand, United States, and South Korea), Australia ranks number one as the most attractive site for over-seas investment opportunities.
• When compared with New Zealand, Singapore and Hong Kong, Australia is seen as the most important economic partner for China.
• And when compared with South Korea, Thailand, Indonesia and Malaysia, Australia is consid-ered the most significant player in the Asia-Pacific region.
The only area where there are some mixed results is in our respondents’ assessments of relations between
Australia and China. For example, only six in 10 see Australia as a “close ally” or “friend” of China. In
this area Australia scores behind Russia, Singapore, Germany, New Zealand, and Canada. But, eight in 10
believe that the Australian government is “welcoming of closer economic ties with China” and nine in 10
believe that their government seeks the same with Australia.
There are a few areas where there is a lack of information. For example, despite their positions as business
leaders: only three-quarters of all Chinese respondents are aware of the 2014 China-Australia Free Trade
Agreement; 44% think that Australia and China have a formal alliance agreement; and 39% think that
Australia has such an agreement with Japan. Possibly as a result of this knowledge gap, 17% believe that
the Australian government would support Japan in its dispute with China on the issue of the status of the
Daioyu/Senkaku Islands—as opposed to the 35% who believe that Australian government would support
China in this dispute and the 48% who believe that Australia is neutral on this issue.
2
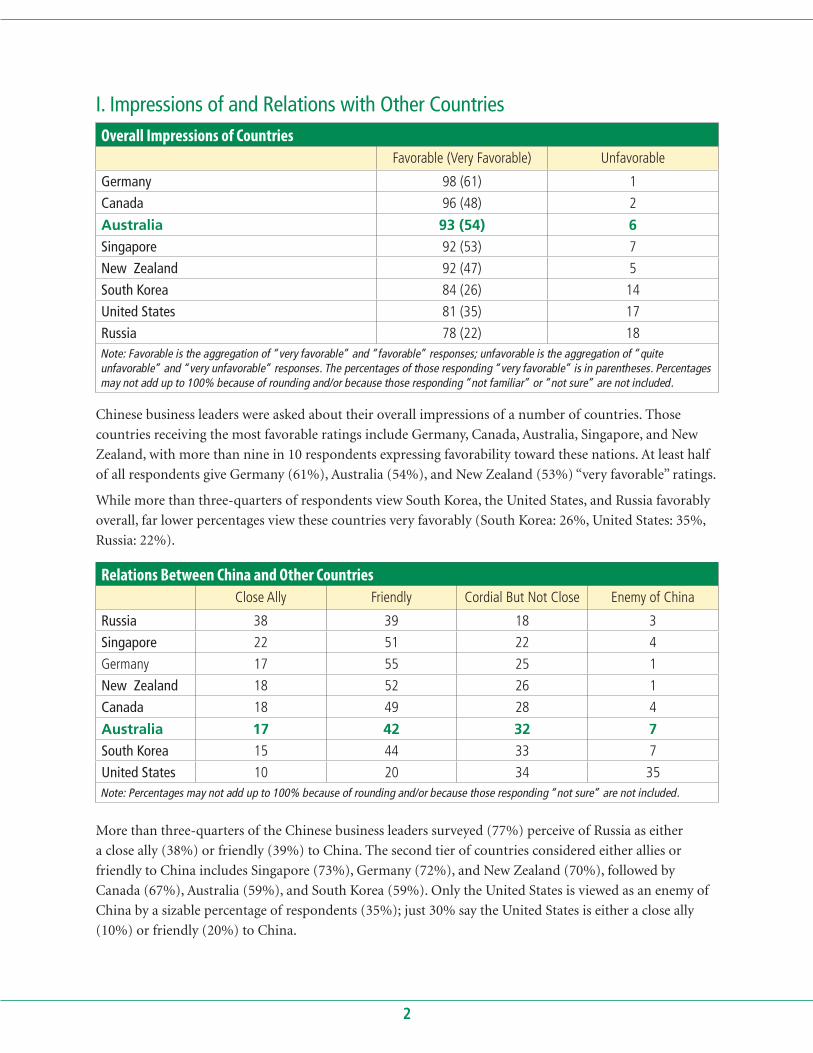
I. Impressions of and Relations with Other Countries Overall Impressions of Countries
Favorable (Very Favorable) Unfavorable
Germany 98 (61) 1
Canada 96 (48) 2
Australia 93 (54) 6
Singapore 92 (53) 7
New Zealand 92 (47) 5
South Korea 84 (26) 14
United States 81 (35) 17
Russia 78 (22) 18Note: Favorable is the aggregation of “very favorable” and “favorable” responses; unfavorable is the aggregation of “quite unfavorable” and “very unfavorable” responses. The percentages of those responding “very favorable” is in parentheses. Percentages may not add up to 100% because of rounding and/or because those responding “not familiar” or “not sure” are not included.
Chinese business leaders were asked about their overall impressions of a number of countries. Those
countries receiving the most favorable ratings include Germany, Canada, Australia, Singapore, and New
Zealand, with more than nine in 10 respondents expressing favorability toward these nations. At least half
of all respondents give Germany (61%), Australia (54%), and New Zealand (53%) “very favorable” ratings.
While more than three-quarters of respondents view South Korea, the United States, and Russia favorably
overall, far lower percentages view these countries very favorably (South Korea: 26%, United States: 35%,
Russia: 22%).
Relations Between China and Other CountriesClose Ally Friendly Cordial But Not Close Enemy of China
Russia 38 39 18 3
Singapore 22 51 22 4
Germany 17 55 25 1
New Zealand 18 52 26 1
Canada 18 49 28 4
Australia 17 42 32 7
South Korea 15 44 33 7
United States 10 20 34 35Note: Percentages may not add up to 100% because of rounding and/or because those responding “not sure” are not included.
More than three-quarters of the Chinese business leaders surveyed (77%) perceive of Russia as either
a close ally (38%) or friendly (39%) to China. The second tier of countries considered either allies or
friendly to China includes Singapore (73%), Germany (72%), and New Zealand (70%), followed by
Canada (67%), Australia (59%), and South Korea (59%). Only the United States is viewed as an enemy of
China by a sizable percentage of respondents (35%); just 30% say the United States is either a close ally
(10%) or friendly (20%) to China.
3
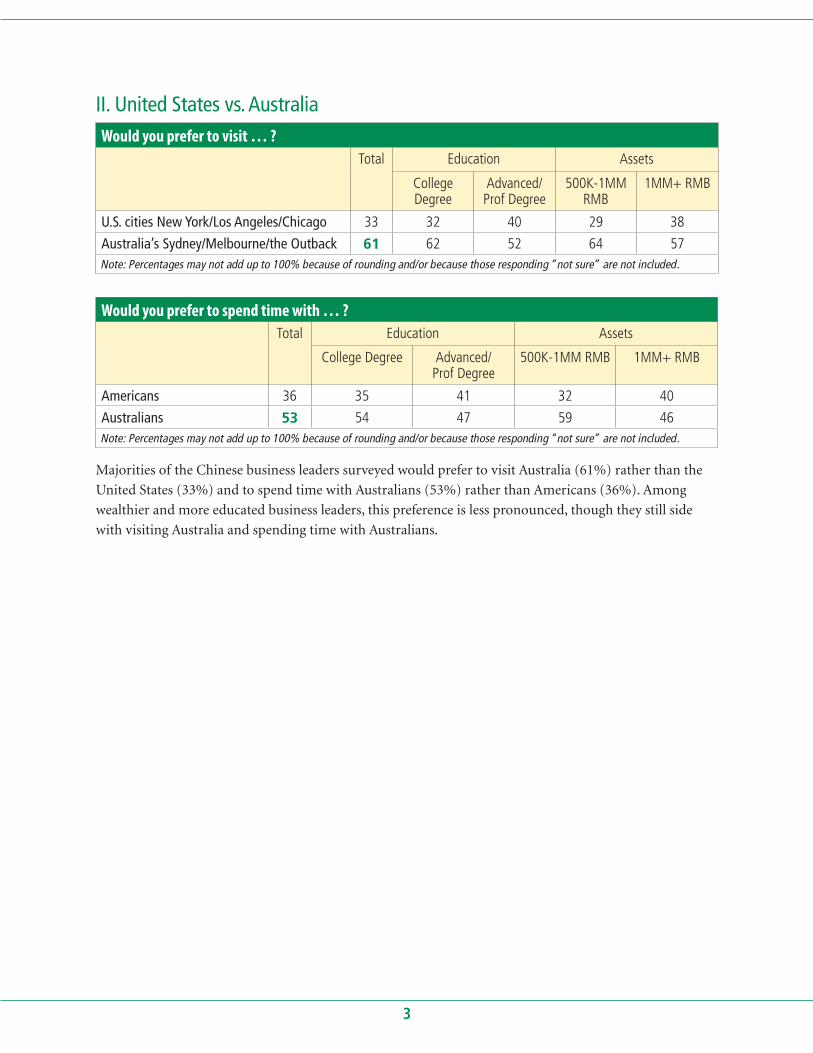
II. United States vs. AustraliaWould you prefer to visit … ?
Total Education Assets
College Degree
Advanced/Prof Degree
500K-1MM RMB
1MM+ RMB
U.S. cities New York/Los Angeles/Chicago 33 32 40 29 38
Australia’s Sydney/Melbourne/the Outback 61 62 52 64 57Note: Percentages may not add up to 100% because of rounding and/or because those responding “not sure” are not included.
Would you prefer to spend time with … ?Total Education Assets
College Degree Advanced/ Prof Degree
500K-1MM RMB 1MM+ RMB
Americans 36 35 41 32 40
Australians 53 54 47 59 46Note: Percentages may not add up to 100% because of rounding and/or because those responding “not sure” are not included.
Majorities of the Chinese business leaders surveyed would prefer to visit Australia (61%) rather than the
United States (33%) and to spend time with Australians (53%) rather than Americans (36%). Among
wealthier and more educated business leaders, this preference is less pronounced, though they still side
with visiting Australia and spending time with Australians.
4
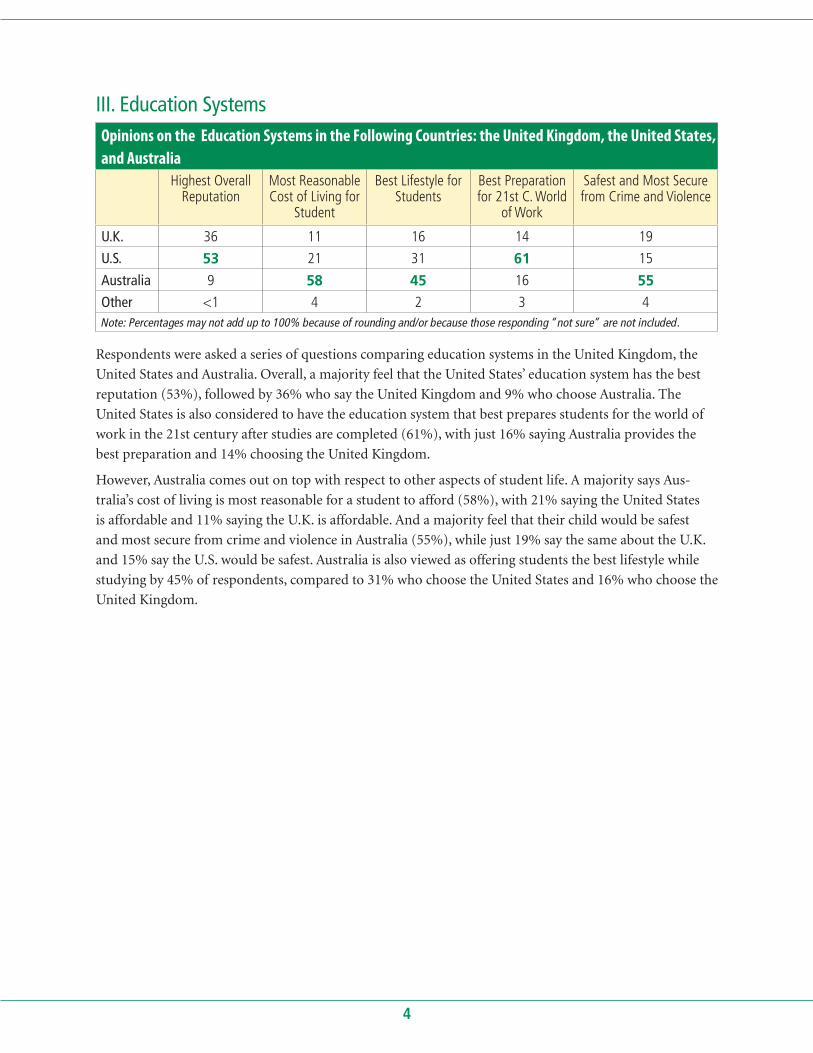
III. Education SystemsOpinions on the Education Systems in the Following Countries: the United Kingdom, the United States,and Australia
Highest Overall Reputation
Most Reasonable Cost of Living for
Student
Best Lifestyle for Students
Best Preparation for 21st C. World
of Work
Safest and Most Secure from Crime and Violence
U.K. 36 11 16 14 19
U.S. 53 21 31 61 15
Australia 9 58 45 16 55
Other <1 4 2 3 4Note: Percentages may not add up to 100% because of rounding and/or because those responding “not sure” are not included.
Respondents were asked a series of questions comparing education systems in the United Kingdom, the
United States and Australia. Overall, a majority feel that the United States’ education system has the best
reputation (53%), followed by 36% who say the United Kingdom and 9% who choose Australia. The
United States is also considered to have the education system that best prepares students for the world of
work in the 21st century after studies are completed (61%), with just 16% saying Australia provides the
best preparation and 14% choosing the United Kingdom.
However, Australia comes out on top with respect to other aspects of student life. A majority says Aus-
tralia’s cost of living is most reasonable for a student to afford (58%), with 21% saying the United States
is affordable and 11% saying the U.K. is affordable. And a majority feel that their child would be safest
and most secure from crime and violence in Australia (55%), while just 19% say the same about the U.K.
and 15% say the U.S. would be safest. Australia is also viewed as offering students the best lifestyle while
studying by 45% of respondents, compared to 31% who choose the United States and 16% who choose the
United Kingdom.
5
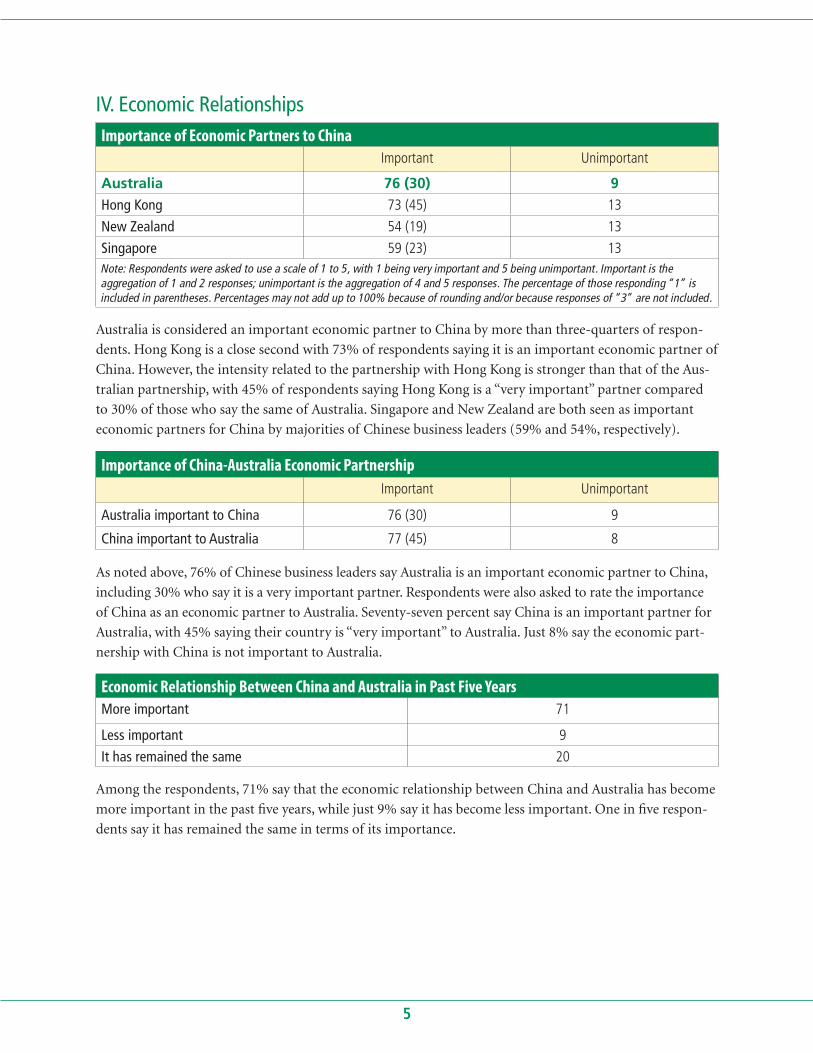
IV. Economic RelationshipsImportance of Economic Partners to China
Important Unimportant
Australia 76 (30) 9
Hong Kong 73 (45) 13
New Zealand 54 (19) 13
Singapore 59 (23) 13Note: Respondents were asked to use a scale of 1 to 5, with 1 being very important and 5 being unimportant. Important is the aggregation of 1 and 2 responses; unimportant is the aggregation of 4 and 5 responses. The percentage of those responding “1” is included in parentheses. Percentages may not add up to 100% because of rounding and/or because responses of “3” are not included.
Australia is considered an important economic partner to China by more than three-quarters of respon-
dents. Hong Kong is a close second with 73% of respondents saying it is an important economic partner of
China. However, the intensity related to the partnership with Hong Kong is stronger than that of the Aus-
tralian partnership, with 45% of respondents saying Hong Kong is a “very important” partner compared
to 30% of those who say the same of Australia. Singapore and New Zealand are both seen as important
economic partners for China by majorities of Chinese business leaders (59% and 54%, respectively).
Importance of China-Australia Economic PartnershipImportant Unimportant
Australia important to China 76 (30) 9
China important to Australia 77 (45) 8
As noted above, 76% of Chinese business leaders say Australia is an important economic partner to China,
including 30% who say it is a very important partner. Respondents were also asked to rate the importance
of China as an economic partner to Australia. Seventy-seven percent say China is an important partner for
Australia, with 45% saying their country is “very important” to Australia. Just 8% say the economic part-
nership with China is not important to Australia.
Economic Relationship Between China and Australia in Past Five YearsMore important 71
Less important 9
It has remained the same 20
Among the respondents, 71% say that the economic relationship between China and Australia has become
more important in the past five years, while just 9% say it has become less important. One in five respon-
dents say it has remained the same in terms of its importance.
6
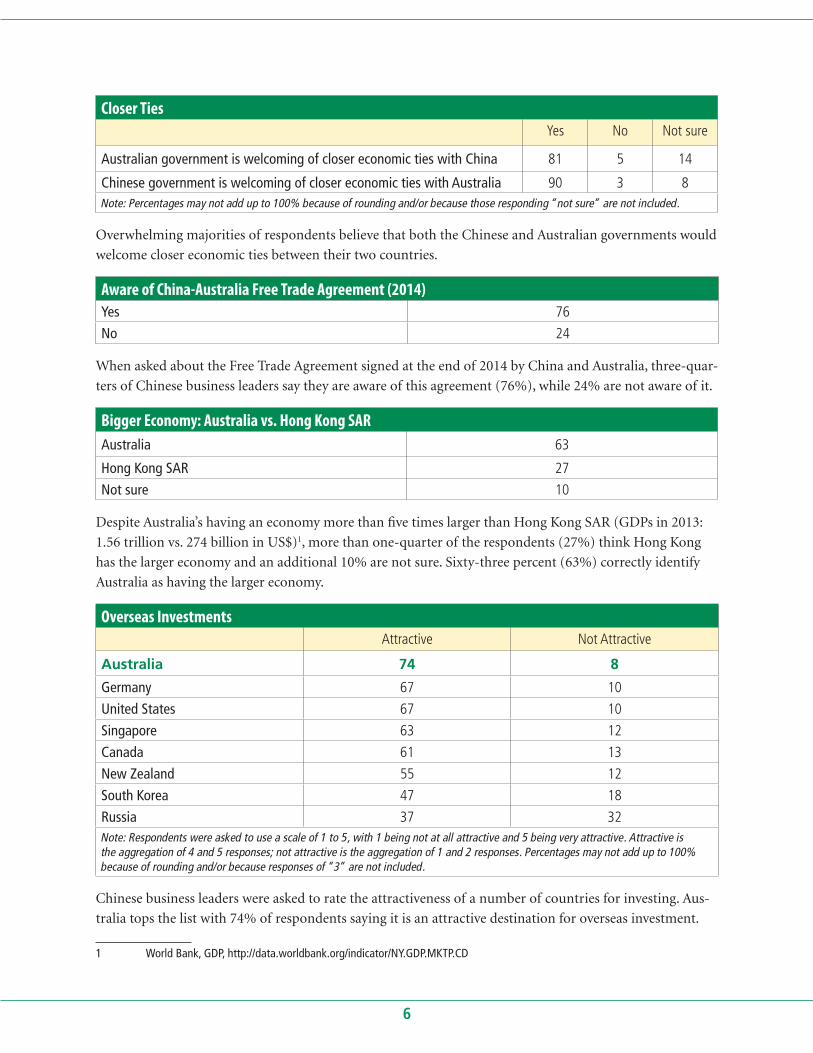
Closer TiesYes No Not sure
Australian government is welcoming of closer economic ties with China 81 5 14
Chinese government is welcoming of closer economic ties with Australia 90 3 8Note: Percentages may not add up to 100% because of rounding and/or because those responding “not sure” are not included.
Overwhelming majorities of respondents believe that both the Chinese and Australian governments would
welcome closer economic ties between their two countries.
Aware of China-Australia Free Trade Agreement (2014)Yes 76
No 24
When asked about the Free Trade Agreement signed at the end of 2014 by China and Australia, three-quar-
ters of Chinese business leaders say they are aware of this agreement (76%), while 24% are not aware of it.
Bigger Economy: Australia vs. Hong Kong SARAustralia 63
Hong Kong SAR 27
Not sure 10
Despite Australia’s having an economy more than five times larger than Hong Kong SAR (GDPs in 2013:
1.56 trillion vs. 274 billion in US$)1, more than one-quarter of the respondents (27%) think Hong Kong
has the larger economy and an additional 10% are not sure. Sixty-three percent (63%) correctly identify
Australia as having the larger economy.
Overseas InvestmentsAttractive Not Attractive
Australia 74 8
Germany 67 10
United States 67 10
Singapore 63 12
Canada 61 13
New Zealand 55 12
South Korea 47 18
Russia 37 32Note: Respondents were asked to use a scale of 1 to 5, with 1 being not at all attractive and 5 being very attractive. Attractive is the aggregation of 4 and 5 responses; not attractive is the aggregation of 1 and 2 responses. Percentages may not add up to 100% because of rounding and/or because responses of “3” are not included.
Chinese business leaders were asked to rate the attractiveness of a number of countries for investing. Aus-
tralia tops the list with 74% of respondents saying it is an attractive destination for overseas investment.
1 World Bank, GDP, http://data.worldbank.org/indicator/NY.GDP.MKTP.CD
7
Germany (67%), the United States (67%), Singapore (63%), Canada (61%), and New Zealand (55%) are
also seen as attractive for investment by majorities of respondents. South Korea (47%) and Russia (37%)
hold the least appeal for respondents in terms of investing their savings overseas; about one-third of Chi-
nese business leaders (32%) say Russia is not an attractive destination for investment.
8
V. Regional Political Relations
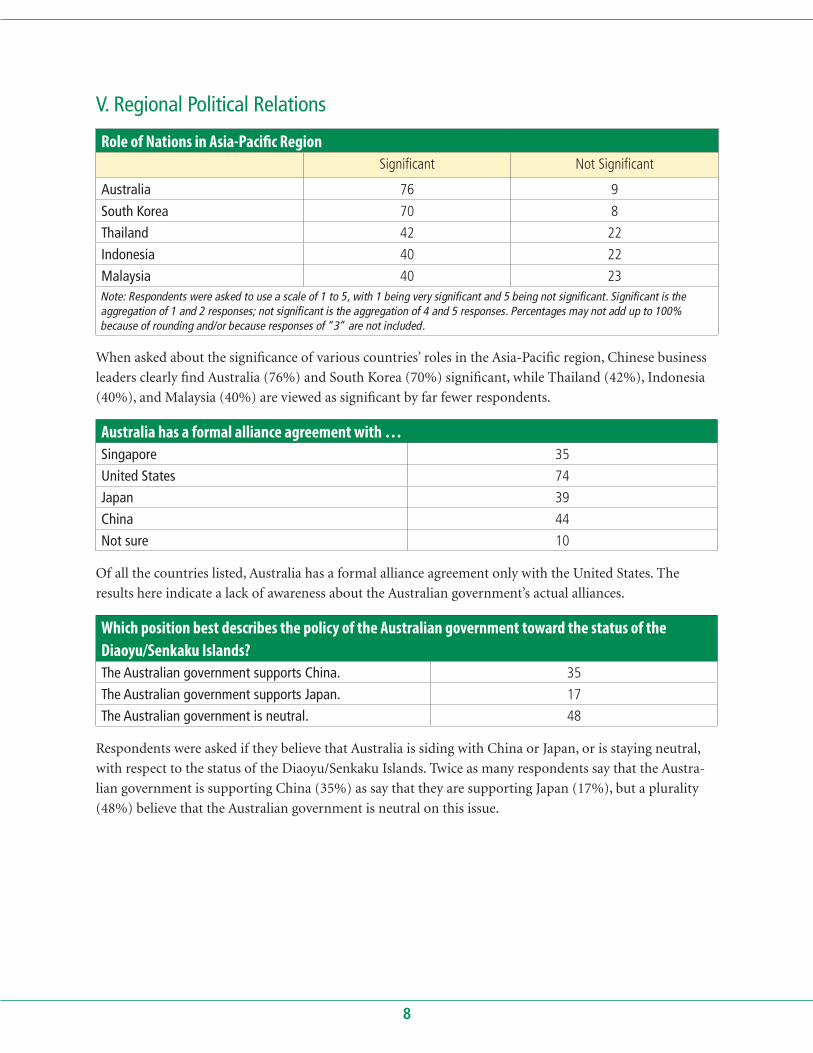
Role of Nations in Asia-Pacific RegionSignificant Not Significant
Australia 76 9
South Korea 70 8
Thailand 42 22
Indonesia 40 22
Malaysia 40 23Note: Respondents were asked to use a scale of 1 to 5, with 1 being very significant and 5 being not significant. Significant is the aggregation of 1 and 2 responses; not significant is the aggregation of 4 and 5 responses. Percentages may not add up to 100% because of rounding and/or because responses of “3” are not included.
When asked about the significance of various countries’ roles in the Asia-Pacific region, Chinese business
leaders clearly find Australia (76%) and South Korea (70%) significant, while Thailand (42%), Indonesia
(40%), and Malaysia (40%) are viewed as significant by far fewer respondents.
Australia has a formal alliance agreement with …Singapore 35
United States 74
Japan 39
China 44
Not sure 10
Of all the countries listed, Australia has a formal alliance agreement only with the United States. The
results here indicate a lack of awareness about the Australian government’s actual alliances.
Which position best describes the policy of the Australian government toward the status of the Diaoyu/Senkaku Islands?The Australian government supports China. 35
The Australian government supports Japan. 17
The Australian government is neutral. 48
Respondents were asked if they believe that Australia is siding with China or Japan, or is staying neutral,
with respect to the status of the Diaoyu/Senkaku Islands. Twice as many respondents say that the Austra-
lian government is supporting China (35%) as say that they are supporting Japan (17%), but a plurality
(48%) believe that the Australian government is neutral on this issue.
9
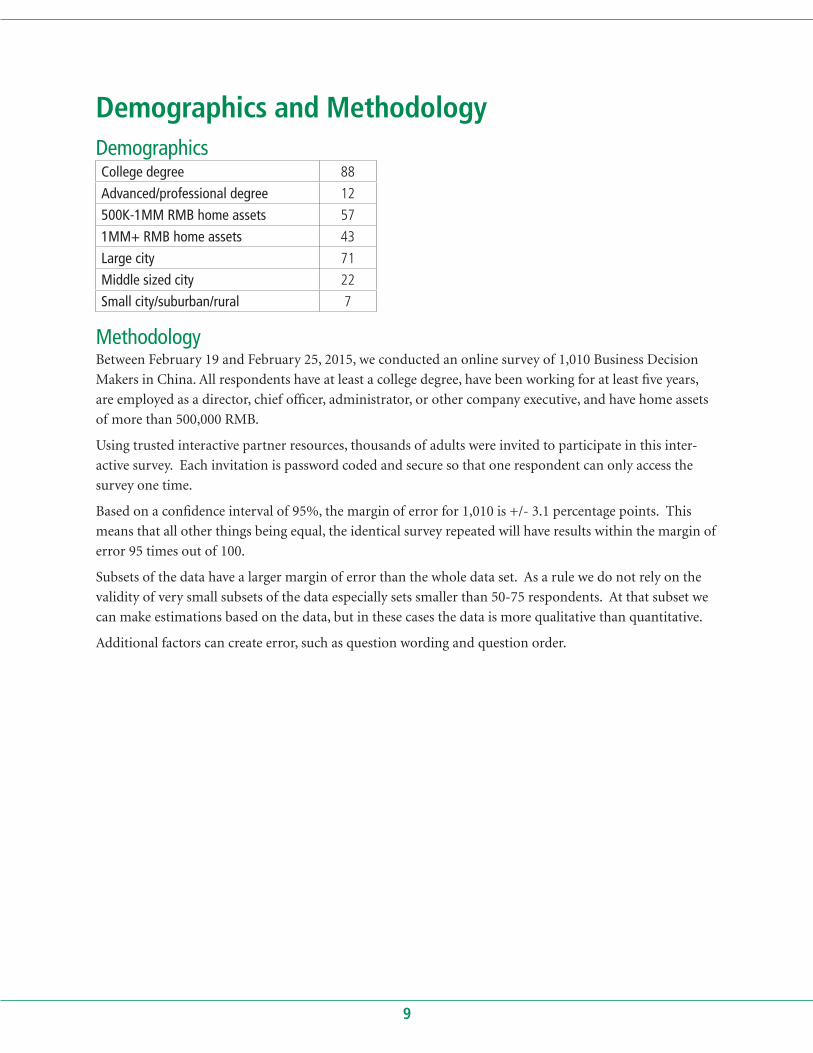
Demographics and MethodologyDemographicsCollege degree 88
Advanced/professional degree 12
500K-1MM RMB home assets 57
1MM+ RMB home assets 43
Large city 71
Middle sized city 22
Small city/suburban/rural 7
MethodologyBetween February 19 and February 25, 2015, we conducted an online survey of 1,010 Business Decision
Makers in China. All respondents have at least a college degree, have been working for at least five years,
are employed as a director, chief officer, administrator, or other company executive, and have home assets
of more than 500,000 RMB.
Using trusted interactive partner resources, thousands of adults were invited to participate in this inter-
active survey. Each invitation is password coded and secure so that one respondent can only access the
survey one time.
Based on a confidence interval of 95%, the margin of error for 1,010 is +/- 3.1 percentage points. This
means that all other things being equal, the identical survey repeated will have results within the margin of
error 95 times out of 100.
Subsets of the data have a larger margin of error than the whole data set. As a rule we do not rely on the
validity of very small subsets of the data especially sets smaller than 50-75 respondents. At that subset we
can make estimations based on the data, but in these cases the data is more qualitative than quantitative.
Additional factors can create error, such as question wording and question order.

research services, llc
www.zogbyresearchservices.com