A Project to Characterize The Effects of Transient Air Pollutants on the Health of African-Americans...
16
A Project to Characterize The Effects of Transient Air Pollutants on the Health of African-Americans in Atlanta, Georgia John H. Hall Morehouse College
-
Upload
maude-wilkinson -
Category
Documents
-
view
215 -
download
1
Transcript of A Project to Characterize The Effects of Transient Air Pollutants on the Health of African-Americans...

A Project to Characterize The Effects of Transient Air Pollutants on the Health of African-Americans in Atlanta, Georgia
John H. Hall
Morehouse College


Indoor Exposure and Health Effects
• Pulmonary and cardiovascular health
• Asthma
• Ischemic Heart Disease
1) To investigate the nature of transient pollutants in metro Atlanta and their concomitant effect on the health of African-Americans residing in the central city;
2) To provide, for the first time, a high time resolution and extended period speciated measurement of the spatial distribution of Atlanta fine aerosols (PM2.5, particulate matter with aerodynamic diameters less than 2.5 microns);
3) To develop the experimental expertise to identify differences in indoor and outdoor pollutant concentrations and factors that influence those differences;
The Objectives
4) To examine personal exposure to particulate and other pollutants in a homogeneous population, by identifying very short-term exposure excursions in cardiovascular-related morbidity and mortality using real-time measurements.
5) To examine the relationship between the effects of airborne pollutants on this homogeneous sample population and effects of airborne pollutants on the heterogeneous population at large.
6) To assess the impact of short-term changes in air pollution
levels on pulmonary and cardiovascular health.
The Objectives
Three Year Project
• In Year 1, we propose studying an African-American population district in central Atlanta.
• In Year 2, monitoring would be moved to an area in southeast Atlanta, also predominantly African-American, in conjunction with a detailed monitoring program to be undertaken at the South Atlanta Environmental Protection Division monitoring site.
• In Year 3, monitoring will be moved to a site in Tucker, Georgia, in east of Atlanta, an area with a predominance of non-minority residents. A similar air pollution monitoring program is in place in this area.

Instrumentation• Pulsed Infrared Laser Spectroscopy /Ion Chromatography
(PILS/IC, developed at GA Tech)
• Organic Carbon/Elemental Carbon analyzer (OC/EC)
• Tapered-Element Oscillating Microbalance (TEOM)
• Short-Time Resolution Ion Chromatography (IC)
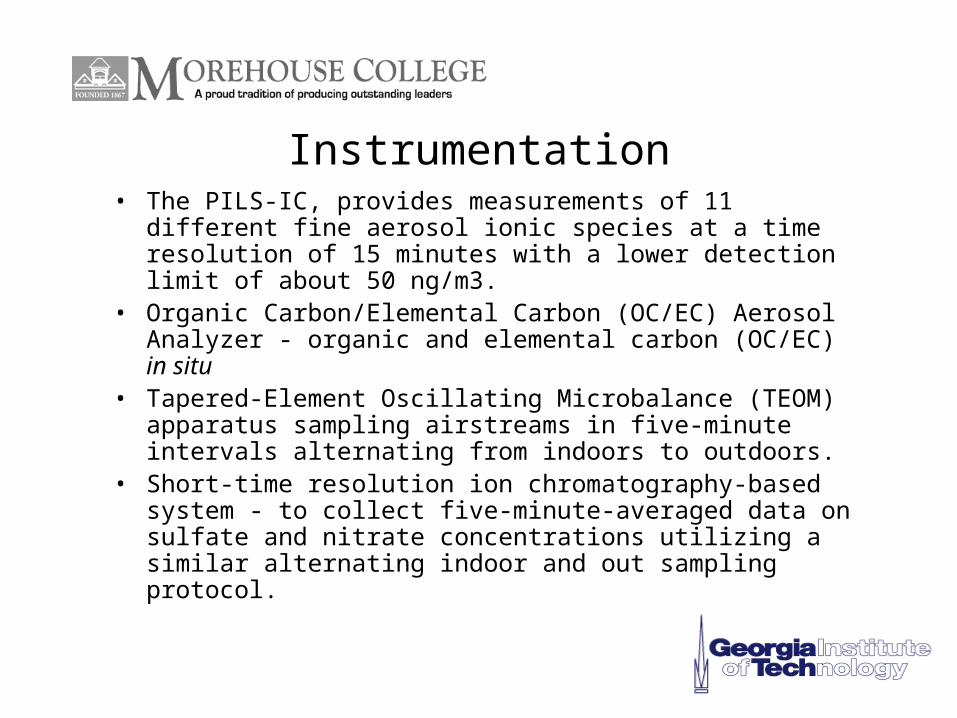
Instrumentation• The PILS-IC, provides measurements of 11 different fine
aerosol ionic species at a time resolution of 15 minutes with a lower detection limit of about 50 ng/m3.
• Organic Carbon/Elemental Carbon (OC/EC) Aerosol Analyzer - organic and elemental carbon (OC/EC) in situ
• Tapered-Element Oscillating Microbalance (TEOM) apparatus sampling airstreams in five-minute intervals alternating from indoors to outdoors.
• Short-time resolution ion chromatography-based system - to collect five-minute-averaged data on sulfate and nitrate concentrations utilizing a similar alternating indoor and out sampling protocol.

TEOM® 1 PM2.5 Dry Mass 1 hour
Sunset Labs OC/EC
1 Total organic (non – speciated) and elemental carbon
1 hour repeated
every 2 hours
Instrument Quantity Species Measured Sampling Rate
PILS/IC 1 Nitrate, sulfate, ammonium, chloride, sodium, calcium,
potassium, magnesium, light organic acids
15 minutes
Table 1: Instrumentation for a Ground-Based Outdoor Continuous Aerosol Speciation Monitoring Site

70
60
50
40
30
20
10
Fin
e A
ero
sol M
ass
, µg
m-3
8/5/99 8/9/99 8/13/99 8/17/99 8/21/99 8/25/99 8/29/99
Eastern Standard Time
PM2.5 OC x 1.4 + EC + Sulfate + Ammonium
-80
-40
0
40
Diff
ere
nce
, %
Figure 1. Mass balance of fine aerosol in Atlanta. Dry PM2.5 (preheated to 50°C) is compared to the sum of the OC x 1.4, EC, sulfate, and ammonium. The top plot shows the percent difference between this sum and the measured total mass. The agreement between these independent measurements attests to the accuracy of the various speciated measurements.
70
60
50
40
30
20
10Fin
e A
ero
sol M
ass
, µg
m-3
8/5/99 8/9/99 8/13/99 8/17/99 8/21/99 8/25/99 8/29/99
Eastern Standard Time
1s2s 3s 4s
1c2c
4c
3c
A
B
C
Dry PM2.5 Mass Sulfate Elemental CarbonOrganic Carbon x 1.4
70
60
50
40
30
20
10
0
Fin
e A
ero
sol M
ass
, µg
m-3
8/5/99 8/9/99 8/13/99 8/17/99 8/21/99 8/25/99 8/29/99
Dry PM2.5 Mass Sulfate Total Organic Carbon Elemental Carbon
a.
b.
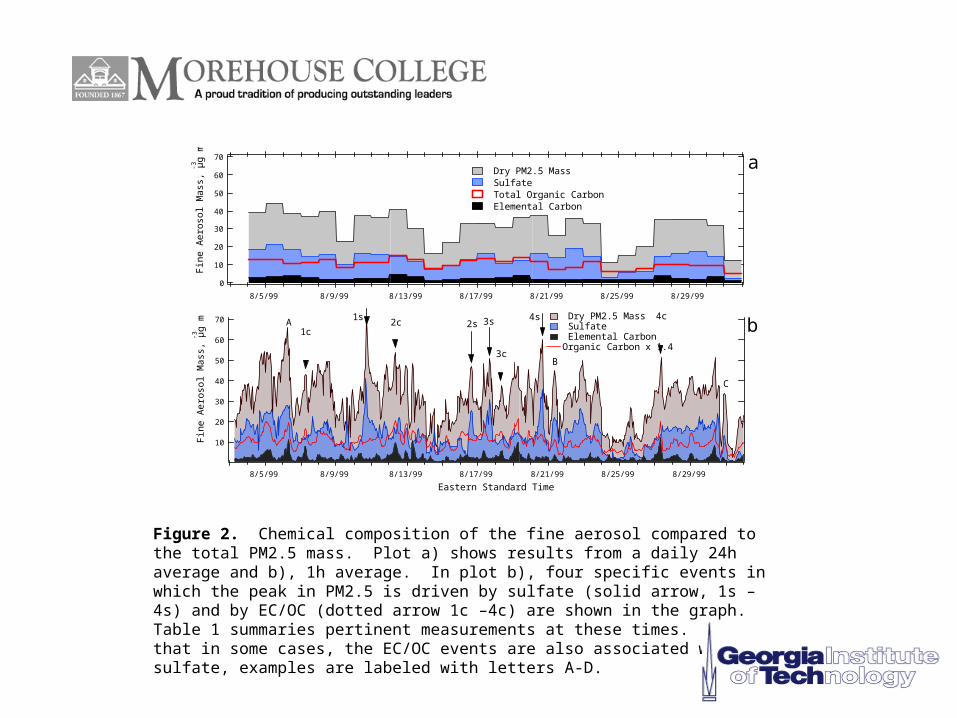
Figure 2. Chemical composition of the fine aerosol compared to the total PM2.5 mass. Plot a) shows results from a daily 24h average and b), 1h average. In plot b), four specific events in which the peak in PM2.5 is driven by sulfate (solid arrow, 1s – 4s) and by EC/OC (dotted arrow 1c –4c) are shown in the graph. Table 1 summaries pertinent measurements at these times. Note that in some cases, the EC/OC events are also associated with sulfate, examples are labeled with letters A-D.

Label
Day of Aug. 99
Hour at
Peak EST
PM2.5 µg m-3
SO4=
µg m-
3
NO3-
µg m-
3
NH4+
µg m-3 OC µgC m-3
EC µgC m-3
SO4=/P
M TC/PM#
1c 7 6:30 43.1 11.8 0.9 11.8 7.8 0.27 0.56 2c 12 8:30 53.9 14.3 1.3 4.0 15.0 10.9 0.27 0.59 3c 18 7:30 37.8 11.4 0.6 3.0 10.7 5.5 0.30 0.54 4c 27 7:30 48.6 14.2 1.9 4.8 12.2 9.4 0.29 0.54
1s* 10 17:00 60.2 37.7 0.2 6.8 8.1 2.1 0.63 0.22 2s 16 15.:30 46.8 25.6 0.6 5.1 8.3 2.5 0.55 0.30 3s 17 15:30 50.8 30.8 0.3 4.0 7.6 2.0 0.61 0.25 4s 20 15:30 60.1 35.8 0.4 5.2 9.9 3.1 0.60 0.28
A 6 6:30 65.7 27.6 0.9 NA 12.2 8.7 0.42 0.39 B 21 7:30 45.0 21.9 3.1 7.9 8.1 3.9 0.49 0.34 C 30 22:30 33.8 13.6 0.2 4.0 7.1 1.7 0.40 0.34
Table 2: Time, Total Aerosol Fine Mass, And Concentration Of Aerosol Species During Episodes Identified In Figure 2.
# TC/PM is the total carbon (OC x 1.4 + EC) divided by fine aerosol mass (PM2.5)
* Since the sulfate peaked 1 hour prior to the PM2.5 in this case, the average over 2 hours is given here. At 16:30 the sulfate peak was 41.2 µg m-3 and the PM2.5 49.8 µg m-3, in the following hour, 17:30, the sulfate was 34.2 µg m-3 and PM2.5 70.7 µg m-3.

Health Study with Human Subjects
The pollutants monitored will be:
1) PM 2.5- 24 hour integrated sample, pump and filter
2) Ozone- Ogawa Type Badge, Analysis by Ion Chromatography
3) SO2- Ogawa Type Badge, Analysis by Ion Chromatography
4) NO2- Ogawa Type Badge, Analysis by Ion Chromatography
5) EC/OC- 24 Integrated Samples. Analyzed by reflectance and thermal distillation

Conclusions
• This is a reasonable method to obtain new information regarding pollutants and health effects.
• The concentrations of pollutants vary greatly during the day.
• Real time monitoring will provide valuable information regarding the effects of pollution on individual health at various times of the day, and
• Study will provide valuable information on how to decrease the risk of health injury due to pollutants for all people, in all areas of the city.