
A Project Report on “PROS & CONS OF INVESTMENT IN...
43
University of Mumbai A Project Report on “PROS & CONS OF INVESTMENT IN MUTUAL FUNDS AS COMPARED TO BANK FIXED DEPOSITES”. Submitted by NAME ROLL NO Prashantha Poojary F.Y.MMS MS141546 Sonali Salve F.Y.MMS MS141549 Chanchal Sharma F.Y.MMS MS141552 Deepak Shinde F.Y.MMS MS141554 Pooja Singh F.Y.MMS MS141559 Under the guidance of Prof. Shripad Bapat Batch 2014 – 2016 INSTITUTE OF MANAGEMENT & COMPUTER STUDIES C-4, WAGLE ESTATE, NEAR MULUND CHECK NAKA,THANE(w) – 400604. 1
Transcript of A Project Report on “PROS & CONS OF INVESTMENT IN...

University of Mumbai
A Project Report on
“PROS & CONS OF INVESTMENT IN MUTUAL FUNDS ASCOMPARED TO BANK FIXED DEPOSITES”.
Submitted by
NAME ROLL NO
Prashantha Poojary F.Y.MMS MS141546
Sonali Salve F.Y.MMS MS141549
Chanchal Sharma F.Y.MMS MS141552
Deepak Shinde F.Y.MMS MS141554
Pooja Singh F.Y.MMS
MS141559
Under the guidance of Prof. Shripad Bapat
Batch 2014 – 2016
INSTITUTE OF MANAGEMENT & COMPUTER STUDIES C-4, WAGLE ESTATE, NEAR MULUND CHECK NAKA,THANE(w) – 400604.
1

CERTIFICATE
Certified that the Project work entitled “TO DO COMPARATIVE ANALYSISIN MUTUAL
FUND INVESTMENT AS AGAINST BANK FIXED DEPOSIT.” Submitted by
Group no.03 (finance) having Roll nos. 46, 49,52,54 & 59 for internal
assessment of MMS 1st YEAR course for Semester IInd offered by
IMCOST, Thane affiliated to Mumbai University during the academic
year 2014 – 2016 is a original work carried out by the students under
my supervision, and this work has not formed the basis for the award
of any Degree, Diploma or such other titles.
Date:
Name of Guide: Prof. Mr. Shripad Bapat
Institution Address:
IMCOST, C-4, Near Mulund Check Naka,
Opp. APLAB Co, Thane (W) – 400604.
2
DECLARATION We, the undersigned, hereby declare that the project report entitled “TO DO
COMPARATIVE ANALYSIS IN MUTUAL FUND INVESTMENT AS AGAINSTBANK FIXED
DEPOSIT.” Submitted by us to the institute under the guidance of Prof. Shripad Bapat
is our original work and the conclusions drawn therein are based on the material collected
by ourselves.
The Report submitted is our own work and has not been duplicated from any other source.
We shall be responsible for any unpleasant moment/situation.
Place: Mumbai
Date: Signature of the Group Members
Name: Prashantha Poojary
Roll No. MS141546
Name: Sonali Salve
Roll No.MS141549
Name: Chanchal Sharma
Roll No.MS141552
Name: Deepak Shinde
Roll No.MS141554
Name: Pooja Singh
3

Roll No.MS141559
ACKNOWLEDGEMENT
A successful Project is the result of team work and co-ordination that
includes not only the group of developers who put forth the ideas, logic
and efforts but also those who guide them. So, at the completion of the
project, we feel obliged to extent our gratitude towards all those who
made valuable contributions throughout our various stages in Project
draft period.
We express our profound sense of gratitude and sincere thanks to our
Director, Dr.J.N.SHAH for enabling us to undertake such an excellent
project, which made us to acquire tremendous knowledge and self-
confidence.
We extend our special thanks to Prof. Shripad Bapat, (Project Guide)
who gave us a wonderful opportunity to select and work on this topic
and understand the challenges which we face in our career path while
dealing with people and the complexities of the job and for his valuable
guidance and inputs which helped us to select and focus our work on
this project.
We would also like to thank all teaching and non-teaching staff of
IMCOST, for their valuable guidance and inputs which helped us to
select and focus our work on this project.
Also we would like to thanks to our entire professor who are not directly
supported for the project but indirectly made support on the way of
improvement in presentation skills, deep knowledge sharing against
4

today’s business environment as well as competitive world and current
updates.
We are very much thankful our parents and friends for their continuoussupport.
INDEX
SR NO. TABLE OF CONTENTS PAGE NO.
1. CHAPTER I – INTRODUCTION (BANK FIXEDDEPOSIT)
1
2. CHAPTER II – INTRODUCTION (MUTUAL FUND)
6
3. CHAPTER III- RESEARCH METHODOLOGY 15 4. CHAPTER IV – CONCLUSION &
RECOMMENDATION 32
5. BIBLIOGRAPHY 34 6. ANNEXURES
5

LIST OF TABLES
TABLE NO. TITLE OF THE TABLES PAGE NO.
2.1 TYPES OF MUTUAL FUNDS 8 2.2 MUTUAL FUND VS BANK FIXED DEPOSIT 14 2.3 TOP 10 MUTUAL FUNDS 14 3.1 INVESTORS THINK RISKEST INVESTMENT
PRODUCT 18
3.2 AGE GROUP 22 3.3 KIND OF INVESTMENT 23 3.4 INVESTMENT OPTION 24 3.5 REASON OF INVESTMENT 25 3.6 FACTORS CONSIDERED FOR INVESTMENT 26 3.7 MORE RISKY 27 3.8 KONWLEDGE OF SCHEME 28 3.9 BENEFECIAL SECTOR FOR INVESTORS 29
3.10 INVESTMENT TYPE 30 3.11 INVESTMENT OPTION RECOMMEND 31
6
EXECUTIVE SUMMARY
A growing India offers opportunity across the various investments, a
substantial part of financial wealth. Therefore investment plays an
important role in growth of these economies. Also there is rapid growth
in income of peoples in India due to some factors because of this
investment is increased day by day in various investment options. As
income range rapidly increasing there is need to increase awareness
among the people related with various investment option and different
schemes.
The project is an attempt to study or awareness among the people
related with some investment option and also the preference of people
while implementing the same. It provides thorough knowledge of
different aspects related with the behavior of people for mutual fund as
compare to bank fixed deposit. The report is divided in four parts. The
first part is dealing with information related with advantage and
disadvantage Bank fixed deposit. Second is concept of advantage and
disadvantage mutual fund. Third is concept of research methodology.
Fourth deals with interpretation of data collected.
Most of metro cities people like to put the money in market related
schemes instead of dumping it in the bank lockers, so it is quite
obvious that they want to invest their money in profitable venture. But
7

still people prefer to go for traditional schemes as well for safety and
security purpose.
Now a day’s people become more sensible while choosing any type of
investment. It is more important to have good knowledge and
understanding related with such scheme which will help to choose
better and safety investment tools.
CHAPTER I
INTRODUCTION
1.1 BANK FIXED DEPOSIT:
A fixed deposit is a financial instrument provided by banks whichprovides investors with a higher rate of interest than a regularsaving account, until the date of maturity date. It may or may notrequire the creation of a separate account.
It is also term as TERM OR TIME Deposit. They are considered tobe very safe investment as it denotes a larger class ofinvestments with varying levels of liquidity. Here, interest ratevaries between from 4 to 11 percent. The tenure of a FixedDeposit a vary from 7, 15, or 45 days to 1.5 years and can be highas 10 years.
8

1.2 TYPES OF FIXED DEPOSIT :
BASICALLY THERE ARE TWO TYPES OF DEPOSIT:
A. DEMAND DEPOSIT: - The money we keep in our saving accountsis like a medium of exchange and this is called Demand Deposit.There is no fixed term to maturity for demand deposits.
B. TIME DEPOSIT:- If we deposit our money has an FD in the bank itbecomes a Time Deposit on which No cheque is drawn. They arepaid on maturity at a particular time.
a. FIXED DEPOSIT:- A fixed rate of interest is paid at fixed, regularintervals.
b. RECURRING DEPOSIT:- Fixed amount is deposited at regular
intervals for a fixed term and the repayment of principal andaccumulated interest is made at the end of the term.
9

1.3 ADVANTAGES OF BANK FIXED DEPOSIT:
A. SAFETY :- The fixed deposits of reputed banks and financialinstitution regulated by RBI the banking regulator in India arevery secure and considered as one of the safest investmentmethods.
B. REGULAR INCOME:- Fixed deposit earn fixed interest rates fortheir entire tenure, which is usually compounded quarterly. So,those who want an income on a regular basis can invest intofixed deposit and use the interest rate as their income. Thismakes a fixed deposit very popular way of investing money forretirees.
C. LIQUIDITY:- Bank deposits have good liquidity. They can be
closed and the principal withdrawn within a few hours in somebanks to a couple of days in others.
The other option is to take a loan on the fixed deposit. Bankslend up to 90% of the principal of the deposit. Interestcharged for this is only about 1 to 2 per cent and only for theperiod that we have used the cash (The feature works like anover-draft against the fixed deposit).
10

1.4 DISADVANTAGES OF BANK FIXED DEPOSIT:
A. CAPITAL APPRECIATION:- Capital appreciation doesnot
apply to bank fixed deposits. Only the principal invested isreturned back at the time of maturity.
B. TAX TREATMENT:- Bank fixed deposits are not taxefficient.
The interest is taxed. Also there is no benefit from makingthe investment. There are the 5-year bank deposits (taxsaving) that give benefit under section 80C of the IncomeTax Act. But the benefits such as partial withdrawal orclosure, and loan facility are not available. The deposit ratesare also lower compared to the normal fixed deposits. Thiseffectively negates the tax saved.
C.RISK:- Perhaps the main reason for investment in bankdeposits is safety of the principal. The capital (only up to
Rs1,00,000 though) has the highest safety compared to anyother investment as it is guaranteed by the Deposit
Insurance & Credit Guarantee Scheme of India. All banksoperating in India are covered under this scheme.
11

1.5 IN SHORT
The risk faced when investing in bank deposits is the interestrate risk. This is associated with the lost opportunity to investin an instrument that has a higher return. Getting out of afixed deposit can be costly (up to 1 per cent of the principal),when we exit prematurely. So we may have to forgo potentialearnings when the interest rate has risen only by about 1 percent.
The highest risk faced with fixed deposits is the effect ofinflation. The real return after adjusting for inflation is veryless or sometimes negative for fixed deposits of banks. This isa big burden, particularly for retired people, who haveinvested their retirement proceeds to get regular income.Their income may be regular and steady but the money'sworth keeps going down during the tenure of the fixeddeposit.
The bank deposit primarily serves us to preserve capital.Banks now-a-days have added a lot of additional benefits tothe traditionally benign service. Retired people could makethe best use of this avenue for securing a fixed and steadyincome.
The caution is not to use the fixed deposit as a long terminvestment avenue. The reason is that the real return is veryless when adjusted for inflation. The tax treatment of theinterest also eats into the returns.
12

CHAPTER II
INTRODUCTION
2.1 MUTUAL FUND
The first introduction of a mutual fund in India occurred in 1961,when the Government of India launched Unit Trust of India (UTI).Until 1987, UTI enjoyed a monopoly in the Indian mutual fundmarket. Then a host of other government-controlled Indianfinancial companies came up with their own funds. These includedState Bank of India, Canara Bank, and Punjab National Bank. Thismarket was made open to private players in 1993.
As a result of the historic constitutional amendments broughtforward by the then Congress-led government under the existingregime of Liberalization, Privatization and Globalization (LPG). Thefirst private sector fund to operate in India was Kothari Pioneer,which later merged with Franklin Templeton.
An investment vehicle that is made up of a pool of funds collectedfrom many investors for the purpose of investing in securitiessuch as stocks, bonds, money market instruments and similarassets. Mutual funds are operated by money managers, whoinvest the fund's capital and attempt to produce capital gains andincome for the fund's investors. A mutual fund's portfolio isstructured and maintained to match the investment objectives.
One of the main advantages of mutual funds is that they givesmall investors access to professionally managed, diversifiedportfolios of equities, bonds and other securities, which would bequite difficult (if not impossible) to create with a small amount ofcapital. Each shareholder participates proportionally in the gain or
13

loss of the fund. Mutual fund units, or shares, are issued and cantypically be purchased or redeemed as needed at the fund'scurrent net asset value (NAV) per share, which is sometimesexpressed as NAVPS.
2.2 NET ASSET VALUE – NAV
A mutual fund's price per units, the per- units Rupee amount ofthe fund is calculated by dividing the total value of all thesecurities in its portfolio, less any liabilities, by the number of fundunits outstanding.
In the context of mutual funds, NAV per units is computed once aday based on the closing market prices of the securities in thefund’s portfolio. All mutual funds buy and sell orders areprocessed at the NAV of the trade date.
14

2.3 TYPES AND KINDS OF MUTUAL FUNDS
FIG 2.1 TYPES OF MUTUAL FUNDS
1. OPEN-ENDED:- This scheme allows investors to buy or sell unitsat any point in time. This does not have a fixed maturity date.
A. DEBT/ INCOME :- A major part of the investable fund ischannelized towards debentures, government securities, andother debt instruments. Although capital appreciation is low(compared to the equity mutual funds), this is a relatively
15

low risk-low return investment avenue which is ideal forinvestors seeing a steady income.
B. MONEY MARKET/ LIQUID:- This is ideal for investors lookingto utilize their surplus funds in short term instruments whileawaiting better options. These schemes invest in short-termdebt instruments and seek to provide reasonable returns forthe investors.
C. EQUITY/ GROWTH:- Equities are a popular mutual fundcategory amongst retail investors. Although it could be ahigh-risk investment in the short term, investors can expectcapital appreciation in the long run.
a. Index Scheme:- Index schemes are a widely popularconcept in the west. These follow a passive investmentstrategy where our investments replicate themovements of benchmark indices like Nifty, Sensex,etc.
b. Sectoral Scheme:- Sectoral funds are invested in a specificsector like infrastructure, IT, pharmaceuticals, etc. orsegments of the capital market like large caps, mid-caps, etc. This scheme provides a relatively high risk-high return opportunity within the equity space.
c. Tax Saving:- As the name suggests, this scheme offers taxbenefits to its investors. The funds are invested inequities thereby offering long-term growthopportunities. Tax saving mutual funds (called EquityLinked Savings Schemes) has a 3-year lock-in period.
D. BALANCED:- This scheme allows investors to enjoy growthand income at regular intervals. Funds are invested in both
16

equities and fixed income securities; the proportion is pre-determined and disclosed in the scheme related offerdocument. These are ideal for the cautiously aggressiveinvestors
2. CLOSED-ENDED:- In India, this type of scheme has a stipulated
maturity period and investors can invest only during the initiallaunch period known as the NFO (New Fund Offer) period.
A. CAPITAL PROTECTION:- The primary objective of thisscheme is to safeguard the principal amount while trying todeliver reasonable returns. These invest in high-quality fixedincome securities with marginal exposure to equities andmature along with the maturity period of the scheme.
B. FIXED MATURITY PLANS (FMPS ):- Mutual fund schemeswith a defined maturity period. These schemes normallycomprise of debt instruments which mature in line with thematurity of the scheme, thereby earning through the interestcomponent (also called coupons) of the securities in theportfolio. FMPs are normally passively managed, i.e. there isno active trading of debt instruments in the portfolio. Theexpenses which are charged to the scheme are hence,generally lower than actively managed schemes.
17

3. INTERVAL:- Operating as a combination of open and closedended schemes, it allows investors to trade units at pre-definedintervals.
2.4 ADVANTAGES OF MUTUAL FUNDS
Mutual funds have been a popular investment vehicle for investors. Their simplicity along with other attributes provides great benefit to investors with limited knowledge, time or money. To help us decide whether mutual funds are best for us, we are going to look at some reasons to consider investing in mutual funds.
A. DIVERSIFICATION:- One rule of investing, for both largeand small investors, is asset diversification. Diversificationinvolves the mixing of investments within a portfolio and is
18

used to manage risk. Mutual fund provides immediatebenefit of instant diversification and asset allocation withoutthe large amounts of cash needed to create individualportfolios.
B. ADVANCED PORTFOLIO MANAGEMENT:- We pay amanagement fee as part of our expense ratio, which is usedto hire a professional portfolio manager who buys and sellsstocks, bonds, etc. This is a relatively small price to pay forhelp in the management of an investment portfolio.
C. CONVENIENCE AND FAIR PRICING:- Mutual funds arecommon and easy to buy. They typically have low minimuminvestments and they are traded only once per day at theclosing NET ASSET VALUE (NAV). This eliminates pricefluctuation throughout the day and various arbitrageopportunities that day traders practice.
D.LIQUIDITY AND SIMPLICITY:- We can sell or buy mutual
funds anytime. So mutual funds are good if we want toinvest in something which we can liquidate easily. Alsomutual funds are very simple to buy and sell.
E. DIVIDEND REINVESTMENT:- As dividends and otherinterest income is declared for the fund, it can be used topurchase additional units in the mutual fund, thus helpingyour investment grow.
19

2.5 DISADVANTAGES OF MUTUAL FUNDS
There are risks involved in buying mutual funds. These investmentvehicles can experience market fluctuations and sometimes providereturns below the overall market. Also, the advantages gained frommutual funds are not free: many of them carry loads, annual expensefees and penalties for early withdrawal.
A. RISKS AND COSTS:- Changing market conditions can createfluctuations in the value of a mutual fund investment. Alsothere are fees and expenses associated with investing in
20

mutual funds that do not usually occur when purchasingindividual securities directly.
B. NO GUARANTEES:- As Mutual funds invest in debt as wellequities, there are no sure returns. Returns depend on themarket conditions.
C. NO CONTROL:- Investor does not have control oninvestment; all the decisions are taken by the fund manager.Investor can just join or leave the show.
D.TAX INEFFICIENCY:- Investors do not have a choice whenit comes to capital gain payouts in mutual funds. Due to theturnover, redemptions, gains and losses in security holdingsthroughout the year, investors typically receive distributionsfrom the fund that are an uncontrollable tax event.
2.6 COMPARISON BETWEEN MUTUAL FUNDS AND FIXED DEPOSITS FIG 2.2 MUTUAL FUND VS BANK FIXED DEPOSIT
PARAMETERS MUTUAL FUNDS FIXED DEPOSITS
A. Rate Of Returns No Assured Returns Fixed Returns
B. Inflation Adjusted Returns
Potential For High InflationAdjusted Returns
Usually Low InflationAdjusted Returns
C. Risk Medium To High Risk Low Risk
D. Liquidity Liquid Medium To Low Liquidity
E. Premature Withdrawal Allowed With Exit Load Allowed With Penalty
F. Cost Of Investment Management Cost No Cost
G. Tax Status Favorable Tax Status As Per Tax Slab
21

TOP 10 MUTUAL FUNDS HOUSE
FIG 2.3 TOP 10 MUTUAL FUNDS Sr No Mutual Fund Average %
1 HDFC Mutual Fund 1,034.42 12.70% 2 Reliance Mutual Fund 952.28 11.69% 3 ICICI Prudential Mutual Fund 853.03 10.48%
4 Birla Sun Life Mutual Fund 773.44 9.50%
5 UTI Mutual Fund 700.57 8.60% 6 SBI Mutual Fund 595.58 7.31% 7 Franklin Templeton Mutual
Fund 448.12 5.50%
8 IDFC Mutual Fund 396.65 4.87% 9 Kotak Mahindra Mutual Fund 352.99 4.34%
10 DSP BlackRock Mutual Fund 304.86 3.74%
CHAPTER III:
RESEARCH METHODOLOGY
Research refers to search for knowledge. One can also define researchas a scientific and systematic search for pertinent information on aspecific topic. It is an art of scientific investigation.
3.1 OBJECTIVES:
The study will give an overview about mutual funds and bankfixed deposit. And also will give brief comparison between mutualfund and bank fixed deposit. It will help investors to take effectiveinvestment decision.
22
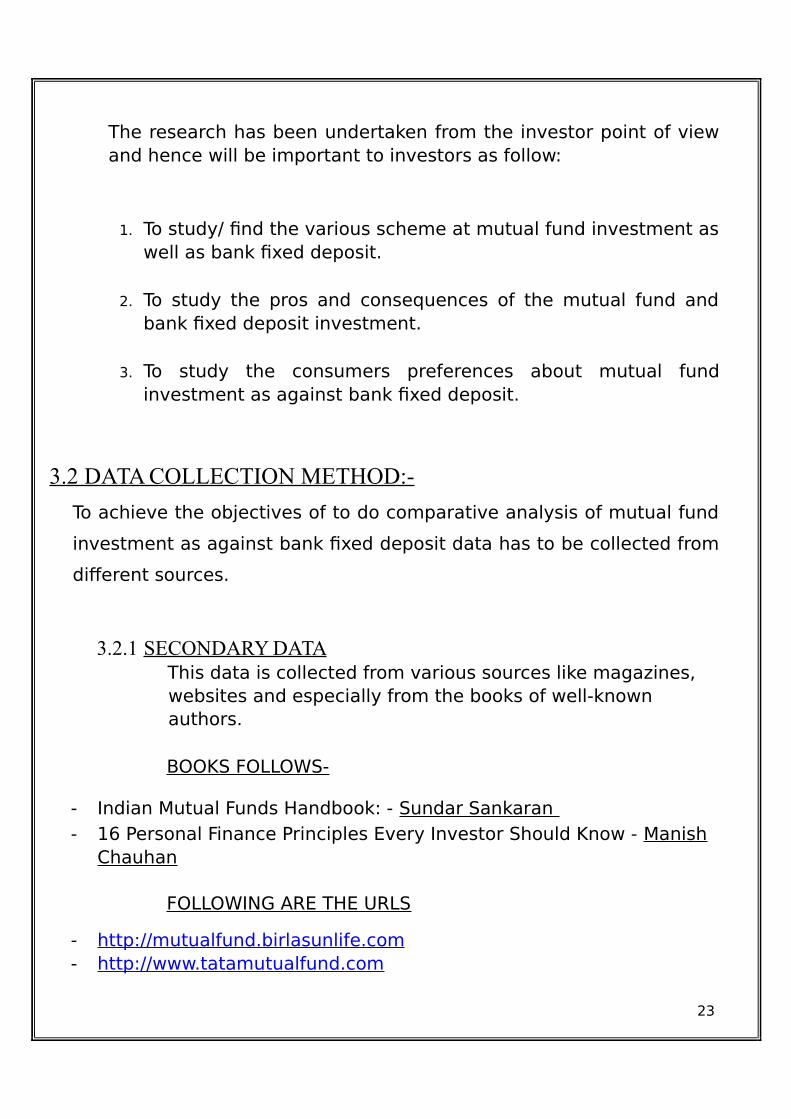
The research has been undertaken from the investor point of viewand hence will be important to investors as follow:
1. To study/ find the various scheme at mutual fund investment aswell as bank fixed deposit.
2. To study the pros and consequences of the mutual fund and
bank fixed deposit investment.
3. To study the consumers preferences about mutual fundinvestment as against bank fixed deposit.
3.2 DATA COLLECTION METHOD:-
To achieve the objectives of to do comparative analysis of mutual fund
investment as against bank fixed deposit data has to be collected from
different sources.
3.2.1 SECONDARY DATA This data is collected from various sources like magazines, websites and especially from the books of well-known authors. BOOKS FOLLOWS-
- Indian Mutual Funds Handbook: - Sundar Sankaran - 16 Personal Finance Principles Every Investor Should Know - Manish
Chauhan
FOLLOWING ARE THE URLS
- http://mutualfund.birlasunlife.com - http://www.tatamutualfund.com
23

- https://www.valueresearchonline.com - http://www.moneycontrol.com - http://economictimes.indiatimes.com
3.2.2 ADVANTAGES OF SECONDARY DATA
A. SAVING OF TIME:- The process has been simplified.Precise information may be obtained via search engines.All worth library has digitized its collection so thatstudents and researchers may perform more advancesearches.
B. SAVING OF MONEY:- In general, it is much less expensivethan other ways of collecting data. One may analyzelarger data sets like those collected by governmentsurveys with no additional cost.
C. GENERATING NEW INSIGHTS:- Reanalyzing data can alsolead to unexpected new discoveries. Returning to theprevious. we can analyze the data and0 come up withnew relevant conclusions or simply verify and confirmprevious results.
3.2.3 DISADVANTAGES OF SECONDARY DATA
A. INAPPROPRIATENESS OF THE DATA:- Secondary datasources may provide you with vast amount of information,but quantity is not synonymous of appropriateness. This issimply because it has been collected to answer a differentresearch question or objectives.
B. LACK OF CONTROL OVER DATA QUALITY:- Governmentand other official institutions are often a guarantee ofquality data, but it is not always the case. For this reason,quality issues must be verify as outlined in this post.
24

3.1 INVESTORS THINK RISKEST INVESTMENT PRODUCT
Investors think riskest investment product
High risk Medium risk Low risk
Mutual Funds 83 13 4
Life insurance 4 19 77
Post office saving 4 18 78
Equity 41 46 13
Company fixed deposits 24 53 23
Bonds 26 51 23
Gold 13 38 59
Property 9 39 52
Chit Funds 30 52 18
Bank FD 3 20 77
25

Secondary data are already collected information. It is generally
difficult to scrutiny of secondary data because it may be a
inconsistencies, errors and omission etc. Thus it is very risky to use
methods and derived to conclusion. For that our group are go for
primary data method.
Data collected by primary data is collected with a concrete idea in
mind. Usually to answer a research question or just meet certain
objectives.
3.3 PRIMARY DATA
On the basis of pilot study stage, a structured has beenconstructed to conduct the sample survey. The questionnaireincludes quotations on each of the 4-5 variables related to therespondents. A questionnaire with 13 questions has been used assurvey instrument for conducting survey. A total of 51respondents were interviewed and data has been generated byface to face interview. The questionnaire has options againstwhich the respondent has to select as per his/her perception fromhis/her experiences.
3.3.1 ADVANTAGES OF PRIMARY DATA A.DATA INTERPRETATION IS BETTER:- The collected data can be examined and interpreted by the marketers depending on their needs rather than relying on the interpretation made by collectors of secondary data.
B. RECENCY OF DATA:- Thus primary data becomes amore accurate tool since we can use data which isuseful for us.
26

C. PROPRIETARY ISSUES:- Collector of primary data is theowner of that information and he need not share it withother competitors. This gives an edge over competitorsreplying on secondary data.
3.3.2 DISADVANTAGES OF PRIMARY DATA
A. HIGHCOST:- Collecting data using primary research is a costly proposition as marketer has to be involved throughout and has todesign everything.
B. TIME CONSUMING:- Because of exhaustive nature of the exercise, the time required to do research accurately is very long as compared to secondary data, which can be collected in much lesser time duration.
C. MORE NUMBER OF RESOURCES ARE REQUIRED:- Leaving aside cost and time, other resources likehuman resources and materials too are needed inlarger quantity to do surveys and data collection.
3.4 METODS OF COLLECTING PRIMARY DATA:-
A. SAMPLING:- It represents whole population. It is the processes of choosing a sample from whole population .We have chosen a sample of high class & middle class people who have invested either in mutual funds or Bank Fixed Deposits.
B. CENSUS SURVEY:- It is a systematics method. It covers entire population or universe and not very practical as it requires enormous huge amount of time, manpower and money.
27

C. SAMPLING SIZE:- We had chosen sample of 51 candidates.
3.4 DATA ANALYSIS AND INTERPRETATION:- Data analysis and interpretation is the process of inspecting,cleaning, transforming and modeling data with the goal ofdiscoveries useful information, suggesting conclusion andsupporting decision making.
Data interpretation is that in which we analysis the wholecollected data & tries to give it in simple words to beunderstandable.
We have used some charts (Pie chart, column chart, cylinderchart, cone chart) and hypothesis tests (chi-square onesample T- test etc.)
3.5 LIMITATIONS:-
A. The study is limited to selected investment avenues.
B. Due to shortage or less availability of time it may be possible
that all the related and concerned aspects may not be covered
in this project.
C. As we have used sampling method to collect data so there was
lack of support from respondent in some cases. Maximum
respondents were not interested to entertain us.
28

TABLE 3.2 AGE GROUP:
Age Group 21-30 31-40 41-50 Above 50 Total
Frequency 24 11 11 5 51
Percentage 51 24 24 1 100
The above schedule and the diagram mentioned below explain the relationship between different ages of respondents investing either in Mutual Fund or Bank Fixed Deposits.
FIG.3.2
29

51%
24%
24%
1%
AGE GROUP
21-30
31-40
41-50
Above 50
The above figure shows that the age group of 21-30 respondents investing more either in Mutual Fund or Bank Fixed Deposits i.e. (51%) and age group of above 50 makes less investment i.e. (1%).
Table 3.3 Date Was Collected For Analyzing Whether Customer Have Ever Invested In Any Kind Of Investment:
Yes/No Yes No Total
Frequency 45 6 51
Percentage 88 12 100
The above schedule and the diagram mentioned below reflects whether customer have ever Invested in any kind of Investment.
FIG.3.3
30

88%
12%
INVESTMENT
Yes
No
The above figure shows that 88% of Customer are interested in of Investment and 12% Customers are not interested in any type of investment.
Table 3.4 Date was collected for analyzing Investment Options most preferable for investment either in Mutual Fund or in Bank Fixed Deposits:
InvestmentOptions
Bank FixedDeposits
Mutual Fund Total
Frequency 31 20 51
Percentage 61 39 100
The above Investment Option’s schedule and the Investment Option diagram mentioned below reflects number of respondents investing either in Mutual Fund or in Bank Fixed Deposits.
FIG.3.4
31

61%
39%
INVESTMENT OPTION
Bank Fixed Deposits
Mutual Fund
The above figure shows that Bank fixed deposits is more preferable (61%) than Mutual Funds (39%).
Table 3.5 Date Was Collected For Analyzing Reasons For Selecting Mutual Fund Or Bank Fixed Deposits:
Reasons Rate OfInterest
Low risk Tax Saving Total
Frequency 21 24 6 51 Percentage 41 47 12 100
The above schedule and the diagram mentioned below reflects number of respondent’s reason for investing either in Mutual Fund or in Bank Fixed Deposits.
FIG.3.5
32

41%
47%
12%
REASON FOR INVESTMENT
Rate Of Interest
Low risk
Tax Saving
The above figure shows that bank fixed deposit is more preferable if Risk is Low i.e. (47%) then Tax Saving (12%).
Table 3.6 Date Was Collected For Analyzing What Factors Considered By Customers For Investment In Mutual Fund Or Fixed Deposits:
Factors Preservati
on of Capital
Increase incurrentincome
Aggressive
Growth
Growthand
Income
Conservation Growth
Total
Frequency 20 13 8 6 4 51 Percentage
39 24 16 12 8 100
The above schedule and the diagram mentioned below reflects
factors customers consider for investment in Mutual Fund or
Fixed Deposits. FIG.3.6
33

40%
24%
16%
12%
8%
FACTORS CONSIDERED FOR INVESTMENT
Preservation of
Capital
Increase in current
income
Aggressive Growth
Growth and Income
Conservation Growth
The above figure shows that Preservation of capital (40%) is a major factor considered by consumers for investment rather than investing forConservation Growth (8%)
Table 3.7 Date Was Collected For Analyzing Which Investments Option Is More Risky:
Investment
Options Bank FixedDeposits
Mutual Fund Total
Frequency 2 49 51
Percentage 4 96 100
The above Investment Option’s schedule and the diagram mentioned
below reflects which investments option is more risky between Mutual
Fund and Fixed Deposits. FIG.3.7
34

4%
96%
INVESTMENT OPTION
Bank Fixed Deposits
Mutual Fund
The above figure shows about 96% of Customer finds more risk in investment in Mutual Fund then Bank Deposits.
35

53%
47%
KNOWLEDGE OF SCHEMES
Yes
No
Table 3.8 Date Was Collected For Analyzing Knowledge Of Schemes In Investment Options:
KNOWLEDGE YES NO TOTAL
Frequency 27 24 51
Percentage 53 47 100
The schedule and the diagram mentioned below reflects knowledge of Schemes in investment options between Mutual Fund and Fixed Deposits.
FIG.3.8
The above figure shows that about 53% customers have knowledge ofSchemes available in Mutual Fund and Bank Fixed Deposits and 47%don’t have idea about schemes.
36

61%
39%
BENEFICIAL SECTOR
Public Sector
Private Sector
Table 3.9 Date Was Collected For Analyzing Investment In Which Sector Will Make Benefit For Customers:
Sector Public Sector Private Sector Total
Frequency 31 20 51
Percentage 61 39 100
The schedule and the diagram mentioned below reflects investment sector which is more beneficial according to investors.
FIG.3.9
The above figure shows that Public Sector (61%) is more beneficial than Private Sector (39%).
37

41%
59%
INVESTMENT TYPE
Short term
Long Term
Table 3.10 Date Was Collected For Analyzing Investment Type Preferred By Investors:
INVESTMENT
TYPE SHORT TERM LONG TERM TOTAL
Frequency 21 30 51
Percentage 41 59 100
The schedule and the diagram mentioned below reflect Investment type preferred by investors.
Fig.3.10
The above figure shows that Long Term investment (59%) is morepreferred than Short term investment (41%). Table 3.11 Date Was Collected For Analyzing Investment Option Referred By Investors:
38

63%
37%
INVESTMENT OPTION RECOMMEND
Bank Fixed Deposits
Mutual Fund
Investment
Option Bank FixedDeposits
Mutual Fund Total
Frequency 32 19 51
Percentage 63 37 100
The schedule and the diagram mentioned below reflect Investment option referred by investors.
FIG.3.11
The above figure shows that Bank Fixed Deposits (63%) is recommended highly than Mutual Fund investment (37%).
39

CHAPTER IV:
CONCLUSION & RECOMMEDATION
4.1 CONCLUSIONS
A. On the basis of conclusion it has been seen that many peopleprefer to invest their money in bank fixed deposit as compare toMutual funds
B. People will be aware of the risk involved in investments.
C. Mutual fund is introduced in 1961, till 54years after mutual fundsnot change the mind set of people. Till present traditionalinvestment is dominating other investments.
D. Data collected also reveals that peoples are investing their somepart of their income.
E. It also has been found that people are preferring public sector asbeneficial.
F. People invest their money in low risk instrument as a firstpreference not choose high rate of return. People are morefocused preservation of capital as factor for their investment.
G. Majority of people are feeling mutual fund is more risky than bankfixed deposits. But people don’t know bank also give only 1 lacgrantee of their fixed deposit investment.
H. More than 50 percent of people don’t know investment scheme ofmutual fund and bank fixed deposit.
40

I. More people are investing their money in bank fixed deposit for along term.
J. People are recommending bank fixed deposit as good investmentto others.
4.2 RECOMMEDATIONS:
A. Seminars and promotional activities should be held to increase
knowledge and awareness among the peoples related with
market related schemes.
B. For long term investments mutual funds is best option and it can
beat inflation of the economy.
C. People regularly invest part thereof income to mutual fund forlonger term.
D. From the advance technology now people improve their
knowledge about mutual fund investments and they take correct
decision about investments.
E. Increase in rate of return and proper allocation of funds will help
to increase investments to modern investments.
F. Mutual Funds Company improves their operational transaction
and bring more professionalism in their work.
G. Mutual funds give better return compared to bank fixed deposits.
41

H. Mutual funds are a tax saving tools if people invest their money in
tax saving funds.
BIBLIOGRAPHY
BOOK REFERRED
Indian Mutual Funds Handbook: - Sundar Sankaran . 16Personal Finance Principles Every Investor Should Know - ManishChauhan.
MAGAZINES
ET WEALTH
BRUNCH
WEBSITES
http://mutualfund.birlasunlife.com http://www.tatamutualfund.com https://www.valueresearchonline.com http://www.moneycontrol.com
42

http://economictimes.indiatimes.com http://www.sebi.gov.in
43