A PROFILE OF THE SOUTH AFRICAN MANGO MARKET VALUE CHAIN … · A PROFILE OF THE SOUTH AFRICAN MANGO...
42
A PROFILE OF THE SOUTH AFRICAN MANGO MARKET VALUE CHAIN 2011 Directorate Marketing Private Bag X 15 Arcadia 0007 Tel: 012 319 8455/6 Fax: 012 319 8131 Email: [email protected] www.daff.gov.za
Transcript of A PROFILE OF THE SOUTH AFRICAN MANGO MARKET VALUE CHAIN … · A PROFILE OF THE SOUTH AFRICAN MANGO...

A PROFILE OF THE SOUTH AFRICAN MANGO MARKET VALUE CHAIN
2011
Directorate Marketing Private Bag X 15
Arcadia 0007
Tel: 012 319 8455/6 Fax: 012 319 8131
Email: [email protected]
www.daff.gov.za
TABLE OF CONTENTS
1. DESCRIPTION OF THE PRODUCT AND INDUSTRY.............................................................................. 3 1.1 Mango production areas........................................................................................................ 3 1.2 Mango production................................................................................................................. 4 1.3 Cultivars................................................................................................................................ 5 1.4 Employment.......................................................................................................................... 6
2. MARKET STRUCTURE ............................................................................................................................ 7 2.1 Domestic markets.................................................................................................................. 7 2.2 Exports .................................................................................................................................. 8 2.3 Provincial and district export values of South African mangoes........................................ 13 2.4 Share Analysis .................................................................................................................... 18 2.5 Imports ................................................................................................................................ 21 2.6 Mango uses ......................................................................................................................... 24
2.6.1 Primary product ........................................................................................................... 24 2.6.2 Medicinal uses ............................................................................................................. 24 2.6.3 By-products.................................................................................................................. 25
3. MARKET INTELIGENCE ........................................................................................................................ 25 3.1 Competitiveness of South African mango exports ............................................................. 25
4. MARKET ACCESS ................................................................................................................................. 29 4.1 Tariffs, quotas and the price entry system .......................................................................... 29 4.2 European Union (EU) ......................................................................................................... 31
4.2.1 Tariff barriers ............................................................................................................... 31 4.2.2 Non tariff barriers ........................................................................................................ 32
4.2.2.1 Legal requirements................................................................................................ 32 4.2.2.2 Non-legal requirements......................................................................................... 33 4.2.2.3 Consumer health and safety requirements ............................................................ 34
4.3 United States of America (USA) ........................................................................................ 34 4.3.1 Tariff barriers ............................................................................................................... 34 4.3.2 Non tariff barriers ........................................................................................................ 34
5. DISTRIBUTION CHANNELS AND LOGISTICS ..................................................................................... 35 6. LOGISTICS ............................................................................................................................................. 36
6.1 Mode of transport................................................................................................................ 36 6.2 Cold chain management...................................................................................................... 36 6.3 Packaging and marking requirements................................................................................. 36
7. MANGO SUPPLY VALUE CHAIN .......................................................................................................... 37 8. BUSINESS OPORTUNITIES AND CHALLENGES ................................................................................ 39
8.1 Climate................................................................................................................................ 39 8.2 Diseases............................................................................................................................... 39 8.3 Pests .................................................................................................................................... 40 8.4 Disease resistant cultivars ................................................................................................... 40 8.5 Nutrition.............................................................................................................................. 41 8.6 Competitiveness.................................................................................................................. 41
9. ACKNOWLEDGEMENTS ....................................................................................................................... 41

1. DESCRIPTION OF THE PRODUCT AND INDUSTRY
The mango fruit belongs to the family Anacardiaceae in the genus Mangifera. The family consists of 41 species of which the mango (Mangifera indica) is the most important. It is a tropical fruit that also grows well in subtropical areas hence its classification in South Africa and other countries as a subtropical fruit. During the 2009/10 marketing season the total gross value of subtropical fruits in South Africa was R2.1 billion. In the same period the total gross value of mangoes was R186 million, representing 9% of the total gross value of South Africa subtropical fruits. The total gross value of production (GVP) for mangoes over the last ten years is presented in Figure 1.
Source: Statistics and Economic Analysis, DAFF It can be observed from Figure 1 that the total gross value of mangoes rose by 3% between the 2008/09 and 2009/10 marketing seasons. This rise in gross value during 2009/10 came after a 14% decline in 2008/09. Looking at the last decade it is encouraging to note that the gross value of production increased by 57% between 2000/01 and 2009/10. It is interesting to note that the increase in gross value of production over the past decade did not result from the increase in production volumes (see Figure 3). The total volume of production over the same period actually declined. It can therefore be argued that the increase in gross value over the period came from increases in unit values.
1.1 Mango production areas South Africa’s mango production regions are mainly situated in the North East part of the country. The elevation of mango growing areas varies from 300 to 950 meters above sea level with annual rainfall in the

major growing areas varying from 300 to 1000 mm. Flowering during winter (June to August) is normally intense, which indicates that winter conditions are adequately inducive for flowering. Differences in average temperatures between the major mango growing regions give rise to differences in harvesting dates. Fruits produced in the higher lying areas are harvested later than fruit produced in the lower lying areas. The difference in the time of harvest for a specific cultivar may be as long as 3 to 6 weeks. The major mango producing areas in 2009 and 2010 are depicted in Figure 2.
Source: Subtrop, 2010 As can be seen in Figure 2, a total area of 7 577 hectares was planted to mangoes in 2010. This is in comparison with 7600 hectares planted to mangoes in 2009, indicating a slight decline of 0.3%. Limpopo Province is the largest producer of mangoes, with 5 013 hectares (representing 66% of total land planted to mangoes) planted to mangoes in 2010. Most of the mango plantings in Limpopo are found in the Soutpansberg, Northern, Central and Southern Letaba as well as Hoedspruit regions. The second largest producer of mangoes in South Africa is Mpumalanga province. The province had 1 950 hectares (26%) planted to mangoes in 2010. Most of the mango plantings in Mpumalanga are found in Onderberg areas of Malelane and Komatipoort. Kwa-Zulu Natal is the third largest producer of mangoes with 6% and most of the mango plantings in Kwa-Zulu Natal are found in Pongola.
1.2 Mango production
4
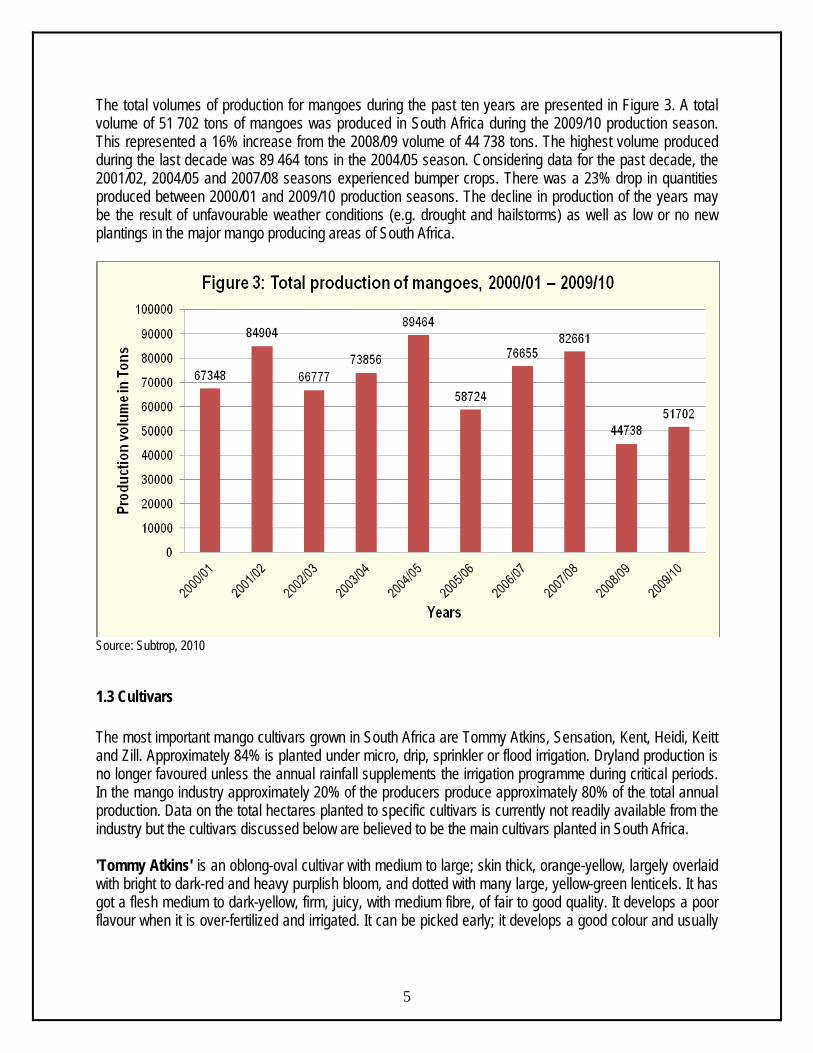
The total volumes of production for mangoes during the past ten years are presented in Figure 3. A total volume of 51 702 tons of mangoes was produced in South Africa during the 2009/10 production season. This represented a 16% increase from the 2008/09 volume of 44 738 tons. The highest volume produced during the last decade was 89 464 tons in the 2004/05 season. Considering data for the past decade, the 2001/02, 2004/05 and 2007/08 seasons experienced bumper crops. There was a 23% drop in quantities produced between 2000/01 and 2009/10 production seasons. The decline in production of the years may be the result of unfavourable weather conditions (e.g. drought and hailstorms) as well as low or no new plantings in the major mango producing areas of South Africa.
Source: Subtrop, 2010
1.3 Cultivars The most important mango cultivars grown in South Africa are Tommy Atkins, Sensation, Kent, Heidi, Keitt and Zill. Approximately 84% is planted under micro, drip, sprinkler or flood irrigation. Dryland production is no longer favoured unless the annual rainfall supplements the irrigation programme during critical periods. In the mango industry approximately 20% of the producers produce approximately 80% of the total annual production. Data on the total hectares planted to specific cultivars is currently not readily available from the industry but the cultivars discussed below are believed to be the main cultivars planted in South Africa.
5
'Tommy Atkins' is an oblong-oval cultivar with medium to large; skin thick, orange-yellow, largely overlaid with bright to dark-red and heavy purplish bloom, and dotted with many large, yellow-green lenticels. It has got a flesh medium to dark-yellow, firm, juicy, with medium fibre, of fair to good quality. It develops a poor flavour when it is over-fertilized and irrigated. It can be picked early; it develops a good colour and usually

6
has long shelf-life. Sometimes there is an open space in the flesh at the stem-end. Interior softening near the seed occurs in some years. 'Sensation' is an oval cultivar with, oblique, and faintly beaked; medium to medium-small; skin thin, adherent; basically yellow to yellow-orange overlaid with dark plum-red, and with tiny, pale-yellow lenticels. It has got a flesh pale-yellow, firm, with very little fibre, faintly aromatic, of mild and has slightly sweet flavour. 'Kent' is an ovate cultivar with thick; large; skin greenish-yellow with dark-red blush and gray bloom; many small, yellow lenticels. It has a flesh fibreless, juicy, sweet; very good to excellent taste. Its tree is of erect, slender habit, of moderate size, precocious; bears very well and fruit ships well, but, for the market, needs ethylene treatment to enrich colour. 'Keitt' is a rounded-oval to ovate cultivar with a large; skin medium-thick, yellow with light-red blush and a lavender bloom. It has many lenticels, small and yellow to red. Its flesh is orange-yellow, firm, fibreless except near the seed; of rich, sweet flavour; very good quality. It has a small or medium to large seed. Its tree is small to medium, erect, open, rather scraggly but very productive. For market acceptance, it requires a post-harvest ethylene treatment to enhance colour.
1.4 Employment The industry makes an important contribution to direct employment in the mango production and processing. It provides indirect employment for numerous support industries in the areas where mangoes are grown. Direct employment within the industry during 2010 was estimated at 2 900. The prescribed minimum wage is used as a baseline for determining basic wages in accordance with the legislation governing conditions of service. Minimum wages for farm workers for the period 1 March 2009 to 1 March 2011 are presented in Table 1. The consumer price index (CPI) is used in the calculation of annual wage adjustments. The sectoral determination stipulates that the wage increase will be determined by ustilising the CPI + 1%. In terms of percentage increase, the 2011 minimum wage is 4.5% higher than the 2010 minimum wage (CPI on 19 January 2011 was 3.5%). Table 1: Minimum wages for farm workers in the Republic of South Africa, 2009 - 2011-05-24
Year Frequency
1/03/2009 1/03/2010 1/03/2011
Hourly R6.31 R6.74 R7.04 Weekly R284.23 R303.84 R317.51 Monthly R1231.70 R1316.69 R1375.94 Hortgro, 2010

2. MARKET STRUCTURE The annual distribution of the mango crop is presented in Figure 4. The annual crop is processed into dried mangos, achar and juice and sold fresh through the national fresh produce markets (NFPMs) and as exports. 17 390 tons of mangos were processed into juice during the 2009/10 marketing season. This was up from 14 316 tons processed into juice the previous year. Another important distribution channel for mangos during the 2009/10 marketing season was the NFPMs, which 15 099 tons in the same year. The proportion sold through the NFPMs increased by 4% between 2008/09 and 2009/10 marketing seasons. The quantity of dried mangos also increased from 8 379 tons in 2008/09 to 9 747 ton in 2009/10, a rise of 16%. The volume of mangos processed into achar increased from 5 915 tons in 2008/09 to 7 850 tons in 2009/10 while the volume of mangos exported declined from 1 676 tons in 2008/09 to 1 616 tons in 2009/10.
Source: Subtrop, 2010
2.1 Domestic markets
7
The volume of sales and the average prices of mangoes sold at the NFPMs are presented in Figure 5. As witnessed in Figure 4, the quantity of mangos sold through the NFPMs accounted for 26% of the total mango crop produced during the 2009/10 production season. Smaller quantities of mangos are also sold through retailers, chain stores or the informal sector. The volume of sales at the NFPMs have been relatively stable over the last decade, remaining above 1 500 tons per annum except during 2008/09 when sales dropped to 14 452 tons. The period between 2000/01 and 2009/10 marketing seasons saw a 26%

decline in volumes of mangos sold through the NFPMs. At the same time average prices realised at the markets increased by 114%. The average price realised at the markets in 2009/10 was R5 946 per ton. This was 23% higher than the average price during the previous year (2008/09).
Source: Subtrop, 2010 and Statistics and Economic Analysis, DAFF
2.2 Exports Volumes and unit values for mangos exported by South Africa during the past ten years are presented in Figure 6. The figure clearly indicates that South Africa is relatively a small exporter of mangos in the world. The highest volume exported by South Africa during the last decade was in 2003. Since then, the volumes of mangos exported have declined considerably, dropping below 2 000 tons during the 2009 and 2010 seasons. As can be noted in Figure 4, large proportion of South Africa’s annual mango crop are processed and sold through the NFPMs, leaving very small quantities available for the export market. At the same time when the quantity of mango exports is declining the unit values have been on the rise, increasing from R3 036 per ton in 2000 to R22 611 per ton in 2010 (an increase of 645%). The 2010 unit value (R22 611/ton) was 22% higher than the unit value of the previous year (2009).
8

Source: Subtrop, 2010. Unit values calculated from Quantec data Volumes of exports of South African mangos to the different regions of the world during the past decade are presented in Figure 7. It is evident from Figure 7 that during the past decade, most of South Africa’s exports of mangoes were destined for the European and Asian markets. In 2010 exports to Europe accounted for 50% of total South African mango exports. It is important to note that exports to Europe have been declining since 2004. This was after three years of positive growth between 2001 and 2003. During the period under review exports to Europe peaked at 18 153 tons in 2003 while exports to Asia peaked at 3 222 tons in 2007. Exports of mangoes to Africa have also been declining during the past four years, moving from 866 tons in 2007 to 332 tons in 2010. Mango exports to the Americas have been consistent over the last decade, remaining below 100 tons for most of the decade and only peaking at 160 tons in 2001. They again rose above 100 tons in 2010.
9

Source: Quantec Easydata Within Europe, exports of South African mangoes are normally distributed between the European Union and Western Europe (see Figure 8). It can be observed from Figure 8 that the European Union usually absorbs over 90% of the total South Africa’s annual exports of mangos into the European continent. The remainder is absorbed by Western Europe, consisting of Switzerland, Liechtenstein and Monaco.
10
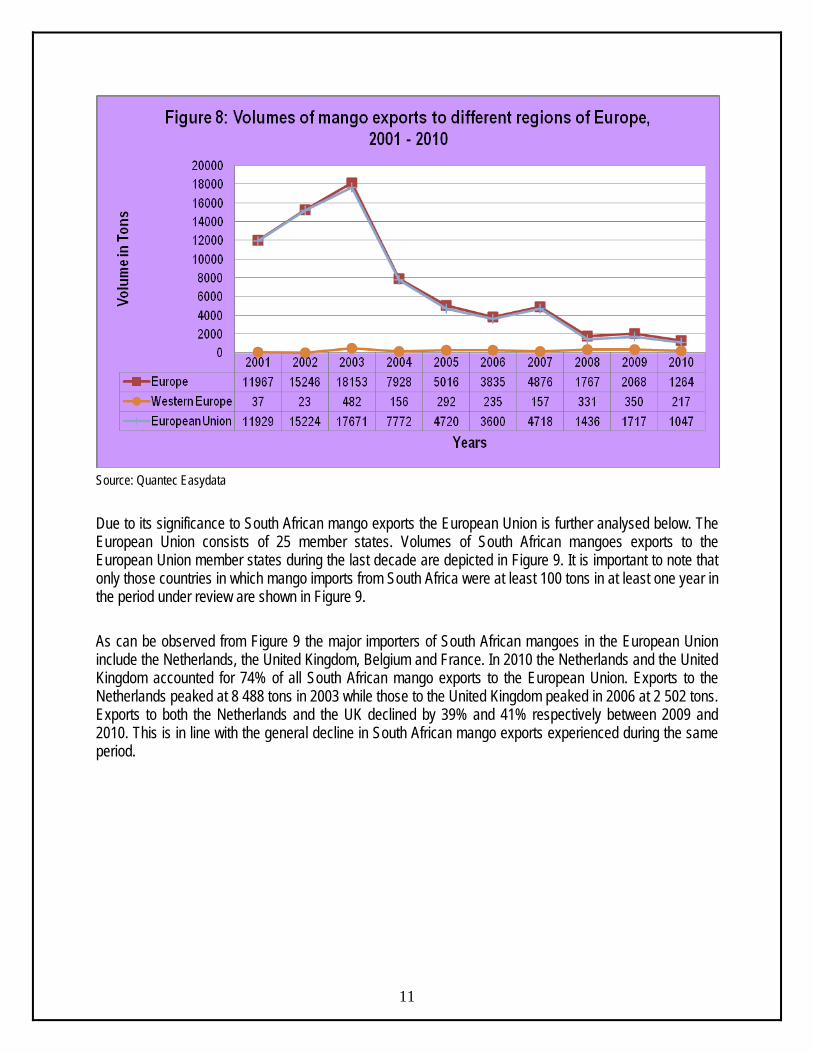
Source: Quantec Easydata Due to its significance to South African mango exports the European Union is further analysed below. The European Union consists of 25 member states. Volumes of South African mangoes exports to the European Union member states during the last decade are depicted in Figure 9. It is important to note that only those countries in which mango imports from South Africa were at least 100 tons in at least one year in the period under review are shown in Figure 9. As can be observed from Figure 9 the major importers of South African mangoes in the European Union include the Netherlands, the United Kingdom, Belgium and France. In 2010 the Netherlands and the United Kingdom accounted for 74% of all South African mango exports to the European Union. Exports to the Netherlands peaked at 8 488 tons in 2003 while those to the United Kingdom peaked in 2006 at 2 502 tons. Exports to both the Netherlands and the UK declined by 39% and 41% respectively between 2009 and 2010. This is in line with the general decline in South African mango exports experienced during the same period.
11

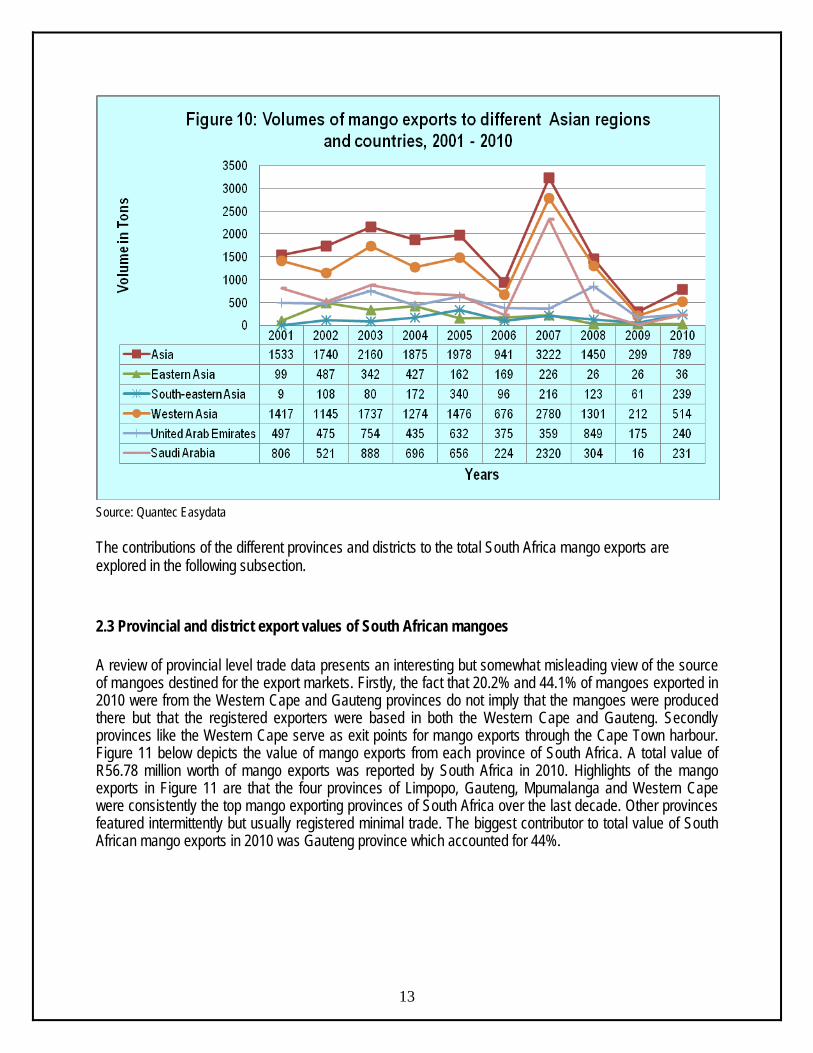
Source: Quantec Easydata According to Figure 7 Asia has been the second largest export destination for South African mangoes during the last decade. Figure 10 shows volumes of South African mango exports to the Asian regions and countries for the period 2001 to 2010. Western Asia, which includes countries like the United Arab Emirates (UAE), Bahrain, Saudi Arabia, Qatar, Oman, and Kuwait, is the leading export destination for South African mangoes in Asia, accounting for 65% of total South African mango exports to the Asian continent in 2010. It is worth noting that exports to the Western Asia region have declined significantly during 2008 and 2009, moving from 2 780 tons in 2007 to 212 tons in 2009 (a decline of 92%). Exports to the other regions have been relatively constant over the last decade with the exception of South-eastern Asia which never recorded imports of mangoes from South Africa for the past half-decade. Within Western Asia the major importers of South African mangos are the United Arab Emirates (UAE) and Saudi Arabia. The two countries accounted for 92% of all South African mango exports to Western Asia in 2010.
12
Source: Quantec Easydata The contributions of the different provinces and districts to the total South Africa mango exports are explored in the following subsection.
2.3 Provincial and district export values of South African mangoes A review of provincial level trade data presents an interesting but somewhat misleading view of the source of mangoes destined for the export markets. Firstly, the fact that 20.2% and 44.1% of mangoes exported in 2010 were from the Western Cape and Gauteng provinces do not imply that the mangoes were produced there but that the registered exporters were based in both the Western Cape and Gauteng. Secondly provinces like the Western Cape serve as exit points for mango exports through the Cape Town harbour. Figure 11 below depicts the value of mango exports from each province of South Africa. A total value of R56.78 million worth of mango exports was reported by South Africa in 2010. Highlights of the mango exports in Figure 11 are that the four provinces of Limpopo, Gauteng, Mpumalanga and Western Cape were consistently the top mango exporting provinces of South Africa over the last decade. Other provinces featured intermittently but usually registered minimal trade. The biggest contributor to total value of South African mango exports in 2010 was Gauteng province which accounted for 44%.
13

Source: Quantec Easydata The following figures (Figures 12 – 17) show the value of mango exports from the various districts in the six provinces of South Africa that recorded mango exports in at least one year during the last ten years. Figure 12 illustrates values of mango exports by the Limpopo province.
14

Source: Quantec Easydata Limpopo province exported mangoes to the value of R4.85 million in 2010. The majority of mango exports from Limpopo province are mainly from the Mopani and Vhembe district municipalities. The value of mago exports reported by the Mopani district during 2010 was R4.14 million. This was below the R6.78 million recorded in 2009. Values of mango exports from the Mpumalanga province are depicted in Figure 13.
Source: Quantec Easydata
15

A total value of R5.93 million worth of mango exports was reported by Mpumalanga during 2010. This was down from the R6.10 million recorded in 2009 and up from the R0.22 million recorded in 2001. The major mango exporting regions in Mpumalanga province are the Gert Sibande and Ehlanzeni district municipalities. Ehlanzeni district recorded R4.46 million worth of mango exports during 2010 while the Gert Sibande district reported R1.37 million during the same year. Values of mango exports from the Kwa-Zulu Natal province are shown in Figure 14.
Source: Quantec Easydata The province of KwaZulu Natal reported mango exports worth R9.45 million in 2010. The value was up from the R5.18 million reported by the province in 2009. It is clear from Figure 14 that almost all mango exports reported in Kwa-Zulu Natal during the last four years were from Umgungundlovu district. eThekwini municipality also recorded some exported during the last ten years. Ethekwini export values have drastically dropped from highs of 2003. That may be due to the emergence of Cape Town as the major exit point for South African mangoes. Values of mango exports from the Western Cape are shown in Figure 15. Figure 15 shows that mango exports from the Western Cape province are mainly from the City of Cape Town and to a lesser extend Cape Winelands. The Western Cape recorded mango exports worth R11.48 million in 2010. The value was up from the R8.46 million recorded in 2009. The City of Cape Town accounted for R10.02 million of the total value of mango exports recorded by the Western Cape while the Cape Winelands accounted for R1.36 million. The use of the Cape Town harbour as an exit point may have played a major role in the City of Cape Town being a leader in the export of mangoes from the Western Cape Province.
16

Source: Quantec Easydata Values of mango exports from the Gauteng province are shown in Figure 16.
17
Source: Quantec Easydata
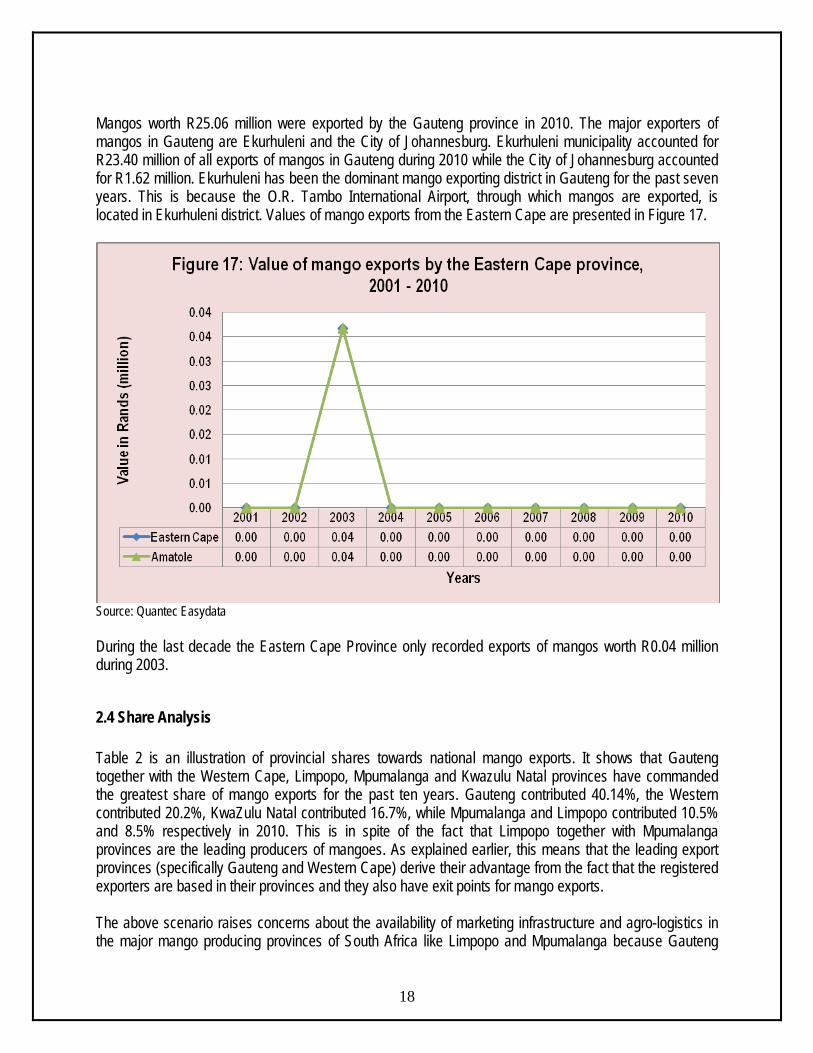
Mangos worth R25.06 million were exported by the Gauteng province in 2010. The major exporters of mangos in Gauteng are Ekurhuleni and the City of Johannesburg. Ekurhuleni municipality accounted for R23.40 million of all exports of mangos in Gauteng during 2010 while the City of Johannesburg accounted for R1.62 million. Ekurhuleni has been the dominant mango exporting district in Gauteng for the past seven years. This is because the O.R. Tambo International Airport, through which mangos are exported, is located in Ekurhuleni district. Values of mango exports from the Eastern Cape are presented in Figure 17.
Source: Quantec Easydata During the last decade the Eastern Cape Province only recorded exports of mangos worth R0.04 million during 2003.
2.4 Share Analysis Table 2 is an illustration of provincial shares towards national mango exports. It shows that Gauteng together with the Western Cape, Limpopo, Mpumalanga and Kwazulu Natal provinces have commanded the greatest share of mango exports for the past ten years. Gauteng contributed 40.14%, the Western contributed 20.2%, KwaZulu Natal contributed 16.7%, while Mpumalanga and Limpopo contributed 10.5% and 8.5% respectively in 2010. This is in spite of the fact that Limpopo together with Mpumalanga provinces are the leading producers of mangoes. As explained earlier, this means that the leading export provinces (specifically Gauteng and Western Cape) derive their advantage from the fact that the registered exporters are based in their provinces and they also have exit points for mango exports.
18
The above scenario raises concerns about the availability of marketing infrastructure and agro-logistics in the major mango producing provinces of South Africa like Limpopo and Mpumalanga because Gauteng
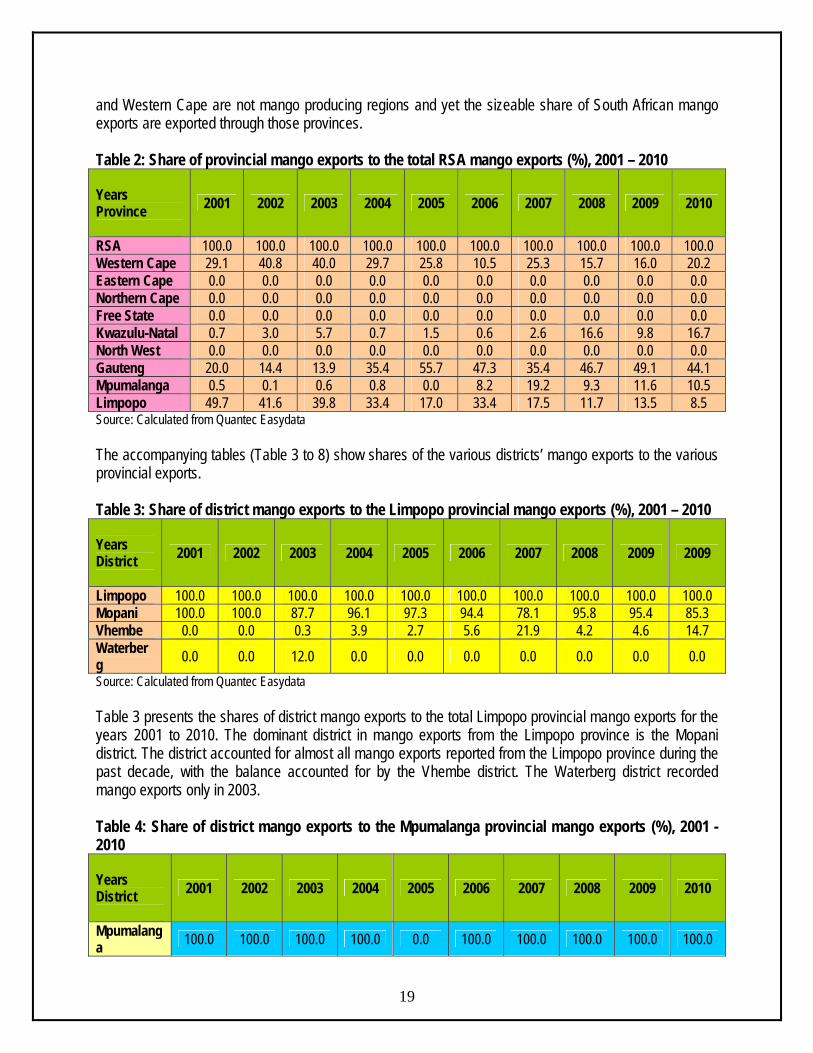
and Western Cape are not mango producing regions and yet the sizeable share of South African mango exports are exported through those provinces. Table 2: Share of provincial mango exports to the total RSA mango exports (%), 2001 – 2010 Years Province
2001 2002 2003 2004 2005 2006 2007 2008 2009 2010
RSA 100.0 100.0 100.0 100.0 100.0 100.0 100.0 100.0 100.0 100.0 Western Cape 29.1 40.8 40.0 29.7 25.8 10.5 25.3 15.7 16.0 20.2 Eastern Cape 0.0 0.0 0.0 0.0 0.0 0.0 0.0 0.0 0.0 0.0 Northern Cape 0.0 0.0 0.0 0.0 0.0 0.0 0.0 0.0 0.0 0.0 Free State 0.0 0.0 0.0 0.0 0.0 0.0 0.0 0.0 0.0 0.0 Kwazulu-Natal 0.7 3.0 5.7 0.7 1.5 0.6 2.6 16.6 9.8 16.7 North West 0.0 0.0 0.0 0.0 0.0 0.0 0.0 0.0 0.0 0.0 Gauteng 20.0 14.4 13.9 35.4 55.7 47.3 35.4 46.7 49.1 44.1 Mpumalanga 0.5 0.1 0.6 0.8 0.0 8.2 19.2 9.3 11.6 10.5 Limpopo 49.7 41.6 39.8 33.4 17.0 33.4 17.5 11.7 13.5 8.5 Source: Calculated from Quantec Easydata The accompanying tables (Table 3 to 8) show shares of the various districts’ mango exports to the various provincial exports. Table 3: Share of district mango exports to the Limpopo provincial mango exports (%), 2001 – 2010 Years District
2001 2002 2003 2004 2005 2006 2007 2008 2009 2009
Limpopo 100.0 100.0 100.0 100.0 100.0 100.0 100.0 100.0 100.0 100.0 Mopani 100.0 100.0 87.7 96.1 97.3 94.4 78.1 95.8 95.4 85.3 Vhembe 0.0 0.0 0.3 3.9 2.7 5.6 21.9 4.2 4.6 14.7 Waterberg 0.0 0.0 12.0 0.0 0.0 0.0 0.0 0.0 0.0 0.0 Source: Calculated from Quantec Easydata Table 3 presents the shares of district mango exports to the total Limpopo provincial mango exports for the years 2001 to 2010. The dominant district in mango exports from the Limpopo province is the Mopani district. The district accounted for almost all mango exports reported from the Limpopo province during the past decade, with the balance accounted for by the Vhembe district. The Waterberg district recorded mango exports only in 2003. Table 4: Share of district mango exports to the Mpumalanga provincial mango exports (%), 2001 - 2010
19
Years District
2001 2002 2003 2004 2005 2006 2007 2008 2009 2010
Mpumalanga 100.0 100.0 100.0 100.0 0.0 100.0 100.0 100.0 100.0 100.0
Gert Sibande 0.0 0.0 0.0 0.0 0.0 18.8 56.1 61.1 33.0 23.1
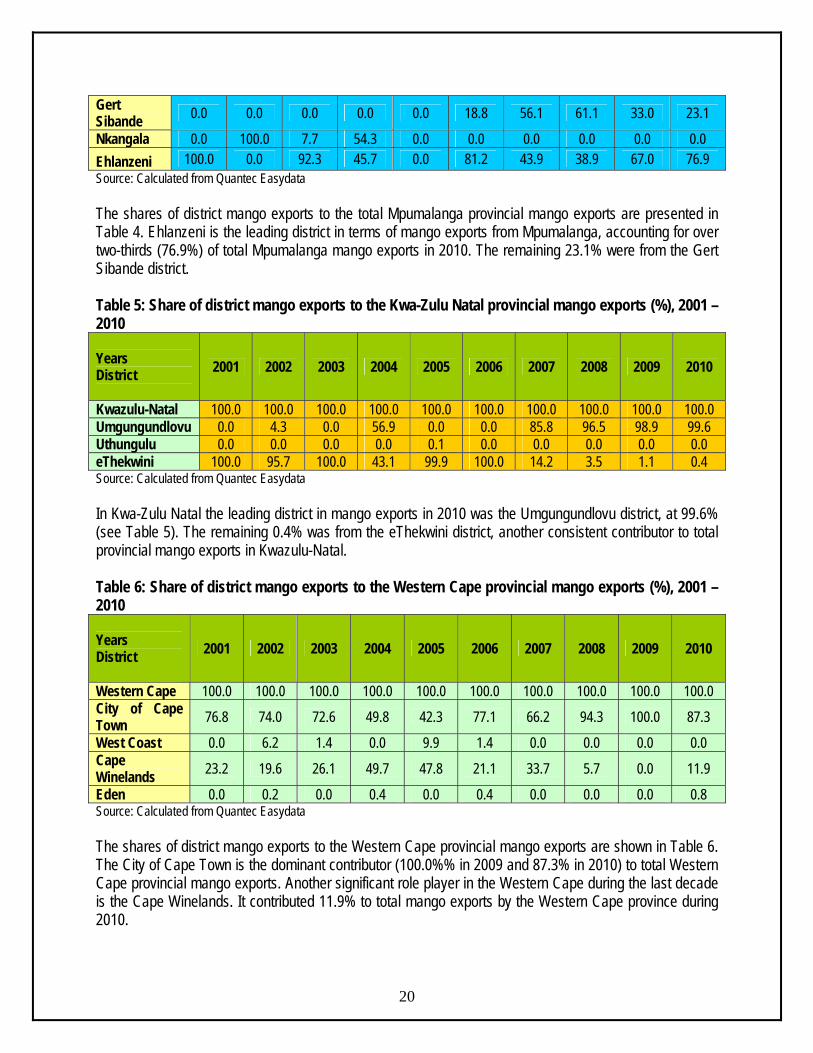
Nkangala 0.0 100.0 7.7 54.3 0.0 0.0 0.0 0.0 0.0 0.0 Ehlanzeni 100.0 0.0 92.3 45.7 0.0 81.2 43.9 38.9 67.0 76.9 Source: Calculated from Quantec Easydata The shares of district mango exports to the total Mpumalanga provincial mango exports are presented in Table 4. Ehlanzeni is the leading district in terms of mango exports from Mpumalanga, accounting for over two-thirds (76.9%) of total Mpumalanga mango exports in 2010. The remaining 23.1% were from the Gert Sibande district. Table 5: Share of district mango exports to the Kwa-Zulu Natal provincial mango exports (%), 2001 – 2010 Years District
2001 2002 2003 2004 2005 2006 2007 2008 2009 2010
Kwazulu-Natal 100.0 100.0 100.0 100.0 100.0 100.0 100.0 100.0 100.0 100.0 Umgungundlovu 0.0 4.3 0.0 56.9 0.0 0.0 85.8 96.5 98.9 99.6 Uthungulu 0.0 0.0 0.0 0.0 0.1 0.0 0.0 0.0 0.0 0.0 eThekwini 100.0 95.7 100.0 43.1 99.9 100.0 14.2 3.5 1.1 0.4 Source: Calculated from Quantec Easydata In Kwa-Zulu Natal the leading district in mango exports in 2010 was the Umgungundlovu district, at 99.6% (see Table 5). The remaining 0.4% was from the eThekwini district, another consistent contributor to total provincial mango exports in Kwazulu-Natal. Table 6: Share of district mango exports to the Western Cape provincial mango exports (%), 2001 – 2010 Years District
2001 2002 2003 2004 2005 2006 2007 2008 2009 2010
Western Cape 100.0 100.0 100.0 100.0 100.0 100.0 100.0 100.0 100.0 100.0 City of Cape Town 76.8 74.0 72.6 49.8 42.3 77.1 66.2 94.3 100.0 87.3
West Coast 0.0 6.2 1.4 0.0 9.9 1.4 0.0 0.0 0.0 0.0 Cape Winelands 23.2 19.6 26.1 49.7 47.8 21.1 33.7 5.7 0.0 11.9
Eden 0.0 0.2 0.0 0.4 0.0 0.4 0.0 0.0 0.0 0.8 Source: Calculated from Quantec Easydata The shares of district mango exports to the Western Cape provincial mango exports are shown in Table 6. The City of Cape Town is the dominant contributor (100.0%% in 2009 and 87.3% in 2010) to total Western Cape provincial mango exports. Another significant role player in the Western Cape during the last decade is the Cape Winelands. It contributed 11.9% to total mango exports by the Western Cape province during 2010.
20

Table 7: Share of district mango exports to the Gauteng provincial mango exports (%), 2001 – 2010 Years District
2001 2002 2003 2004 2005 2006 2007 2008 2009 2010
Gauteng 100.0 100.0 100.0 100.0 100.0 100.0 100.0 100.0 100.0 100.0 Metsweding 0.0 9.1 40.2 0.0 0.0 0.0 0.0 0.0 0.0 0.0 West Rand 3.7 3.2 0.2 0.0 0.0 2.2 1.3 0.0 0.0 0.2 Ekurhuleni 0.9 2.3 1.3 68.2 84.3 93.7 93.6 96.4 91.1 93.4 City of Joburg 94.7 85.4 58.3 28.6 15.7 2.4 5.2 3.6 8.9 6.4 City of Tshwane 0.7 0.0 0.1 3.2 0.0 1.7 0.0 0.0 0.0 0.0 Source: Calculated from Quantec Easydata In the Gauteng province, the district contributions are mainly distributed among the Ekhuruleni and City of Johannesburg districts (see Table 7). The Ekhuruleni district accounted for 93.4% of total provincial mango exports from Gauteng in 2010, while the City of Johannesburg contributed 6.4 percent. Table 8: Share of district mango exports to the Eastern Cape provincial mango exports (%), 2001 – 2010 Years District
2001 2002 2003 2004 2005 2006 2007 2008 2009 2010
Eastern Cape 0.0 0.0 100.0 0.0 0.0 0.0 0.0 0.0 0.0 0.0
Amatole 0.0 0.0 100.0 0.0 0.0 0.0 0.0 0.0 0.0 0.0 Source: Calculated from Quantec Easydata
2.5 Imports Volumes of South Africa’s mango imports from the different regions of the world during the last ten years are presented in Figure 18. The quantity imported declined from 731 tons in 2001 to 305 tons in 2010, a drop of 58% in ten years. Imports peaked at 823 tons in 2007 and were at their lowest during 2010 at 305 tons. The biggest supplier of South Africa’s mango imports is Africa, accounting for 63% of the country’s total mango imports in 2010. Africa was followed by Asia at 37% during the same year.
21
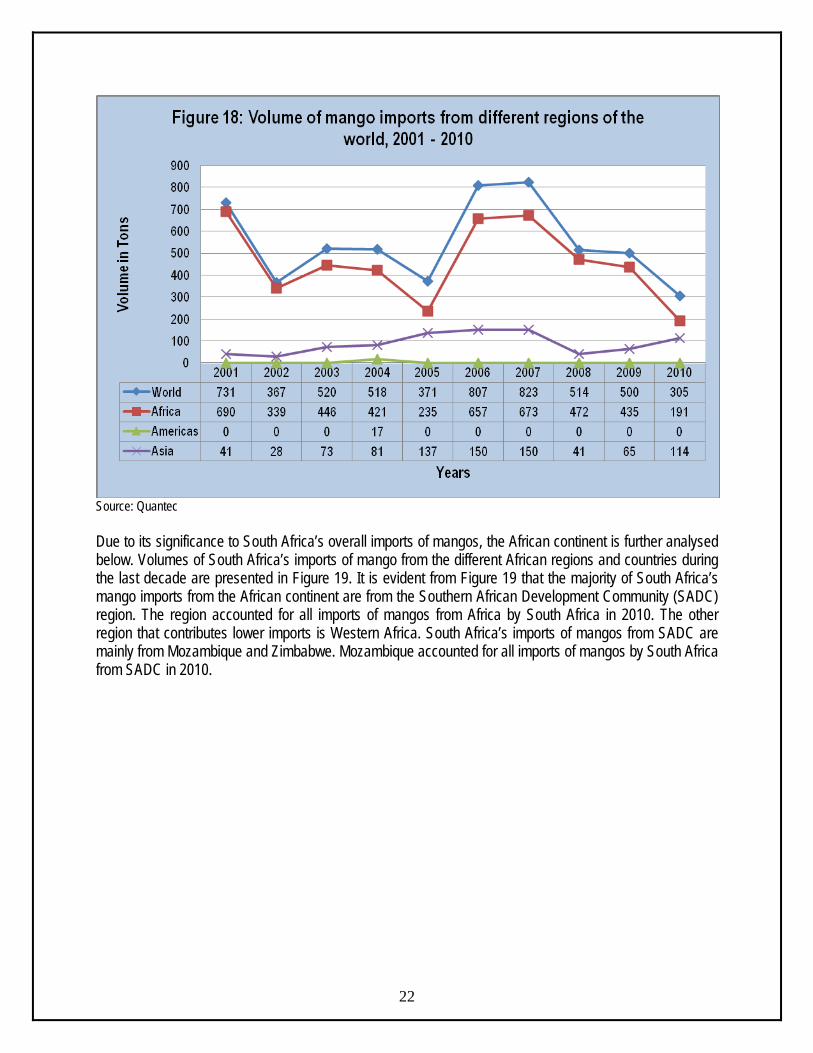
Source: Quantec Due to its significance to South Africa’s overall imports of mangos, the African continent is further analysed below. Volumes of South Africa’s imports of mango from the different African regions and countries during the last decade are presented in Figure 19. It is evident from Figure 19 that the majority of South Africa’s mango imports from the African continent are from the Southern African Development Community (SADC) region. The region accounted for all imports of mangos from Africa by South Africa in 2010. The other region that contributes lower imports is Western Africa. South Africa’s imports of mangos from SADC are mainly from Mozambique and Zimbabwe. Mozambique accounted for all imports of mangos by South Africa from SADC in 2010.
22

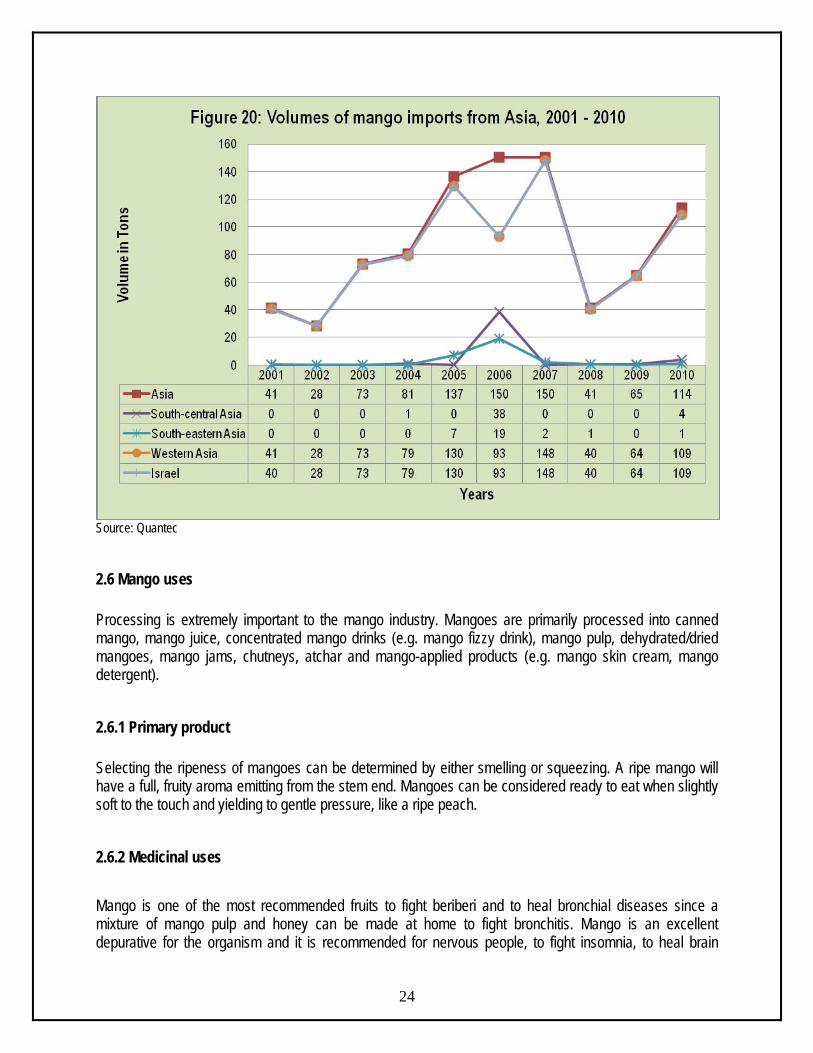
Source: Quantec The other important continent in the supply of mangos to South Africa is Asia. Volumes of mango imports by South Africa from the different Asian regions and countries during the past ten years are presented in Figure 20. The majority of South Africa’s mango imports from the Asia continent originates from the Western Asia region. Within Western Asia, the major contributor to South Africa’s imports of mangos is Israel. Imports from Israel rose from 40 tons in 2001 to 109 tons in 2010, an increase of 173% in ten years.
23
Source: Quantec
2.6 Mango uses Processing is extremely important to the mango industry. Mangoes are primarily processed into canned mango, mango juice, concentrated mango drinks (e.g. mango fizzy drink), mango pulp, dehydrated/dried mangoes, mango jams, chutneys, atchar and mango-applied products (e.g. mango skin cream, mango detergent).
2.6.1 Primary product Selecting the ripeness of mangoes can be determined by either smelling or squeezing. A ripe mango will have a full, fruity aroma emitting from the stem end. Mangoes can be considered ready to eat when slightly soft to the touch and yielding to gentle pressure, like a ripe peach.
2.6.2 Medicinal uses
24
Mango is one of the most recommended fruits to fight beriberi and to heal bronchial diseases since a mixture of mango pulp and honey can be made at home to fight bronchitis. Mango is an excellent depurative for the organism and it is recommended for nervous people, to fight insomnia, to heal brain
25
fatigue, mental depression and as a laxative. It is very helpful to fight heartburn. It has excellent results when used to eliminate kidney sand and to assist digestion. Mangoes, beyond being delicious and rich in vitamins, minerals and anti-oxidants, contain enzymes with stomach soothing properties. Mangoes are an excellent source of Vitamins A and C, as well as a good source of Potassium and contain beta-carotene. Mangoes are high in fibre, but low in calories (approx. 110 per average sized mango), fat (only 1 g) and sodium. Mangoes are a good staple for a daily diet.
2.6.3 By-products Mango kernel contains high amounts of fat and starch. The oil extracted from kernel is of good quality and could be used in cosmetic and soap industries. The kernel flour (starch) after mixing with wheat or maize flour is used in chapaties in India. About ten percent alcohol could be obtained from mango kernel by co-culture fermentation.
3. MARKET INTELIGENCE
3.1 Competitiveness of South African mango exports Competitiveness is described as an industry’s capacity to create superior value for its customers and improved profits for the stakeholders in the value chain. The driving force in sustaining a competitive position is productivity that is output efficiency in relation to specific inputs with regard to human, capital and natural resources. In 2010 South African mango exports represented 0.62% of world exports and its ranking on the world exports was number 25. Figure 21 illustrates growth in demand for South African mangoes in 2010. As depicted in Figure 21, South Africa’s mango exports are growing faster than the world imports in Zambia and Spain. South Africa’s performance in those markets can be regarded as gains in dynamic markets. At the same time, South African mango exports are growing while the world imports are declining in Canada, Japan, Indonesia, France, Belgium and Australia markets. South Africa’s performance in those markets can be regarded as gains in declining markets and should be viewed as achievement in adversity. South African mango exports have declined faster than the world imports in Ghan, United Kingdom and Singapore markets. South Africa’s performance into those markets can be regarded as loss in declining markets. South African mango exports have declined while the world imports have improved in Switzerland, United Arab Emirates, Italy and Saudi Arabia markets. These are dynamic markets and South African performance should be regarded as an underachievement.

Figure 21: Growth in demand for the South African mangoes in 2010
26
Source: TradeMap, ITC
South African mangoes’ prospects for market diversification in 2010 are shown in Figure 22. The European Union as well as the United States of America holds a bigger market share of South African mango exports. In terms of market size, the USA was the largest mango importer in 2010 with just over $345 million worth of mango imports, or roughly 22.2% of the world mango market. Second was the Netherlands with just over $159 million worth of mango imports, or roughly 10.2% market share followed by China with just over $155 million worth of mango imports, or roughly 9.9% market share. Whilst three countries dominate world mango imports, it is interesting to note that countries like Zimbabwe, together with Italy, Zambia and Turkey have experienced higher annual growth rates in value in terms of mango imports from 2006 – 2010. Zimbabwe experienced an annual growth rate of 68%. Second was Italy with 23% annual growth rate followed by Zambia (20%) and Turkey (14%). Even though growth by all these mentioned countries has been off a relatively lower base, these countries represent possible lucrative markets for South African mango producers. It is also important to note that mango imports from the world to countries such as Ghana, France, Belgium and Singapore have declined from 2006 – 2010 and as a result those countries have recorded negative growth rates in mango imports.
27

Figure 22: South African mangoes’ prospect for market diversification in 2010
28
Source: TradeMap, ITC

4. MARKET ACCESS Barriers to trade can be divided into tariff barriers (including quotas, ad valorem tariffs, specific tariffs and entry price systems) and non tariff barriers (sanitary and phytosanitary measures, labels, etc). The main markets for fruit (including mango) employ various measures, both tariff and non tariff to protect the domestic industries. Whilst many of the non tariff measures can be justified under the auspices of issues such as health and standards, the tariff measures are increasingly under the scrutiny of the World Trade Organization (WTO), and as such are gradually being phased out. Nevertheless, exporters need to be aware of all the barriers that they may encounter when trying to get their produce onto foreign shelves.
4.1 Tariffs, quotas and the price entry system Tariffs are either designed to earn government revenue from products being imported or to raise the price of imports so as to render local produce more competitive and protect domestic industries. Quotas can be used to protect domestic industries from excessive imports originating from areas with some form of competitive advantage (which can therefore produce lower cost produce). Tariffs and quotas are often combined, allowing the imports to enter at a certain tariff rate up to a specified quantity. Thereafter, imports from that particular region will attract higher tariffs, or will not be allowed at all. This phenomenon is referred to as tariff-rate quotas (TRQs). The entry price system, which is used in many northern hemisphere markets, makes use of multiple tariff rates during different periods when domestic producers are trying to sell their produce, and lower the tariffs during their off-season. Alternatively, the tariff rate can be a function of a market price – if the produce enters at a price which is too low (and therefore likely to be too competitive), it qualifies for a higher tariff schedule. Whilst tariff regulations can be prohibitive and result in inferior market access, it is often the non tariff barriers that restrict countries like South from successfully entering the large developed markets. Many of these barriers revolve around different types of standards, including sanitary and phytosanitary standards (SPS), food health and safety issues, food labelling and packaging, organic produce certification, quality assurance and other standards and grades. Table 9 presents tariffs applied by the top-ten export markets to mangoes originating from South Africa during 2010. The EU is treated as one country because all member states apply the same tariff on mangos originating from South Africa. During 2010 the EU member states that featured in the list of the top-ten importers of South African mangos were the UK, France, Netherlands, Germany, Spain, Belgium, and Italy. Table 9: Tariffs applied by top-ten export markets to mangos (fresh or dried) from South Africa
29
COUNTRY HS CODE PRODUCT DESCRIPTION TRADE
REGIME APPLIED TARIFFS
TOTAL AD VALOREM EQUIVALENT TARIFF
08045000 Goyaves, mangues et mangoustans, frais ou secs
MFN duties (Applied)
8.86 $/Ton 0.27% Switzerland
08045000 Goyaves, mangues et Preferential tariff 0.00% 0.00%

COUNTRY HS CODE PRODUCT DESCRIPTION TRADE
REGIME
TOTAL AD APPLIED VALOREM TARIFFS EQUIVALENT
TARIFF
30
mangoustans, frais ou secs for SACU countries
08045040 Guavas, mangoes, and mangosteens, fresh, if entered during the period September 1 through May 31, inclusive
Preferential tariff for GSP countries
0.00% 0.00%
08045060 Guavas, mangoes, and mangosteens, fresh, if entered during the period June 1 through August 31, inclusive
Preferential tariff for GSP countries
0.00% 0.00% United States of America
08045080 Guavas, mangoes, and mangosteens, dried
Preferential tariff for GSP countries
0.00% 0.00%
European Union 0804500020 Fresh or dried guavas, mangoes and mangosteens : Mangos
MFN duties (Applied) 0.00% 0.00%
0804501000 Fresh or dried guavas, mangoes and mangosteens: Mangoes
MFN duties (Applied) 20.00% 20.00%
Ghana
0804509000 Fresh or dried guavas, mangoes and mangosteens: Other
MFN duties (Applied) 20.00% 20.00%
UAE 08045020
Dates, figs, pineapples, avocedos, guevas, mangoes and mangosteens, fresh or dried: Guavas, mangoes and mangosteens: Mangoes
MFN duties (Applied) 0.00% 0.00%
Saudi Arabia 08045020
Dates, figs, pineapples, avocedos, guevas, mangoes and mangosteens, fresh or dried: Guavas, mangoes and mangosteens: Mangoes
General tariff 0.00% 0.00%
Turkey 0804500000
Dates, figs, pineapples, avocados, guavas, mangoes B522 and mangosteens, fresh or dried: Guavas, mangoes and mangosteens
MFN duties (Applied) 45.00% 45.00%
Canada 8045000 Fresh or dried guavas, mangoes and mangosteens
MFN duties (Applied) 0.00% 0.00%
Indonesia 0804502000
Dates, figs, pineapples, avocados, guavas, mangoes and mangosteens, fresh or dried: Guavas, mangoes and mangoesteens: Mangoes
MFN duties (Applied) 20.00% 20.00%
Singapore 08045020 MANGOES FRESH OR DRIED (TNE)
MFN duties (Applied) 0.00% 0.00%

COUNTRY HS CODE PRODUCT DESCRIPTION TRADE
REGIME
TOTAL AD APPLIED VALOREM TARIFFS EQUIVALENT
TARIFF
Australia 08045000 Fresh or dried guavas, mangoes and mangosteens
MFN duties (Applied) 0.00% 0.00%
Source: MacMap, ITC South Africa has a preferential trading agreement (PTA) with the EU. This provides for free entry of South African mango exports in the EU. Furthermore, countries such as USA and Switzerland have a GSP system in place, for which South Africa qualifies. South African mangoes face a high tariff of 45% in the Turkish market. Ghana and Indonesia also apply a 20% tariff on mango imports originating from South Africa. In reality, the tariffs are likely to be far lower for South Africa when considering the preferential agreements, but at the same time, most tariff structures are particularly complex, with quotas, seasonal tariffs and specific tariffs (an amount per unit rather than a percentage of value) all contributing to many different tariff lines and often higher duties payable than one might have anticipated initially. One must also bear in mind that most tariffs are designated to protect domestic industries, and as such are likely to discriminate against those attempting to compete with the domestic producers of that country.
4.2 European Union (EU) The EU has a seasonal tariff structures which are highest during the European peak harvesting seasons (the price entry system), quotas and specific tariffs, and various policies that allow, amongst other things, government organizations to purchase produce should supply rise too quickly (and thereby maintain prices), and then release this excess back onto the market as and when supply drops again. The immediate implication of these policies for South Africa is that an opportunity exists to supply mangoes to the European market in the off season periods, as the produce will not compete directly with the European producers and thus would not be liable to a whole array of tariffs and other protective mechanisms. There are other non-tariff barriers, including the phytosanitary and food health regulations laid down by the EU legislation, marketing standards and certificates of conformity, and the ever changing demand patterns of the EU consumers.
4.2.1 Tariff barriers
31
The EU applies a system known as entry price system. With this system, the EU establishes an ‘entry price’ at which produce may enter the EU market, which is not only based on the market price for the current year (demand and supply) and for previous years, but also on the prices of the domestic producers (prices they need to maintain profitability). It is calculated by the regulatory authorities so that it can be used in combination with tariffs and quotas to aid EU’s attempts at protecting its agricultural system. The entry price is the minimum price at which produce may enter the market. If the price of the produce is lower than its calculated price, it is liable to have duties imposed upon it over and above any duties/quotas it might originally attract. Agricultural duties are applied as follows:

• When the value of the imported party is between 92% and 94% of the entry price, 8% of the entry
price will be added to the normal customs duty. • When the value of the imported party is between 94% and 96% of the entry price, 6% of the entry
price will be added to the normal customs duty. • When the value of the imported party is between 96% and 98% of the entry price, 4% of the entry
price will be added to the normal customs duty. • When the value of the imported party is between 98% and 100% of the entry price, 2% of the entry
price will be added to the normal customs duty. There are tariffs applicable over and above the entry price tariffs, depending on the produce, where it originates from and whether that country has any preferential trading agreements with the EU.
4.2.2 Non tariff barriers Non tariff barriers can be divided into those that are mandatory and laid out in the EU Commission’s legislature and those that are a result of consumers, retailers, importers and other distributors’ preferences.
4.2.2.1 Legal requirements i) Product legislation: quality and marketing There are number of pieces of EU legislation that govern the quality of produce that may be imported, marketed and sold within the EU. They are as follows: General Food Law which covers matters in procedures of food safety and hygiene (micro-biological and chemical), including provisions on the traceability of food (for example, Hazard Analysis and Critical Control Points, or HACCP), and it is laid out under regulation EC 178/2002. EU Marketing Standards which govern the quality and labelling of fruit are laid out in the Common Agricultural Policy (CAP) framework under regulation EC 2200/96. These regulations include diameter, weight and class specifications, and any produce that does not comply with these standards will not be sold on the EU markets. Certificate of Conformity must be obtained by anyone wishing to export and sell fruits in the EU, if that fruit falls under the jurisdiction of the EU marketing standards. Certificate of Industrial Use must be obtained if the fruit is to be used in further processing. Maximum Residue Limits (MRL) of various pesticides allowed. ii) Product legislation: phytosanitary regulations
32

The international standard for phytosanitary measures was set up by the International Plant Protection Committee (IPPC) to protect against spreading of diseases or insects through the importation of certain agricultural goods. The EU has its own particular rules formalized under EC 2002/89, which attempts to prevent contact of EU of crops with harmful organisms from elsewhere in the world. The crux of the directive is that it authorizes the Plant Protection Services to inspect large number of fruit products upon arrival in the EU This inspection consist of physical examination of a consignment deemed to have a level of phytosanitary risk, identification of any harmful organisms and certification of the validity of any phytosanitary certificate covering the consignment. If the consignment does not comply with the requirements, it may not enter the EU although certain organisms can be fumigated at the expense of the exporter. iii) Product legislation: packaging The EU Commission lays down rules for materials that come into contact with food and which may endanger people’s health or bring about an unacceptable change in the composition of the foodstuffs. The framework legislation for this is EC 1935/2004. Recycling packaging materials are also emphasized under 94/62/EC, whereby member states are required to recycle between 50% and 65% of packaging waste. If exporters do not ship produce in packaging which is reusable, they may be liable for the costs incurred by the importing companies. Wood packaging is subject to phytosanitary controls and may need to undergo heat treatment, fumigation, etc.
4.2.2.2 Non-legal requirements To access the market, importers must not only comply with legal requirements set out above, but must also with market requirements and demands. For the most part, these revolve around quality and the perception of European consumers about environmental, social, health and safety aspects of both the products and the production techniques. Whilst supplying fruit that complies with these issues may not be mandatory in the legal sense, they are becoming increasingly important in Europe and cannot be ignored by existing or potential exporters. i) Social accountability is becoming important in the industry, not only amongst consumers, but also for retail outlets and wholesalers. The Social Accountability 8000 (SA 8000) certification is a management system based on International Labour Organization (ILO) conventions, and deals with issues such as child labour, health and safety, and freedom of association, and requires an on-site audit to be performed annually. The certificate is seen as necessary tool for accessing any European market successfully. ii) Environmental issues are becoming increasingly important with European consumers. Consumer movements are lobbying against purchasing non-environmentally friendly or non-sustainable produce. To this end, both governments and private partners have created standards (such as ISO 14001 and EUREGAP) and labels to ensure that produce adhere to particular specifications.
33
Although eco-labels (for example, the EU Eco-label, the Netherlands Milieukeur, the German Blue Angel and the Scandinavian White Swan) are voluntary, they can afford an exporter a marketing edge, as consumers wishing to purchase environmentally sound produce demand products that are easily recognizable.
Another important emerging label is Fairtrade, and includes those labels offered by Max Haavelaar Foundation, TransFair International and the FLO (Fairtrade Labelling Organization). Recently a ‘universal’ logo was adopted based on international fair trade standards developed by FLO, which covers amongst other things, minimum quality and price, various processing requirements, compensation of small farmers that covers sustainable production and living standards, and contracts that allow for long term planning and development.
4.2.2.3 Consumer health and safety requirements Increasing consumer conscience about health and safety issues has prompted a number of safety initiatives in Europe, such as EUREPGAP on good agricultural practices (GAP) by the main European retailers, the international management system of HACCP, which is independently certified and required by legislation for European producers as well as food imported into Europe (EC 852/2004), and the ISO 9000 management standards system (for producers and working methods) which is certified by the International Standards Organization (ISO).
4.3 United States of America (USA)
4.3.1 Tariff barriers South African exporters have completely free access to the USA markets under the Generalized System of Preference (GSP), the GSP for LCDs (Least Developed Countries) or the African Growth and Opportunity Act (AGOA). South African exporters must always compare with what Chile (the main supplier of fruit to the USA and South Africa’s potential rival) must pay in terms of tariff duties when exporting fruit to the USA. Chile’s access to the USA fruit market is considered to be highly preferential under its own Preferential Trade Agreement (PTA).
4.3.2 Non tariff barriers The USA’s phytosanitary regulation is conducted by Animal and Plant Health Inspection Service (APHIS), which is divided into nine sub-sections. Plant Protection and Quarantine (PPQ) and Veterinary Services (VS) are responsible for issuing permits for commodities and determining whether a commodity can be imported. The Policy and Program Development (PPD) division works with both these divisions in determining long term plans and procedures.
34
Some products can get pre-clearance from international Services (IS) personnel stationed in the country of origin, either at exporting terminals of site inspections. The PPQ’s main focus is to prevent the spread of diseases and pests into the USA’s agriculture resources, and it has personnel stationed at all airports, seaports and border stations that check imported cargo and oversee the quarantine process. Exporters or importers must make a request to export/import a commodity, provide as much information as possible on the product, its region of origin and its status that is whether there are restrictions or regulations governing
that particular product from that particular region before a permit is issued, along with the conditions of importation (disinfestations treatment) or mitigation measures. Denials can be challenged and governments and companies can request a change in the status of a prohibited commodity (an investigation must be performed by the PPQ scientific team), as long as sufficient conditions have changed or a risk assessment has not been conducted within the last 10 years. Most approved commodities can enter with inspection alone, but some may have to undergo mitigating measures including post-harvest treatments (hot/cold temperature treatments, irradiation or fumigation, depending on the requirements and which particular treatment is least harmful). The establishment of specifically and maintained pest-free areas in a country (which obviously requires extensive co-operation between the country’s plant health services and APHIS IS division) or systems approaches (field surveys, random inspections or various on site treatments. In addition to phytosanitary regulations, the USDA Food Safety Inspection Services (FSIS) regulates sanitary practices in the packing of food products, while the Food and Drug Administration (FDA), which is part of the US Department of Health, regulates packaging and labelling. The HACCP protocol is used extensively. The USDA quality standards for fruits and vegetables provide basis for domestic and international trade and promote efficiency in marketing and procurement.
5. DISTRIBUTION CHANNELS AND LOGISTICS There are roughly three distinct sales channels for exporting fruits. One can sell directly to an importer with or without the assistance of an agent (usually larger, well established commercial operations). One can supply fruits combined, which will then contract out importers/marketers and try to take advantage of economies of scale and increased bargaining power. At the same time combined fruits might also supply large retail chains. One can also be a member of a private or cooperative export organization which will find agents or importers and market the produce collectively. Similar to combined fruits, an export organization can either supply wholesale market or retail chains, depending on particular circumstances. Export organizations will wash, sort and package the produce. They will also market the goods under their own name or on behalf of the member, which includes taking care of labelling, bar-coding, etc. Most of the time, export organizations will enter into collective agreements with freight forwarders, negotiating better prices and services (more regular transport, lower peak season prices, etc). Some countries have institutions that handle all the produce (membership compulsory) and sell only to a restricted number of selected importers. Agents will establish contacts between producers/export organizations and buyers in the importing country, and will usually take between 2% and 3% commission. In contrast, an importer will buy and sell his/her own capacity, assuming the full risk (unless on consignment). They will also be responsible for clearing the produce through customs, packaging and assuring label/quality compliance and distribution of the produce. Their margins lie between 5% and 10%. The contract importers of fruit combines market and distribute the produce of the combines, clear it through customs and in some cases treat and package it.
35

Only few exporters have long term contracts with wholesale grocers who deliver directly to retail shops, but with the increasing importance of standards (EurepGap, etc) and the year round availability of fruit, the planning of long term contractual relationship is expected to increase.
6. LOGISTICS
6.1 Mode of transport The transport of fruits falls into two categories namely ocean cargo and air cargo. Ocean cargo takes much longer to reach the desired location but costing considerably less. The choice of transportation method depends, for most parts on the fragility of the produce and how long it can remain relatively fresh. With the advent of technology and container improvements, the feasibility, cost and attractiveness of sea transport have improved considerably. With the increased exports by South Africa, the number and the regularity of maritime routes have increased. These economies of scale could benefit South Africa if more producers were to become exporters and take advantage of the various ports which have special capabilities in handling fruit produce (for example Durban’s new fruit terminal).
6.2 Cold chain management Cold chain management is crucial when handling perishable products, from the initial packing houses to the refrigerated container trucks that transport the produce to the shipping terminals, through to the storage facilities at these terminals, onto actual shipping vessels and containers, and finally on to the importers and distributors that must clear the produce and transport it to the markets/retail outlets. For every 10 Degree Celsius increase above the recommended temperature, the rate of respiration and ripening of produce can increase twice or even thrice. Related to this are increasing important traceability standards which require an efficient controlled supply chain and internationally accepted business standards.
6.3 Packaging and marking requirements Packaging can also play an important role in ensuring safe and efficient transport of a product and conforming to handling requirements, uniformity recyclable material specifications, phytosanitary requirements, proper storage needs and even attractiveness for marketing purposes. The business panel of any carton (including printed carton labels) should comply with the requirements as established by the EU or any other regulations that are specified by a target market. Producers are advised to present their designs to the Perishable Products Export Control Board (PPECB) before they can order any cartons from a manufacturer. The following is normally required:
• Class I or II • Fruit type • Carton depth • Country of Origin: “Produce of South Africa”
36
• Complete address of exporter or producer

37
• Name of variety • Content of carton: “14 x punnets or bags” • PUC or PHC code: Registered producer – or Pack House Code with DAFF • Date code • Food safety accreditation number: Global Gap, Nature’s Choice registration number, etc
7. MANGO SUPPLY VALUE CHAIN A typical South African mango supply value chain is illustrated in Figure 23. The supply value chain consists of researchers who research and breed cultivars suitable to the South African environment. Mangos are produced in orchards. After harvesting, mangos are processed, sold locally through NFPMs, retailers and informal markets for fresh consumption, or exported. Processing entails slicing and canning, achar manufacturing, juice making and drying. The processed output is then sold both in the local and export markets.

Figure 23: Mango supply value chain
38
Research Breeding Plant development
Nursery
Production Orchard
Harvesting, transportation, packaging & storage
Fresh local market Processing market Export market
Achar Juice DriedCanning
Local and export markets
Consumers
Fresh produce markets
Retailers/ Informal markets
Consumers
Sea freight
Cold stores, terminals and depots
Containerised shipping
Cold stores, terminals and depots
Importer:
Air freight
Distribution Shelf Consumers

8. BUSINESS OPORTUNITIES AND CHALLENGES The processing industry (achar, a green pickled mango, mango puree for different mango juices and dried fruit) is developing at a rapid rate. The mango industry is currently facing the following challenges.
8.1 Climate
Due to the cyclical drought/rain periods (5 to 10 years), mangoes planted in different localities do not produce the same quality results. In dry cycles the wet areas close to the escarpment have good quality with low disease pressure and good yields. During wet cycles, areas further from the escarpment, dry areas experience less disease pressure. Higher rainfall causes higher disease levels of Anthracnose and Soft Brown Rot. Low lying areas with extended periods of night time temperatures below 8C are unfavourable for fruit set with most cultivars. Wind plays an important role on the spreading of diseases like Bacterial Black Spot. Climatic phenomena like El Niño and La Niña create periods of under or oversupply of mangoes on the markets, due to their influence on production i.e. rain (storm), drought damage and hot or cold temperatures during flowering.
The ideal planting would therefore be in a windless, low rainfall area, with night time temperatures of 10-15C and daytime temperatures of 20-35C, with sufficient underground or canal water supply systems for irrigation.
8.2 Diseases
There are numerous diseases, which cause problems for the mango producers of South Africa, but this review will deal with those that cause major economic losses.
The two main diseases causing serious economic losses and threatening the future existence of many South African mango producers are Bacterial Black Spot and Soft Brown Rot. Production areas with high wind incidence are susceptible to Bacterial Black Spot and areas with high rainfall are susceptible to Soft Brown Rot. Anthracnose (Colletotrichum gloeiosporioides) also causes serious economic losses but grading of fruit at pack houses with symptoms of pre-harvest Anthracnose (typical tear stain black spotted marks) and Bacterial Black Spot (small black spots with cracks), make these diseases less of an economic loss problem in the marketplace.
39
To control mango diseases application technology is very important to ensure maximum fruit cover at minimal chemical cost. Timing of applications coupled to timely follow up after heavy rainfall incidence is necessary to achieve control of pathogens. SAMGA recommends to producers to replace 20% of their total planting every third year, which ensures that maximum tree age is 15 years. This is very important for growing areas with higher rainfall resulting in more disease related problems. Pruning of unnecessary growth on the inside of trees together with cutting of windows to allow for spray penetration are essential with cultivars that have dense foliage. To maintain tree height and tree width according to the spray rigs technical capabilities are essential management tools.

8.3 Pests
The major pest problems, which restrict South African producers from exporting to new major markets, are mango weevils and fruit flies.
Mango weevil (Sternochetus mangiferae) is found in most of the southern continent countries and is listed as a major pest in Brazil, Australia, India and South Africa. From November onwards the weevil females lay their eggs on the peel of the fruit. They then bite into the peel next to the eggs, which causes sap to exude from the peel and to cover the eggs from natural enemies. These bite marks can be observed as small black marks on the fruit, which can be observed with (10 x) magnification hand lenses. Once egg laying has occurred spraying with a suitable insecticide must commence, within a four to seven day period.
Mango fruit flies namely Natal (Ceratitis rosa), Mediterranean (Ceratitis capitata) and Marula (Ceratitis cosyra), all cause problems for mangoes. Females lay their eggs under the peel of the fruit where they develop into larvae that feed on the fruit and secrete enzymes causing fruit to rot. With ideal weather conditions the full life cycle of the fruit flies is + 21 days. Monitoring with Census type M3 traps and determination of the threshold values will indicate when baiting with protein hydrolysate and suitable insecticides must commence to control these insects.
Integrated Pest Management (IPM) is a requirement to meet environmental standards required by the market. An entomologist from South Africa (Labuchagne et all., 1996) identified and imported a predator beetle Cybocephalus binotatus Grouvelle (Coleoptera:Nitidulidae), of scales Aulacaspis tubercularis Newstead (Homoptera:Cecidomyiidae), from India. This predator is presently being introduced to the commercial industry for marketing. The IPM compatibility of chemical insecticides with insect predators in South Africa is being investigated by (Greef et all., 1999).
8.4 Disease resistant cultivars
The most important cultivars planted in South Africa are Tommy Atkins, Sensation, Kent, Heidi, Keitt and Zill. Sensation and Zill are cultivars, which are losing their acceptability to consumers in Europe. Zill does not transport well and good external colour is only found in certain growing areas of South Africa. Sensation has got good external colour but internal maturity is variable within a single carton. Heidi is a cultivar developed in South Africa and is in high demand by South African consumers for its taste. Heidi does not travel well, is susceptible to cold damage and gives problems with fruit set in certain growing areas in South Africa.
40
Consumer preference studies conducted in Europe show that Tommy Atkins is not the preferred mango when tasting tests are conducted. Tommy Atkins has got good external colour, travels well but is much lower on the tasting list than both Kent and Keitt. Overproduction of Tommy Atkins by South Africa and its competitors is creating an oversupply in Europe specifically during the month of January. Consumers in Europe prefer Haden because of the external colour and taste, then Kent and Keitt for their taste and finally Tommy Atkins. Kent and Keitt are considered to be green coloured mangoes and are not as attractive as Tommy Atkins but consumers who appreciate the taste, prefer these green skins above Tommy Atkins. Disease resistance is an important production decision. Cultivars regarded as disease resistant not always purely because of inherent genetic resistance but sometimes due to early maturity. Cultivars listed in order of disease resistance are as follows Zill, Tommy Atkins, Heidi, Sensation, Kent and Keitt.
8.5 Nutrition
Nutrition is very important in determining quality of fruit externally and internally. Internal breakdown of fruit flesh with arrival on overseas markets, correlated with higher rainfall incidence in the production area, emphasizes the need for research to solve this complex subject. Different cultivars react differently to the same nutrition applications. Therefore individual treatment is required.
8.6 Competitiveness
South Africa has an exclusive marketing window from the third week in February to the end of March. Un-coordinated marketing leads to an oversupply situation, with importers not knowing what volumes to expect, or how to plan their promotions together with supermarkets. The South African season stretches from January to the middle of March. During January volumes from Brazil, Peru, Equador and Venezuela place a lot of pressure on the market. The West coast of Africa with countries like the Ivory Coast, Gambia, Burkino Faso and Mali supply fruit from the middle of March onwards.
Discussion and co-operation between South African producers, European importers and possibly other competitor countries supplying major volumes could alleviate possible oversupply market situations. South African producers have decided to summarise weekly consignment notes, which include information of the destination, cultivar and count volumes. This information is made available to all exporters who then inform their respective importers of the expected volumes. In the future it will pay competitor countries to make their information available to their importers on a weekly basis, so that an oversupply situation is avoided, thereby sustaining prices, which are sufficient to keep producers in production.
Presently the South African industry is experiencing a difficult economic period because of poor returns to producers, as a result of some of the factors covered in this article. The well being of producers will be determined by the effort of the researchers, marketing agents and processors who together with producers will forge and secure the future of the mango industry. Researchers will have to find solutions for problems causing serious economic losses, with ever increasing pressure from consumer groups who demand safe produce. The South African Industry, marketing agents and processors will have to develop new markets and promote brand or generic advertising to create consumer awareness and increase consumption. Market agents will have to take responsibility for the quality of the export and local market mangoes and insist on certain protocols for export producers. Active support with promotions and advertising will be essential in order to maintain market share in an increasingly competitive market, not only for fresh produce but also for a host of other consumer items. The producers will have to produce mangoes within the required size range, with good external colour, correct internal maturity and of good quality. Furthermore, a flow of information to the importers and consumers will provide the key for demand and sustainable long-term profitable production.
9. ACKNOWLEDGEMENTS The following industries/organizations are acknowledged. 9.1 South African Mango Growers Association (SAMGA) P. O. Box 2321
41
Tzaneen
42
0850 Tel: (015) 307 3513 Fax: (015)307 1511 www.mango.co.za 9.2 National Department of Agriculture, Forestry and Fisheries Directorate: Statistics and Economic Analysis Private X 246 Pretoria 0001 Tel (012) 319 84 54 Fax (012) 319 8031 www.nda.agric.za 9.3 Trade and Industrial Policy Strategies (TIPS) P. O. Box 11214 Hatfield 0028 Tel (012) 431 7900 Fax (012) 431 7910 www.tips.org.za 9.4 National Agricultural Marketing Council (NAMC) Private Bag X 935 Pretoria 0001 Tel (012) 341 1115 Fax: (086) 626 4769 www.namc.co.za 9.5 International Trade Centre (ITC) www.intracen.co.za Disclaimer: This document and its contents have been compiled by the Department of Agriculture, Forestry and Fisheries for the purpose of detailing mango industry. Anyone who uses this information does so at his/her own risk. The views expressed in this document are those of the Department of Agriculture with regard to agricultural industry, unless otherwise stated. The Department of Agriculture, Forestry and Fisheries therefore, accepts no liability that can be incurred resulting from the use of this information.