A Profile of Chronic Disease in Nevada Tracey Green, MD Nevada State Health Officer January 9-10...
34
A Profile of A Profile of Chronic Disease in Chronic Disease in Nevada Nevada Tracey Green, MD Nevada State Health Officer January 9-10 2012 Shaping a Healthy Nevada: Making a Difference in Chronic Disease Prevention and Health Promotion
-
Upload
nicholas-bradley -
Category
Documents
-
view
214 -
download
0
Transcript of A Profile of Chronic Disease in Nevada Tracey Green, MD Nevada State Health Officer January 9-10...

A Profile of A Profile of Chronic Disease in NevadaChronic Disease in Nevada
Tracey Green, MD Nevada State Health Officer
January 9-10 2012
Shaping a Healthy Nevada: Making a Difference in Chronic Disease Prevention and Health Promotion
Overview Characteristics Status Burden
Mortality Prevalence
Risk Factors Chronic Disease by:
Location Gender Race/Ethnicity
Nevada and National Rates – Health People 2020
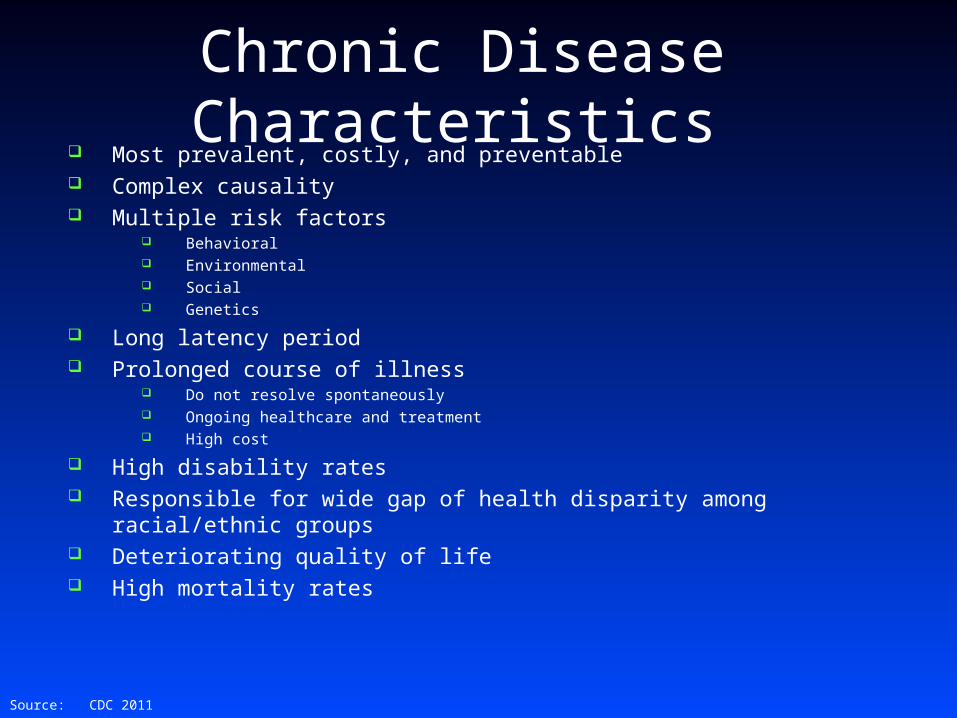
Chronic Disease Characteristics Most prevalent, costly, and preventable Complex causality Multiple risk factors
Behavioral Environmental Social Genetics
Long latency period Prolonged course of illness
Do not resolve spontaneously Ongoing healthcare and treatment High cost
High disability rates Responsible for wide gap of health disparity among racial/ethnic groups Deteriorating quality of life High mortality rates
Source: CDC 2011

4,657
4,335
1,075916
771
-
1,000
2,000
3,000
4,000
5,000
Fre
qu
ency
Heart Disease Cancer COPD Diabetes Stroke
Cause of Death
Five Leading Causes of Death, Nevada, 2010
Source: Nevada Electronic Death Registry 2011

All Other Causes37%
Heart Disease 25%
Cancer23%
Stroke4%
Diabetes5%
COPD6%
FiveFive Chronic Diseases Cause > 62% of Deaths in Nevada Chronic Diseases Cause > 62% of Deaths in Nevada
Source: Nevada Electronic Death Registry 2011
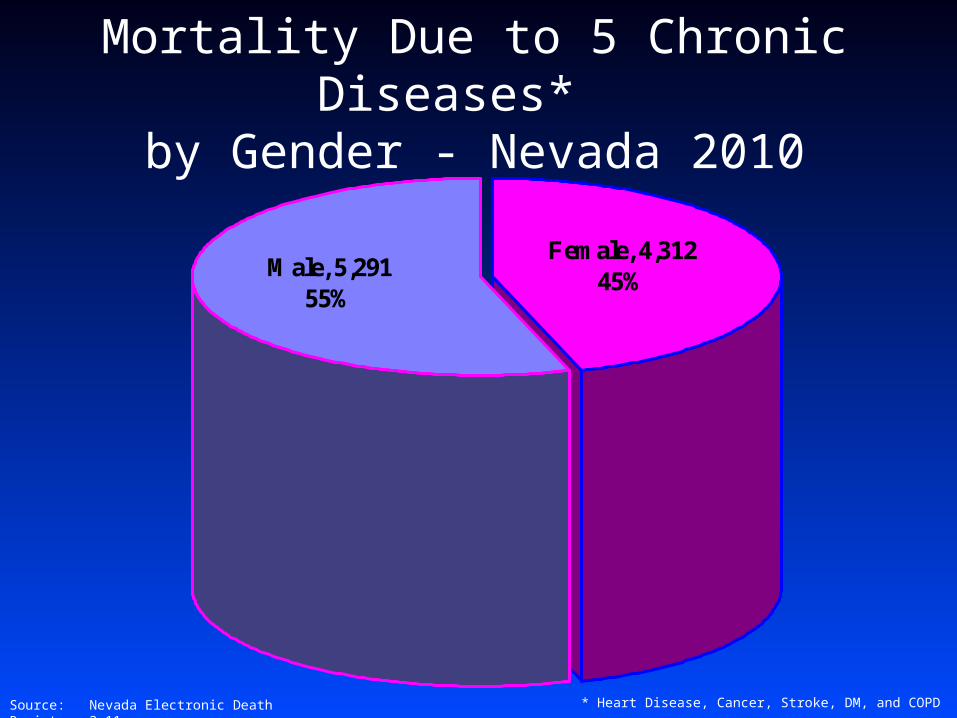
Mortality Due to 5 Chronic Diseases* by Gender - Nevada 2010
Female, 4,312 45%
Male, 5,291 55%
* Heart Disease, Cancer, Stroke, DM, and COPD Source: Nevada Electronic Death Registry 2-11
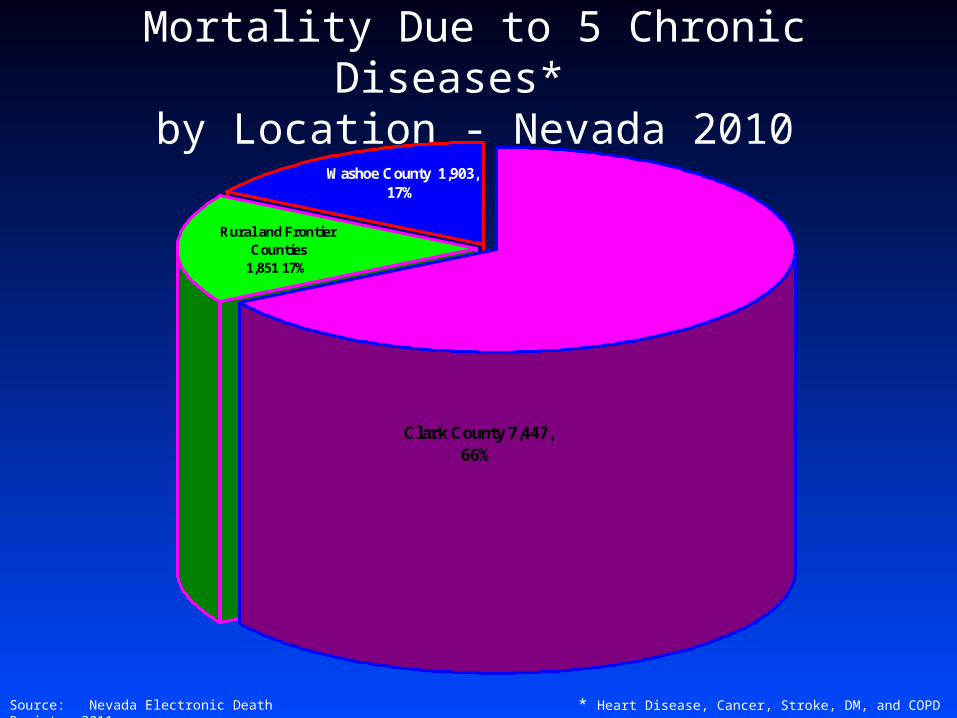
Mortality Due to 5 Chronic Diseases* by Location - Nevada 2010
Rural and Frontier Counties
1,851 17%
Washoe County 1,903, 17%
Clark County 7,447, 66%
* Heart Disease, Cancer, Stroke, DM, and COPD Source: Nevada Electronic Death Registry 2011

626.5
480.8458.3
438.2
266.5
-
200
400
600
800
AfricanAmerican
Caucasian Asian PacificIslander
Hispanic American Indian
Race/Ethnicity
Mortality Due to Chronic Disease* by Race/Ethnicity - Nevada 2010
Source: Nevada Electronic Death Registry 2011 * Heart Disease, Cancer, Stroke, DM, and COPD
Age
-adj
uste
d D
eath
Rat
e pe
r 100
,000
(US
Stan
dard
Pop
ulati
on 2
000)

0
50
100
150
200
250
2006 2007 2008 2009 2010
Heart Disease
Cancer
COPD
Stroke
Diabetes
Chronic Disease* Five Years Mortality TrendsNevada – 2010
* Heart Disease, Cancer, Stroke, DM, and COPD
Age
-adj
uste
d D
eath
Rat
e pe
r 100
,000
(US
Stan
dard
Pop
ulati
on 2
000)
Year
Source: Nevada Electronic Death Registry

0
20
40
60
80
100
120
140
160
180
200
Heart Disease Cancer COPD Stroke Diabates
Chronic Disease Moratlity Rates - 2009 Nevada National Average
Age
-adj
uste
d D
eath
Rat
e pe
r 100
,000
(US
Stan
dard
Pop
ulati
on 2
000)
Disease
Source: Nevada Electronic Death Registry and CDC 2010
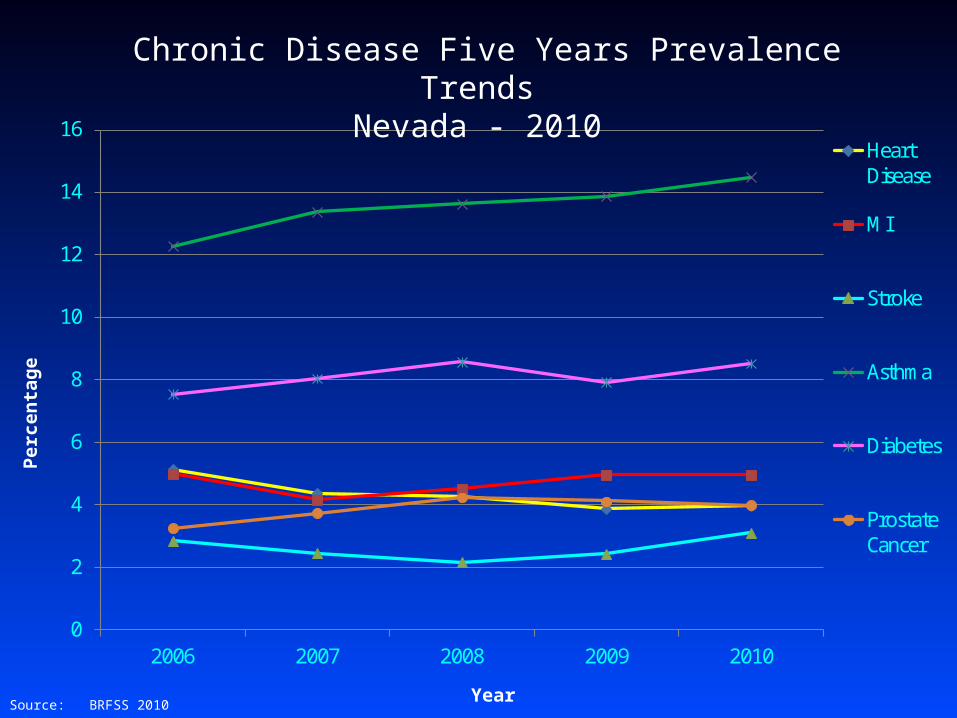
0
2
4
6
8
10
12
14
16
2006 2007 2008 2009 2010
Heart Disease
MI
Stroke
Asthma
Diabetes
Prostate Cancer
Chronic Disease Five Years Prevalence Trends Nevada - 2010
Per
cen
tag
e
Year Source: BRFSS 2010

65 to 8428%
85 and older 13%
0 to 24 3%
25 to 4412%
45 to 6444%
FiveFive Chronic DiseaseChronic Disease Hospitalization by Age Group –Hospitalization by Age Group – NevadaNevada 2010 2010
Source: Nevada Hospital Discharge Database 2010
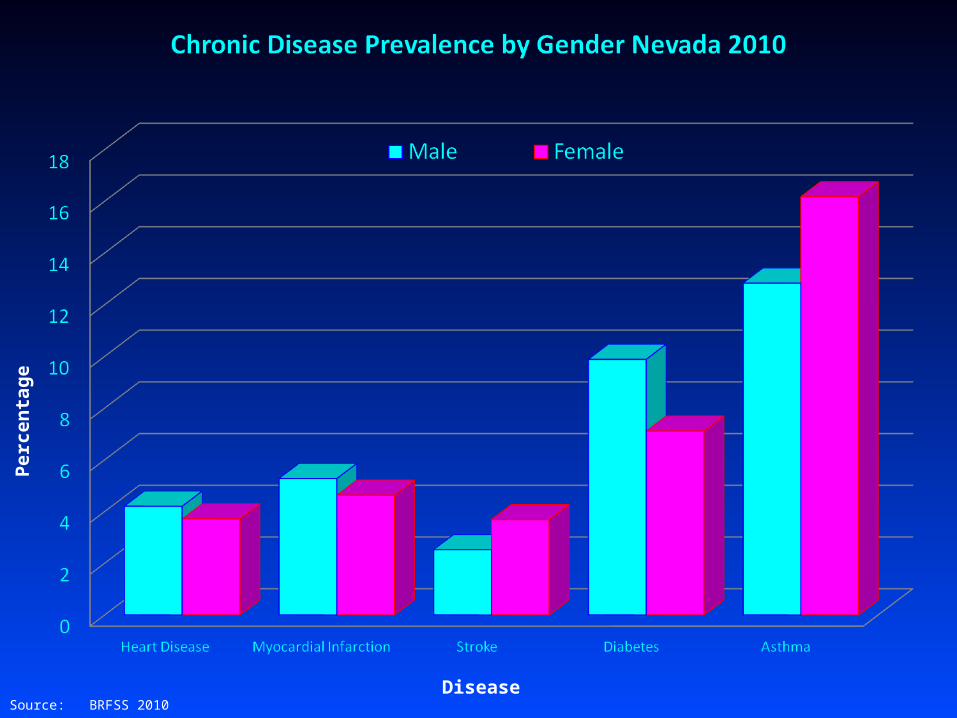
Source: BRFSS 2010
Per
cen
tag
e
Disease
0
1
2
3
4
5
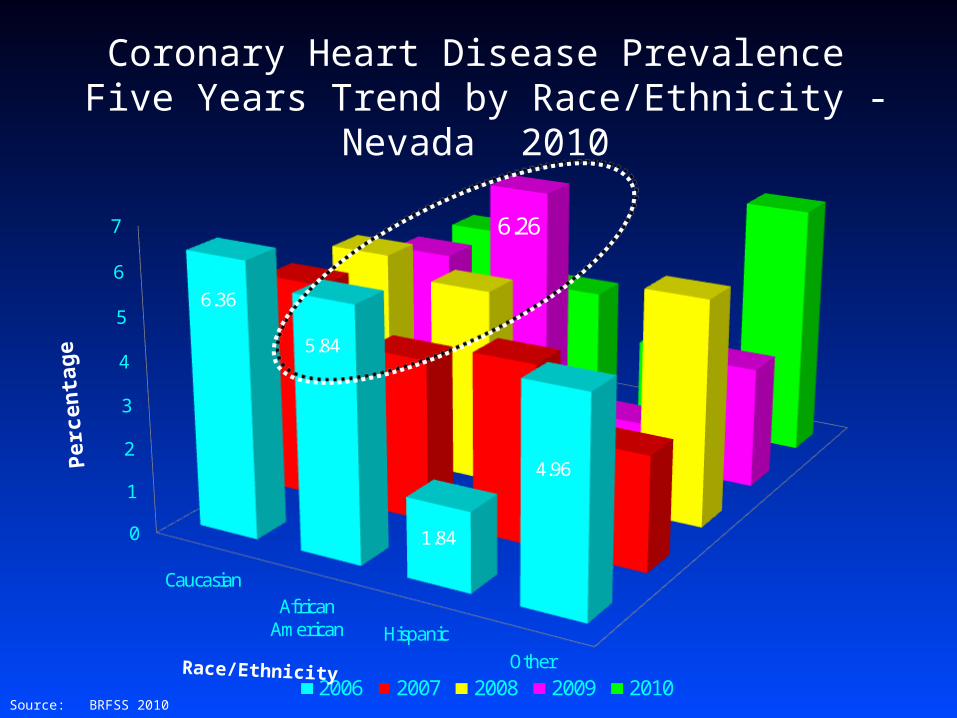
6
7
Caucasian African
American Hispanic Other
6.36
5.84
1.84
4.96
6.26
2006 2007 2008 2009 2010
Coronary Heart Disease Prevalence Five Years Trend by Race/Ethnicity - Nevada 2010
Per
cen
tag
e
Race/Ethnicity
Source: BRFSS 2010
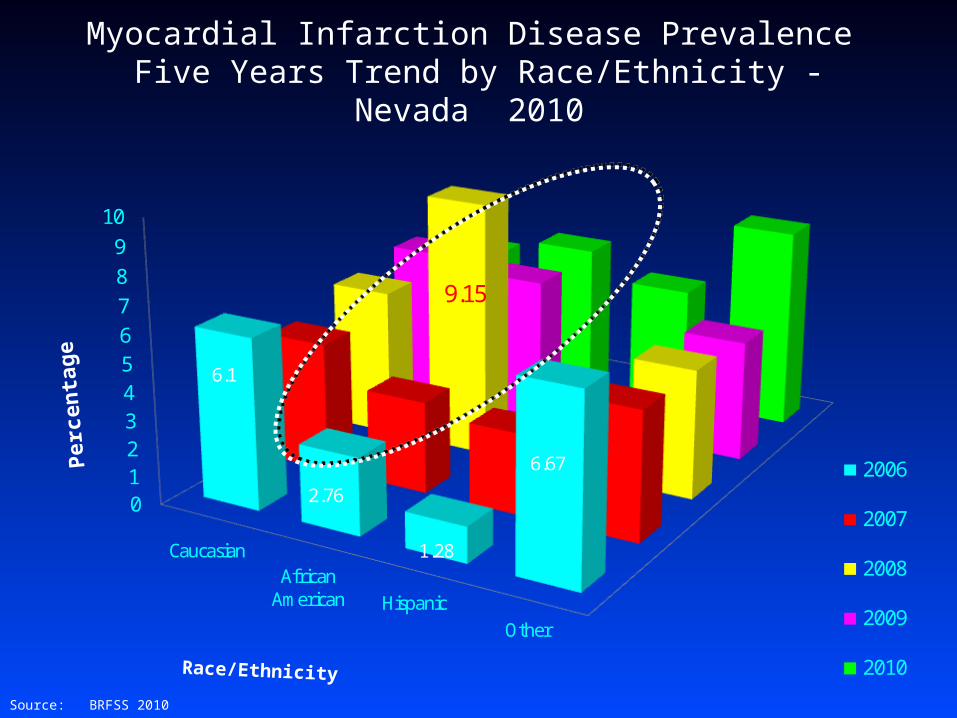
0123456789
10
Caucasian African
American Hispanic Other
6.1
2.76
1.28
6.67
9.15
2006
2007
2008
2009
2010
Myocardial Infarction Disease Prevalence Five Years Trend by Race/Ethnicity - Nevada 2010
Per
cen
tag
e
Race/Ethnicity
Source: BRFSS 2010

02468
10
12
14
CaucasianAfrican
American Hispanic Other
7.9
12.8
5.348.08
12.45
2006
2007
2008
2009
2010
Diabetes Prevalence Five Years Trend by Race/Ethnicity - Nevada 2010
Per
cen
tag
e
Race/Ethnicity
Source: BRFSS 2010

0
5
10
15
20
25
CaucasianAfrican
American Hispanic Other
13.28
9.63
6.99
17.84
13.4
2006
2007
2008
2009
2010
Asthma Prevalence Five Years Trend by Race/Ethnicity - Nevada 2010
Per
cen
tag
e
Race/Ethnicity
Source: BRFSS 2010

0
1
2
3
4
5
CaucasianAfrican
American Hispanic Other
3.54
0.670.98
3.33
4.7
2006
2007
2008
2009
2010
Stroke Prevalence Five Years Trend by Race/Ethnicity - Nevada 2010
Per
cen
tag
e
Race/Ethnicity
Source: BRFSS 2010

0
1
2
3
4
5
6
7
Caucasian
African American Hispanic
Other
3.42 4
2.35
2.88 2006
2008
2010
Prostate Cancer Prevalence* Five Years Trend by Race/Ethnicity - Nevada 2010
Per
cen
tag
e
Race/Ethnicity
Source: BRFSS 2010 *Prostate cancer questions are asked every other year on BRFSS

0
10
20
30
40
50
2006 2007 2008 2009 2010
Smoking
Overweight
Physical Inactivity
Hypertension
High Blood Cholesterol
Prevalence of Chronic Disease Risk FactorsFive Years* Trend - Nevada 2010
* Only 2 years of high blood cholesterol and hypertension prevalence
Per
cen
tag
e
Year
Source: BRFSS 2010

0
5
10
15
20
25
30
35
40
45
Smoking Overweight Physical Inactivity Hypertension High Blood Cholesterol
Prevalence of Chronic Disease Risk Factors by Gender Nevada 2009 Male Female
Per
cen
tag
e
Risk Factor Source: BRFSS 2010
0
5
10
15
20
25
30
Caucasian African
American Hispanic Other
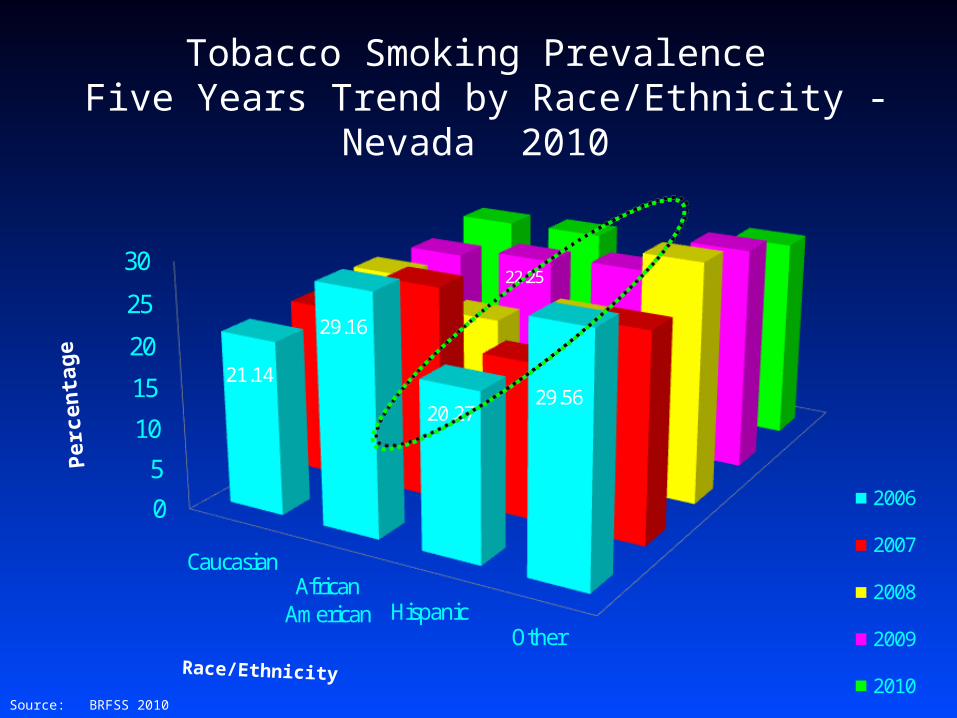
21.14
29.16
20.2729.56
22.25
2006
2007
2008
2009
2010
Tobacco Smoking Prevalence Five Years Trend by Race/Ethnicity - Nevada 2010
Per
cen
tag
e
Race/Ethnicity
Source: BRFSS 2010
0
10
20
30
40
50
Caucasian African
American Hispanic Other
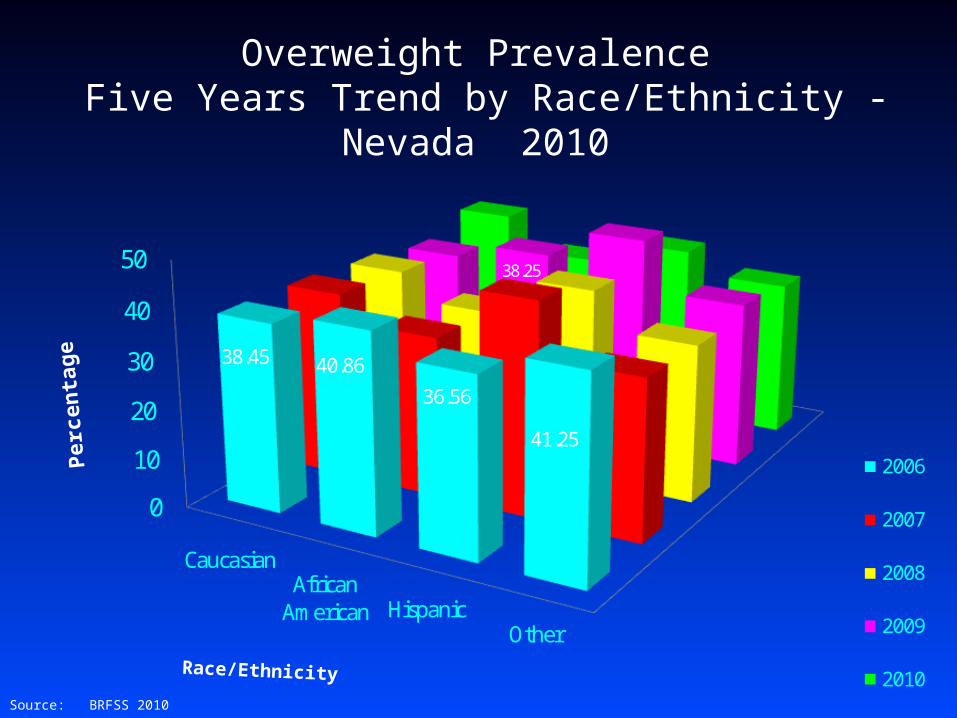
38.45 40.86
36.56
41.25
38.25
2006
2007
2008
2009
2010
Overweight Prevalence Five Years Trend by Race/Ethnicity - Nevada 2010
Per
cen
tag
e
Race/Ethnicity
Source: BRFSS 2010

0
10
20
30
40
Caucasian African
American Hispanic Other
22.56
31.25
37.19
28.99
25.83
2006
2007
2008
2009
2010
Physical Inactivity Prevalence Five Years Trend by Race/Ethnicity - Nevada 2010
Per
cen
tag
e
Race/Ethnicity
Source: BRFSS 2010
0
10
20
30
40
Caucasian African
American Hispanic Other
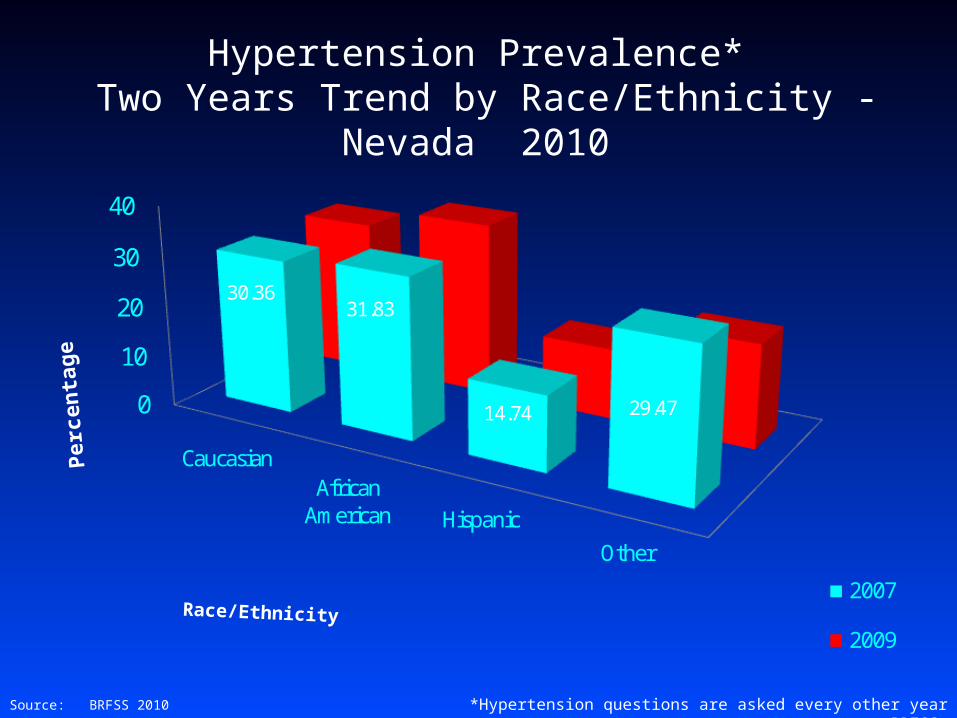
30.3631.83
14.74 29.47
2007
2009
Hypertension Prevalence* Two Years Trend by Race/Ethnicity - Nevada 2010
Per
cen
tag
e
Race/Ethnicity
Source: BRFSS 2010 *Hypertension questions are asked every other year on BRFSS

010
20
30
40
50
Caucasian African
American Hispanic Other
39.94
38.34
28.74
30.97
2007
2009
High Blood Cholesterol Prevalence* Two Years Trend by Race/Ethnicity - Nevada 2010
Per
cen
tag
e
Race/Ethnicity
Source: BRFSS 2010 *High blood Cholesterol questions are asked every other year on BRFSS

0
5
10
15
20
25
30
35
Physical Inactivity Obesity Tobacco Use
Prevalence of Disease Risk Factors Healthy People 2020 and Nevada 2010
Nevada Healthy People 2020
Per
cen
tag
e
Risk Factor Source: BRFSS 2010
0
5
10
15
20
25
30
35
40
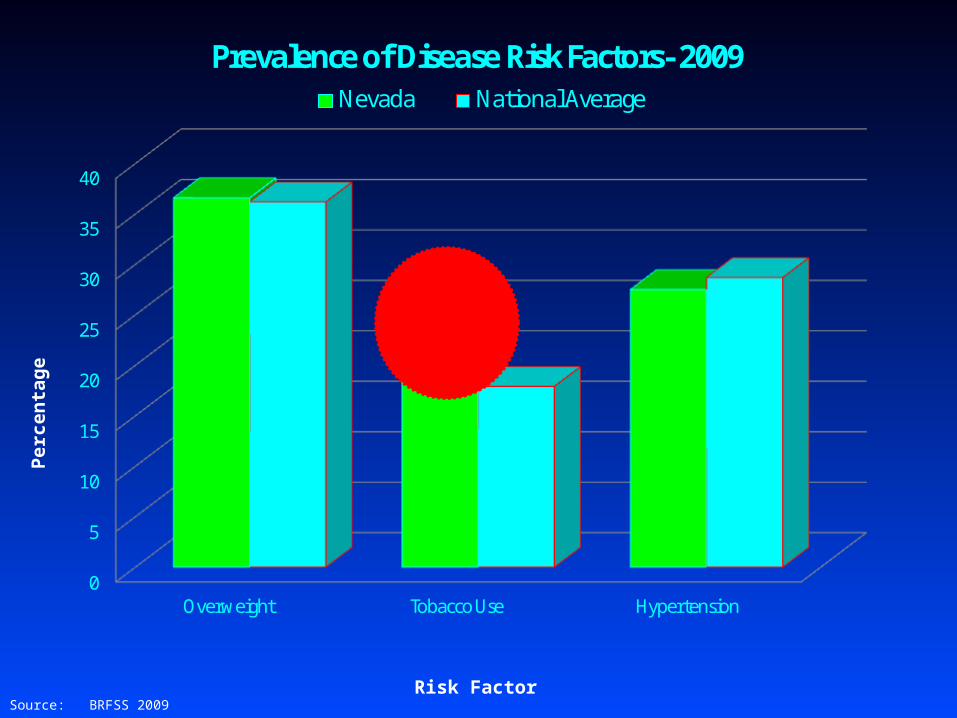
Overweight Tobacco Use Hypertension
Prevalence of Disease Risk Factors- 2009 Nevada National Average
Per
cen
tag
e
Risk Factor Source: BRFSS 2009

0
20,000
40,000
60,000
80,000
100,000
120,000
140,000
Cerebrovascular disease (Stroke)
Cancer Chronic Obstructive
Pulmonary Disease
Diabetes Mellitus Cardiovascular Diseases
Chronic Disease Hospitalization – Nevada 2010
Source: Nevada Hospital Discharge Database 2010

$56,000
$58,000
$60,000
$62,000
$64,000
$66,000
$68,000
$70,000
$72,000
$74,000
$76,000
Cerebrovascular disease (Stroke)
Cancer Chronic Obstructive Pulmonary Disease
Diabetes Mellitus Cardiovascular Diseases
Hospitalization - Average Cost per CaseNevada 2010
Source: Nevada Hospital Discharge Database 2010

Cerebrovascular disease (Stroke)
Cancer Chronic Obstructive Pulmonary Disease
Diabetes Mellitus Cardiovascular Diseases
$831,094,062
$1,740,469,388
$3,102,268,697 $3,289,274,461
$9,088,025,041
Source: Nevada Hospital Discharge Database 2010
Chronic Disease Hospitalization Cost - Nevada 2010

24%
11%
5%4% 1%
0%
5%
10%
15%
20%
25%
30%
1 2 3 4 5+
More than 1 in 5 Has Multiple Chronic Disease ConditionsMore than 1 in 5 Has Multiple Chronic Disease Conditions
21%
Prevalence of Multiple Chronic Prevalence of Multiple Chronic Disease Disease
ConditionsConditions
Source: UNR & Wu, Shin-Yi and Green, Anthony. Projection of Chronic Illness Prevalence October 2010
Number of Chronic ConditionsNumber of Chronic Conditions
Perc
enta
ge o
f N
evadans
Perc
enta
ge o
f N
evadans

Thank Thank You You
QUESTIONSQUESTIONS

Dr. Tracy Green, MD State Health Officer
Nevada State Health Division4150 Technology Way
Carson City, Nevada 89706Phone: (775) 684-4200