A Pressure sensitive Mat for Measuring Contact pressure ...
17
Purdue University Purdue e-Pubs Weldon School of Biomedical Engineering Faculty Publications Weldon School of Biomedical Engineering 1990 A Pressure sensitive Mat for Measuring Contact pressure Distributions of Patients Lying on Hospital Beds Charles F. Babbs Purdue University, [email protected] Joe D. Bourland George P. Graber James T. Jones William E. Schoenlein Follow this and additional works at: hp://docs.lib.purdue.edu/bmepubs Part of the Biomedical Engineering and Bioengineering Commons is document has been made available through Purdue e-Pubs, a service of the Purdue University Libraries. Please contact [email protected] for additional information. Recommended Citation Babbs, Charles F.; Bourland, Joe D.; Graber, George P.; Jones, James T.; and Schoenlein, William E., "A Pressure sensitive Mat for Measuring Contact pressure Distributions of Patients Lying on Hospital Beds" (1990). Weldon School of Biomedical Engineering Faculty Publications. Paper 72. hp://docs.lib.purdue.edu/bmepubs/72
Transcript of A Pressure sensitive Mat for Measuring Contact pressure ...

Purdue UniversityPurdue e-PubsWeldon School of Biomedical Engineering FacultyPublications Weldon School of Biomedical Engineering
1990
A Pressure sensitive Mat for Measuring Contactpressure Distributions of Patients Lying onHospital BedsCharles F. BabbsPurdue University, [email protected]
Joe D. Bourland
George P. Graber
James T. Jones
William E. Schoenlein
Follow this and additional works at: http://docs.lib.purdue.edu/bmepubs
Part of the Biomedical Engineering and Bioengineering Commons
This document has been made available through Purdue e-Pubs, a service of the Purdue University Libraries. Please contact [email protected] foradditional information.
Recommended CitationBabbs, Charles F.; Bourland, Joe D.; Graber, George P.; Jones, James T.; and Schoenlein, William E., "A Pressure sensitive Mat forMeasuring Contact pressure Distributions of Patients Lying on Hospital Beds" (1990). Weldon School of Biomedical Engineering FacultyPublications. Paper 72.http://docs.lib.purdue.edu/bmepubs/72

1
A Pressure sensitive Mat for Measuring Contact Pressure
Distributions of Patients Lying on Hospital Beds
CHARLES F. BABBS, MD, PhD, JOE D. BOURLAND, PhD, GEORGE P. GRABER, JAMES
T. JONES, WILLIAM E. SCHOENLEIN
Biomedical Engineering Center, Purdue University, West Lafayette, Indiana, USA.
[Biomedical Instrumentation & Technology, 24, 363-370, 1990]
ABSTRACT
The authors describe a novel system for sensing and displaying the distribution of contact
pressure caused by a patient's lying on a hospital bed. The system includes a flexible, pressure
sensitive mat, electronics to activate the mat, a small computer to process data, and a color video
display. The present prototypes can sense pressure at 1,536 discrete locations in a rectangular
grid of 24 x 64 nodes, each node representing an area of 4 cm2. The computer receives data from
each node and displays the results as a false-color map, refreshable every 5 seconds. The
pressure sensitive mat itself includes two orthogonal arrays of ribbon-like conductors, composed
of silver coated nylon fabric, which are separated by insulating open cell foam rubber. The
system monitors the electrical capacitance between selected pairs of horizontal and vertical
conductors on opposite sides of the foam. The crossing points form pressure sensitive nodes.
Increased contact pressure compresses the foam, thereby decreasing the distance between the
conductors and increasing the capacitance. Node capacitance is determined by measuring the
current through it from a voltage source. The outputs of the various nodes are scanned,
normalized, and converted to pressures using the known compressive stress strain relationship
for the foam, and the data are then displayed as a false-color image of the pressure distribution.
Supported by contract from Hill-Rom Company, Batesville, Indiana.

2
This report describes the creation of a contact pressure mapping system configured as shown in
Figure 1. The system was developed as a tool to study the clinical problem of pressure sores
(bedsores) and to aid in the design of improved hospital beds. Major components of the system
include a pressure sensitive mat that can be placed on top of a mattress to sense the weight
distribution of a person lying on it, an interface unit for supplying electrical driving signals to the
mat and for receiving pressure-related signals from the mat, and a small computer (IBM/XT)
with a floating-point processor and color graphics capability. The system creates images of the
distribution of contact pressures caused by a patient lying on a hospital bed with a spatial
resolution of about 2.5 cm. Such images allow the user to characterize high pressure regions that
contribute to the genesis of pressure sores. In addition to providing research data, the system may
serve as the progenitor of a family of computer controlled hospital beds that have the ability to
identify high pressure points and then to automatically contour the underlying surface to
eliminate them.
Figure 1. Overview of prototype system for contact pressure mapping. (a) The current
version includes a pressure sensitive pad incorporating 1,536 discrete pressure
sensitive nodes, an analog-to-digital interface unit, and a PC-based video display, on
which images of the pressure distribution are presented. (b) Detail of video output as
originally conceived. This image is a contour interval plot created by off-line
processing of uncalibrated data from an early prototype. Later versions of the system
utilized a false-color, pixel-by-pixel display that was computationally much faster to
create.

3
MATERIALS AND METHODS
Principle of Transduction
The basic construction of the pressure sensitive mat is illustrated in Figure 2. It includes a
compressible dielectric layer with two orthogonal arrays of flexible conductors, disposed on
opposite sides. The dielectric layer is an open cell foam having an unloaded thickness of about 5
mm. The flexible conductors are made of silver coated nylon fabric. The pressure sensitive mat
thus constitutes an array of soft, variable capacitors.
Figure 2. Simplified sketch of pressure sensitive mat construction. An array of variable
capacitors is formed by orthogonal strips of conducting fabric, separated by
compressible, insulating foam material. Crossing points of x and y elements constitute
pressure sensitive nodes. As normal force is applied to a node, the foam is compressed,
and the node capacitance increases.

4
Figure 3. Principle of pressure transduction illustrated in a schematic equivalent
circuit. Two sets of analog switches address pressure sensitive nodes, one set
functioning as a multiplexer, the other functioning as a demultiplexer. Horizontal lines
are drive lines; vertical lines are sense lines. C0 represents the selected node. Current
coupled from the drive line to sense line through C0 is a calibratabe function of
pressure. Cross-talk through unselected shunt capacitances is eliminated by
connecting unselected drive lines and sense lines to ground potential.
Pressure sensing is accomplished by measurements of the capacitance between selected pairs of
orthogonal conductors. This capacitance is confined largely to the zone of intersection and is a
function of contact pressure. Each such crossing point is defined as a pressure sensitive node.
The variation in capacitance caused by compression of the foam constitutes the principle of
transduction: as the separation of conductors is reduced by increasing normal force, the
capacitance of a node is increased. The grid-like arrangement of orthogonal rows and columns
leads naturally to computer controlled sampling of pressures at various x, y coordinates on the
surface and to generation of a matrix type display.
The equivalent circuit that is formed by the structure of Figure 2 is illustrated in Figure 3. By
way of example, a selected node, C0, and its eight nearest neighbors, C1 through C8, are
illustrated. One terminal of each capacitor in a row of the matrix is connected to one of the
terminals of the demultiplexer, and the other terminal of each capacitor in a column of the matrix
is connected to one of the terminals of the multiplexer. When it is desired to measure the
capacitance of a particular node, a driving signal having a known sinusoidal voltage is applied to
the row in which the node is located. The current from the measured capacitance is sensed via
the associated column electrode, which is connected to a current-sensing amplifier with low
(ideally zero) input impedance. The capacitance at the node is determined by the thickness of the
dielectric layer, which in turn is a function of pressure. A higher capacitance represents a thinner
dielectric layer and hence a greater applied pressure.

5
Two sets of digitally controlled analog switches are used to sample signals from the array of
nodes. The first, connected to a 5-kHz, 10-volt, sinusoidal voltage source, functions as a
demultiplexer. The second, connected to the sense amplifier, functions as a multiplexer. The
particular generator outputs of 5 kHz and 10 volts are not critical to system performance, and
represent compromise values based on considerations of patient safety, interference with other
equipment in the environment, sensitivity, speed of sampling, and ease of circuit fabrication.
Under computer control, these switches are used to measure the current through each node in
rapid succession. When it is desired to interrogate a node defined by a particular x, y coordinate,
the sense amplifier is switched to the x-th column of conducting fabric, and the voltage source is
switched to the y-th row. In practice, a stable signal is obtained about 1 msec after both
connections are made. After sampling, the next row or column in the array is then interrogated.
Elimination of Inter-node Interaction
One factor that must be addressed in the design of such a system is the potential electronic
interaction among nodes. In general, the current that is sensed in one column electrode is not
determined exclusively by the capacitance at the crossing point. Although the primary path from
the driving electrode to the sensing electrode is through the capacitor C0 in Figure 3, the driving
signal can also be coupled to the sense line via unselected capacitors C3, C2, and C1. If the
unselected rows are allowed to float electrically, some signal can be capacitively coupled in this
way form the drive line to adjacent columns, then to adjacent rows, and ultimately back to the
sense line. Changes in pressure (separation) at adjacent nodes can alter the amount of capacitive
coupling, and so the measured signal in the sense line.
In the present system, the effects of the surrounding nodes on the measured signal are eliminated
by connecting all of the unselected electrodes, other than the ones associated with the row and
column of interest, to ground. In practice, single-pole-double-throw switches connect the row
electrodes either to the voltage source or to ground. Similar switches connect the column
electrodes either to the current-sensing amplifier or to ground. Thus, all unselected electrodes in
the entire array are clamped at ground potential. As a consequence, spurious current coupling
between drive and sense electrodes through chains of unselected nodes is blocked, because the
voltage across at least two nodes in each such chain is zero. This design feature ensures that
changes in the capacitances of unselected nodes introduce no error in the output signal. The fact
that the column electrodes are clamped at ground potential and that the voltage on the selected
column electrode is, ideally, zero also eliminates error that would otherwise be caused by the
stray capacitance of the cable connecting the interface to the pressure sensitive mat.
Mat Design
During the course of development, pressure sensitive surfaces containing 2 x 2, then 16 x 16, and
finally 24 x 64 member arrays of pressure sensitive nodes were fabricated. The current method of
construction for the mat is illustrated in Figure 4. It comprises a symmetric integration of two
mats of the general type depicted in Figure 2. A central sensing electrode layer has insulating,
open cell foam layers disposed on both sides, which are in turn encompassed by driving

6
electrode layers. The three-electrode layers are composed of supporting non-conductive fabric, to
which the linear electrodes, composed of conductive fabric, are attached.
The electrically conducting fabric was silver coated nylon, obtained from Swift Textile
Metalizing Corporation, Hartford, CT 06101. In the current prototypes, conducting strips 2 cm
wide are sewn to three layers of supporting cotton fabric, separated by two layers of
compressible foam rubber (typically 5 mm thick) to form the five-layer sandwich design in
Figure 4. The two capacitors formed at each node are electrically in parallel but mechanically in
series. This design effectively doubles the capacitance of each node. The five-layer design also
provides shielding and symmetry to the system. Various types and thicknesses of foam can be
introduced between the conducting layers via side pockets that can be reversibly closed with
Velcro®
hook-and-loop tape. Alternate strips of conducting nylon are sewn on opposite sides of
the support fabric (dashed lines) to form an over-andunder pattern. This arrangement keeps
adjacent strips of conducting nylon from being shorted due to small wrinkles in the fabric of the
electrode layers. The nodes are aligned on 2.8-cm centers. There are 24 exterior, driven lines and
64 orthogonal, inner sense lines, making 1,536 pressure sensitive nodes.
Figure 4. Realistic sketch of the five-layer construction of the most advanced prototype
pressure sensitive mat. Three conducting layers are separated by two compressible
foam insulators. Parallel sense lines are included in the middle conducting layer: drive
lines are included in the top and bottom conducting layers. Pressure sensitive nodes
include two capacitances mechanically in series but electrically in parallel. Over-and-
under sewing of conducting fabric on opposite sides of cotton backing material (dashed
lines) minimizes shorting of silver coated nylon thread from adjacent conductors in the
same layer. The fivelayer design provides symmetry and shielding, and also doubles
the electrical signal.

7
The two exterior rows of conductors are electrically connected and driven by the 5-kHz voltage
source, and the columns of conductors in the middle layer are used for sensing. Accordingly,
each measuring node is defined by the area of intersection of a sensing electrode with an aligned
pair of driving electrodes. If the two electrodes in the upper and lower driving layers are not
perfectly aligned, the measured signal is not adversely affected; rather, any misalignment tends
to degrade the spatial resolution of the node.
In operation, the computer sends control signals to the interface unit to sequentially scan each of
the pressure sensitive nodes. This scanning is carried out through the coordinated addressing of
the driven electrodes and the sensing electrodes. The output signal from an individual pressure
sensitive node is a current. The input signal to the A/D converter of the computer is a voltage.
The analog interface circuitry converts the sensed current into a voltage, appropriately scaled for
the A/D converter. The computer calculates the applied pressure at each measured node from the
sensed signals in accordance with a previously determined calibration function that depends
upon the compressive stress-strain relationship for the particular foam inserted to form layers 2
and 4 of the five-layer pressure sensitive mat.
Foam Characteristics
Critical to performance of the system are the compressive stress-strain characteristics of the foam
rubber layers. The general nature of such curves is presented in Figure 5 for a typical synthetic
polyurethane foam. Digitized output voltage is plotted as a function of applied pressure, as a test
node is compressed by a flat rubber bladder connected to a mercury manometer. As increasing
pressure is applied from 0 to 100 mmHg, the output signal rises in a nonlinear fashion, reflecting
increased capacitance of the node. Curves for different nodes, indicated by the different symbols
in Figure 5, are not identical but have the same general shape. Various curve fitting routines can
be applied to represent the loading curves for the various nodes and in turn compute contact
pressure from the digitized output voltage. The present implementation uses a five coefficient
polynomial, similar to the functions described by Throne and Progelhof [l] and by Fabishak [2]
to represent the calibration curve for each node. By utilizing characteristic coefficients for each
individual node, the computer can minimize inter-node variations in the calibration function.

8
Figure 5. Representative calibration curves for the pressure sensitive mat loaded with
polyurethane foam (Stephenson and Lawyer, Type SL9 ether linked, open cell foam,
1/4 in). Digitized output is plotted as a function of applied pressure from an air inflated
bladder supported against the mat by a wooden frame to create compression normal to
the plane of the mat. Each curve represents a different pressure sensitive node.
Hysteresis
In the present pressure sensitive mat design, we have exclusively incorporated open cell foams
rather than closed cell foams, because closed cell foams proved to be insufficiently compliant to
produce readily measurable compressive strain in response to 10 to 100 mmHg stress, the desired
working range of the system. A major difficulty encountered in early tests utilizing open cell
foams was caused by hysteresis in the compression stress-strain relationship for such materials.
The curve traced during unloading of the material was markedly different from that traced during
loading (Figure 6), especially that traced during initial loading. This marked hysteresis of some
foams, which is well known [3], especially for foams that are not prestressed, made inference of
pressure from digitized voltage output highly dependent upon the compression history of the
foam. Fortunately, natural latex foams (¼ inch slab foam or ¼ inch pin-core foam, obtained from
Latex Foam Products. Inc., P.O. Box 525, Ansonia, CT 06401) exhibit substantially less
hysteresis than synthetic polyurethane foams (Figure 7). Moreover, the hysteresis of natural latex
can be further reduced by pre-compressing the material to 100 mmHg a single time prior to
making quantitative measurements. The hysteresis-reducing effects of prior compression last for
several hours, permitting repeated measurements with a precision of 2-3 mmHg. In addition,
natural latex exhibits negligible creep (i.e., continued slow deformation under pressure) and
acquires no permanent compression set under prolonged loading [4]. Accordingly, we have used
natural latex foams in all recent configurations of the pressure sensitive mat.

9
Figure 6. Stress-strain evaluation of high-hysteresis foam (Stephen and Lawyer Type
SL65-white, ¼ in). Triangles represent initial compression (loading) curve; circles,
unloading curve. Displacement on the vertical axis represents compression strain.
Separation of the curves represents an extreme case of foam compression hysteresis.
Figure 7. Hysteresis curve for low-hysteresis, natural latex foam (Latex Foam
Products, 2 x ¼ in bi-layer). Dashed line represents initial compression (loading)
curve; solid line, initial unloading curve, which was also nearly identical to subsequent
loading curves. Pre-stressing this foam abolished measurable hysteresis, which was
evident only on the first compression cycle. Digitized voltage output on the vertical axis
is a nearly linear function of the compression stress.

10
Figure 8. Calculated vs. actual pressures for 16 nodes after software assisted semi-
automated calibration. Calculated pressures were derived from 4th-order polynomials,
which characterized digitized output voltages, Eout, for each node as a function of
known calibration pressure. Data points represent results of a recalibration
experiment. All 16 separate points are plotted and are essentially overlapping,
demonstrating good agreement with each other and with actual measured pressures.
Calibration
Figure 8 illustrates calibration data from 16 separate nodes. The data were obtained by
application of a known pressure from a large bladder, followed by calculation of node-specific
coefficients, and subsequent retesting by application of known pressures. Plotted are calculated
vs. actual pressures for the 16 nodes in the post-calibration tests. Calculated pressures fall upon
the line of identity to within 2 mmHg. To speed the calibration process for the full sized 24 x 64-
node mat, a large 50 x 50-cm2 bladder was fabricated and inflated against successive areas of the
mat while supported in a wooden frame. The total force on the frame at 100 mmHg, inflation
was 748 lb. It was this value of total force that limited the size of the calibration frame to
considerably less than the size of the 24 x 64-node mat. However, with software support, the
calibration procedure is speeded considerably. Computer assisted calibration software receives
signals from a solid state pressure transducer connected to the calibration bladder. With this
approach 16 x 16 node regions of the mat can be calibrated simultaneously, as voltage and
pressure are automatically recorded. The calibration routine then automatically calculates and
stores the coefficients of the node-specific calibration functions, keeping track of the nodes that
have and have not yet been calibrated. With this automated system the calibration procedure can
be accomplished in about 30 min. The calibration values remain stable for several days, or until a
major change in ambient relative humidity occurs, necessitating recalibration.

11
------------------------------------------------------------------------------------------------------------------
Note: Humidity, and in turn the moisture content of the foam, was found to be the major factor
influencing the stability of system calibration. As foam absorbs moisture, the net dielectric
constant of the combined rubber-air-water mixture within the foam changes, owing to the high
dielectric constant of water (80 for water, compared with 1.0 for vacuum or air and 2 to 6 for
most rubbers). Changes in the net dielectric constant affect the capacitance of the nodes. We
found that the capacitance increases roughly 4% for every 1% change in relative humidity. Best
results are currently obtained in a humidity-controlled indoor environment Future applications
may require addition of a moisture barrier to the pressure sensitive mat.
------------------------------------------------------------------------------------------------------------------
RESULTS
Figures 9A and 9B are black-and-white renditions of pressure maps created by a supine subject
on a hard vs. a soft foam rubber cushioned surface. The pressure sensitive mat was placed
between the subject and the test surfaces to create these images. High pressure zones beneath the
head, shoulder blades, and sacral areas are clearly visible and are greatly attenuated by the
interposition of 4-inch foam rubber between the hard surface and the pressure sensitive mat.
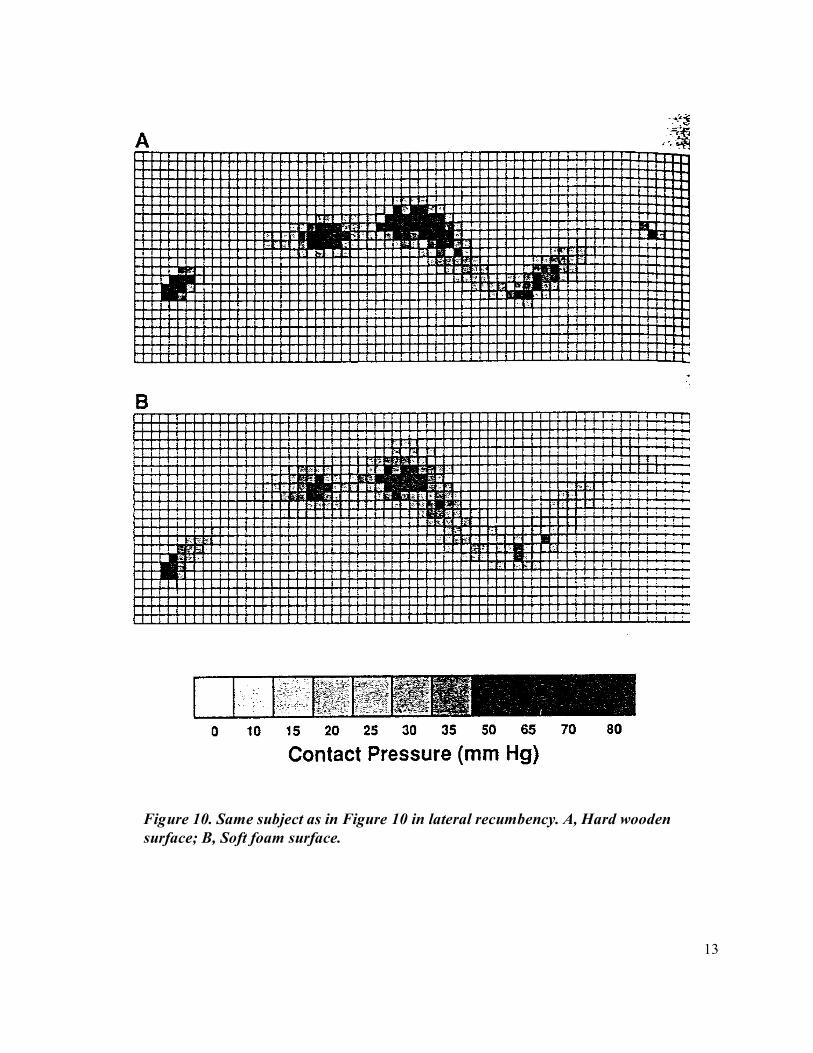
Similar effects are demonstrated in Figure 10 for the same subject in lateral recumbency.
Approximately 3 msec are required to scan each of the 1,536 nodes, calculate pressure, and
display the result as a colored pixel on the video display. Thus, an entire image can be refreshed
about every 5 seconds. When a desired image is obtained, it can be "frozen" on the screen and
saved to disk for later analysis. Stored images can be recalled and, if desired, displayed with a
different false-color scale.

12
Figure 9. A, Image of pressure distribution created by a supine adult female subject on
a hard wooden surface. The pressure sensitive mat was interposed between the subject
and a wooden table. High pressure areas associated with the head, shoulder blades,
sacrum, calves, and heels are evident (left to right). B, The same subject on a soft
surface. The pressure sensitive mat was interposed between the subject and a 4-inch-
thick foam pad. Attenuation of high pressure points is evident, together with spreading
of pressure over a larger area. The black-and-white rendition was created by assigning
gray-scale values to pressure ranges that are normally represented by colors in the on-
line video display.
13
Figure 10. Same subject as in Figure 10 in lateral recumbency. A, Hard wooden
surface; B, Soft foam surface.

14
DISCUSSION
The present system allows sampling and display of the entire contact pressure distribution
created by a patient lying on a hospital bed, at intervals as frequent as every 5 sec. Because the
whole patient is imaged, changes in high pressure zones caused by weight shifts can be detected
and appreciated within seconds. This feature is important in the evaluation and testing of sleep
surfaces, because subtle and unconscious movements of subjects can greatly confound results
when single pressure sensors or smaller area arrays are placed under selected body regions.
Moreover, the ability to adapt to changing body position makes such a system potentially useful
for future automated hospital beds that employ servo controls and active feedback to minimize
high pressure zones. Other potential clinical applications of the system are related to prevention
and treatment of pressure sores in bedridden or paralyzed patients [5, 6]. Several colleagues have
suggested the potential value of such a device, not only for chronically bedridden or paralyzed
patients, but also in anesthesia during prolonged and difficult surgical procedures, when pressure
sores are prone to develop. In the latter application the system could continually monitor the
patient, identify areas with prolonged, excessive pressure, and alert the surgical team to the need
to reorient the potentially endangered area.
The concept of using a pressure sensitive matrix to measure the distribution of contact pressures
created by the human body is not entirely new. In the early 1960s, Aronovitz, Reswick, and their
colleagues at Case Institute of Technology developed a pneumatic cell matrix to measure the
distribution of contact pressures generated by a seated human subject [7]. Pressure was sensed by
a multi-cellular inflatable mat utilizing a large number of pneumatically interconnected, flexible
cells. Each air cell had an electrical contact on the roof and another on the floor. If local pressure
in the mat was greater than the exterior pressure, the cells would inflate, causing the contacts to
separate. During data collection the mat was placed under the subject and the pressure in the
interconnected cells was gradually raised. An array of 1,886 neon bulbs arranged in a 1-cm grid,
isomorphic with the cells of the mat, provided a display related to the spatial integral of the
contact pressure distribution in the plane of the mat. With suitable analysis of the pattern of
lighted bulbs at different inflation pressures, a contour map of the contact pressure distribution
could be obtained. Subsequent to creation of the Case prototype, this same design concept has
been embodied in a commercial unit: the Texas Interface Pressure Evaluator (Knightsbridge
Medical, Inc., Spring, TX 77379).
Several of the design concepts we incorporated in the presently reported system have been
previously described in the patent literature. In 1979, Nicol and Hennig [8] described a pressure
sensitive mat constructed from an array of pressure sensitive capacitors. They described two
arrays of metallic conductors, oriented at right angles to one another, which formed the plates of
the capacitors. The insulator of the capacitors was a compressible dielectric material. The mat
was scanned by connecting an alternating current source to one member of one array via a
demultiplexer, and the voltage impressed on a selected member of the other array was sensed via
a multiplexer. Compared with a pneumatic system, this electrical approach reduces the number
of connecting wires, gives the contact pressure distribution directly, and has an inherently faster

15
response time. The measured pressure dependent variable was voltage, and hence, errors were
introduced by stray capacitances. In a later patent, 9 the metallic conductors were replaced by
fabric woven with conducting threads. In 1985, Boie and Miller described a similar matrix
addressing scheme [10] to measure the pressure-dependent voltage in a 6 x 6 array of force-
sensitive capacitors placed in the feedback path of the sense amplifier.
The technical approach that we have followed is also based upon capacitive transduction at the
intersections of orthogonal conductive strips. From our experience, however, it is clear that a
variety of technical problems remain to be solved before pressure sensitive mats based upon
capacitive transduction can be promoted from the status of laboratory research tools to that of
clinically useful devices. For example, in applications for which absolute rather than relative
pressure data are required, the moisture sensitivity of the calibration must be dealt with: either by
including a moisture barrier or by substituting a non-moisture-absorbing foam. Fabrication of
continuous sheets of nylon with alternating bands of conducting and non-conducting material
would greatly simplify mat construction and provide economies of scale in manufacture. Use of
custom made foams specifically designed to be both low in hysteresis and high in moisture
resistance would, of course, improve system performance and would be cost-effective on a
commercial scale. Future embodiments would also be likely to include a vapor barrier fabric
covering for the mat.
The presently existing pressure sensitive mat at our institution has been created strictly as a
research tool, not a marketable product. Specifically, the authors have not incorporated all the
desirable patient safety features that would be needed for widespread clinical use. The creation
of three full scale prototype systems to date, however, does demonstrate the concept and
feasibility of contact pressure mapping by differential capacitance sensing under computer
control. In addition to research uses in the design of better and more comfortable beds, chairs,
and wheelchairs, such devices may find a role as components of feedback-controlled hospital
equipment for use by paralyzed or chronically bedridden patients, as training aids for nursing
personnel, and as monitors during surgery.
REFERENCES
1. Throne JL, Progelhof RC. Closed-cell foam behavior under dynamic loading. I. Stress-
strain behavior of low-density foams. J Cell Plastics. 1984;20:437-42.
2. Fabishak DM. Derivation and use of equations for loading indentation curves. J Cell
Plastics. 1972;8:82-4.
3. Mendelsohn MA. Specifying properties for shock-mitigating PU foams. Plastics
Engineering. 1984;111:41-5.
4. Zimmerman RL, Bailey HR. Sponge rubber and latex foam. In: Saunders JH, eds. Plastic
foams. New York: Marcel Dekker, Inc., 1972;227-69.

16
5. Krouskop TA, Williams R, Krebs M, Brown J. The role of mattresses and beds in
preventing pressure sores. Proceedings of the 37th Annual Conference on Engineering in
Biology and Medicine, 1984:178.
6. Brand PW. Comments on the article "The effectiveness of preventive management in
reducing the occurrence of pressure sores." J Rehabil. 1983;20;73-83.
7. Aronovitz R, Greenway R, Lindan O, Res wick J, Scanlan J. A pneumatic cell matrix to
measure the distribution of contact pressure over the human body. In: Scott HS, ed.
Proceedings of the 16th Annual Conference on Engineering in Biology and Medicine,
1963;5:62-3.
8. Nicol K, Hennig EMC. Apparatus for the time-dependent measurement of physical
quantities. US Patent #4, 134, 063, 1979.
9. Nicol K. Force sensing means and method of producing such sensing means. US Patent
#4, 437, 138, 1984.
10. Boie RA, Miller GL. Conformable sensor. US Patent #4, 526, 043, 1985.