A Preliminary Examination of Railroad Dispatcher Workload ...
146
DOT/FRA/ORD-01-08 S. Popkin J. Gertler S. Reinach Foster-Miller, Inc. 350 Second Avenue Waltham, MA 02451-1196 Federal Railroad Administration A Preliminary Examination of Railroad Dispatcher Workload, Stress, and Fatigue This document is available to the U.S. public through the National Technical Information Service, Springfield, VA 22161 Final Report May 2001 Office of Research and Development Washington, DC 20590 U.S. Department of Transportation
Transcript of A Preliminary Examination of Railroad Dispatcher Workload ...

DOT/FRA/ORD-01-08
S. PopkinJ. GertlerS. Reinach
Foster-Miller, Inc.350 Second AvenueWaltham, MA 02451-1196
Federal RailroadAdministration
A Preliminary Examination ofRailroad Dispatcher Workload,Stress, and Fatigue
This document is available to the U.S.public through the National TechnicalInformation Service, Springfield, VA 22161
Final ReportMay 2001
Office of Researchand DevelopmentWashington, DC 20590
U.S. Departmentof Transportation

NOTICE
This document is disseminated under the sponsorship ofthe Department of Transportation in the interest of infor-
mation exchange. The United States Government assumesno liability for its contents or use thereof.
NOTICE
The United States Government does not endorse productsor manufacturers. Trade or manufacturers' names appearherein solely because they are considered essential to the
objective of this report.

iii
Technical Report Documentation Page
1. Report No. 2. Government Accession No. 3. Recipient's Catalog No.
4. Title and SubtitleA Preliminary Examination of Railroad Dispatcher Workload, Stress,and Fatigue
5. Report Date
May 20016. Performing Organization Code
7. Author(s)S. Popkin, J. Gertler, S. Reinach
8. Performing Organization Report No.DOT/FRA/ORD-01-08
9. Performing Organization Name and Address
Foster-Miller, Inc.
10. Work Unit No. (TRAIS)
350 Second AvenueWaltham, MA 02451-1196
11. Contract or Grant No.DTFR-53-95-00049
12. Sponsoring Agency Name and AddressU.S. Department of TransportationFederal Railroad Administration
13. Type of Report and Period CoveredMarch 1996 – September 1998Final Report
Office of Research and DevelopmentWashington, DC 20590
14. Sponsoring Agency Code
15. Supplementary Notes
16. Abstract
This report presents the methods, findings and recommendations from a field study that examined the sourcesand levels of railroad dispatcher workload, stress, and fatigue. The study was initiated in response to concerns raisedby two Federal Railroad Administration safety audits of dispatching operations in the U.S. The work was performedin three phases. The first phase identified suitable data collection instruments for measuring the three factors,Phase 2 involved a pilot field test of the instruments and field study procedures, and Phase 3 involved field datacollection.
Data collected in the field at two sites included physiological measures as well as self-report data, third partyobservation and paper records. Based on self-report health data, study participants aged 25 to 44 experiencedseveral disorders at a significantly higher rate than found among the U.S. population. Information from theparticipant background survey was used in conjunction with physiological measures, activity count data andsubjective ratings of workload, stress and fatigue. Subjective workload ratings were moderately associated withreported number of trains dispatched, regardless of shift or location while subjective fatigue ratings had the lowestassociation with this measure of workload. Subjective ratings of stress increased throughout all shifts while salivarycortisol levels, a physiological measure of stress, were within normal adult limits. Sleep patterns of studyparticipants were typical of shift workers in general. An observational technique provided additional data onvariations in workload throughout the shift.
Modifications and enhancements to both the measures and protocol for future studies of railroad dispatcherworkload, stress, and fatigue are offered as issues for further research. Appendices contain copies of the datacollection tools used in the field study along with supporting data and statistical analyses.
17. Key Wordsrailroad dispatcher, workload, stress, fatigue
18. Distribution StatementDocument is available to the U.S. public through theNational Technical Information Service, Springfield,VA 22161
19. Security Classif. (of this report)Unclassified
20. Security Classif. (of this page)Unclassified
21. No. of Pages203
22. Price
Form DOT F 1700.7 (8-72) Reproduction of completed page authorized

iv
v
PREFACE
This report presents the background, methods, and results of a research study designed toexamine the workload, stress and fatigue of railroad dispatchers. The work was performed undercontract DTFR53-95-C-00049 for the Federal Railroad Administration. Dr. Thomas Raslear,Office of Research and Development, Federal Railroad Administration, was the contractingofficer's technical representative (COTR). The authors wish to thank Dr. Raslear for his valuableguidance throughout the conduct of the study. The authors extend special thanks to Mr. ThomasKeane, Office of Safety, Federal Railroad Administration, who provided a background on theFRA’s two dispatcher audits and answered numerous questions throughout the course of theproject.
Thanks are also due to the management of the two railroads that allowed data collection totake place in their facilities, the union representatives who facilitated the logistics for field datacollection, Mr. William Clifford, former President, Brotherhood of Locomotive Engineers,American Train Dispatchers Department (BLE/ATDD) for his support during the conduct of thestudy and all of the railroad dispatchers who participated in the study.
In addition to the authors, several other individuals contributed to this research project.Dr. George Kuehn, IIT Research Institute, adapted the Task Analysis Workload (TAWL)methodology to this study, oversaw field data collection and assembled the results. Dr.Theodore Baker, Shiftwork Resources, was responsible for collection of the saliva samples andanalyzing them for cortisol levels. Ms. Susan Madigan, Transit Safety Management, providedexpertise regarding dispatching operations. Mr. Jeffrey Crane, Foster-Miller, performeddispatcher observation and assisted in coding of the field data. Dr. William Stankard, Mr.Jeremy Mirsky and Ms. Denise Rose also performed dispatcher observation. Ms. Sally Pham,Foster-Miller, assisted with data analysis and preparation of this report.
vi

vii
CONTENTS
Section Page
EXECUTIVE SUMMARY .......................................................................................................... 1
1. INTRODUCTION ......................................................................................................... 6
1.1 Background ...................................................................................................................... 61.2 Purpose ............................................................................................................................ 71.3 Scope ............................................................................................................................... 71.4 Overall Approach............................................................................................................. 81.5 Organization of the Report .............................................................................................. 8
2. THE NATURE OF RAILROAD DISPATCHING ..................................................... 9
2.1 The Railroad Dispatcher’s Tasks ..................................................................................... 92.2 Changes in the Dispatching Environment ..................................................................... 102.3 Dispatching and Train Control Technology ................................................................... 102.4 Sources and Consequences of Dispatcher Workload..................................................... 122.4.1 Workload and Performance ........................................................................................... 122.4.2 Contributors to Dispatcher Workload ............................................................................ 122.5 Sources and Consequences of Dispatcher Stress ........................................................... 132.5.1 Stress and Performance ................................................................................................. 132.5.2 Stress and Health ........................................................................................................... 142.5.3 Stress of Dispatching ..................................................................................................... 142.6 Sources and Consequences of Dispatcher Fatigue ........................................................ 152.6.1 Mental Fatigue and Performance ................................................................................... 152.6.2 Fatigue and Shiftwork ................................................................................................... 16
3. DATA COLLECTION INSTRUMENTS .................................................................. 17
3.1 Data Sources from Related Research ............................................................................ 173.2 Site Visits ....................................................................................................................... 173.3 Focus Group .................................................................................................................. 173.4 Selection Criteria for the Data Collection Methodologies ............................................ 183.5 Survey Instruments ........................................................................................................ 183.5.1 Background Survey Instrument ..................................................................................... 193.5.2 Debriefing Survey Instrument ....................................................................................... 19
viii
Section Page
3.6 Measures of Workload ................................................................................................... 193.6.1 Objective Workload ....................................................................................................... 203.6.2 Task Analysis Workload Measure.................................................................................. 223.6.3 Subjective Workload Measures ..................................................................................... 293.7 Measures of Stress ......................................................................................................... 313.7.1 Salivary Cortisol ............................................................................................................ 313.7.2 Subjective Measure of Stress ......................................................................................... 333.8 Measures of Fatigue....................................................................................................... 333.8.1 Physiological Measures ................................................................................................. 333.8.2 Sleep Log ....................................................................................................................... 343.8.3 Subjective Measure of Fatigue at Work......................................................................... 35
4. DATA COLLECTION PROCEDURES .................................................................... 36
4.1 Use of Human Research Participants ............................................................................ 364.2 Sites and Participants ..................................................................................................... 364.3 Materials and Procedures............................................................................................... 37
5. DISPATCHER ASSESSMENT .................................................................................. 40
5.1 Dispatcher Characteristics ............................................................................................. 405.1.1 General Background Information .................................................................................. 415.1.2 Job Experience ............................................................................................................... 425.1.3 Dispatcher Health and Well-Being ................................................................................ 435.1.4 Quality of Life ............................................................................................................... 445.1.5 Summary ........................................................................................................................ 455.2 Workplace Characteristics ............................................................................................. 465.2.1 Work Hours .................................................................................................................... 465.2.2 Commuting .................................................................................................................... 475.2.3 Rest Breaks .................................................................................................................... 485.2.4 Job Demands ................................................................................................................. 485.2.5 Workplace Dynamics and Stress ................................................................................... 495.2.6 Summary ........................................................................................................................ 525.3 Workload ....................................................................................................................... 525.3.1 Objective Workload ....................................................................................................... 535.3.2 Self-Report Workload .................................................................................................... 635.3.3 Subjective Ratings ......................................................................................................... 645.3.4 Summary ........................................................................................................................ 735.4 Stress .............................................................................................................................. 785.4.1 Self-Report Stressors ..................................................................................................... 785.4.2 Objective Stress Level ................................................................................................... 835.4.3 Summary ........................................................................................................................ 865.5 Fatigue ........................................................................................................................... 86

ix
Section Page
5.5.1 Subjective Fatigue ......................................................................................................... 865.5.2 Primary Sleep ................................................................................................................ 895.5.3 Nap Patterns ................................................................................................................... 955.5.4 Summary ........................................................................................................................ 98
6. KEY FINDINGS AND RECOMMENDATIONS ................................................... 100
6.1 Key Study Findings ..................................................................................................... 1006.1.1 Dispatcher Health ........................................................................................................ 1006.1.2 Workload ..................................................................................................................... 1006.1.3 Stress ............................................................................................................................ 1016.1.4 Fatigue ......................................................................................................................... 1016.1.5 Methods ....................................................................................................................... 1026.2 Recommendations for Additional Research ................................................................ 103
7. REFERENCES .......................................................................................................... 105
APPENDIX A - DEFINITION OF ACTIWATCH DATA ..................................................... 109
APPENDIX B - FORMS FOR FIELD STUDY ..................................................................... 110
APPENDIX C - PILOT STUDY ............................................................................................. 149
APPENDIX D - mTAWL RESULTS ....................................................................................... 163
APPENDIX E - SUPPORTING STATISTICAL ANALYSES.............................................. 184
x
ILLUSTRATIONS
Figure Page
1. Railroad dispatcher’s console with CADS ....................................................................... 112. NIMS data entry screen (NIMS data entry screen.doc).................................................... 213. Raw channel loads ............................................................................................................ 264. Channel data standardized against individual .................................................................. 285. Channel scores standardized against center...................................................................... 296. 15 min moving average channel load ............................................................................... 307. Example of subjective 100 mm visual analog scale ......................................................... 318. Actiwatch AW64............................................................................................................... 389. Work-related daily time .................................................................................................... 4710. Evidence of workplace stress ........................................................................................... 5111. Freight operations, Tuesday, day shift, Desk A ................................................................ 5512. Freight operations, Friday, day shift, Desk A ................................................................... 5613. Freight operations, Thursday, night shift, Desk A ............................................................ 5714. Freight operations, Saturday, evening shift, Desk D ........................................................ 5815. Freight operations, Tuesday, evening shift, Desk G ......................................................... 5916. Freight operations, Monday, evening shift, Desk F .......................................................... 6017. Freight operations, Sunday, evening shift, Desk E ........................................................... 6118. Workload comparisons for day shift by type of operation and time into shift ................. 6619. Workload comparisons for evening shift by type of operation and time into shift .......... 6620. Workload comparisons for night shift by type of operation and time into shift ............... 6721a. Subjective ratings comparison of workload for the day shift ........................................... 6921b. Subjective ratings comparison of stress for the day shift ................................................. 6921c. Subjective ratings comparison of fatigue for the day shift ............................................... 6922a. Subjective ratings comparison of workload for the evening shift .................................... 7022b. Subjective ratings comparison of stress for the evening shift .......................................... 7022c. Subjective ratings comparison of fatigue for the evening shift ........................................ 7023a. Subjective ratings comparison of workload by type of operation for the night shift ....... 7123b. Subjective ratings comparison of stress by type of operation for the night shift ............. 7123c. Subjective ratings comparison of fatigue by type of operation for the night shift ........... 7124. Freight Form Ds and subjective ratings across 24 hr ....................................................... 7425. Passenger Form Ds and subjective ratings across 24 hr ................................................... 7426. Freight route blocks and subjective ratings across 24 hr .................................................. 7627. Subjective stress ratings as a function of time of day for passenger and freight
operations ......................................................................................................................... 82

xi
Figure Page
28. Subjective time pressure ratings as a function of time of day for passenger andfreight operations .............................................................................................................. 82
29a. Mean salivary cortisol levels as a function of time of day for passenger operationby shift .............................................................................................................................. 84
29b. Mean salivary cortisol levels as a function of time of day for freight operationby shift .............................................................................................................................. 84
30. Subjective fatigue ratings as a function of time of day for passenger and freightoperations ......................................................................................................................... 88
31a. Measures of sleep quality by shift and overall ................................................................. 9131b. Measures of sleep quality by type of day and overall ...................................................... 9132. NPRU mood scales ........................................................................................................... 9233. Sleep quality via Actiwatch .............................................................................................. 9334. Average sleep lengths using different data collection methods ........................................ 9335. Coping strategies for adequate sleep ................................................................................ 9436. Daily reported sleep and nap patterns............................................................................... 9537. Average nap lengths .......................................................................................................... 9638. Nap quality via Actiwatch ................................................................................................ 9739. Daily Actiwatch sleep and nap patterns ............................................................................ 98
xii
TABLES
Table Page
1. Data collection instruments ................................................................................................ 22. Dispatcher activities ......................................................................................................... 213. Sources of objective workload data .................................................................................. 224. Definition of mTAWL tasks.............................................................................................. 245. Demographic characteristics of the study participants ..................................................... 416. Prior work experience of study participants ..................................................................... 427. Comparison of dispatcher health, incidence per 1000, to U.S. norms ............................ 438. Quality of life: positive factors ......................................................................................... 459. Quality of life: negative factors ........................................................................................ 4510. Volume and pace of work by shift .................................................................................... 4811. Physical environment ....................................................................................................... 4912. Workplace control issues .................................................................................................. 5013. Dispatcher perceptions of levels of conflict and cooperation with other railroad
workers ............................................................................................................................. 5114. mTAWL channel loadings ................................................................................................ 5415. mTAWL overload rating by desk ...................................................................................... 6216. ANOVA evaluation of effect of type of operation, shift and time into shift on
workload measures ........................................................................................................... 6417. Comparison of average number of trains and track users handled every 2 hr,
separated by shift and field site ........................................................................................ 6518. Repeated measures analysis on number of trains and track users over shift .................... 6719. ANOVA evaluation of effect of type of operation, shift and time-on-shift on
workload, stress and fatigue ............................................................................................. 6820. Repeated measures analysis on perceived workload, stress and fatigue over shift
by type of operation .......................................................................................................... 7221. Percent significant correlations ........................................................................................ 7322. Multiple regression analysis results by field location and shift for predicting
subjective ratings as a function of number of Form Ds completed .................................. 7523. Multiple regression analysis results for freight operation by shift for predicting
subjective ratings as a function of number of route blocks completed ............................ 7724. Full model results of stepwise regression analyses by field location and subjective
rating using the count variables* as predictors ................................................................. 7725. Source of stress by type of operation................................................................................ 7926. Sources of stress by job tenure ......................................................................................... 8027. Comparison of the workload, stress and fatigue scales (100 mm VAS) filled in at the
beginning and end of work shift by all participants on all shifts ...................................... 87

xiii
Table Page
28. Comparison of the workload, stress and fatigue scales (100 mm VAS) grouped byshift, filled in at the beginning and end of work shift by all participants ......................... 87
29. Comparison of the workload, stress and fatigue scales (100 mm VAS) grouped bytype of operation, filled in at the beginning and end of work shift by all participantson all shifts ....................................................................................................................... 88
30. Rate and frequency of sleep-related problems ................................................................. 8931. Comparison of the sleep quality scales grouped by type of operation and workday/
nonworkday, filled in after each daily main sleep period ................................................. 9232. Usage of split sleeps and napping..................................................................................... 95

xiv

xv
LIST OF ABBREVIATIONS
ACTH adreno-corticotrophic hormone
ANOVA analysis of variance
ATC air traffic controlATDD American Train Dispatcher’s Department of the Brotherhood of
Locomotive Engineers
CADS computer-aided dispatching system
CRH corticotropin releasing hormone
CTC centralized train control
EKG electrocardiogram
EMG electromyogram
GPS global positioning system
GSR galvanic skin response
HPA hypothalmic-pituatary-adrenal
HSD honestly significant difference
IRB institutional review board
MCH Modified Cooper-Harper
MOW maintenance of way
mTAWL Modified Task Analysis Workload
NASA TLX NASA Task Load Index
NIMS NAS Infrastructure Management System
NPRU Naval Psychiatric Research Unit
OW Overall Workload
PTC positive train control
REM rapid eye movement
SWAT Subjective Workload Assessment Technique
T&E train and engine
TAWL Task Analysis Workload
VTS Vessel Traffic Services

xvi

1
EXECUTIVE SUMMARY
Railroad dispatchers are responsible for the safe and efficient movement of trains and othertrack users over a railroad. In two Federal Railroad Administration safety audits conducted inthe 1990s that covered 125 dispatching offices and over 1000 dispatchers, the FRA Office ofSafety found evidence of high dispatcher stress and workload. The FRA recognizes thesignificant role that the dispatcher plays in the safety of railroad operations, and is aware of thesignificant impact that dispatcher workload, stress and fatigue can have on employee health andwell-being, which in turn may create safety risks.
Consequently, the FRA initiated this research to understand today’s dispatching environmentand its associated levels of workload, occupational stress and resulting fatigue. The goals of thisresearch were to: 1) identify the sources and magnitude of workload, stress and fatigueassociated with the dispatcher’s job and working life, 2) determine any related health orperformance effects, and 3) refine procedures for measuring workload, stress and fatigue in thedispatcher’s workplace.
The study had three phases. In Phase 1, appropriate data collection measures were selectedto quantify dispatcher workload, stress and fatigue. A pilot field study was conducted in Phase 2to evaluate the candidate measures and data collection procedures. In Phase 3, based on theresults of Phase 2, a full field study, which involved two weeks of data collection, was conductedat two dispatching operations.
A literature review of related studies in other fields, site visits to dispatching centers and afocus group interview with railroad dispatchers all helped to identify and evaluate candidate datacollection instruments in Phase 1. Because this study was conducted in the dispatchers’workplace, dispatcher acceptance of the instruments became the key criterion for instrumentselection. More specifically, ease of use, time to administer and lack of interference with jobduties were considered. Phase 2 of the project involved a one-week pilot study to evaluateselected data collection instruments and procedures. Several minor procedural changes weremade based on the pilot study.
The final set of data collection instruments is summarized in Table 1. A background surveycollected data on the demographics and health of the study population along with informationabout the work environment. There were three sources of workload data, including anobservational technique, based on the Task Analysis Workload method, subjective ratings andactivity count data. Subjective ratings were also used to collect data on dispatcher stress andfatigue. Salivary cortisol was used as a physiological measure of stress while actigraphy wasused to record sleep patterns. Dispatchers also provided a record of their sleep pattern on a sleep

2
log. Finally, a debriefing survey solicited feedback from participants regarding study proceduresand offered the participants an opportunity to express their suggestions for job improvements.
A total of 20 dispatchers from a freight dispatching operation and 17 from a passengeroperation participated in the Phase 3 field study. Participants volunteered and were compensatedfor their participation. Prior to the start of data collection each participant signed an informedconsent form and completed the background survey. During the two-week data collectionperiod, participants wore an actigraph and maintained a sleep log on both work and nonworkdays. While at work, participants completed subjective rating forms and provided a salivasample upon arrival at work and every 2 hr thereafter. At the conclusion of the two-week period,each participant completed the debriefing survey and was paid for his or her participation.
No significant differences were found between the two field study locations with respect todispatcher characteristics. Study participants, predominantly white married men, had a medianage of 43 and median job tenure of 8 years. The characteristics of this group likely reflect thelargely homogeneous railroad work force in general. With respect to health, the youngerdispatchers, aged 25 to 44, reported experiencing back pain, headaches and skin disorders at asignificantly higher rate than found in the U.S. population in general. Since these healthproblems can result from chronic stress, health issues of the entire U.S. dispatcher populationmay merit further investigation.
The study results indicate that participating dispatchers worked more than a 40 hr week.Most dispatchers (89 percent) reported that, on average, they are scheduled to work aconsecutive five-day workweek, but over half reported working an average of eight or morehours of overtime weekly. The dispatcher’s time at work is further stressed by the fact that thedispatcher’s work schedule does not provide a scheduled lunch or rest break. Althoughparticipants reported taking a median of four breaks per shift, their responses on the backgroundsurvey indicated that they are not always taken when desired. The pressure to work overtimereduces the dispatcher’s free time, a situation that is potentially stressful.
Table 1. Data collection instruments
Type of Data Measurement Instruments
Demographic and Work Environment Background survey
Workload mTAWL
Activity recordsDispatcher self-reports
Subjective ratings
Stress Salivary cortisolSubjective rating
Fatigue Actigraphy
Sleep logs
Subjective rating
Study Feedback Debriefing survey
Job Improvement Suggestions Debriefing survey

3
Regarding the job and work environment, though nearly all the dispatchers reported that theyoften dealt with high workloads, most felt capable of handling emergencies and competent in allaspects of their job. Separately, as reported in the background survey responses, stress wasattributed less to the work demands and more to issues of control over work and interpersonalinteractions.
The modified Task Analysis Workload (mTAWL) measurements provide a means to gaugethe variation in workload over the course of a shift. Due to the mTAWL’s labor-intensivenature, it may not be suitable for a research study. However, it has potential as a tool foridentifying and documenting workload at a specific desk and for comparing workload over timeor across desks within a dispatching center. For example, using charts of the mTAWL data,differences in the workload pattern between a Tuesday and a Friday at the freight operation wereobserved. The surge in workload came earlier on Friday and overall was at a higher level thanon Tuesday. Between desk comparisons identified one desk at each operation where thedispatcher was overloaded a high percentage of time relative to other desks at the sameoperation.
Comparisons of the available activity count data – number of trains and other track users,numbers of Form Ds1 and route blocks – with subjective ratings of workload, stress and fatiguerevealed that subjective workload was moderately associated with reported number of trainsdispatched, regardless of shift or location. Correlations between the count data and the perceivedworkload were significant for 92 percent of the cases. Perceived stress also related to thenumber of trains dispatched, particularly at the freight operation where 92 percent of thecoefficients were significant and reliable compared with 42 percent at the passenger site. Of thethree subjective ratings, fatigue had the lowest association with the number of trains and othertrack users, particularly among the dispatchers at the passenger operation. This suggests thatfeelings of fatigue are not merely a function of workload as defined by number of trains andother track users handled. Multiple regression analysis to examine the relationship between thesubjective ratings and number of Form Ds revealed that while there is a reliable linearrelationship between number of Form Ds and route blocks handled and the subjective ratings, theactual impact of the number of Form Ds on the ratings is extremely limited. (The R2 for theseregressions ranged from 0.00 to 0.12.)
The background survey provided information on the dispatchers’ general level of stress andsources of this stress. Two distinct patterns of stressors emerged for each site. Dispatchers at thefreight operation appeared to be primarily concerned with their workload. Specific workload-related stressors that concerned them included difficulty of work, surges in workload, and lack ofcontrol. In contrast, the passenger operation dispatchers found personal interactions and thephysical work environment to be their primary stressors. When these responses were analyzedby job tenure, those with two to five years of experience reported the greatest number ofstressors. This is likely explained by the fact that this group is expected to perform at the samelevel as the more experienced dispatchers while they are still building the mental models,heuristics and information that experienced dispatchers already possess.
_________________1A Form D is a written or electronic record of track usage authority issued by a railroad dispatcher operating under NORAC rules.

4
The passenger operation dispatchers were given the opportunity at the end of the study to“List your top five contributors to work stress, most stressful first.” Surprisingly only one of theitems reported was directly workload-related, number of concurrent tasks. Thus, according toself-report data, stress at these sites appears to be multivariate in nature, and is not completelycentered around the work itself.
In contrast to the results of the background survey, there was little evidence of a high level ofstress from either the subjective stress ratings or the salivary cortisol levels, the physiologicalmeasure of stress. The salivary cortisol results for this group of dispatchers were well withinnormal levels for adults. The diurnal pattern of their cortisol also matched available adult norms.These results, however, should not be interpreted as an indication that workplace stress does notexist. More likely, data was collected too infrequently in this rapidly changing environment andmay not have captured the changing workload and related stress.
Subjective ratings of fatigue significantly increased throughout the duration of all shifts,doubling or nearly doubling in all cases. Fatigue ratings for the start and end of the night shiftwere significantly higher than those for the day and evening shifts. This is likely due to thedispatchers fighting their circadian rhythm as well as handling the responsibilities related tobeing on duty.
Sleep patterns of the participants appeared normal and there was no evidence of an acutesleep debt. The rate of those “waking up tired” on workdays and nonworkdays shows a patternconsistent with the shiftwork literature. Specifically, those working nights have the highest rateof this symptom, and this problem is dramatically reduced when they return to nighttime sleep.The sleep log data indicated a relatively high level of satisfaction with sleep quality, independentof shift worked or whether the sleep occurred during a workday. Generally, those dispatchersworking the evening shift reported being more satisfied with their sleep quality than thoseworking the day shift who, in turn, were more satisfied than those working the night shift. Thisis consistent with the shiftwork literature. The Naval Psychiatric Research Unit (NPRU) moodscores from the sleep logs do not appear to indicate any chronic sleep deprivation from thesedispatchers. Measures of sleep efficiency and sleep fragmentation, derived from the actigraphydata, confirmed the quality of the dispatcher’s sleep. Not surprisingly, the night workers werethe most likely to use split sleep and naps to obtain adequate rest.
The experiences of this study suggest some modifications and enhancements to both themeasures and protocol for future studies of dispatcher workload, stress and fatigue. First, futureworkload measures and protocols should try to capture the cognitive aspect of the dispatcher’swork. With respect to a physiological measure of stress, salivary melatonin and ambulatorystress monitoring techniques should be considered. Regardless of the measures used to collectdata during a dispatcher’s work, more frequent data collection is necessary to capture thevariation and short-term fluctuations in workload and stress that are inherent in the dispatcher’sjob. However, data collection more frequent than every 2 hr is probably not feasible in theworkplace and a dispatching simulator would most likely be required. Further, it isrecommended that workload, stress and fatigue each be explored separately first, before

5
interactions among them are examined. Separate studies will enable a more in-depthunderstanding of each factor.
This field study was the first attempt to explore railroad dispatcher workload, stress andfatigue. Given that these data were collected from a small, non-randomly selected sample ofdispatchers from two dispatching centers, the results should be carefully interpreted. Thisinformation should be used to gain insight into some aspects of the dispatcher’s job and workenvironment and to identify areas that could benefit from further research. The findings andexperiences of this study suggest the following issues for further research:
• Development of measures of dispatcher performance to correlate with workload, stressand fatigue.
• Development of a comprehensive demographic and health profile of the dispatcherworkforce in the United States.
• Assessment of the value of planned rest breaks for reducing stress and fatigue in thedispatching environment.
• Development of a loss of alertness model for dispatchers.
• Measures and models of dispatcher workload that account for both the duration andintensity of workload over time.
• Assessment of the effect that Positive Train Control will have on dispatcher situationawareness, workload, stress and fatigue.
6
1. INTRODUCTION
1.1 Background
In 1987-88, the Federal Railroad Administration (FRA) undertook the National TrainDispatcher Safety Assessment. A number of factors led the FRA to initiate this study. Therailroad industry’s adoption of new dispatching technology, changes in operating rules andmethods of operation, and railroad industry restructuring all had potential safety consequences.In addition, the FRA was concerned that excessive workloads and increased occupational stresscould result from any of these factors.
During the course of the safety assessment, the FRA audited 125 dispatching offices andobserved over 1,000 railroad dispatchers across the country. The FRA found evidence ofoccupational stress but felt that they did not have the expertise necessary to properly measureand evaluate the situation. According to the FRA findings, sources of stress appeared to be“frequent or occasional work overloads, ambiguous operating rules and instructions, thesubstantial safety responsibilities inherent in these positions, and on-time and maintenancerequirements.” In addition, the FRA observed a real or presumed lack of job security at somelocations (FRA, 1990, p.9).
The FRA also collected data on the number of trains handled and authorities issued byindividual dispatchers over the course of a shift. The FRA determined this to be an imprecisemethod of measuring dispatcher workload since it did not take into account the varied tasks thata dispatcher must perform to move a train across the assigned territory. In addition, this methodcaptured neither the periods when the pace of work accelerates requiring the dispatcher to juggleseveral tasks and make rapid decisions nor the variability of workload within short time periods.The FRA concluded, “In order for useful data to be gathered, a system needs to be developedwhich could document the dispatchers’ mental estimates of what is required to perform allindividual tasks involved in the dispatching district. Parameters for measurement need to beestablished to assure workloads are indeed being measured. These parameters must determinehow methods of operation, communication requirements and capabilities, control machines,computers and extraneous duties affect workloads” (FRA, 1990, p.11).
The subsequent Train Dispatchers Follow-up Review in 1993 underscored the observationsand recommendations of the first dispatcher assessment with regard to stress and workload. TheFRA again found evidence of occupational stress. Sources of stress appeared to be workoverloads due to fluctuating traffic levels, coordinating maintenance of way work orderauthorities with high train movement periods, ambiguous operating rules, the substantial safetyresponsibilities inherent in the dispatcher’s job, and the need to balance on-time train

7
performance with maintenance requirements. While the FRA was able to identify importantaspects of workload, they were not able to synthesize all of the disparate elements of workloadinto a coherent picture that adequately characterized the variability and complexity of thedispatcher’s work. The FRA concluded that adequate methods for evaluation of both stress anddispatcher workload should be developed under a separate effort using experts in the health andhuman factors fields (FRA, 1995).
The FRA’s interest in dispatcher workload, stress and fatigue is based on consideration ofoverall railroad operational safety. However, the FRA also recognizes the potential negativeimpact of these factors on employee health and well-being. Among other health problems, stresshas been linked to heart disease, hypertension, various psychological disorders, and substanceabuse (Weiten, 1992). In addition, the fatigue produced by work overload, night work, and shiftrotation can have ill effects on sleep patterns, mood, and mental processes (Moore-Ede andRichardson, 1985). Maximizing employee physical and psychological health and well-beingrequires identification and evaluation of the features of the job, workplace, and organization thatmay erode the dispatcher’s resources for meeting the demands of those tasks that place a greatburden on attention, memory, and decision making capabilities.
1.2 Purpose
The purpose of the research described in this report was to understand today’s dispatchingenvironment and its associated levels of workload, occupational stress and fatigue. The projecthad the following goals:
• Identify the sources and magnitude of workload, stress, and fatigue associated with therailroad dispatcher’s job and working life.
• Determine any related health or performance effects.
• Refine procedures for measuring workload, stress and fatigue in the dispatcher’sworkplace.
In addition to providing information to the FRA, this report is designed to serve as a resourceto railroad industry officials interested in examining levels of workload, stress and fatigue amongtheir dispatchers.
1.3 Scope
Field data collection was limited to two dispatching centers, one servicing a predominantlypassenger operation and the other a predominantly freight service. Since these two sitesrepresent a limited sample of railroad dispatching operations in the United States, the results ofthis study do not necessarily characterize all dispatching environments. The study addressedaggregate levels of dispatcher workload, stress and fatigue and the interaction among thesefactors. The study did not address the dispatcher’s performance or efficiency, and non-jobsources of stress were only considered to a limited extent. For example, differences in the three

8
factors by years of dispatching experience, type of operation, age and work schedule wereexamined. As this was a study of aggregate levels, results for individual participants are notreported.
1.4 Overall Approach
The research was conducted in situ, that is, in the dispatcher’s workplace. Assuring that thedata collection did not interfere with the dispatcher’s ability to perform his/her job was a majorconsideration in designing the study.
The overall study approach involved three phases:
• Phase 1: Selection of workload, stress and fatigue measures.• Phase 2: Pilot study.• Phase 3: Field study.
In Phase 1, candidate methods for measuring railroad dispatcher workload, stress, and fatiguewere identified. A pilot study was then designed to test and evaluate the selected measures in thedispatcher’s workplace and to ensure that the selected measures were appropriate to thatenvironment, easy to use or administer, and did not interfere with the dispatcher’s work. Basedon the results from the pilot study, a full two-week field study was conducted at two railroads,one freight and one passenger operation.
1.5 Organization of the Report
This report presents the methodology and results of all three phases of this research project.Section 2 describes the nature of the dispatcher’s job, the technology used in dispatching and thepotential sources and consequences of dispatcher workload, stress and fatigue. Section 3describes the data collection instruments and the rationale for their selection and Section 4presents the study protocol. The study results are presented in Section 5. Finally, Section 6assesses the methodologies used in the study and presents the study’s key findings andrecommendations. Appendix A contains information helpful in understanding the Actiwatchdata. Appendix B contains copies of the forms used in the field study. Appendix C summarizesthe results of the pilot study conducted to evaluate the procedures and instruments for field datacollection, and Appendices D and E contain detailed data that support the results of Section 5.

9
2. THE NATURE OF RAILROAD DISPATCHING
Familiarity with the nature of the job of the railroad dispatcher, the dispatcher’s workplaceand the technology used by the dispatcher is a prerequisite to understanding the methods andresults of this study. This section provides this prerequisite information along with somebackground from other work on sources of workload, stress and fatigue.
2.1 The Railroad Dispatcher’s Tasks
The railroad dispatcher is responsible for the safe, efficient and economical movement oftrains and other railway vehicles over the railroad, as well as for the protection of those whowork on the railroad. The job of the railroad dispatcher consists of four basic job functions:
• Planning.• Controlling track use.• Managing unplanned and emergency events.• Record keeping and report writing.
The job requires the dispatcher to issue, monitor, and cancel track usage authorizationsaccording to specific railroad operating rules and procedures. The dispatcher also operatessignals, switches and bridges, communicates with train and maintenance of way (MOW) crewsand other dispatchers, schedules MOW work, responds to unplanned and emergency events, andperforms administrative and clerical duties. As much as 75 percent of the dispatcher's shift maybe spent communicating on the radio or telephone, leaving little time for accomplishing otherduties (Vanderhorst, 1990). In this analysis of dispatching on the Burlington Northern Railroad,38 percent of the communications topics addressed time and location, 14 percent addressed traininformation, 16 percent were the granting of movement authorities, 9 percent dealt withsupplemental control, and 22 percent addressed special circumstances.
One of the first tasks the dispatcher performs at the beginning of the shift is to plan theknown track moves on the territory for the duration of the shift. This strategy takes into accountcurrent traffic, expected traffic, the physical characteristics of the territory, train priorities (e.g.,passenger versus freight), track and signal maintenance requirements, crew logistics (e.g., Hoursof Service limitations), characteristics of train performance, and the presence of hazardousmaterials. Information from MOW crews, yard personnel, and dispatchers on adjoiningterritories also contribute to the dispatcher’s actions.
Once this plan is in place, dispatchers spend the remainder of the shift trying to keep thetrains moving while adjusting for the inevitable occurrence of delays and unforeseen events.

10
Even short delays may necessitate the reformulation of the entire plan. Indeed, the plan mayhave to be reformulated many times during the course of the shift as unplanned events transpire.The dispatcher is also responsible for monitoring train crew hours to ensure compliance with theHours of Service Act. Finally, the dispatcher must also assume responsibility for railroad andnon-railroad problems that are phoned in by railroad personnel, as well as the general public, andmust be knowledgeable about the proper procedures for notifying the authorities in the event ofan emergency, such as a hazardous materials spill. Although most dispatchers today rely heavilyon computer-aided dispatching there is still significant record keeping and report writing thatthey must do.
2.2 Changes in the Dispatching Environment
The railroad dispatcher’s responsibilities have remained the same for at least the last25 years, but changes in the technology of dispatching and restructuring of the industry haveresulted in a significantly different work environment. Each of the six basic job functionsdelineated in 1974 by Devoe is still relevant to today’s dispatching environment and accuratelydescribes the duties of a railroad dispatcher (Devoe, 1974). While the basic functions of thedispatcher have not changed, the past 20 years have seen significant technological andoperational changes in the dispatching environment. The introduction of computer assistedrailroad dispatching and communications has made it possible for dispatchers to control largerterritories from much farther away. Changes in operating rules have allowed radio-transmitteddirectives to be used in place of traditional operator delivered train orders.
Concurrent with the increased reliance on computers, large centralized dispatching centershave evolved due to railroad mergers and consolidations. Today, dispatchers for the larger Class1 railroads work in shifts around the clock in large centralized operations along with as many as45 other dispatchers, and may control territories that are located over 1000 miles away. Changesin signal technology have led to a reduction in the use of tower operators and other fieldoperations personnel, resulting in more direct dispatcher control over train movements, anincrease in responsibilities, and an increase in the number of individual tasks involved incarrying out the same responsibilities. While some believe that these changes have made thedispatcher’s job easier, others argue that they have led to increases in the dispatcher’s workloadand associated job stress and fatigue.
2.3 Dispatching and Train Control Technology
Current dispatching technology ranges from radio directives and paper forms, to almost“paperless” offices, where movement authorities and reports are completed using a computer-aided dispatching system (CADS). Typically, the larger the railroad, the more technology thedispatchers have available.
In computer-aided dispatching systems, train movement authorities, changes in switch andsignal status, and other information about trains are entered into computers situated at eachdispatcher’s desk. Specific desk configurations vary by operation, but dispatchers likely haveone or more computer screens and a keyboard at their desks, as well as a voice communications

11
system. Typically, one or more computer screens present a schematic of the interlockings andcontrol points of a territory for which the dispatcher is responsible, and over which the dispatcherhas control, and shows track occupancy or other conditions of sections of track. Other screensmay be used for data entry or information retrieval. In many instances, schematics of all of arailroad’s territories are displayed in front of the dispatching office so that dispatchers are able toview their own territory as well as adjacent territories. Using computers at their desks, railroaddispatchers can change signals and switches, and enter and retrieve information about trains(e.g., train identification, locomotive power, train size and consist). Some computer-aideddispatching systems also record every keystroke and entry that is made by the railroad dispatcherfor future review and analysis. Figure 1 depicts a state-of-the-art railroad dispatcher’s console.
There is also a wide range of train control technologies that is currently being used, or beingexplored for use in the future. At one extreme, there are “dark” territories that do not contain anysignalized systems. Trains are moved using hand-written or verbal movement authorities issuedover voice radio by the railroad dispatcher. Before the advent of signalized systems andcomputer-aided dispatching, all dispatching was conducted in this manner, hence the term “paperrailroad” to describe this manner of railroad dispatching. At the other end of the technologyspectrum, there are currently several railroads that are working on a demonstration system ofpositive train control (PTC). PTC will ensure safety, and at the same time reduce the spacebetween trains to increase throughput. Eventually, PTC will rely on digital data linkcommunication, the Global Positioning System (GPS), onboard computers, and other advanced
Figure 1. Railroad dispatcher’s console with CADS

12
technologies, and will likely change the way in which trains are dispatched. Among otherchanges, PTC will increase railroad dispatchers’ reliance on computers to dispatch trains.Perhaps the most significant change is that under PTC the dispatcher’s job will shift fromactively controlling track use to monitoring its use.
2.4 Sources and Consequences of Dispatcher Workload
Workload may be defined as the interaction between the demands of a given task and theability of the operator to meet those demands. It is a multidimensional concept, which mayinclude elements of time pressure, pace of work, task difficulty and complexity, perceivedcontrol over work, and the level of effort and frustration associated with task performance. Thedispatcher’s workload is a mental rather than physical workload.
2.4.1 Workload and Performance
Workload can affect performance in a number of ways. First, high workload can degradeperformance when the demands of the task exceed the resources that the operator is able todevote to it. Examples where this might happen include jobs that involve multiple simultaneoustasks, and tasks that involve rapid decision making and problem solving. Low workload has alsobeen shown to negatively impact performance on various tasks. In this case a task may be sosimple or repetitive that the operator's attention is not optimally engaged, and subsequentlyperformance suffers. Examples may include sorting and low target frequency vigilance tasks androutine paperwork. Finally, performance suffers the most as a result of surges in workload,whether or not they are predictable. A predictable surge may result from rush hour traffic whilean unpredictable surge could result from an accident or other emergency situation.
2.4.2 Contributors to Dispatcher Workload
Due to the complexity of the dispatcher’s job, as described above, there are numerouscontributors to workload. In its second dispatcher audit (FRA, 1995), the FRA identified thefollowing factors as contributors to workload:
• Number of trains handled.• Number of authorities issued.• Number of control points/interlockings in a territory.• Number, type and effectiveness of communications devices.• Methods of operation.• Total track miles in the territory.• Administrative duties and paperwork.
These factors, along with others such as coping with an emergency situation, provided thebasis for the exploration of dispatcher workload in the present study.

13
2.5 Sources and Consequences of Dispatcher Stress
Like workload, stress is a complex construct with many causes and manifestations. Stressmay result from the individual’s inability to cope with events or a situation. The subjective orcognitive experience of stress may include feelings of anxiety, anger, fear, helplessness,frustration, irritability, and depression. These feelings arise from the way an individual perceivesand interprets events in his or her environment. As this is a very idiosyncratic process, eventsexperienced as stressful for one person may be routine for another.
Stress occurs for many people in their work lives and can be categorized according to thesource of stress. First, the actual demands of a task; that is pace, work volume and deadlines,may create stress within an individual. This illustrates the relationship between stress andworkload. Second, environmental features of the workplace can cause stress. These featuresmay include such items as lighting, air quality, and temperature. Finally, organizational issuessuch as work climate, work scheduling, conflict, change, and pressure may cause the individual aconsiderable amount of stress.
The follow-up FRA audit (FRA, 1995) of railroad dispatchers identified numerous sources ofdispatcher stress. These were the following:
• Work overload and surges in workload.• Juggling maintenance and traffic requirements.• Ambiguous operating rules and procedures.• Inconsistent application of rules between areas.• Safety responsibilities.• Threat of relocation.• Radio frequency interference.• Concerns about training.• Changing technology.
As was the case with the workload issues, the FRA expressed reservations concerning theaudit's ability to adequately inventory and describe all of the sources of dispatcher job stress.
2.5.1 Stress and Performance
Stress is associated with performance degradation and error production on the job. It causesa narrowing of attention, such that an operator may become fixated on one aspect of a problemand ignore other sources of information. Stress may also fragment attention, causing operators tosearch for information and solutions in a disorganized, unsystematic way. Becoming distractedas a result of stress may lead to procedural errors such as performing the wrong response orfailing to respond to an important event; that is, a breakdown of the dispatcher’s situationalawareness. Other effects on cognitive functioning include poor decision making and problemsolving ability, disorganization, forgetfulness, and distractibility.

14
2.5.2 Stress and Health
In addition to degrading performance, exposure to unremitting stress in the workplace canhave a negative impact on employee health and well-being. Indeed, chronic work stress can leadto burnout, a condition in which the individual becomes so physically and psychologicallyexhausted that he or she is no longer able to function effectively on the job (Dell’Erba, Venturi,Rizzo, Porcu and Pancheri, 1994). Although it is difficult to definitively prove direct causalrelationships, occupational stress has been linked to the following physiological andpsychological effects (Weiten, 1992; Moore-Ede and Richardson, 1985; Knauth and Rutenfranz,1987):
Psychomatic Disorders
• Heart disease.• Hypertension.• Skin problems.• Gastrointestinal problems.• Sleep disorders/circadian desynchronization.• Asthma.• Immune system suppression (infections, cancer, autoimmune diseases).• Musculoskeletal pain/discomfort.• Headaches.• Impotence.
Mood-State Changes
• Anxiety.• Depression (sadness, helplessness, loss of hope).• Excessive worry.• Anger/hostility.• Irritability.• Loss of motivation.• Burnout (physical, mental, emotional exhaustion).
Psychosocial Effects
• Alienation from family, friends.• Alcohol and drug abuse.• Workplace violence.• Domestic violence.
2.5.3 Stress of Dispatching
There is little research pertaining to the effects of stress on railroad dispatcher health. Theresearch that does exist, however, suggests that occupational stress is a likely risk factor for ill

15
health and decreased longevity among the dispatcher population. Most of the existing data havebeen compiled by the American Train Dispatchers Department (ATDD) of the Brotherhood ofLocomotive Engineers and published in the Devoe Report (Devoe, 1974). Those studies arebriefly described here, along with a more recent investigation.
A 10-month study conducted in 1929-30 showed an abnormally high rate of heart, blood,kidney, and anxiety problems among 165 train dispatchers. The average age of dispatcher deathwas, at the time, 50 years, with a very high proportion due to cardiovascular disease. Researchdating from the 1940s and 1950s shows similar trends. McCord (McCord, 1948) found that theaverage lifespan of a dispatcher was 50.1 years, as compared to 65.9 years for age matched whitemales. Of the dispatchers studied, 81percent had diseased hearts and blood vessels. A studyfrom the 1950s showed that 50 percent of dispatcher deaths were due to heart disease andanother 20 percent involved diseases of the blood vessels (Devoe, 1974).
More recently, Menotti and Seccareccia (Menotti and Seccareccia, 1985) conducted a five-year mortality study of nearly 100,000 Italian railroad workers, aged 40 to 59 years. Workerswere classified according to the level of physical activity (low, moderate, high) andresponsibility (low, moderate, high) involved in their positions. They defined “responsibility” asthe degree to which employees were accountable for loss of life, injury, and economic losses.The researchers found that railroad workers with low activity/high responsibility jobs were atgreater risk than other groups for myocardial infarction. Although subjects were not classifiedby job title in this study, the dispatcher’s job clearly fits the description of one that is bothsedentary and high in responsibility. A five-year study of railroad personnel conducted in the1970s is also worth noting with respect to stress and heart disease. Researchers noted anexceptional number of smokers among train dispatchers, as well as a very high rate of death dueto coronary heart disease (Devoe, 1974). This finding indicates that smoking behavior may serveas a moderator variable in the relationship between train dispatcher stress and subsequent illness.Finally, cardiac problems have been associated with working shifts, and particularly the nightand rotating shifts. Other problems associated with shiftwork include sleep disorders andattendant fatigue, gastrointestinal problems, alcohol and drug abuse, social isolation, anddisorders of mood (Moore-Ede and Richardson, 1985).
2.6 Sources and Consequences of Dispatcher Fatigue
Mental and physical fatigue may also interfere with the train dispatcher’s work. Althoughthe job does not require hard physical labor, it is important to keep in mind that shiftwork andsleep deprivation may cause physical fatigue, and that this in turn is likely to affect thedispatcher’s level of mental fatigue and alertness. Mental fatigue can also accumulate as a resultof time on task, large work volumes, rapid information processing and decision-making, andresponding to problems such as emergency events.
2.6.1 Mental Fatigue and Performance
The symptoms of mental fatigue involve loss of alertness, feelings of sleepiness, lack ofenergy, weariness, and exhaustion. The effects of fatigue on performance include slower

16
reactions, poor concentration and forgetfulness, complacency, and an increasing reluctance toexpend any effort in task performance. Fatigue is also associated with on-the-job sleepiness andmicrosleeps (Weiten, 1992). When an individual is microsleeping, s/he appears to be awake(sitting upright, eyes open), but an electroencephalogram (EEG) would indicate that the person isactually in a light sleep.
2.6.2 Fatigue and Shiftwork
There are two major contributors to fatigue among train dispatchers. First, staffing shortagesresult in overwork. A shortage of relief employees results in the dispatcher having to work onnormal rest days. In addition, where staff shortages exist, it is not uncommon for the dispatcherto work for periods exceeding what is allowed under the Hours of Service Act (FRA, 1995).Under the Hours of Service Act, dispatchers may not remain on duty for more than 9 hr in any24 hr period where two or more shifts are employed. Where one shift is employed, the dutyperiod must not exceed 12 hr during any 24 hr period.
A second source of fatigue involves the shiftwork system. This is of particular concern fornightworkers and those who work rotating shifts. Rotating schedules can have adverse effectsbecause the body’s circadian rhythms do not have time to adjust to any single schedule. Evenwhen one works third shift consistently, there is a long period of adaptation required forre-entraining physiological functions (Knauth and Rutenfranz, 1987). In fact there is somequestion as to whether complete adaptation to night work is even possible. The degree ofadaptation depends upon both the individual and the length of time spent on the shift. Onelongitudinal study, however, shows incomplete adaptation even after three years working thenight shift (Dahlgren, 1981). Thus, at the very least, it is likely that night shift employees willexperience long periods of fatigue and loss of alertness while adapting to the night shift schedule.In addition to the fact that daytime noise will often interfere with a night shift employee’s sleep,the nightworker may also lose sleep because of family and personal obligations that must beattended to during the day. The conflict between the need to sleep and the desire to spend timewith family and friends can also become a significant source of stress in an individual’s life(Moore-Ede and Richardson, 1985).

17
3. DATA COLLECTION INSTRUMENTS
The overall approach to identifying and selecting candidate measures of workload, stress, andfatigue was threefold. First, related studies in other fields, such as air traffic control (ATC) andvessel traffic services, were reviewed. Next, site visits to local dispatching centers provided anassessment of what data collection methods would be appropriate for this work environment.Finally, a focus group interview with train dispatchers provided insights on their concernsregarding workload, job-related stress, and sources of fatigue as well as the suitability ofcandidate data collection instruments. Based on the information gathered from the literaturereview, site visits and focus groups, candidate data collection instruments and methodologieswere identified and selected.
3.1 Data Sources from Related Research
Initially, the study team investigated a number of candidate measures to be used in this study,selecting those instruments it felt most appropriate for measuring dispatcher workload, stress,and fatigue. Sources of information included recent literature, test banks, personalcommunications with other researchers in the fields of interest, and:
• Reviews of recent stress and shiftwork literature.• Workload and stress measures used with ATCs.• Fatigue measures used for truck drivers and locomotive engineers.• Stress and workload surveys used by NIOSH.• Stress questionnaires contained in several test banks.
3.2 Site Visits
Site visits to several dispatching centers provided valuable insights about the job ofdispatchers as well as the environment in which they work. During these site visits potentiallystressful and workload-inducing elements of the dispatcher’s job, the ergonomics of theirworkstations, and organizational issues that may serve as additional occupational stressors wereobserved.
3.3 Focus Group
A focus group interview was conducted with railroad dispatchers from two railroads, as wellas representatives from the ATDD, the dispatchers’ labor union. The goals of the focus groupwere to:
18
• Provide feedback on several of the survey instruments that were currently underconsideration.
• Comment on the acceptability of the candidate physiological measures (i.e., salivacollection, actigraphy).
• Identify additional sources of workplace stress, workload, and fatigue.
• Identify potential concerns of study participants.
Participants confirmed that the volume and pace of the dispatcher’s work would not allow forthe use of intrusive and/or time-consuming measures. It was clear that study participants wouldnot have time to take breaks during the workday in order to fill out multiple and/or lengthy testinstruments. One concern was that study participants might not be able to complete the testinstruments at the same time each day, due to variations in daily traffic volume, and thepossibility of schedule changes and unplanned events. More importantly, the focus groupparticipants expressed concern that the test instruments would distract them from their work andthat they could make an error as a result. This was a particular concern since dispatchers can beheld personally liable for any accident or emergency situation that occurs on their watch and thatis due to dispatcher error. Consequently, all of the measures used in the study had to be simple,brief, and unobtrusive. Due to liability considerations and the fact that the study was conductedin the workplace, videotaping of participants was not feasible.
3.4 Selection Criteria for the Data Collection Methodologies
The feedback and information provided by focus group participants necessitated revisions tothe original study plan. The formal tradeoff study that was originally proposed to compare thedifferent data collection methods was precluded, since it became clear that the nature of thedispatcher’s work and workplace would necessarily dictate the measures ultimately used.Specifically, dispatcher acceptance became the single criterion for selection, although suchacceptance is dependent upon several factors: ease of use, time to administer, and lack ofinterference with duties.
Given these factors, any instruments or methods that would interfere with the employee’sconcentration, communications, and work processes were not feasible for this study. Not onlywould multiple and/or lengthy test instruments administered during the workday be unacceptableto potential volunteers, but perhaps to railroad management as well. In this regard, it seemedlikely that the use of a large battery of test instruments would alienate candidate railroads andmake it difficult to secure a test site.
3.5 Survey Instruments
Two survey instruments were developed. The background survey instrument was designedto capture demographic and work-related information for each participant. The debriefingsurvey instrument was designed to collect information from the participants about the conduct ofthe study as well as to solicit opinions regarding desired workplace improvements.

19
3.5.1 Background Survey Instrument
A background survey instrument was developed for administration to the study participantsprior to the onset of the actual field data collection. Focus group participants reviewed a firstdraft of this survey instrument. The survey was modified in accordance with their concerns andfeedback. An interim meeting between the FRA, industry representatives and union officialswas also used to evaluate and augment the survey. The resulting background survey instrumentwas comprised of 10 subsections and took approximately one-half hour to complete. Thesubsection topics focus on sources of dispatcher workload, job stress, and fatigue, as well asinformation regarding employee health, work scheduling, sleep habits, quality of life issues,demographic data, job satisfaction, and work climate.
The purpose of the background survey instrument was twofold. First, it provided normativedata on this worker population. These data, in turn, could then be used to characterize thepopulation by both allowing the creation of an overall stress profile of the railroad dispatcher,and having a base of information from which comparisons can be made to the general U.S.population. As noted in subsection 2.5, stress that is associated with task performance on the jobis not the only source of stress in an individual’s life, and stress from different sources will tendto interact in a complex manner. For example, other job-related stressors might involve variousorganizational problems—poor relationships with colleagues or supervisors, issues related toshift work and work scheduling, and stress that occurs in response to organizational ortechnological changes. Stress that is related to personal, family, social, and financial matters isalso likely to contribute to on-the-job stress. Thus, data from the background survey instrumentwas designed to address: 1) what factors, in addition to job demands, are creating stress in thelives of dispatchers, and 2) what, if any, stress-related health symptoms are currently beingmanifested.
3.5.2 Debriefing Survey Instrument
The debriefing survey instrument served a dual role. First it solicited participants’ opinionsand suggestions concerning the methods that were used to collect information for the study. Interms of the pilot study, this information provided important input to the development of the finalprotocol used in the full field study while survey information from the full field study will behelpful in future studies of this nature. Second, this survey instrument was used to collect finalthoughts and information on dispatcher issues not otherwise addressed in the study protocol. Forexample, this survey instrument asked for opinions regarding desired improvements to the job/workplace, top five contributors to work stress, how they defined “workload” and when their lastdays off were prior to the start of the study.
3.6 Measures of Workload
This study used three distinct approaches to measure workload: objective workload,subjective workload and Task Analysis Workload. The following sections describe each of theseapproaches in detail.

20
3.6.1 Objective Workload
Objective workload refers to the task demands of a particular job, independent of theindividual’s abilities to meet those demands, independent of the human operator. Twoapproaches to objective workload were considered, an observational technique employing asoftware tool and paper records.
3.6.1.1 NIMS Data Collector
The NIMS (NAS Infrastructure Management System) data collector is a software packageconsisting of a simple user interface and integrated database. It was designed to gather taskfrequency and duration information on NAS (National Airspace System) Airways Facilitiespersonnel as they perform their job duties (Nadler, Haines, Bonin and Grossberg, 1997).Modifications to the current interface and data collection parameters were made to reflect theunique needs of observing the railroad dispatching environment and to meet the needs of thecurrent project.
The NIMS data collector required a trained research associate to observe the railroaddispatcher at work and, using a laptop computer, record data corresponding to specific dispatchertasks. (Figure 2 displays the NIMS data entry screen.) Observations focused on activities thattake place within several broad categories of dispatcher responsibility, includingcommunications, paperwork, monitor watching, and data entry.
The dispatcher’s job is broken down into distinct tasks that are represented on the computer’sinterface. An observer must watch a particular dispatcher and make entries into the computersystem that correspond to the start and stop times of specific tasks. This is done in real time.The program yields a running record of all of the dispatcher’s activities during the observationperiod and includes information on the duration, sequencing, and frequency of each task.
Following a visit to a railroad dispatching center, a preliminary list of dispatcher tasks wasdeveloped. This list was refined based on input from a subject matter expert (SME) and a reviewof Devoe (Devoe, 1974). The resulting 13 dispatcher activities (see Table 2) were validatedduring a visit to a local dispatching center to ensure that no activities were missing and that theactivities included were representative of the dispatcher’s workload.
3.6.1.2 Dispatcher Records
Due to the inherent difficulties of using the NIMS data collector in the dispatchingenvironment, another measure of objective workload had to be identified. Paper-based recordsof the various dispatcher tasks are not time-sensitive since they can be recorded after the fact. Inaddition, they provide information similar to what was collected with the NIMS data collectionsystem. Data collection during the pilot study indicated that this type of information wasrelatively easy to collect and appeared to be a valid reflection of workload. Specific workloadvariables and the source of the data are listed in Table 3. These data were collected in 2 hrintervals after start of shift.

21
Figure 2. NIMS data entry screen (NIMS data entry screen.doc)
Table 2. Dispatcher activities
1. Record keeping and record review.2. Report writing.3. CTC entry.4. Issue/cancel Form Ds and verbal train movement authorities.5. Issue MOW protection/roadway worker protection.6. Communicate with other dispatchers and Chief dispatcher.7. Dispatcher-initiated communications.8. Externally-initiated communications.9. Respond to unplanned and emergency events.10. Experience communication problems.11. Other administrative duties.12. Non-operational absence.13. Transferring responsibility to or from a desk.

22
3.6.2 Task Analysis Workload Measure
A number of factors make the task of assessing the workload of dispatchers difficult. First,many of the tasks involve cognitive activity that is not directly observable. Second, thetimeframe of task performance is often unpredictable due to the delays that may exist betweenevent onset and the initiation of a response. Finally, assessment is aggravated by the fact thatseveral tasks are often performed concurrently during a given time period. Given theseproblems, an observational methodology and analytical technique based on the Task AnalysisWorkload (TAWL) was developed and explored for this study. TAWL, developed by the ArmyResearch Institute, was originally intended for the assessment of the workload of militaryhelicopter flight crews (Bierbaum, 1990). The TAWL was modified to suit the dispatchingoperational environment and is referred to as the mTAWL.
3.6.2.1 Description
The mTAWL is a task-oriented approach that assumes dispatchers perform multiplesimultaneous tasks through time, and that these individual tasks may vary in their demand on thedispatcher’s performance resources. The mTAWL treats workload as the sum of the difficulty ofall concurrent tasks for each minute in an observation. Two dispatchers might handle an equalnumber of trains, yet significant differences may exist in workload across a shift if one of thedispatcher’s activities takes place within a short period of time while the other dispatcher’s loadis spread evenly over time. The mTAWL is sensitive to this difference. The mTAWL also takestask difficulty into account. Two tasks may be of equal time duration, yet one task may call onmore resources of listening, watching, thinking, or overtly acting than the other. The mTAWLrefers to these resources as the auditory, visual, cognitive and psychomotor channels. ThemTAWL method calculates workload by summing the loads for each of the individual channelsacross all tasks each minute of a dispatcher’s shift.
The mTAWL approach assumes that a task, such as handling an unopposed train, placesdemands on a dispatcher that begin when the train comes under the dispatcher’s jurisdiction andcontinue until the train leaves that jurisdiction. Given that there is no practical way to observe orcalculate the exact, minute-by-minute impact of a task, the mTAWL assumes an average taskresource load that is spread evenly over the duration of the task. This treatment of constant loaddistribution over the duration of a task is a reasonable alternative to attempting to infer what is
Table 3. Sources of objective workload data
Measure Data SourceNumber of trains handled Subjective rating forms
Number of other track users handled Subjective rating forms
Number of Form D’s issued/cancelled Archived completed forms
Number of Route Blocks issued/cancelled Archived computer printouts
CETC keypress information* Archived computer printouts____________*Data not collected due to dispatching computer technical problems.

23
truly going on in a dispatcher’s mind on a moment to moment basis. Observed dispatcheractions that are directly related to an ongoing task are understood as consequences of the taskrather than as something to be counted. While dispatcher actions that are related to ongoingtasks are not directly quantified in the mTAWL approach, they are used to make judgmentsabout the nature of the task. For example, mTAWL makes a distinction between the handling oftrack occupants whose progress or position is in conflict with other occupants and trackoccupants that do not pose a conflict. Dispatcher radio and telephone transmissions, supportedby train sheets or on-time station records, provide the basis for judging the opposed/unopposedstatus of a track occupant.
The mTAWL approach uses dispatchers familiar with a specific dispatching center to firstdefine the tasks that make up a dispatcher’s work and then to make judgments about the level ofeffort required from each of the four resource channels for each task. Trained personnel thenobserve dispatchers at the dispatching center over a period of time. After the data is collected, anindependent rater applies the expert-developed criteria to the observer’s records to create themTAWL scores. Given the source of its criteria, and the dependence on rater judgment, themTAWL analysis must be considered subjective despite its seemingly definitive graphic andnumerical outputs. On the other hand, the original TAWL approach has been shown to correlatewell with subjective self-rated measures of workload.
Adaptation of the TAWL approach for the present study of railroad dispatchers requireddefining a set of tasks that describes the dispatcher’s job. Based on extensive observation ofdispatchers at work and discussions with experienced dispatchers at each study site, a set of taskswas developed. The tasks fell into four conceptual areas:
• Background tasks are either continuous (e.g., monitoring track occupants) or scheduled ata time chosen by the dispatcher. These tasks do not require an immediate response andare not time critical.
• Foreground tasks are unanticipated, and are unrelated to current or previously anticipatedtrain or work crew moves. Such tasks require an immediate response.
• Anticipatory tasks are preparatory actions and plans for managing trains or work crewswhose approximate arrival time in the dispatcher’s territory is known. The timeframe forthis type of task begins when the dispatcher first becomes aware of the occupant, or in thecase of a scheduled train, when the appropriate section of track is cleared to receive thetrain. The anticipatory period concludes when the expected track occupant enters thedispatcher’s control or is no longer expected to arrive. Each anticipated track occupantconstitutes a separate event.
• Track management tasks are those actions taken by the dispatcher to coordinate trainmovements and protect work crews on the dispatcher’s territory. The timeframe of thistype of task begins when the track occupant first enters the territory. It ends when thetrack occupant leaves the dispatcher’s territory. Each track occupant constitutes aseparate event.

24
Table 4 contains definitions of the specific tasks in each task area.
An experienced dispatcher identified the triggering events and concluding actions that markthe beginning and end points of each task in Table 4. Separately, based on expert dispatcherjudgements, each task was scored on a scale from zero to seven according to its contribution toworkload in each of the four information-processing channels: auditory, visual, cognitive andpsychomotor. The mTAWL ultimately yields a graph that provides a means of identifying peakworkload in one or more of the information-processing channels and the time(s) of the peak(s).(See subsection 3.6.2.3 for sample graphs.)
Table 4. Definition of mTAWL tasks
Task Area Task Description
Background • Auditory monitoring – listening for radio or telephone calls.
• Visual monitoring – watching for unanticipated events on the informationaldisplays.
• Background “phone” – telephone or radio calls made during the course ofwork at times chosen by the dispatcher and not directly related to theanticipated or actual control of a specific train or work crew.
• Background “computer” – computer or paper entries required during the shiftthat do not require an immediate action and can be performed at timeschosen by the dispatcher.
Foreground • Foreground “phone” - telephone or radio calls made or received during thecourse of work which required an immediate response and which were notdirectly related to previously anticipated actions or the current control of aspecific train or work crew.
• Foreground “computer” - computer or paper entries required during the shiftthat were not directly related to previously anticipated actions or the currentcontrol of a specific train or work crew but that had to be taken care ofimmediately.
Anticipatory • Anticipated unopposed - the anticipated arrival of a track occupant whoseprogress toward the dispatcher’s territory is expected to be unimpeded.
• Anticipated opposed - the anticipated arrival of a track occupant whoseprogress to the dispatcher’s territory was expected to be opposed by anothertrack occupant or occupants.
Track Management • Track occupant unopposed - a period of time during which a specific trackoccupant under the dispatcher’s control is unimpeded.
• Track occupant opposed - a period of time during which a specific trackoccupant under the dispatcher’s control is opposed by another trackoccupant or occupants.

25
The application of the original TAWL to helicopter pilots assumed that, at any given periodof time, when the workload score (summed across tasks) for a given information-processingchannel exceeded the highest possible level of seven, then an overload condition existed. Inflight scenarios, these periods are understood to be occasions when catastrophic errors are likelyto occur. The dispatching environment was assumed to be a similar environment and initially ascore of seven was used as an indicator of work overload.
3.6.2.2 Development of mTAWL Channel Loadings
The next step in applying mTAWL to a dispatching environment was to establish the channelloadings for each of the 10 tasks that was to be observed. Since every dispatching center isunique, a set of channel loadings must be determined for each dispatching location. The ratingscan be established by assembling a small group of experienced dispatchers from the center wheredata will be collected. Assistant chief dispatchers and senior experienced dispatchers performedthis task.
The constructs of dispatching tasks and task channel loads were first explained to the expertgroup. Then the list of tasks was presented and the expert dispatchers were invited to suggestadditional tasks if they felt any were needed. In the present study, dispatchers from the freightoperation agreed to add a “surcharge” to account for 1) additional work necessary for trainscarrying excess dimension cars or 2) the failure of safety or signaling equipment. Effort in theanticipation or handling of track occupants under either of these conditions was thus increased.No additional tasks were identified for the passenger operation.
Next, the expert dispatchers were asked to independently choose levels for each channel.The final channel loads for each task were determined by taking the mode of the responses fromthe expert group for each channel. Where no modal value existed, the median value from therange of responses was used.
3.6.2.3 Analysis of mTAWL Data
The minute-by-minute channel loads may be represented in a number of ways. These are:
• Raw channel loads.• Channel loads standardized for the individual.• Channel loads standardized for all desks.• Fifteen minute moving average channel loads.
Each approach is defined and discussed below.
The raw channel is computed by minute based on the tasks that the individual wasperforming at each minute and the weightings for those tasks. Figure 3 illustrates an example ofthe total channel load by minute. In this example, the auditory and visual channels overlapalmost perfectly and thus the two traces appear as one. This first shift dispatcher’s desk shows alow level of activity at the beginning of the shift and a period of high activity beginning

26
approximately 2 hr later. The observer’s notes reveal that during the busy period this dispatcherhandled a large number of track occupants. Due to the route blocking effects of trackmaintenance activities, most of the track usage authorities issued by the dispatcher during thistime were for opposed moves. This graph also shows that the channel loads are highest forcognitive and psychomotor tasks. A review of the observers’ notes shows a significant amountof time spent preparing paperwork and managing a large number of opposed track occupants thatwould account for the heavy cognitive and psychomotor loads.
While the mTAWL procedures employed in the pilot study produced results that wereconsistent with the concept of a channel load of seven indicating an overload condition, thechannel loads were much higher in the full field study. There were a number of reasons why thismay have occurred. The focus groups used to establish the task weightings assigned higherweights than were developed for the pilot study. Also, the mix and number of track users and theperiod of time that they remained on the dispatchers’ territory also differed between the pilot testand the full field study. Since the concept of seven as a maximum load was not meaningful forthe field study, an alternate means for identifying overload conditions was developed.
Figure 3. Raw channel loads

27
Channel loads were converted to standardized scores (Z-scores). The Z-score is computedfrom the following:
Zx X
x X N
i
ii
N=
−( )−( )
=∑ 2
1
/ (1)
where
= arithmetic average for a group of N scores, andxi = score for the ith dispatcher
This transformation produces a distribution of scores with an average of zero and acharacteristic that allows direct comparison between distributions. In addition, probabilisticstatements can be made about individual scores based on their distance from zero. In manyways, this is more useful than arbitrarily selecting a number to represent overload. For example,the probability is that approximately 68 percent of all scores are expected to fall between Z-scorevalues of +1.0 and –1.0 and approximately 95 percent of all scores will fall between Z-scorevalues of +2.0 and –2.0. This means that a channel Z-score greater than 2.0 is an unusual event,likely to occur less than 5 percent of the time by chance alone.
The standardized channel Z-scores were computed in two ways. First, individual dispatcherZ-scores were calculated to show deviations in load relative to that dispatcher’s individual workon a given shift. Figure 4 shows the data of Figure 3 transformed into Z-scores using theindividual’s own task channel loads from the shift. Zero represents the average load for thisdispatcher on this shift. As can be seen in Figure 4, for the last 3 hr of the shift, the workload perchannel is actually below average for this individual.
One distinction that is lost through standardizing the channel ratings is the absolutedifference between the channels. The standardized Z-score treatment conceals the fact that theauditory and visual channels for this specific observation constituted a much lower demand thanthe cognitive and psychomotor channels.
While the self-comparative nature of the previous approach is informative, more is revealedif the workload figures can be compared across all desks at a dispatching center. Z-scores werecomputed as described above using Equation (1), but for this analysis deviations are relative toall 10 desks observed at the center. In Figure 5, the channel loads by minute for 10 differentdispatcher shifts at the same center are used to standardize the channel loadings for thedispatchers’ workload shown in the previous examples.
In Figure 5, zero now represents the average for each channel load for all 10 dispatchers atthe dispatching center. In comparison to the previous example, it becomes apparent that theparticipant’s channel loadings displayed in the graph were somewhat higher than those of the
X

28
group as a whole. The third and fourth hours of the shift were somewhat busy in comparison tothe subject’s own averages, but were extremely busy in comparison to the group as a whole.Similarly, the last 4 hr of the shift were a below average channel demand for the subject, butconstitute an average load when compared to the group of 10 dispatchers.
Since the raw channel data as well as the standardized Z-scores many times do not allow foridentification of a trend, a fourth method, moving average, was applied to the standardizedscores. A 15 min moving average was applied and is shown in Figure 6.
The 15 min period was chosen because it was felt that a 15 min period of continuous highZ-scores indicated an overload condition.
The determination of what constitutes overload is, of course, subjective. One of theproblems is that dispatchers vary in skill. A flow of work that might be an overload for onedispatcher may not be for another. Regardless, a standardized workload score, relative to thegroup of dispatchers, that exceeds ±2.0 for periods of 15 min or more constitutes a substantialdeviation from average and certainly invites a careful review to determine the conditions thatproduced it.
Figure 4. Channel data standardized against individual

29
3.6.3 Subjective Workload Measures
Subjective workload refers to the railroad dispatcher’s perception of both: 1) the demands oftheir work in terms of difficulty, complexity and time pressure, and 2) the effort they need toexpend to meet those demands. This construct is often assessed using self-report rating scalesthat are administered during or immediately following task performance. Such scales may beadministered several times during a work period in order to document changes in perceptions ofworkload over time. There are several popular subjective workload techniques available, bothunidimensional and multidimensional. Scales are defined as unidimensional if the operator isrequired to rate the overall workload of a task only. Multidimensional techniques are morediagnostic in the sense that operators are asked to rate different elements or dimensions of theworkload, such as time pressure and mental demand.
The simplest unidimensional workload scale is the Overall Workload (OW) scale. It is aunidimensional 100 mm bipolar visual analog scale ranging from 0 to 100 (Hart and Staveland,1988). Operators are typically asked to place a hash on the part of the scale corresponding totheir perceived level of workload. Other unidimensional scales are more complex. For example,
Figure 5. Channel scores standardized against center

30
the Modified Cooper-Harper Scale (MCH) requires operators to work through a multi-faceteddecision tree in order to arrive at a global workload score (Cooper and Harper, 1969). TheBedford Workload Scale also utilizes a decision tree (Roscoe, 1987). The Bedford Scale, whiledesigned for pilots, can be modified for use with other types of operator.
There are also a number of multidimensional workload scales. With the NASA Task LoadIndex (TLX), operators rate six sources of workload—mental, physical, and temporal demand,performance, effort, and frustration—each on a scale ranging from 0 to 100. Choosing thegreater contributor to workload in pairwise comparisons produces a weight for each source ofworkload. Ultimately, this process yields a weighted rating for each of the six workloaddimensions, as well as an overall, global workload rating. (Hart and Staveland, 1988). Anothermultidimensional workload rating technique that was investigated is the Subjective WorkloadAssessment Technique (SWAT; Reid and Nygren, 1988). SWAT asks operators to rate tasks onthree dimensions: Time Load, Mental Effort, and Psychological Stress. The SWAT also entails alabor intensive sorting and weighting process to determine the relative contributions of eachsubscale to overall workload.
While the multidimensional workload instruments provide more specific, diagnosticinformation about the sources of an operator’s workload, they are too time consuming andcomplex to administer to an on-the-job railroad dispatcher several times over the course of his orher shift. The decision tree methods can also be time intensive. It was determined that the bestsubjective workload technique to use in this particular operational setting is the OW in
Figure 6. 15 min moving average channel load

31
conjunction with the three NASA-TLX sub-scales that are most appropriate to dispatcherworkload: Mental Demand, Temporal Demand, and Effort. These four scales simply required asingle rating between 0 and 100. The NASA weighting process for the subscale items was notutilized. Figure 7 contains an example of the type of subjective scale used to rate these fourfactors; it employs the 100 mm visual analog technique.
3.7 Measures of Stress
This study used two distinct approaches to measure stress: salivary cortisol and subjectivestress. The following sections describe each of these approaches in detail.
3.7.1 Salivary Cortisol
In addition to a subjective report of stress, options for taking a physiological stress measureperiodically during the dispatcher’s work shift were explored. Such measures include pulse rate,sustained contractions of the frontalis muscle (forehead), and cortisol secretion. The latter optionappeared to be the most appropriate given the constraints of the data collection environment.Cortisol is a reliable stress marker that can be collected quickly and unobtrusively in subjects’saliva. For example, cortisol has been used in studies of air traffic controllers (Fibiger, Evansand Singer, 1986, p. 29-36).
Psychological and physical stress increase the activity of the hypothalamic-pituitary-adrenal(HPA) axis of the central nervous system, which results in release of corticotropin releasinghormone (CRH) and adreno-corticotrophic hormone (ACTH). These hormones subsequentlygive rise to an increase in the release of cortisol from the cortex of the adrenal gland, andconsequently a rise in cortisol concentration in the blood, urine and saliva. Sampling of freecortisol in blood, the traditional method for controlled laboratory and clinical investigations,typically requires continuous sampling via indwelling venous catheters, fraction directiondevices or techniques, and continuous monitoring of research subjects by skilled technicians.
By contrast, saliva collection can be done non-invasively and outside the constraints of aresearch laboratory. Study participants can quickly and easily learn to collect their own saliva
Figure 7. Example of subjective 100 mm visual analog scale
Mental Demand
0Very Low
100Very High
510-FRA-00045-1

32
samples thus allowing the possibility of frequent on-the-job sampling. This type of sampling canbe assessed at relatively low expense and without disrupting the regular routines of theparticipants. Most importantly, the sampling of salivary cortisol is a stress-free procedure. Thisis critical because both plasma and salivary cortisol are elevated transiently in response to stress,including the psychological stress generated by the blood collection procedure itself.Consequently measurement of cortisol concentration in saliva has become a widely acceptedalternative to measurement of blood cortisol. Furthermore, the literature on salivary cortisolanalysis of air traffic controllers among others, indicated that cortisol is a reliable measure ofstress suitable for use in a high workload field setting (Zeier, 1994, p.13-19).
Salivary cortisol has been shown to be reliably correlated with the concentration of unboundcortisol in the blood, although the absolute concentration of cortisol in saliva is lower than inblood (Hellhammer, Kirschbaum and Belkien, 1987; Kirschbaum, Read and Hellhammer, 1992;Riad-Fahmy, Read, Walker and Griffith, 1982; Vining and McGiley, 1986). Cortisol enterssaliva from blood via mechanisms that do not require active transport processes, so cortisolconcentration in saliva is not a function of salivary flow rate. Furthermore, saliva is relativelyfree of other proteins and protein-bound molecules that may distort the neuroendocrine assays.
Many factors increase stress and influence the activity of the HPA axis and salivary cortisolconcentration (Kirschbaum, Read and Hellhammer, 1994). Among the most common activitiesknown to influence cortisol concentration is smoking. Nicotine stimulates the HPA axis andincreases cortisol and ACTH during the period of smoking. Therefore, smokers often show ablunted cortisol response to stress, which may be due to chronic elevation in cortisol level andreduced responsiveness of the HPA axis. Physical exercise and physical workload also increasecortisol levels in blood and saliva. Cortisol is elevated throughout the period of increasedphysical workload and reaches peak levels 20 to 30 min after the physical stress has ended. Inthe case of very heavy physical exercise, such as a marathon race, cortisol rises continuouslythroughout the duration of the competition.
Circadian variation in adrenal function has long been recognized (Pincus, 1943). However, itwas not until reliable specific radioimmunoassays for detecting cortisol were developed that theprominence of the circadian rhythm for this hormone was fully realized (Migeon et al., 1956;Peterson, 1957; Aschoff, 1979). In all species studied the peak of corticosteroid release occursshortly before or at the onset of physical activity following a period of sleep and quiescence.
In humans, corticosteroid secretion exhibits a strong, or high-amplitude circadian rhythm,which means that the maximum deviation from the 24 hr mean value can be 100 percent orgreater. The peak secretion occurs just before the time of awakening, then falls throughout theday with minimum values reached about midnight (Bartter, Delea and Halberg, 1962). Typicallyover 70 percent of the total 24 hr secretion of cortisol occurs between the hours of midnight and0900 (Nichols and Tyler, 1967).
Interestingly, the circadian rhythm of cortisol secretion persists even when humans aredeprived of nocturnal sleep. The rhythm of cortisol secretion is therefore linked to an internalcircadian pacemaker, not to the end of sleep or onset of physical activity, per se (Weitzman et al.,

33
1971). Unless the central circadian pacemaker itself is “reset” to a new phase position, e.g., byreversal of the light-dark cycle over several consecutive days, the cortisol rhythm remains linkedtemporally to other physiological measures such as core body temperature and volume of urineproduction (Czeisler et al., 1989).
3.7.2 Subjective Measure of Stress
Several methods exist to evaluate chronic occupational stress. These methods generallyinvolve survey instruments, and the topic areas that they cover have been included in this study’sbackground survey instrument. For this project it was desirable to document overall daily stresslevels, as well as variations in stress responses over the course of the work shift. Severalsubjective report techniques for assessing changes in symptoms of stress among and withinworkdays were examined, including the Beck Depression Inventory (Beck, 1987), the UWISTMood Adjective Checklist (Matthews, Jones and Chamberlain, 1990), the Multiple AffectAdjective Checklist (Zuckerman and Lubin, 1986), and the state scale of the State-Trait AnxietyInventory (Spielberger, 1983).
An extensive search of the stress literature and test banks was undertaken to find a briefsurvey instrument that addresses the multifaceted nature of occupational stress (e.g., frustration,anxiety, feelings of depression, etc.). The search did not yield a suitable instrument. Moreover,since survey length and complexity were concerns, the study design included asking participantsto simply rate their overall stress level on a scale similar to the OW scale at 2 hr intervalsthroughout the workday, as described in subsection 3.6.3.
3.8 Measures of Fatigue
Physiological indices, a sleep log and subjective ratings were used to assess dispatcherfatigue.
3.8.1 Physiological Measures
Two techniques for measuring physiological indices of sleep and fatigue receivedconsideration: measuring eyeblinks with a Nightcap device and recording the sleep/wake cyclevia actigraphy. The Nightcap is a small sensor that can record the frequency and duration ofeyeblinks, an indicator of fatigue. It is placed on the temporal side of the volunteer’s uppereyelid. Thin wires travel from the Nightcap to a data recorder that is usually placed in thevolunteer’s shirt pocket. The Nightcap was not selected for two reasons. First, the technologyappears too unwieldy to be acceptable to participants. Second, the use of the Nightcap in studiesof this sort had not as yet been validated. While the Nightcap was originally developed forresearch on REM (rapid eye movement) sleep, it had not as yet been used extensively in studiesof fatigue.
Actigraphs, on the other hand, are commonly used in studies of fatigue. For example,actigraphs were recently utilized in a Federal Railroad Administration study of locomotiveengineer fatigue (Thomas, Raslear and Kuehn, 1997). Actigraphs are approximately the size and

34
shape of a normal wristwatch, and are continuously worn day and night. The actigraph containsa sensor to track arm movement. The gathered information can be used to determine the amountof sleep that each dispatcher is getting per 24 hr period, and when sleep periods are taking place.
Ambulatory Monitoring Inc.’s Sleep Watch was selected for the pilot study. The SleepWatch is easily initialized, and the data it gathers is easily downloaded for review and analysis.While the data collected during the pilot study indicated that the Sleep Watch was performingaccurately, the participants did not care to wear the device. Specifically, the pilot studyparticipants felt that the actigraphs were too large, the watchband too flimsy and the devicegenerally uncomfortable. Given this feedback, an actigraph from another vendor, Mini-Mitter,Inc., was selected for the full field study.
Minimitter’s Actiwatch® satisfied the pilot study participants’ complaints. It was smallerand lighter than the model used in the pilot test. In addition, it had both a better hardware-to-computer interface for field data collection and a better software package. The device was set tosample at 1 min intervals, thereby optimizing the length and frequency of data collection. TheActiwatch software analyzed the arm movement data and provided the following fatigue-relatedinformation for use in this study:
• Sleep start time.• Sleep end time.• Time in bed.• Estimated sleep time.• Sleep latency.• Sleep efficiency.• Number and mean length of sleep bouts.• Movement and fragmentation index.
Appendix A contains a definition of each of these variables and the method for computingthem.
3.8.2 Sleep Log
A sleep log (see Appendix B) was developed and used in conjunction with the actigraph datato assess quality of participants’ sleep and to validate the actigraph data. This sleep log is based,in part, on similar instruments used by the USCG and DOT in studies of Vessel Traffic Service(VTS) watchstander and locomotive engineer fatigue, respectively. The sleep log containeditems pertaining to the timing of the participant’s sleep, sleep quality, the Karolinska SleepScale, and Naval Psychiatric Research Unit (NPRU) positive and negative mood scale. Both theKarolinska Sleep Scale and the NPRU Mood Scale were included to explore issues of acute andchronic sleep deprivation and fatigue. Participants were asked to complete the sleep log eachday, shortly after awakening. It takes approximately 1 min to complete all items.

35
3.8.3 Subjective Measure of Fatigue at Work
To limit the number of rating items to be completed while on duty, multi-item fatigueinventories were not included in the study. Rather, as described in subsection 3.6.3, participantswere only asked to rate their current level of fatigue on a scale similar to the OW every 2 hrthroughout their work shift.

36
4. DATA COLLECTION PROCEDURES
The test instruments and data collection procedures for the field study are described in thissection. They were very similar to those employed in the pilot study, which is described inAppendix C.
4.1 Use of Human Research Participants
An Institutional Review Board (IRB) was convened to conduct a human subjects review ofthe study design, protocol, and materials to be used in the field study. The IRB consisted ofindividuals with expertise in research involving human subjects. The IRB found no risk tohuman research participants in the proposed research design, and consequently approved theresearch plan for the field study.
4.2 Sites and Participants
The primary criteria for selecting field study sites were that: 1) a freight operation and apassenger operation had to be represented, and 2) it was desirable to start with a large participantcandidate pool since it was expected that only a fraction of those solicited would participate inthe two-week study. Since there were only a handful of dispatching centers in the United Statesthat met these criteria, and because securing the cooperation of a railroad is a very time-consuming process, two of the three pilot study locations were selected as the field study sitesbecause they fit the two study criteria and because railroad management and laborrepresentatives were already willing to cooperate at each of the dispatching centers. The Mid-Atlantic dispatching center, a freight operation, and the New England dispatching center, apassenger and commuter train operation, were thus selected as field study sites.
Data was collected for two weeks (14 days) at each dispatching center. The dispatchingcenter for the freight operation had a total of 10 desks (i.e., that dispatching center wasresponsible for 10 different territories), while the passenger operation was comprised of eightdesks. Both railroad management (e.g., Superintendent of Operations) and local ATDD unionrepresentatives assisted in recruiting participants.
After permission to conduct the study was received from each railroad, the local unionrepresentative at each site was contacted and asked to distribute an invitational letter explainingthe purpose of the study, what was expected of each participant, compensation for participationand how to volunteer to participate. A sign-up form accompanied the letter. The sign-up formswere then returned to the local union representative at the dispatching center. The sign-up form

37
included a request for information about the volunteer’s work schedule during the data collectionperiod. This information was later used in developing a schedule for the mTAWL observationand labeling of the plastic saliva sample collection tubes.
As follow-up to the letter and sign-up sheet sent to the local union representative, eachdispatcher was solicited for participation in the study. In total, about one-third of the dispatchersat each site agreed to participate: 20 dispatchers volunteered from the freight operation and 17volunteered from the passenger operation.
4.3 Materials and Procedures
The following instruments were used in the field study:
1. A background survey containing questions pertaining to railroad dispatcher health andwell-being; work scheduling and sleep habits; sources of stress in the workplace;interpersonal relationships; control over work; and quality of life.
2. Instructions for participants, including instructions for completing the sleep log, the dailyworkload, stress and fatigue ratings; instructions for providing saliva samples; anddirections for wearing the Actiwatch.
3. An informed consent agreement that described the conditions of the study as well as theparticipants’ rights and responsibilities.
4. Wrist-worn Actiwatches.
5. Salivary cortisol assays.
6. Daily sleep logs.
7. Subjective rating forms for workload, stress and fatigue.
8. Debriefing survey.
Based on the pilot studies, a few minor modifications were made to some of the datacollection procedures. Form D and route block counts would be collected at the conclusion ofthe study. Collection of communications and key press information was pursued; however, afterdiscussions with each dispatching center’s computer technicians, it became apparent that thisinformation would be too difficult to assemble. The paper-based dispatcher records providedefficient and unobtrusive access to basic workload data without further burdening participants.The specific workload variables being investigated, as well as the method of data collection,depended upon the study site due to operational differences. Both locations used paper-basedForm Ds, while route block information was only available from the freight operation. Foul timepermits, on the other hand, were recorded by dispatchers at the passenger dispatching center, butwere not recorded at the freight dispatching center. Again, these differences are due todifferences in how each railroad operates.
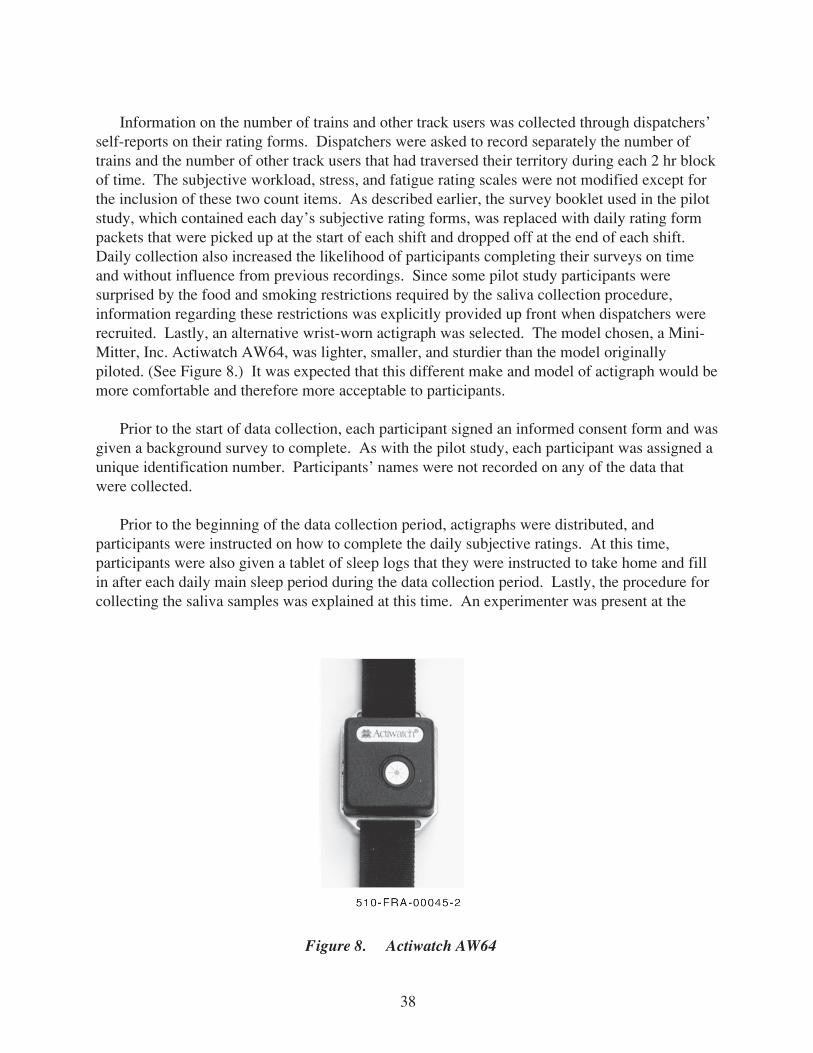
38
Information on the number of trains and other track users was collected through dispatchers’self-reports on their rating forms. Dispatchers were asked to record separately the number oftrains and the number of other track users that had traversed their territory during each 2 hr blockof time. The subjective workload, stress, and fatigue rating scales were not modified except forthe inclusion of these two count items. As described earlier, the survey booklet used in the pilotstudy, which contained each day’s subjective rating forms, was replaced with daily rating formpackets that were picked up at the start of each shift and dropped off at the end of each shift.Daily collection also increased the likelihood of participants completing their surveys on timeand without influence from previous recordings. Since some pilot study participants weresurprised by the food and smoking restrictions required by the saliva collection procedure,information regarding these restrictions was explicitly provided up front when dispatchers wererecruited. Lastly, an alternative wrist-worn actigraph was selected. The model chosen, a Mini-Mitter, Inc. Actiwatch AW64, was lighter, smaller, and sturdier than the model originallypiloted. (See Figure 8.) It was expected that this different make and model of actigraph would bemore comfortable and therefore more acceptable to participants.
Prior to the start of data collection, each participant signed an informed consent form and wasgiven a background survey to complete. As with the pilot study, each participant was assigned aunique identification number. Participants’ names were not recorded on any of the data thatwere collected.
Prior to the beginning of the data collection period, actigraphs were distributed, andparticipants were instructed on how to complete the daily subjective ratings. At this time,participants were also given a tablet of sleep logs that they were instructed to take home and fillin after each daily main sleep period during the data collection period. Lastly, the procedure forcollecting the saliva samples was explained at this time. An experimenter was present at the
Figure 8. Actiwatch AW64

39
beginning, middle, and end of the data collection periods to answer questions and monitor theprogress of the data collection. Data from the Actiwatches was downloaded at each of theseperiods to verify that they were collecting data properly. In addition, the experimenter wasavailable 24 hr a day via cell phone if a participant had a question or a concern that requiredimmediate assistance. A technician was also present at the turnover of every shift to distributethe fresh saliva sample packs and to pick up and store the used samples until they could be sentto a laboratory for analysis.
Data collection took place for two weeks in late Summer at the freight operation and twoweeks in early Fall 1998 at the passenger operation. The daily data collection procedure wassimilar to that of the pilot study. Specifically, participants completed daily baseline subjectiveratings upon reporting to work. They then provided ratings at 2 hr intervals until the end of theshift (i.e., 2 hr into shift, 4 hr, 6 hr, and 8 hr). Saliva samples were taken at the same intervals.In addition to the subjective ratings, participants completed a sleep log each day, even if they didnot report to work, and wore the actigraphs at all times unless they were showering/bathing/swimming. Finally, two trained observers collected mTAWL data on one dispatcher per shift perday. To maintain vigilance, observers alternated their observation every other hour. Ten shiftswere observed using the mTAWL procedure at the freight operation site, and 12 shift periods ofdata were collected at the passenger operation. At the conclusion of the study, participantscompleted a debriefing survey, returned their actigraphs to the experimenter, and were paid andthanked for their participation.
Data from one shift out of 42 total shifts (14 days x 3 shifts per day) at the freight operationwere compromised due to a temporary problem on the rail network. No other data-relatedproblems were encountered during the two weeks of data collection at either site.
Appendix B contains copies of all of the forms used in the field study.

40
5. DISPATCHER ASSESSMENT
This chapter presents study findings and observations about the sampled railroad dispatchers.The results are organized under five subtopic headings:
• Dispatcher Characteristics.• Workplace Characteristics.• Workload.• Stress.• Fatigue.
These data were collected from a small, non-randomly selected sample of dispatchers, andmay not, consequently, be representative of the entire railroad industry. Thus, this informationshould be used to: 1) gain insight into the dispatchers who participated in this study, and2) identify areas that could benefit from further research.
The majority of the significance testing was accomplished through Analysis of Variance(ANOVA) and t-test procedures. As this is an exploratory analysis, specific a priori hypotheseswere not postulated, and statistical testing was two-tailed unless otherwise noted. A significancelevel of p<0.05 was set for this study except where otherwise stated. SPSS 8.0 (SPSS, 1998) wasused to analyze the data.
5.1 Dispatcher Characteristics
This section provides demographic information about railroad dispatchers based on self-report data collected from responses to the background survey. Data from the passenger andfreight operations field sites are compared. Data are also collapsed and parsed into moderatingvariables (e.g., age, job tenure), and compared to national normative data when appropriate.
While there is no reason to hypothesize differences between the two field locations,differences from the general U.S. population were anticipated for those variables identified bythe literature as being sensitive to shiftwork. These variables include issues of psychologicalwell-being, certain health-related afflictions such as gastrointestinal distress, headaches, andsleep problems, and a general tendency to be overweight due to poor nutritional habits whenworking nights. It was also expected that some health and well-being variables would beconnected to job tenure and age. Job tenure was considered a relevant moderator variable sincepeople unsuited for railroad dispatching, or more broadly, shiftwork in general, are expected toself-select out of the profession over time. Age was considered a moderating variable, since age-related physiological changes affect susceptibility to various illnesses and conditions.

41
5.1.1 General Background Information
Table 5 summarizes several dispatcher demographic variables. Analysis of Variance(ANOVA) revealed no statistical differences between the freight and passenger operations onthese variables. All of the study participants had at least a high school diploma, and the majorityhad at least several years of college (70 percent at freight, 82.4 percent passenger dispatchoperations). Out of the 37 total participants, 31 were male (84 percent), with two femaledispatchers working at the freight operation and four at the passenger operation. Dispatcherparticipants at the freight and passenger operations weighed, on average, 142.5 and 192 lb,respectively. Sixty-five percent of the freight dispatchers and 63 percent of the passengerdispatchers were married, having, on average, 1.5 and 1.6 children, respectively. The medianages of dispatchers at the freight and passenger operations were 43.5 and 43 years, respectively.Participants were also asked how old they feel, a measure known as subjective age. Researchhas found that a higher subjective age (relative to physiological age) is related to chronic stressand poor psychological well-being (Barnes-Farrell and Petrowski, 1991). Given the nature of thejob, it was expected that participants would report greater subjective ages relative to their trueages. In fact, a significant difference was found between how old participants were and how oldthey felt. However, at both sites, participants’ subjective ages were generally lower than theirphysiological ages. Looking at the data separately for those younger than 40 and those olderthan 40 produces similar results.
To summarize, the typical dispatcher in this study was experienced in their job, male,married with 1 to 2 children, had at least a high school diploma, and was overweight2. Thislatter finding is particularly noteworthy, since overweight people tend to incur increased sleep
____________2This was determined using the 1999 Metropolitan Life Insurance Company height weight charts for men and women found athttp://www.metlife.com/Lifeadvice/Tools/Heightnweight/index.html
Table 5. Demographic characteristics of the study participants
VariableOverall(n=37)
Median Age (Median Subjective Age) 43 (35)
Sex (percent male) 84%
Weight 184
Median Job Tenure (months) 100
Median Months as Dispatcher 96
Percent Moonlighting 8%Percent Married 70.3
Mean Number of Children 1.5
Education (range in years) 12 to 16 years
Percent Consuming Caffeine 89%
Mean Caffeine Usage (cups/can per day) 3.2 cups/cans
Percent Smokers 28%

42
difficulties such as sleep apnea, which in turn influence their wake-time alertness and sleepinesslevels. A second interesting finding was that participants reported feeling younger than theywere, suggesting that the dispatchers who participated in the study may not feel chronicallystressed. The issue of stress is discussed in detail in subsection 5.4.
5.1.2 Job Experience
The median3 tenure for the participants’ current job was about 100 months. Twenty-three ofthe 37 total participants (62 percent) have five or more years of experience, and are generallyconsidered to be "veterans" by the industry. The percentage of experienced dispatchers whoparticipated in the study was similar at both sites. The experience of the remaining 14participants ranged from just beginning their career to having 58 months of experience. Onlythree of the 37 dispatchers, all from the freight operation, reported working a second job. Thesesecond jobs were home or organization-based (e.g., embroidery work, church organist) and donot appear to demand large amounts of the dispatcher’s time. Approximately four out of everyfive (81 percent) participants worked in another capacity for the railroad before entering dispatchwork. Table 6 provides a breakdown of these different jobs. The non-railroad prior workexperiences varied widely and included such occupations as student, meat packing and restaurantmanagement. Those dispatchers with less job tenure tended to be the ones with less priorrailroad experience before becoming a dispatcher.
Examination of job experience-related variables yielded two interesting findings. First, veryfew of the participants worked second jobs. The lack of second jobs may be the result of theavailability of abundant overtime, the unpredictability of changing work schedules, or simplythat they are satisfied with the money they currently earn through dispatching. Another reasonmay be participants’ desire to spend time with their families. The second interesting finding wasthat many of the less experienced dispatchers came from jobs outside the railroad industry. Thisprovides evidence supporting one of the concerns recently expressed by the railroad industry,which is that the traditional career path to becoming a dispatcher is being eliminated. Previousentry points to becoming a dispatcher, such as working as tower and block operators, are beingeliminated due to advances in dispatchingtechnology and operational changes such ascentralized dispatching. As a result, therailroads are beginning to have to hire people“off-the-street” for one of its most demanding,safety-critical positions. These new hires donot have any prerequisite knowledge ofrailroad operations. Only seven dispatchers inthe current study fit this description. This sub-sample was considered to be too small, bothwith regard to the current sample as well aswith regard to the U.S. dispatcher population,
Table 6. Prior work experience of studyparticipants
____________3The median was used instead of the mean as a measure of central tendency. This was done as an attempt to mitigate skewingthat might occur should either a preponderance of younger or older dispatchers confound the study of interest.
Prior PositionsNumber
(%)
Block Operators 11 (29.7)
Railroad Clerk 10 (27.1)
Railroad Operations 6 (16.2)
Other Railroad Positions 3 (8.1)
Non-railroad 7 (18.9)
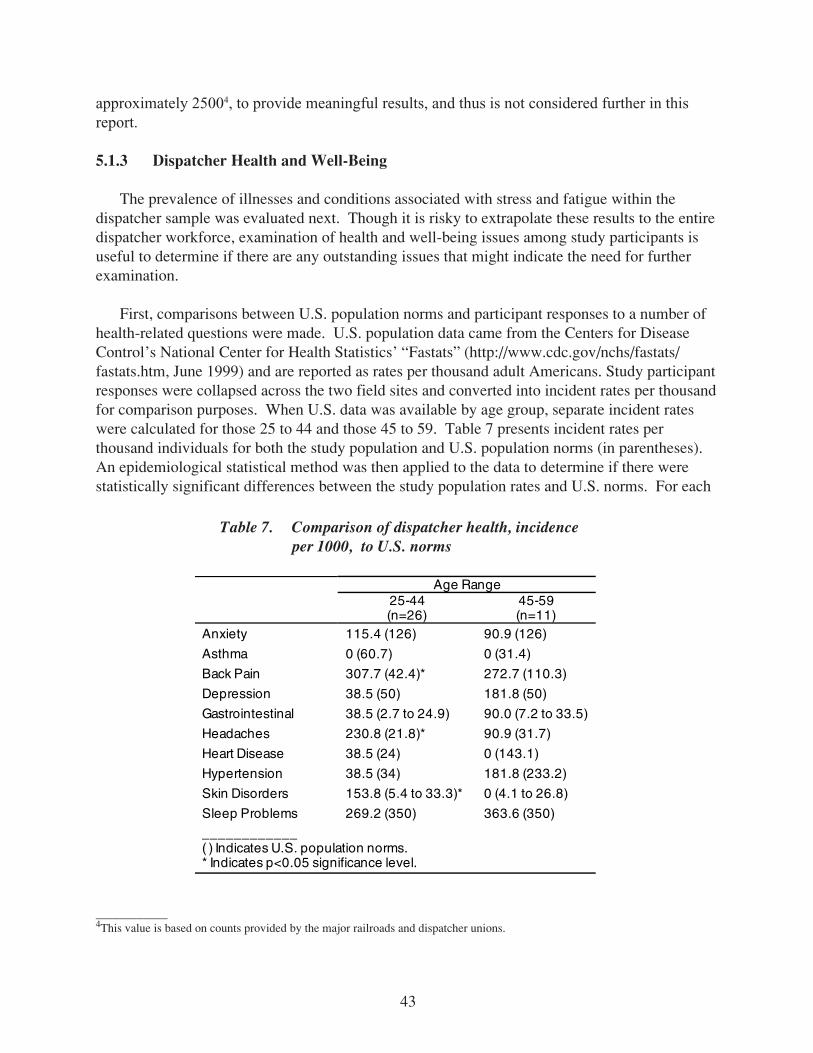
43
approximately 25004, to provide meaningful results, and thus is not considered further in thisreport.
5.1.3 Dispatcher Health and Well-Being
The prevalence of illnesses and conditions associated with stress and fatigue within thedispatcher sample was evaluated next. Though it is risky to extrapolate these results to the entiredispatcher workforce, examination of health and well-being issues among study participants isuseful to determine if there are any outstanding issues that might indicate the need for furtherexamination.
First, comparisons between U.S. population norms and participant responses to a number ofhealth-related questions were made. U.S. population data came from the Centers for DiseaseControl’s National Center for Health Statistics’ “Fastats” (http://www.cdc.gov/nchs/fastats/fastats.htm, June 1999) and are reported as rates per thousand adult Americans. Study participantresponses were collapsed across the two field sites and converted into incident rates per thousandfor comparison purposes. When U.S. data was available by age group, separate incident rateswere calculated for those 25 to 44 and those 45 to 59. Table 7 presents incident rates perthousand individuals for both the study population and U.S. population norms (in parentheses).An epidemiological statistical method was then applied to the data to determine if there werestatistically significant differences between the study population rates and U.S. norms. For each
____________4This value is based on counts provided by the major railroads and dispatcher unions.
Table 7. Comparison of dispatcher health, incidenceper 1000, to U.S. norms
Age Range25-44(n=26)
45-59(n=11)
Anxiety 115.4 (126) 90.9 (126)
Asthma 0 (60.7) 0 (31.4)
Back Pain 307.7 (42.4)* 272.7 (110.3)
Depression 38.5 (50) 181.8 (50)
Gastrointestinal 38.5 (2.7 to 24.9) 90.0 (7.2 to 33.5)
Headaches 230.8 (21.8)* 90.9 (31.7)
Heart Disease 38.5 (24) 0 (143.1)
Hypertension 38.5 (34) 181.8 (233.2)
Skin Disorders 153.8 (5.4 to 33.3)* 0 (4.1 to 26.8)
Sleep Problems 269.2 (350) 363.6 (350)
____________( ) Indicates U.S. population norms.* Indicates p<0.05 significance level.

44
health-related variable, a critical incident rate was calculated (see Equation 2), based on theincident rates for both the study population and the U.S. norm. This critical incident rate wasthen compared to the critical value for a normal two-tailed distribution (p <0.05), 1.96.Statistically significant differences occurred when the critical incident rate exceeded 1.96. Theresults of these analyses are presented in Table 7. An asterisk in Table 7 indicates a significantdifference between the study population incident rate and U.S. norms for that particular health-related variable.
Critical rater r
StDs p =
−(2)
Where:
rs = rate of samplerp = rate of population and
StD = r r
ns s× −( )1
As can be seen, the younger study participants reported experiencing significantly higherrates of back pain, head aches and skin disorders compared to the general U.S. population.While causation cannot be determined from these data, it seems that these ailments are as likelydue to the physical environment of the workplace as due to job-related stress. Interestingly, theolder study participants did not report significantly higher incident rates for any of the health-related variables. Although it is possible that older participants did not have any significantlyworse health-related problems compared to U.S. norms, it is also possible that the lack ofsignificant differences may be a function of low power due to such a small sample size (n=11).Regardless, there appear to be some problems with the younger dispatchers in the study whichmay merit further investigation into health-related problems within the entire dispatchingpopulation. Only three conditions, anxiety, depression and sleep problems, were able to becollapsed over age groups due to similar normative values. This larger sample size increased thepower of the analysis, revealing significant critical values for anxiety (critical value = -2.36) andsleep problems (critical value = -4.36).
5.1.4 Quality of Life
Table 8 and Table 9 summarize participants’ responses to 14 different aspects of their lives.The tables are separated into positive and negative feelings. Nearly all participants, 84 percent,felt confident handling personal issues “fairly often” or “very often.” About half, 51 percent, felton top of everything “fairly often” or “very often,” and only 41 percent felt they were in controlof the usage of their time “fairly often” or “very often.” These two results may be due to theneed or pressure to work overtime. Furthermore, it appears that participants are bringing homeworkplace stress. Only half of the participants reported feeling that life is going well “fairly

45
often” or “very often,” and slightly less than that felt they were able to control life irritations“fairly often” or “very often.”
Table 9 suggests possible negative effects of overtime and workplace stress. Half of theparticipants reported feeling preoccupied with things to do “fairly often” or “very often.” Thismay be due to working more than 40 hr per week, which results in less free time for personalactivities. Furthermore, as there is no break period and the work is done in an open environment,it seems unlikely that the dispatchers are able to take care of much personal business while atwork. About one-third of the participants reported that “fairly often” or “very often” they hadbeen angered by uncontrollable issues and a quarter reported feeling stressed fairly or very often.Unfortunately, national norms were not available with which to compare these findings.
5.1.5 Summary
As expected, with respect to dispatcher characteristics, there were no substantial differencesbetween the two field study locations. This was a fairly homogenous group, and likely reflectsthe largely homogenous railroad work force. The railroad industry is one of the oldest, and itsworkforce has been made up largely of married, white men with high school degrees. There aresigns, however, that the makeup of the workforce is changing, especially as new dispatchers(among other railroad crafts) are hired off the street rather than through an established careerpath. The effects on dispatcher performance and work stress due to this change in career path arecurrently unknown. Among other adjustments that railroads have made or will have to make in
Table 8. Quality of life: positive factors
Table 9. Quality of life: negative factors
Feeling % Fairly or Very OftenConfident Handling Personal Issues 84
Able to Cope 58
On Top of Everything 51
Positively Dealt with Hassles 49
Life Going Well 49Able to Control Life’s Irritations 46
Able to Control Time Usage 41
Feeling % Fairly or Very OftenPreoccupied with Things to Do 51
Angry about Uncontrollable Issues 35
Stressed 27
Unable to Control Life 19
Upset over Something Unexpected 16Unable to Cope with Responsibilities 14
Overwhelmed with Difficulties 11

46
the near future, dispatcher training has had to change to meet the needs of new hires who lack theprerequisite knowledge of railroad operations that previous generations of dispatchers had whenbeginning their dispatching careers.
The dispatchers who participated in this study, especially the younger ones, did show somecharacteristics similar to other shiftworkers (i.e., sleep problems, headaches, trouble managingtime), in addition to some other problems (i.e., anxiety). Specifically, it appears that thedispatchers work a lot of overtime. This is potentially problematic in that overtime precludes thedispatcher benefiting from the recovery time built into the functional work schedule system.Lack of recovery time can lead to feelings of stress, anger towards the workplace, and a sense ofnever having enough time. Such findings were present in this sample. Furthermore, a verydemanding, high stress work environment could explain the health and stress-related findings.The exact etiology of the stress, whether it comes from work pace, interactions with railpersonnel, the physical environment, or other sources, is initially less important thanunderstanding whether the work experience, in fact, is producing a significant, chronic stressorreaction that is impacting other aspects of the workers’ lives. This issue will be more fullyaddressed in the following sections. The data presented here, however, does indicate evidence ofhigh stress in a significant number of the study participants.
5.2 Workplace Characteristics
The data presented in this section are also based on dispatchers’ responses to the backgroundsurvey. Passenger and freight operations are compared, and data are collapsed and grouped bymoderating variables (e.g., age, job tenure) when appropriate.
Based on anecdotal information from dispatchers, dispatchers have the opportunity to work alot of overtime. In addition to the overtime, dispatchers’ daily commute time impinges on theamount of free time that a dispatcher has over the course of a week. The result is that adispatcher may have less than an ideal amount of free time. Further, while official rest breaksare not built into most railroad dispatchers’ work, it is likely that dispatchers do, in fact, takebreaks, though the number of breaks, and the exact reasons for taking them, are not known.Lastly, the safety critical nature of the work, and the physical and social environment of theworkplace, are expected to contribute to dispatchers’ feelings of stress.
5.2.1 Work Hours
Most dispatchers (89 percent) reported that, on average, they are scheduled to work aconsecutive five-day workweek. However, over half of the dispatchers also reported that theywork an average of eight or more hours of overtime weekly. In fact, two participants hadworked more than 30 consecutive days prior to the start of the study. Twenty-seven percent ofthe participants felt that they were expected to work overtime. This figure rose to 42 percentwhen considering just those dispatchers with less than two years of job tenure. These less-tenured dispatchers tended to work primarily the extra board and were paid only 75 to 80 percentof a full dispatcher salary. Thus, not only do these less-tenured dispatchers have less controlover their work hours, their lower salaries may serve to motivate them to work extra hours.

47
The high rate of overtime may be due to understaffing at the two study sites. However, thisissue was not examined in the present study, and thus it is not possible to determine the possiblecontribution of staffing levels to the high rate of overtime experienced at these two study sites.Regardless of the cause(s), excessive overtime often causes workers to obtain less recovery timeaway from work than what is needed. Days off are an integral part of the work schedule. Theyare designed to provide the worker with time to recover physically, emotionally, and cognitivelyfrom their work. Time off also provides workers with time to address the other areas and needsin their lives. Ignoring this recovery component, especially in a chronic fashion, has thepotential to increase the chances of work-related fatigue and burnout, and family problems.
5.2.2 Commuting
Like overtime, relatively long commute times also consumed the dispatchers’ off-time.Figure 9 presents time at work and commute time for the two field study sites. On average, thedispatchers at the passenger operation reported being at the job site for 8 hr and 27 min while thefreight operation dispatchers reported being on site for 8 hr 13 min per shift. An independentt-test did not reveal a significant difference between the two sites. There was a statisticallysignificant difference in commute time, however. Specifically, the average round trip commutefor the passenger operation dispatchers was 2 hr 12 min, almost three times the length of theaverage freight operation dispatcher commute time, which was 50 min (t=-2.841, df=35,p=0.007). Adding time at work and commuting time together reveals that, on average, thepassenger dispatcher is committed for 10-1/2 hr during a workday, while the freight dispatchersare committed for about 9 hr. This difference is statistically significant (t=-2.747, df=30,p=0.01).
The above difference is likely to be not a function of type of operation, but rather, one ofdispatching center location. The passenger operation was located in a major metropolitan area,while the freight operation was located in a more rural setting. If 7 hr of sleep per night isassumed, then the passenger operation dispatchers have about 5 to 6 hr of free time per workday
Figure 9. Work-related daily time

48
to eat, be with family and friends, and take care of personal business. From this is it easy to seehow inadequate recovery time might occur if the dispatchers are also required to work at leastone of their scheduled days off. As mentioned above, chronic exposure to this type of situationmight lead to burnout, stress, and a host of family and other personal problems.
5.2.3 Rest Breaks
Although there are no official rest breaks, participants reported that they did, in fact, takebreaks from their desks. The median5 number of breaks taken per shift was four, ranging from0 to 10 for both study sites. The median number of rest breaks for smokers, who comprised 12of the 37 participants, was 3.5. Ninety-seven percent of the dispatchers reported eating at theirdesk, while the other 3 percent of participants reported that they did not eat at work. It appears,therefore, that rest breaks were taken for a more urgent reason, such as toileting or the "need tobreak away and clear the mind."
Even though it seems that rest breaks are taken, they are not necessarily taken when desired.Forty-one percent of the dispatchers reported that they are “frequently” too busy to take a breakwhile 57 percent felt that at least “occasionally” they were too busy to take a break when theywanted. As a further complication, 65 percent of the respondents reported that they had“frequent” or “constant” difficulty finding someone to cover their desk in their absence.
These data suggest that it is difficult for a dispatcher to take a break, and that these breaksoften do not occur when they are most needed or wanted. Further, when breaks are finally taken,it is often difficult to find someone to cover the desk during that time. An institutionalizedsystem for taking rest breaks, something which did not exist at either field site, might helpalleviate the problem of taking urgent breaks (i.e., toileting) without compromising safety. Thelarger issue of whether institutionalized breaks, including one for lunch, would improveperformance over the course of a shift, remains unanswered.
5.2.4 Job Demands
Table 10 presents dispatchers’ ratings on their perceived volume and pace of work. Of noteis that 97 percent of the dispatchers reported that they were “often” or “very often” confronted
____________5The median was used instead of the mean as a measure of central tendency. This was done as an attempt to mitigate skewingthat might occur given the large variance in number of breaks taken over the course of the work shift.
Table 10. Volume and pace of work by shift
Percent Reporting Experiencing “Often” or “Very Often”
Day Evening Night Extra Board OverallWorking Fast 75 83 80 91 84
Large Voume of Work 92 67 100 64 81
Heavy Concentration 92 100 100 91 95
Heavy Memory Usage 92 100 100 100 97
Lulls between Heavy Periods 25 17 20 27 22

49
with heavy memory usage, supporting the previous finding that 98 percent of the dispatchersreported being “occasionally” or “frequently” too busy to break. Neither of the dispatchingcenters in this study used computer-aided dispatching systems that provided memory or decisionaids.
Despite this reported high workload, 95 percent of the dispatchers reported feeling competentto handle emergency situations. Furthermore, 86 percent of the dispatchers reported that they“often” or “very often” knew exactly what was expected from them. Predictably, the 14 percentof respondents who reported that they “rarely” or “occasionally” knew exactly what wasexpected from them were those with less work experience. Separately, only 14 percent ofparticipants felt that they were “often” or “very often” given assignments without the supportthey needed; these dispatchers tended to have greater job tenure. Nine percent of those surveyedreported “often” or “very often” bending rules to be able to complete the job; all of theserespondents had five or more years of job experience. Only 11 percent responded that they were“frequently” or “always” asked to perform tasks outside of their job guidelines.
5.2.5 Workplace Dynamics and Stress
The issue of stress in the workplace was examined from four perspectives: emotionaldemands, physical work environment, perceptions of workplace control, and interpersonalinteraction. Each is discussed below.
5.2.5.1 Emotional Demands
Nearly all the dispatchers, 97 percent, reported feeling a great deal of responsibility for thelives and welfare of others, though only 43 percent claim that this caused “a lot” or a “great deal”of stress or anxiety. Still, 30 percent reported “occasionally” and 9 percent reported “frequently”calling in sick due to stress. While almost 40 percent of the respondents reported that they call insick at least occasionally due to stress, national norms were not available for comparison.
5.2.5.2 Physical Work Environment
Table 11 reveals that there was some discomfort with regard to the physical workenvironment. This was expected, though, given the variability in human comfort levels. Of noteis the rating for air quality; less than 50 percent of the dispatchers reported air quality asacceptable. Both dispatching centers were in windowless office structures and therefore reliedon internal ventilation. All respondentsreported that they can and do adjust their chairswhen coming on shift. Furthermore, alldispatchers reported a “high” or “very high”visual demand component to their work,monitoring between four to seven electronicvisual displays throughout their shift. Half ofthe dispatchers reported feeling at least“sometimes” having irritated, itchy, or soreeyes.
Table 11. Physical environment
Factor % AcceptableLighting 70Noise 62Temperature 57Air Quality 49
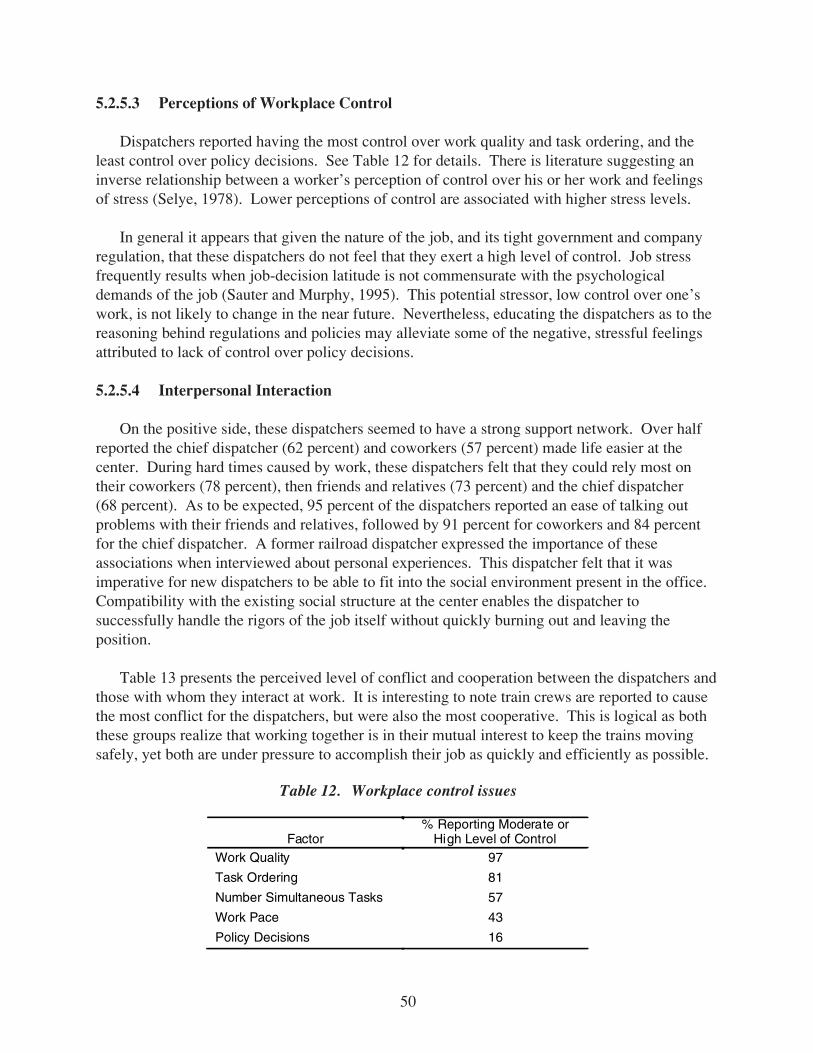
50
5.2.5.3 Perceptions of Workplace Control
Dispatchers reported having the most control over work quality and task ordering, and theleast control over policy decisions. See Table 12 for details. There is literature suggesting aninverse relationship between a worker’s perception of control over his or her work and feelingsof stress (Selye, 1978). Lower perceptions of control are associated with higher stress levels.
In general it appears that given the nature of the job, and its tight government and companyregulation, that these dispatchers do not feel that they exert a high level of control. Job stressfrequently results when job-decision latitude is not commensurate with the psychologicaldemands of the job (Sauter and Murphy, 1995). This potential stressor, low control over one’swork, is not likely to change in the near future. Nevertheless, educating the dispatchers as to thereasoning behind regulations and policies may alleviate some of the negative, stressful feelingsattributed to lack of control over policy decisions.
5.2.5.4 Interpersonal Interaction
On the positive side, these dispatchers seemed to have a strong support network. Over halfreported the chief dispatcher (62 percent) and coworkers (57 percent) made life easier at thecenter. During hard times caused by work, these dispatchers felt that they could rely most ontheir coworkers (78 percent), then friends and relatives (73 percent) and the chief dispatcher(68 percent). As to be expected, 95 percent of the dispatchers reported an ease of talking outproblems with their friends and relatives, followed by 91 percent for coworkers and 84 percentfor the chief dispatcher. A former railroad dispatcher expressed the importance of theseassociations when interviewed about personal experiences. This dispatcher felt that it wasimperative for new dispatchers to be able to fit into the social environment present in the office.Compatibility with the existing social structure at the center enables the dispatcher tosuccessfully handle the rigors of the job itself without quickly burning out and leaving theposition.
Table 13 presents the perceived level of conflict and cooperation between the dispatchers andthose with whom they interact at work. It is interesting to note train crews are reported to causethe most conflict for the dispatchers, but were also the most cooperative. This is logical as boththese groups realize that working together is in their mutual interest to keep the trains movingsafely, yet both are under pressure to accomplish their job as quickly and efficiently as possible.
Table 12. Workplace control issues
Factor% Reporting Moderate or
High Level of ControlWork Quality 97
Task Ordering 81
Number Simultaneous Tasks 57
Work Pace 43
Policy Decisions 16

51
The data indicated that the operations manager was associated with the most problems for thesedispatchers, with a moderate level of conflict and the lowest level of cooperation among thecomparison groups. It is likely that the operations manager is the least involved in making surethe daily work is accomplished and is likely to intervene only when there is already a problem ora perceived situation. The other four groups have to work together more often, making sure thework is accomplished on a day-to-day basis.
Despite the apparent strong social support network and cooperation, 27 percent of thedispatchers did report “sometimes” or “frequently” losing their temper at work. In addition,92 percent reported that others on their shift “sometimes” or “frequently” lost their temper. Themanagers of the study sites provided anecdotal information that supported this result. Figure 10shows that over 40 percent of the participants report that they take work stress home with them.While this percentage was higher for the passenger operation dispatchers, this difference was notstatistically significant.
Table 13. Dispatcher perceptions of levels of conflict andcooperation with other railroad workers
Figure 10. Evidence of workplace stress
Dispatcher VersusLevel of Conflict
(%)Level of Cooperation
(%)Train Crews 49 95
Maintenance Crews 43 84
Operations Manager 41 81
Other Dispatchers 38 87
Chief Dispatcher 24 89
52
5.2.6 Summary
Most full-time occupations have work schedules with built-in lunch or rest breaks. While thedispatchers’ work shifts are typically shorter than those in other full-time occupations due to thelack of planned breaks, the commute times tend to average out this difference, especially withregard to the urban field site. Also, as there is so much overtime being worked, the dispatchers’amount of free or recovery time is further diminished, possibly to a point of breakdown in therecovery process. Such a breakdown might manifest itself in the form of increased stress andother problems both inside and outside of work. This issue is further compounded by the lack offormal breaks while at work, and that the breaks that are taken are usually not when desired.Given the difficulty in finding someone to cover a desk, these breaks may be taken withoutanyone monitoring the territory.
Regarding the job and work environment, though nearly all the dispatchers reported that theyoften dealt with high workloads, most felt capable of handling emergencies and competent inhandling all aspects of their job. Only a few felt it necessary to bend the rules to accomplishtheir work or perform work outside their job guidelines. Though less than half felt that thenature of the job itself causes much anxiety within them, a large minority of the participants didreport taking sick time due to stress. The nature of this stress seemed to result less from thephysical work environment and more with issues of control over work and interpersonalinteractions. This is a somewhat different finding than what was expected, that workload andwork responsibility would cause the majority of the work-related stress.
5.3 Workload
Dispatcher workload was examined using three separate sources of data. The first source ofdata, considered to be the most objective, was derived from the mTAWL. These data werecollected through naturalistic observation of the dispatchers performing their job. The secondtype of workload data was related to traffic volume and was obtained from dispatcher self reportsof the number of trains and other track users they handled every 2 hr over the course of theirshift. Finally, subjective rating data were also collected from the dispatchers every 2 hr duringtheir shifts. These subjective ratings included two NASA TLX subscales—mental demand andlevel of effort—and an overall workload scale.
Again, the paucity of data currently available on railroad dispatcher workload precluded anyspecific a priori hypothesis to be made. Based on anecdotal information, however, it is likelythat there would be time-of-day, territory, and type-of-operation (e.g., passenger or freight)differences. For example, it was expected that the passenger operation would show rush houreffects during the workweek, an event that probably does not occur on the territory controlled bythe freight operation. Furthermore, it is likely that not all desks are affected by rush hour at thepassenger operation, or at least at the same time or intensity. There is no available, publishedevidence to date, however, that reveals workload levels, even during rush hour, as beingexcessive and beyond safe human handling.

53
5.3.1 Objective Workload
The mTAWL methodology is the most objective measure of workload employed in thisstudy. As mentioned, trained observers recorded all activities and track user movements thatoccurred during a dispatcher’s shift. Given the time-intensive nature of this methodology, andbeing that this was the first time it was employed in this manner, the data it provided was usedprimarily in a diagnostic manner. That is, the mTAWL was used to evaluate relative workloadlevels of the dispatcher desks at the two field sites. It was not used to collect information for thepurpose of dispatcher comparison or correlation to dispatcher subjective reports.
As discussed under Section 3, the first step of the mTAWL analysis was to hold a small focusgroup with experienced dispatchers at each dispatching center. The purpose of this focus groupwas to obtain consensus on the different dispatching tasks and on the auditory, visual, cognitiveand psychomotor channel loadings to be used in the analysis. Table 14 presents the variousmTAWL category channel weights for the two study sites. The two field sites independentlyderived channel loadings for all presented categories.
Appendix C contains mTAWL charts for each participant that was observed during the datacollection period. The 22 mTAWL charts present standardized data for a participant relative tothe other desks that were observed at his or her dispatching center. Given that most desks wereevaluated only once, on a randomly selected shift and day, and thereby leaving incomplete cellsin the data matrix, these data were not aggregated for statistical analysis. Rather, these data wereused for diagnostic purposes to determine workload trends within each dispatching office.
5.3.1.1 Shift Effects
Visual inspection of these data (see Appendix D) revealed a possible desk by time-of-day bytime-of-week interaction. For example, Desk A of the freight operation on the Day 2 day shift, aTuesday, shows a different workload pattern than the Day 5 day shift of this same desk (seeFigure 11 and Figure 12, respectively). In this case the work surge seems to come earlier onDay 5 than on Day 2. Furthermore, if Desk A day shift is compared with data from its night shiftrecorded on Day 12 seen in Figure 13, the change in overall level of activity is immediatelynoticeable. There also seem to be differences between desks. While all the desks observed onthe first shift seem to show workload peaks, the desks observed on the second shift showconsiderable variation. For example, Desk D hovered around the mean for the duration of theshift while desk G vacillated, peaking twice for short periods of time, while Desk F peaked onceduring the first third of the shift, while Desk E showed high workload throughout the shift (seeFigure 14 through Figure 17). The desks observed during the third shift showed similardifferences, though the absolute level of activity seemed to be less. Interestingly, there appear tobe distinct channel groups, that is, the visual and auditory channels and the cognitive andpsychomotor channels tend to cluster together at about the same amplitudes. These twogroupings, however, tend to have different amplitudes. It is unclear at this point, however, ifthese differences are due to time-of-day, desk demands, job experience, or some other factor.

54
There seems to be a bit more within shift variability between desks for the passengeroperation dispatchers. For example, the two times Desk A was observed on the day shift, levelsof workload were primarily around or below the mean. Desk B, however, showed a late morningpeak while Desk C began an extended interval of extremely high workload soon after thedispatcher came on shift. There are also between-shift differences, as observed by comparing thecharts of Desks B and D between first and second shift. Second shift and third shift activityobserved on Desk G appear to be much more quiet compared to first, and show a much moredefined period of activity than the data charted from the freight operation. Of note is that this setof charts does not indicate a grouping of workload channels as seen with the freight operation.
5.3.1.2 Between-Desk Comparisons
While these charts provide the pattern and amplitude of workload over the course of a shift,they do not provide an easy way to directly compare desks at a given center. Table 15 extracts
Table 14. mTAWL channel loadings
ChannelsAuditory Visual Cognitive Motor
Background Auditory Monitoring F 1 0 0 0P 2 0 0 0
Background Visual Moitoring F 0 1 1 0P 0 2 0 0
Background Radio/Telephone F 3 1 2 2P 4 1 2 1
Foreground Radio/Telephone F 3 1 2 2P 3 1 3 1
Background Clerical F 0 2 2 6P 0 2 2 3
Planning for Unopposed Track Movement F 1 1 1 1P 1 1 2 0
Handling Unopposed Track Movement F 1 1 1 1P 1 2 2 2
Planning for Opposed Track Movement F 1 1 3 1P 2 1 3 0
Handling Opposed Track Movement F 1 1 3 2P 3 1 3 2
Foreground Clerical F 0 2 2 6P 2 2 3 5
____________Key: F = freight
P = passenger

55
Fig
ure
11.
Fre
ight
ope
ratio
ns, T
uesd
ay, d
ay s
hift
, Des
k A

56
Fig
ure
12.
Fre
ight
ope
ratio
ns, F
rida
y, d
ay s
hift
, Des
k A

57
Fig
ure
13.
Fre
ight
ope
ratio
ns, T
hurs
day,
nig
ht s
hift
, Des
k A
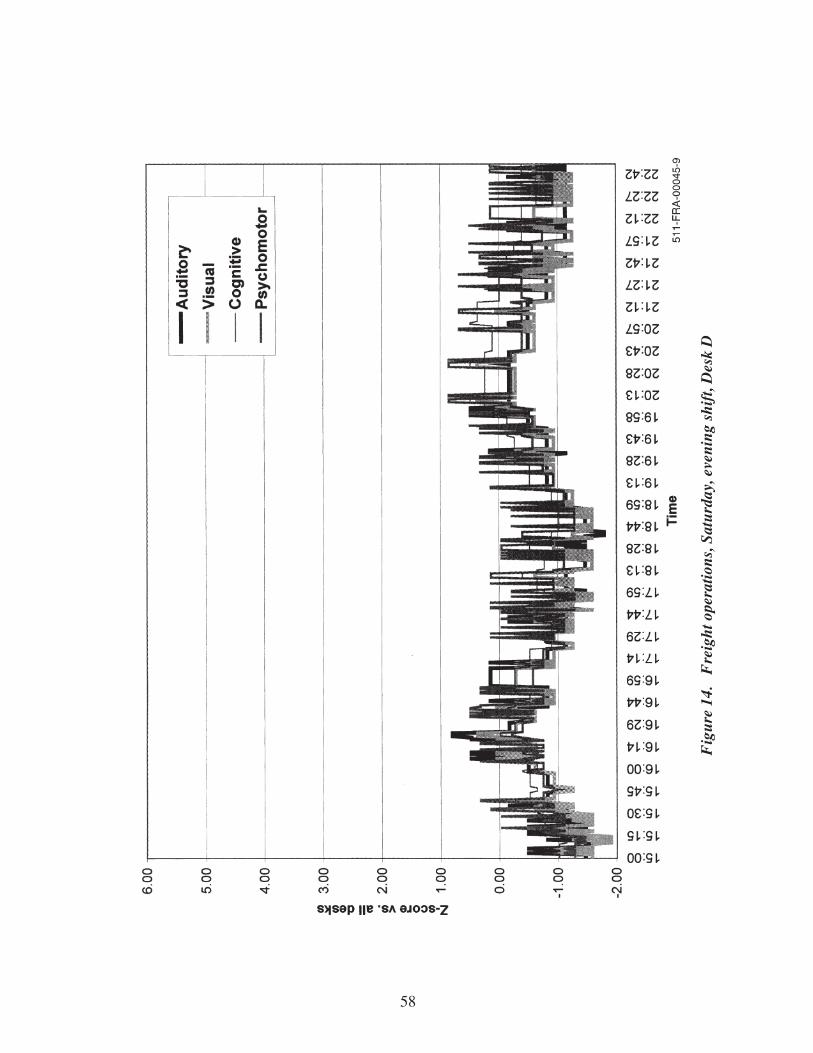
58
Fig
ure
14.
Fre
ight
ope
ratio
ns, S
atur
day,
eve
ning
shi
ft, D
esk
D

59
Fig
ure
15.
Fre
ight
ope
ratio
ns, T
uesd
ay, e
veni
ng s
hift
, Des
k G

60
Fig
ure
16.
Fre
ight
ope
ratio
ns, M
onda
y, e
veni
ng s
hift
, Des
k F

61
Fig
ure
17.
Fre
ight
ope
ratio
ns, S
unda
y, e
veni
ng s
hift
, Des
k E

62
from each chart the total percent of time the dispatcher was in an overload state, defined ashaving at least two channels that are two or more standard deviations above the mean. Thesevalues are computed using two separate approaches. The first approach involved standardizingscores individually by desk. This value was then used to determine the degree of workloadvariability that occurs at that desk during a shift. The second approach involved computingstandardized scores using the entire data set collected at the center. This second approachallowed comparisons to be made across desks at the same center to determine if there was aneven distribution of workload, or if particular desks are overly burdened relative to other desksthat were observed at the dispatching center.
As can be seen in Table 15, each dispatching center contained one desk that appears tooverload the dispatcher for a relatively high percentage of the time. For example, day shift deskA at the freight operation and day shift Desk C at the passenger operation produced an overloadstate for 84 min and 101 min, respectively. The next most overloaded desk at both sites was inan overload state for less than 5 percent of the shift (i.e., less than 30 min). The overload statewas likely due to the shift, desk and day of the week in which the desks were observed. Within-shift variability of a single desk does not necessarily lead to similar results as obtained from
Table 15. mTAWL overload rating by desk
Type ofOperation Day
WorkShift
DeskObserved
% of TimeOverloadedwithin Shift
Minutes ofTime
Overloadedwithin Shift
% of TimeOverloaded
AcrossDesks
Minutes ofTime
OverloadedAcrossDesks
Freight Tuesday 1 A 3.4 16 3.8 18Wednesday 1 B 1.1 5 1.8 9Thursday 1 C 0.9 4 0.2 1Friday 1 A 1.1 5 17.5 84Sunday 2 D 0.0 0 0.0 0Monday 2 E 2.1 10 3.2 15Tuesday 2 F 4.9 24 0.6 3Wednesday 2 G 2.6 12 0.9 4Thursday 3 D 8.3 40 0.0 0Friday 3 A 3.3 16 0.0 0
Passenger Monday 1 A 4.5 22 0.0 0Tuesday 1 B 0.0 0 0.0 0Wednesday 1 C 6.7 32 21.0 101Thursday 1 B 4.0 19 0.2 1Friday 1 D 1.0 5 1.3 6Saturday 1 E 2.5 12 0.0 0Sunday 1 E 2.6 12 0.0 0Monday 1 F 2.1 10 4.2 20Tuesday 1 A 7.5 36 0.0 0Wednesday 2 B 0.9 4 0.0 0Thursday 2 D 0.0 0 0.0 0Friday 3 G 4.5 22 0.0 0

63
workload comparisons across desks. Day shift Desk A at the freight operations was overloaded17.5 percent of the time but only 1.1 percent of the time when compared within shift to itself.This means that the dispatcher is generally experiencing a high workload level throughout theshift. The chart confirms this. Conversely, night shift Desk D at the same operation did notexperience any overload when comparing between desks but does show an overload 8.4 percentof the time for the within-desk (i.e., several dispatchers working the same desk on different days)comparison. This indicated a greater range or higher variability in workload over the shift thanwhat was experienced in Desk A.
While the mTAWL data appear to indicate some overload states, it was not possible tocollect dispatcher performance (i.e., benchmark) data to validate these conclusions. In fact,dispatcher performance may be affected by high levels of overload, high levels of underload, orby high variability in workload. Although performance data were not collected, the mTAWLdata do appear to provide diagnostic information about the individual desks that were observed.In particular, the mTAWL metric, normalized number of minutes overloaded, providesinformation about the pattern of workload at a center’s dispatcher desks, and whether workloadis evenly distributed across desks during a given shift within a dispatching center. In relation tothis study, it appears that at least one desk per study site may be experiencing excessiveworkload.
5.3.2 Self-Report Workload
A 2X3X4 ANOVA was computed comparing separately the numbers of trains and othertrack users reported being handled by the dispatchers between the study sites, across the threeshifts, and the two-hour intervals within each shift. (See Table 16 for a summary of the results.)Independent t-tests were also used to compare field sites by shift. (See Table 17.) A moreconservative significance level, p<0.01, is used to control for Type II error. Of the significantwithin-shift differences found between these two field sites, typically it was the passengeroperation that reported a greater number of trains and track users. While the majority of thesedifferences occurred during the night shift, several differences were also found during the dayand afternoon shifts. These data are plotted in Figure 18 through Figure 20.
As is shown in these figures, the number of trains handled at the freight operation, bothacross shift and across a 24 hr period, is more evenly distributed than at the passenger operation.This was expected as the passenger operation was subject to rush hour surges in the morning andevening commuting hours. The number of track users also fluctuated more for the passengeroperation since the territory that these dispatchers controlled was undergoing a lot of heavymaintenance. The freight operation appears to dispatch consistently more trains than thepassenger operation except during daily work commute hours. The passenger operationconsistently dispatched more track users throughout a 24 hr period.
Shift effects, tested by repeated measures ANOVA, were calculated separately for each studysite. Analyses were separated by field site for two reasons. First, the ANOVAs and t-tests thatare reported in Tables 16 and 17 already indicated a significant difference between the twooperations. Secondly, there was an unusually large amount of night MOW activity with the

64
passenger operation due to the upgrading of the Northeast corridor, a short-term situation notrelevant to the freight operation. Results of the repeated measures ANOVA are reported inTable˚18. Significant time-into-shift effects were found for both the number of trains and thenumber of other track users dispatched in the freight operation, but only the number of trainsdispatched in the passenger operation. A simple shift effect was found in all cases, indicatingthat the number of trains and other track users dispatched varied by shift. Table E-1 in AppendixE further examines these shift effects through a series of Tukey Honestly Significant Difference(HSD) post hoc comparisons. The large number of differences between the shifts suggests thateach shift should be considered separately.
5.3.3 Subjective Ratings
ANOVA was used to evaluate the effects of field site, shift and time-into-shift on subjectiveworkload, stress and fatigue. Results of these analyses may be found in Table 19. Table E-2 inAppendix E presents the mean subjective workload, stress, and fatigue ratings by study site foreach shift and data collection period. This table also includes baseline subjective ratings thatwere collected just prior to the onset of each work period. The first shift dispatchers at thepassenger operation started off with higher subjective ratings of workload, stress, and fatiguethan the freight operation. This may be due to the anticipation of the rush hour dispatching theyare about to handle, a difference in the organizational climate of the dispatching centers, thedifference between an urban and a rural setting, or the difference in commute times to work orease of commute. These workload, stress and fatigue differences continue through the morning
Table 16. ANOVA evaluation of effect of type of operation, shift andtime into shift on workload measures
Comparison F DF p
Number of TrainsSite 1.58 1, 1356 0.208Shift 18.58 2, 1356 0.000Time into Shift (TIS) 5.994 3, 1356 0.000Site X Shift 11.58 2, 1356 0.000Site X TIS 3.00 3, 1356 0.030Shift X TIS 1.66 6, 1356 0.127Site X Shift X TIS 1.74 6, 1356 0.109
Number of Track UsersSite 31.36 1, 1356 0.000Shift 107.92 2, 1356 0.000Time into Shift (TIS) 0.640 3, 1356 0.589Site X Shift 0.714 2, 1356 0.490Site X TIS 0.191 3, 1356 0.903Shift X TIS 1.995 6, 1356 0.063Site X Shift X TIS 1.7 6, 1356 0.117
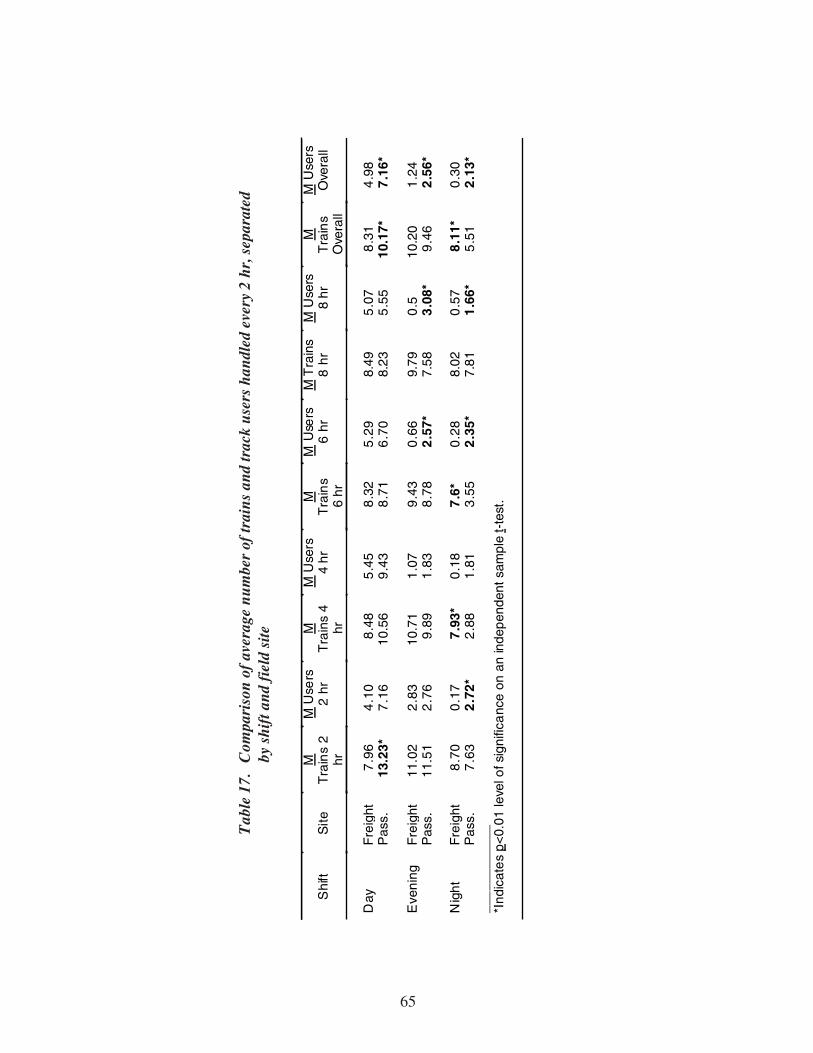
65
Tab
le 1
7.C
ompa
riso
n of
ave
rage
num
ber
of tr
ains
and
trac
k us
ers
hand
led
ever
y 2
hr, s
epar
ated
by s
hift
and
fie
ld s
ite
Shi
ftS
iteM
Tra
ins
2hr
M U
sers
2 h
rM
Tra
ins
4hr
M U
sers
4 hr
MT
rain
s6
hr
M U
sers
6 h
rM
Tra
ins
8 h
rM
Use
rs8
hrM
Tra
ins
Ove
rall
M U
sers
Ove
rall
Day
Fre
ight
7.9
64
.10
8.4
85
.45
8.3
25
.29
8.49
5.0
78
.31
4.9
8P
ass.
13.2
3*7
.16
10.5
69
.43
8.7
16
.70
8.23
5.5
510
.17*
7.1
6*
Eve
ning
Fre
ight
11.0
22
.83
10.7
11
.07
9.4
30
.66
9.79
0.5
10.2
01
.24
Pas
s.11
.51
2.7
69
.89
1.8
38
.78
2.5
7*7.
583
.08*
9.4
62
.56*
Nig
ht
Fre
ight
8.7
00
.17
7.9
3*0
.18
7.6
*0
.28
8.02
0.5
78
.11*
0.3
0P
ass.
7.6
32
.72*
2.8
81
.81
3.5
52
.35*
7.81
1.6
6*5
.51
2.1
3*__
___
____
___
*Ind
icat
es
p<0.
01 le
vel o
f sig
nific
anc
e on
an
inde
pend
ent s
ampl
e t-
test
.

66
Figure 18. Workload comparisons for day shift by type of operation and time into shift
Figure 19. Workload comparisons for evening shift by type of operation and time into shift

67
Figure 20. Workload comparisons for night shift by type of operation and time into shift
Table 18. Repeated measures analysis on number of trains and track users over shift
rush hour, after which they fall off except feelings of fatigue, which persist through the 6 hr markinto the shift. The only difference found with the evening shift was that the dispatchers at thepassenger operation reported higher perceived workload 2 hr into shift. This coincides with theevening rush hour period.
The freight operation dispatchers reported significantly higher levels of subjective workloadand stress at points during the night shift than did the passenger operation dispatchers. Again,this fits with the pattern of workload data based on number of trains and other track users.Interestingly, the only fatigue difference for this shift came from the passenger operationdispatchers after 2 hr on shift. Subjective workload, stress, and fatigue data are plotted in
Type ofOperation Workload Measure
Time intoShift Effect Shift Effect
Freight Number of Trains F(3,558)=4.225* F(6,558)=2.818*
Number of Track Users F(3,567)=2.794* F(6,567)=21.537*
Passenger Number of Trains F(3,441)=20.599* F(6,441)=7.592*
Number of Track Users F(3,405)=1.24 F(6,405)=3.685*____________*Indicates p<0.05 level of significance.

68
Figure 21 through Figure 23. In general, subjective workload seems to follow traffic volume,that is, the number of trains and other track users. Feelings of stress and fatigue appear tolinearly increase throughout the shift, somewhat independent of perceived workload, study site,and shift worked. The one exception to this was that level of perceived stress seemed to closelyfollow perceived workload for passenger operation dispatchers on the night shift, both being verylow. Subjective fatigue always increased over the course of the shift, at least doubling during theday and evening shifts, and nearly doubling during the night shift for dispatchers at both studysites.
Repeated measures ANOVAs calculated separately for each study site on participant selfratings are reported in Table 20. Significant main effects, in terms of hours into shift, werefound on perceived workload, stress and fatigue for passenger operation dispatchers, whilesignificant main effects were found only for perceived stress and fatigue for the dispatchers at
Table 19. ANOVA evaluation of effect of type of operation, shift andtime-on-shift on workload, stress and fatigue
Comparison F DF p
Subjective Workload
Type of Operation 4.289 1, 1737 0.038
Shift 4.111 2, 1737 0.017
Time into Shift (TIS) 1.231 4, 1737 0.296
Site X Shift 28.508 2, 1737 0.000
Site X TIS 1.158 4, 1737 0.328
Shift X TIS 5.484 8, 1737 0.000
Site X Shift X TIS 1.860 8, 1737 0.062
Subjective Stress
Type of Operation 3.224 1, 1737 0.073
Shift 5.923 2, 1737 0.003
Time into Shift (TIS) 9.135 4, 1737 0.000Site X Shift 9.695 2, 1737 0.000
Site X TIS 0.953 4, 1737 0.432Shift X TIS 3.730 8, 1737 0.000
Site X Shift X TIS 1.333 8, 1737 0.222
Subjective Fatigue
Type of Operation 36.912 1, 1737 0.000
Shift 57.183 2, 1737 0.000
Time into Shift (TIS) 35.582 4, 1737 0.000
Site X Shift 4.785 2, 1737 0.008
Site X TIS 0.124 4, 1737 0.974
Shift X TIS 0.556 8, 1737 0.814
Site X Shift X TIS 0.450 8, 1737 0.891

69
Figure 21b. Subjective ratings comparison of stress for the day shift
Figure 21a. Subjective ratings comparison of workload for the day shift
Figure 21c. Subjective ratings comparison of fatigue for the day shift

70
Figure 22c. Subjective ratings comparison of fatigue for the evening shift
Figure 22a. Subjective ratings comparison of workload for the evening shift
Figure 22b. Subjective ratings comparison of stress for the evening shift

71
Figure 23a. Subjective ratings comparison of workload by type of operation for the night shift
Figure 23b. Subjective ratings comparison of stress by type of operation for the night shift
Figure 23c. Subjective ratings comparison of fatigue by type of operation for the night shift

72
the freight operation. A simple shift effect was found for only workload and stress ratings atboth operations; levels of perceived fatigue were not found to be associated with shift worked.
These shift effects were further examined through a series of Tukey HSD post hoccomparisons. Complete post hoc results are in Table E-3 in Appendix E. The pattern of resultsfor passenger operation dispatchers indicates that all three shifts start off with relatively highratings of subjective workload, stress and fatigue, but that the slope of these functions differsacross time, though having a similar asymptote. Night shift dispatcher ratings of perceivedfatigue increase more quickly over time than those of the day and evening shift dispatchers.Otherwise, workload and stress seem to increase more quickly during the day shift than theafternoon shift, and the night shift values seem to be more closely associated with the measuresof reported workload. Results for the freight operation dispatchers were similar in that fatigueaccumulated more quickly during the night shift than the day and evening shifts. There was notas clear a difference with workload and stress for the freight operation dispatchers, however.This is likely a result of the consistent workload that they experienced throughout the course ofthe day.
Correlations were computed between both number of reported trains and track users andperceived workload, stress and fatigue. These computations were done for each data collectionpoint within each shift separately for each field location. (Summary statistics are in Table 21 andthe complete correlation matrix is located in Appendix E.) Perceived workload was moderatelyassociated with reported number of trains dispatched, regardless of shift or study location. Thesecorrelations were found to be significant, and therefore reliable, for the majority (i.e., 92˚percent)of the computations. Perceived stress was also related to the number of trains dispatched,especially at the freight operation where 92˚percent of the coefficients were significant andreliable, compared to 42˚percent at the passenger operation. Subjective fatigue had the lowestassociation with the number of trains and other track users dispatched, particularly among thedispatchers at the passenger operation. In fact, the strength of the reliable associations betweennumber of track users and subjective workload, stress and fatigue ratings was found to be half ofwhat it was when using number of trains handled by the passenger operations dispatcher. This
Table 20. Repeated measures analysis on perceived workload, stress andfatigue over shift by type of operation
Type ofOperation Perception Hours into Shift Shift Worked
Freight Perceived Workload F(4,732)=1.840 F(8,732)=7.966*Perceived Stress F(4,732)=20.221* F(8,732)=7.697*Perceived Fatigue F(4,732)=66.835* F(8,732)=0.921
Passenger Perceived Workload F(4,560)=2.536* F(8,560)=6.928*Perceived Stress F(4,556)=5.057* F(8,556)=5.057*Perceived Fatigue F(4,556)=39.757* F(8,556)=0.177
____________*Indicates p<0.05 level of significance.
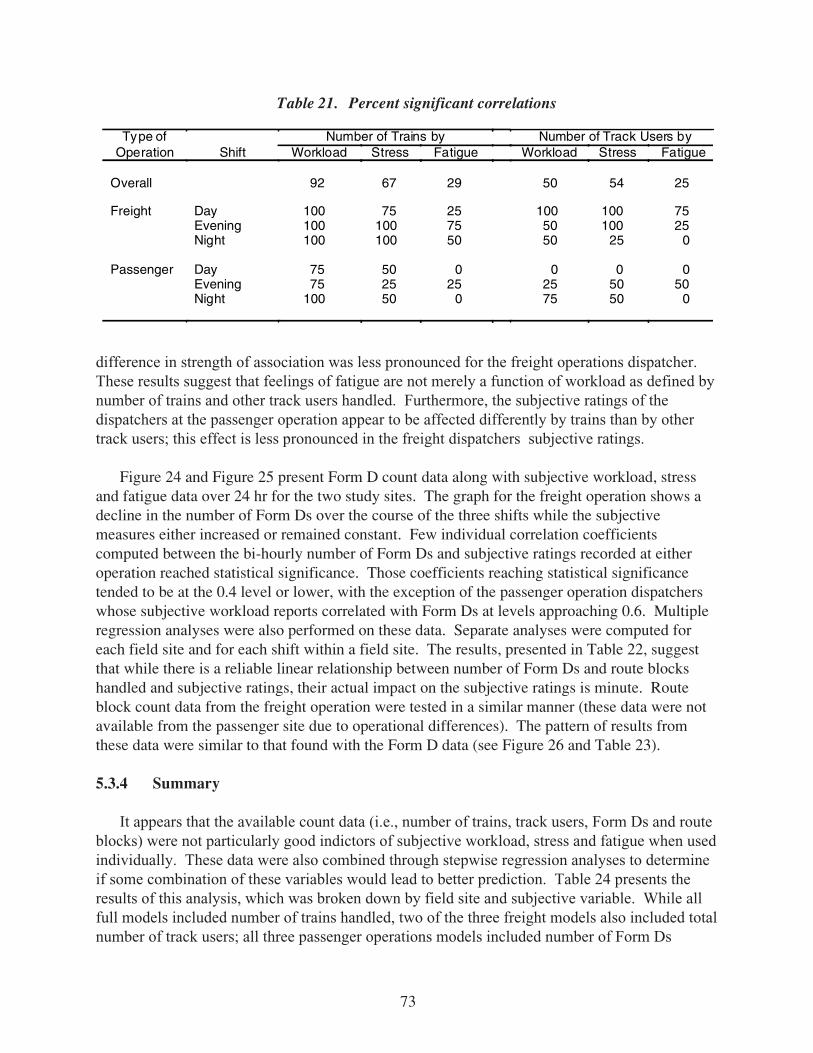
73
difference in strength of association was less pronounced for the freight operations dispatcher.These results suggest that feelings of fatigue are not merely a function of workload as defined bynumber of trains and other track users handled. Furthermore, the subjective ratings of thedispatchers at the passenger operation appear to be affected differently by trains than by othertrack users; this effect is less pronounced in the freight dispatchers subjective ratings.
Figure 24 and Figure 25 present Form D count data along with subjective workload, stressand fatigue data over 24 hr for the two study sites. The graph for the freight operation shows adecline in the number of Form Ds over the course of the three shifts while the subjectivemeasures either increased or remained constant. Few individual correlation coefficientscomputed between the bi-hourly number of Form Ds and subjective ratings recorded at eitheroperation reached statistical significance. Those coefficients reaching statistical significancetended to be at the 0.4 level or lower, with the exception of the passenger operation dispatcherswhose subjective workload reports correlated with Form Ds at levels approaching 0.6. Multipleregression analyses were also performed on these data. Separate analyses were computed foreach field site and for each shift within a field site. The results, presented in Table 22, suggestthat while there is a reliable linear relationship between number of Form Ds and route blockshandled and subjective ratings, their actual impact on the subjective ratings is minute. Routeblock count data from the freight operation were tested in a similar manner (these data were notavailable from the passenger site due to operational differences). The pattern of results fromthese data were similar to that found with the Form D data (see Figure 26 and Table 23).
5.3.4 Summary
It appears that the available count data (i.e., number of trains, track users, Form Ds and routeblocks) were not particularly good indictors of subjective workload, stress and fatigue when usedindividually. These data were also combined through stepwise regression analyses to determineif some combination of these variables would lead to better prediction. Table 24 presents theresults of this analysis, which was broken down by field site and subjective variable. While allfull models included number of trains handled, two of the three freight models also included totalnumber of track users; all three passenger operations models included number of Form Ds
Table 21. Percent significant correlations
Type of Number of Trains by Number of Track Users byOperation Shift Workload Stress Fatigue Workload Stress Fatigue
Overall 92 67 29 50 54 25
Freight Day 100 75 25 100 100 75Evening 100 100 75 50 100 25Night 100 100 50 50 25 0
Passenger Day 75 50 0 0 0 0Evening 75 25 25 25 50 50Night 100 50 0 75 50 0

74
Figure 24. Freight Form Ds and subjective ratings across 24 hr
Figure 25. Passenger Form Ds and subjective ratings across 24 hr

75
Table 22. Multiple regression analysis results by field location and shift for predictingsubjective ratings as a function of number of Form Ds completed
FieldLocation Shift Predicted Variable R2 df F p
Freight Day Subjective Workload 0.059 1,262 17.553 0.000
Subjective Stress 0.087 1,262 26.032 0.000
Subjective Fatigue 0.086 1,262 25.754 0.000
Afternoon Subjective Workload 0.031 1,268 9.690 0.002
Subjective Stress 0.038 1,268 11.762 0.001
Subjective Fatigue 0.017 1,268 4.637 0.032
Night Subjective Workload 0.001 1,237 0.816 0.367
Subjective Stress 0.002 1,237 0.417 0.519
Subjective Fatigue 0.018 1,237 5.424 0.021
All Subjective Workload 0.020 1,771 16.601 0.000
Subjective Stress 0.038 1,771 31.140 0.000
Subjective Fatigue 0.005 1,771 4.861 0.028
Passenger Day Subjective Workload 0.077 1,333 28.705 0.000Subjective Stress 0.061 1,333 22.624 0.000
Subjective Fatigue 0.004 1,333 2.389 0.123
Afternoon Subjective Workload 0.052 1,145 9.032 0.003
Subjective Stress 0.089 1,144 15.092 0.000
Subjective Fatigue 0.065 1,145 11.132 0.001
Night Subjective Workload 0.122 1,135 19.969 0.000
Subjective Stress 0.117 1,135 18.962 0.000
Subjective Fatigue 0.061 1,135 9.892 0.002
All Subjective Workload 0.073 1,617 49.349 0.000
Subjective Stress 0.077 1,616 52.492 0.000
Subjective Fatigue 0.020 1,617 13.573 0.000

76
completed. Combining these count variables did lead to significantly better prediction equations,especially for subjective workload, with nearly one-third of the variance explained. Subjectivefatigue ratings seem relatively insulated from these count variables.
There are several explanations as to why these count variables did not explain a greaterproportion of the variance in these regression equations, especially for subjective workload.First is the frequency of data collection. Perhaps data should have been collected morefrequently than every 2 hr (i.e., 2 hr may have been too long of an interval for someone to judgetheir workload). It is also possible that none of these metrics really tapped the cognitivecomponents of dispatching. Focusing on the visible portion of a dispatcher’s job (i.e., activitycounts) is perhaps analogous to viewing the tip of an iceberg. That is, 95 percent of whatdispatchers do (e.g., planning and decision making) occurs in their heads, and therefore activitycounts may not be effective measures since they tap only a small fraction of dispatchers’ jobactivities. Nonetheless, the FAA has developed validated approaches for calculating mentalworkload of its air traffic controllers based upon the number of aircraft handled. Each type ofaircraft and its usage of air space has an associated mental workload value. Therefore, possibleworkload measures include counting every action taken by the dispatcher or assigning a specificcognitive load to each type of situation the dispatcher might encounter, similar to the mTAWLapproach. Further development of this type of approach for railroad dispatcher workloadanalysis is needed.
The current metrics did provide some useful information, however. Specifically, themTAWL appears to have potential as a diagnostic metric for evaluating and comparing theworkload distribution of the desks at a dispatcher center. This methodology identified one deskat each center where the dispatcher appeared to be in an overload state for a disproportionately
Figure 26. Freight route blocks and subjective ratings across 24 hr

77
Table 23. Multiple regression analysis results for freight operation byshift for predicting subjective ratings as a function of numberof route blocks completed
Table 24. Full model results of stepwise regression analyses by type of operationand subjective rating using the count variables as predictors
ShiftPredictedVariable R2 df F p
Day SubjectiveWorkload
0.131 1,258 40.106 0.000
SubjectiveStress
0.112 1,258 32.409 0.000
SubjectiveFatigue
0.021 1,258 60.645 0.011
Afternoon SubjectiveWorkload
0.082 1,268 25.064 0.000
SubjectiveStress
0.068 1,268 20.617 0.000
SubjectiveFatigue
0.002 1,268 1.566 0.212
Night SubjectiveWorkload
0.000 1,233 0.138 0.711
SubjectiveStress
0.000 1,233 0.261 0.610
SubjectiveFatigue
0.032 1,233 8.706 0.003
All SubjectiveWorkload
0.043 1,763 35.106 0.000
SubjectiveStress
0.054 1,763 44.671 0.000
SubjectiveFatigue
0.000 1,763 0.043 0.835
Type ofOperation
SubjectiveRating R2
PredictorVariables* df F p
Freight Workload 0.274 1,3 2,754 143.873 0.000Stress 0.205 3,1,5 3,753 65.805 0.000Fatigue 0.015 1 1,755 12.587 0.000
Passenger Workload 0.292 3,4,1 3,580 81.295 0.000Stress 0.133 4,1 2,580 45.526 0.000Fatigue 0.020 4,1 2,581 7.084 0.001
____________*Note: Variables presented in order of loading; 1=number of trains, 2=number of track users,3=total number of users, 4=number of Form Ds, 5=number of route blocks.
78
high percentage of the shift. It also appears that subjective ratings of workload are independentof the number of Form Ds, route blocks and number of train and other track users handled. Evenafter combining all frequency-count workload data together, they account for only 36 percent to40 percent of the subjective workload variance. This may be due to the “iceberg effect”mentioned above. However, it is important to note that the dispatchers’ subjective workloadratings did not indicate excessively high workload. In fact there were only a few instances wheremean subjective workload ratings were beyond 50 percent, 100 percent being extreme workload.None of the self-reports went beyond 70 percent. It is thus possible that these dispatchers simplywere not experiencing high workload during the study period. However, it is also possible thatthe dispatchers did not fully understand the directions for completing the subjective workloadratings. A third possible explanation for the low subjective workload ratings could bemethodological. Specifically, asking dispatchers to report subjective workload every 2 hr likelyforced the dispatchers to average out their workload over this period with the peaks and troughsin workload being smoothed out in the reported ratings. Perhaps a more sensitive measure, ormore frequent data collection, is needed to capture the short bursts of workload that likelytranspire.
5.4 Stress
Data from three separate instruments were used to evaluate railroad dispatcher stress. Thefirst source was background and exit survey responses. These surveys examined the prevalenceand nature of perceived job-related stress. The second source was self-reported subjectiveratings of stress that dispatchers completed every 2 hr while on duty. The stress-related self-ratings consisted of the NASA TLX “time pressure” subscale and an overall “stress level” scale.Subjective stress ratings were provided using 100 mm visual analogue scales. The third sourceof data came from salivary cortisol collected from dispatchers every 2 hr while on duty.
Given the safety-critical nature of the job, the spurts of high workload, especially withpassenger operations, and anecdotal information, it was expected that railroad dispatchers wereunder a great deal of stress, at least periodically. While workload is likely a large contributor totheir stress, other factors may influence acute and chronic stress levels. Some possible factorsinclude relationships with co-workers, amount of perceived control over work, and issuespertaining to equipment reliability. This section attempts to both identify the sources of stressperceived by the dispatchers and to determine their level of stress while on duty.
5.4.1 Self-Report Stressors
The background survey asked the dispatchers to report their general level of stress on a seriesof 24 items using a four-point response scale ranging from “not at all” to “very much.” These24 items covered workload, personality, operating procedures and organizational policy issues.If the dispatcher responded “somewhat” or “very much” to an item, then that item wasconsidered a significant stressor. Table 25 presents all items that were considered to besignificant stressors by at least 30 percent of the participants. These items were predominantlyworkload-related (e.g., amount of work, pace of work, juggling train and engine (T&E) crew andmaintenance of way (MOW) demands).

79
By splitting these data up by site, however, two distinct patterns of stressor items emerge.Dispatchers at the freight operation appeared to be primarily concerned with their workload.Specific workload-related stressors that concerned them included difficulty of work, surges inworkload, and lack of control. The passenger operation dispatchers, by contrast, found personalinstructions and the physical work environment to be their primary stressors. These itemsincluded quality of workstation equipment, communication problems and personality conflictswith T&E and MOW crews.
There were very few items on the survey that 50 percent or more of the participants viewedas contributing “somewhat” or “very much” to their stress level. There are several possibleexplanations for this general lack of agreement over which items contributed to stress. First, itmay be simply that there is a wide range of stressors that is considered to be important by thedifferent dispatchers (i.e., large individual differences). If true, this would make it difficult todevelop a focused intervention program to alleviate the problem(s), and would point more toindividual counseling sessions. Second, it may be that the sum total of stressors consideredtogether has a greater impact on perceived stress for these dispatchers than the magnitude of anyone individual stressor. There may also be an interaction between the number of stressors andthe magnitude of their perceived import. The sample size was too small to evaluate thisalternative, however. Methodological problems also could have contributed to dispatchers’general lack of agreement in identifying sources of stress. First, primary work-related stressorswere not included in this list. Second, the four-point response scale may have been too
Table 25. Source of stress by type of operation
Factor Overall Freight PassengerManagement Policies ✔ ✔✔Demands of T&E and MOW Crews ✔Personality Conflicts with T&E and MOW Crews ✔✔Amount of Work ✔ ✔Difficulty of Work ✔Pace of Work ✔✔ ✔✔✔Lack of Control ✔Surges in Workload ✔Juggling T&E and MOW Needs ✔✔ ✔✔✔Quality of Workstation and Equipment ✔✔Communication Problems ✔ ✔✔✔Unnecessary Phone Calls ✔✔Duplicate Reporting Procedures ✔Training New Dispatchers ✔✔____________✔ = 30%✔✔ = 40%✔✔✔ = 50+%

80
restrictive. And third, the snapshot that was taken using the one-time survey instrument mayhave been insufficient to capture chronic work-related stressors. That is, dispatchers could havebeen influenced by any number of unknown factors that affected their one-time responses to thesurvey. Lastly, it is possible that there was not much workplace stress at the time of the study.
Given the anecdotal data collected prior to and during the data collection phase of theexperiment, it seems unlikely that the dispatch office could be considered a low stressenvironment. For this reason, these same data were regrouped by job tenure. Three groups wereutilized, those with less than two years of dispatching experience (n=8), those with between2 and 5 years of experience (n=6) and those with more than 5 years of experience (n=23). Theresults of this grouping procedure are shown in Table 26. It becomes immediately apparent thatthose dispatchers with the lowest job tenure have, as a group, the fewest number of reportedcommon stressors. The middle group, however, has a wide range of common stressors, frommanagement policies, to personality conflicts, to workload. Stressors associated with workloadand loss of sleep have the greatest commonality for these dispatchers. While this result may bedue to such a small sample size, the low tenure group has a similar size but a different andsmaller cluster of common stressors. Those with the most job tenure also seemed to have a widerange of common stressors though only one, “juggling both T&E and MOW needs,” reached50 percent agreement.
Table 26. Sources of stress by job tenure
Factor Overall < 2 Years 2 to 5 Years > 5 YearsManagement Policies ✔ ✔ ✔✔Demands of T&E and MOW Crews ✔ ✔Personality Conflicts with Crews ✔✔✔ ✔Personality Conflicts with Other Dispatchers ✔Amount of Work ✔ ✔✔✔ ✔Pace of Work ✔✔ ✔✔✔ ✔Lack of Control ✔Emergencies ✔✔✔Surges in Workload ✔✔✔ ✔Juggling T&E and MOW Needs ✔✔ ✔✔✔Loss of Sleep ✔✔✔Physical Environment ✔ ✔Quality of Workstation and Equipment ✔✔✔ ✔Communication Problems ✔ ✔ ✔Unnecessary Phone Calls ✔✔✔ ✔Duplicate Reporting Procedures ✔✔✔ ✔____________✔ = 30%✔✔ = 40%✔✔✔ = 50+%

81
These data suggest an interaction between dispatching experience and perceived stressors. Infact it looks as if it were an inverted “U” whereby those with less experience have lesscommonly acknowledged stressors, perhaps due to reduced expectations or job demands.Furthermore, the most experienced dispatchers are in a position to know more of these potentialstressors, perhaps due to exposure to them, but are either better able to cope with them, or have abetter perspective as to consequences and thus are better able to filter out stressors of lessconcern. Those in the middle group may be given more responsibility and expectations while atthe same time not having the years of experience to know how to cope with the differentsituations they are expected to confront on a daily basis. More data needs to be collected todetermine what relationships exist between particular stressors and type of operation or jobtenure groupings.
The passenger operation dispatchers were also given the opportunity at the end of the studyto answer the open-ended question, “List your top five contributors to work stress, most stressfulfirst.” The nine recurring items listed by the dispatchers are: No rest breaks, number ofconcurrent tasks, equipment design and failure, emergencies and unexpected events, officeenvironment, personality conflicts, training, management meddling and always working with adifferent crew.
Most of these items are similar to those items they checked off on the initial survey. Theseresults indicate large individual differences among the dispatchers in what they consider to bestressors, and that these stressors are most pronounced for those with 2 to 5 years of dispatchingexperience. Only one of the items reported by participants was directly workload-related,number of concurrent tasks handled. One of the most frequently cited stressors was the lack ofofficial rest breaks. Thus stress at these field sites appears to be multivariate in nature, andaccording to self-report data, it is not completely centered around the work itself.
Figures 27 and 28 present averaged subjective stress data reported by the dispatchers every2 hr. Subjective feelings of stress rose above a rating of 40 only once during a 24 hr period. Inaddition, average ratings of subjective time pressure, a contributor to stress, never rose above 55.
While, on average, there does not appear to be a high level of subjective stress among thisgroup of dispatchers, there does appear to be variation between the two types of operations.These subjective stress ratings are intercorrelated with subjective workload ratings. ForFigure 27, the 7 am and 9 am data points are significantly different, with the passenger operationdispatchers reporting higher stress levels. This is logical from a workload perspective as thepassenger operations dispatchers are engaged in rush-hour traffic during this period of time. The3 am and 5 am points are also significantly different. This time, it is the freight operationdispatchers who report higher levels of stress, but again they have a higher workload during thisperiod of time. In addition, there is a 0.5 to 0.8 correlation between subjective stress andworkload, depending upon the specific data collection time into shift.
Reported stress levels appear to increase through the shift, even as the workload drops off, asit does towards the end of the day shift for the passenger operations dispatchers. This maydenote a cumulative stress effect, or a threshold effect whereby once a particular level of stress
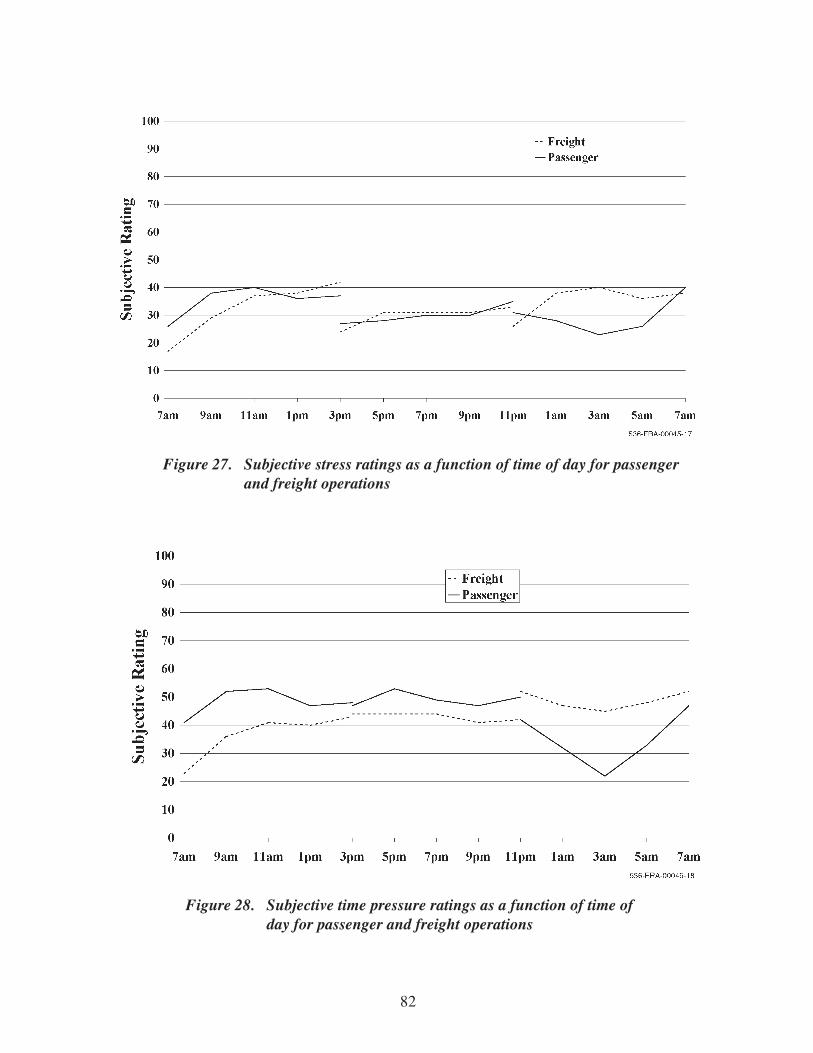
82
Figure 27. Subjective stress ratings as a function of time of day for passengerand freight operations
Figure 28. Subjective time pressure ratings as a function of time ofday for passenger and freight operations

83
or arousal has been reached, it is difficult to return to baseline. This idea is evidenced by datafrom the passenger operation dispatchers working the night shift. Here they started off with adeclining workload, which translated into their declining stress ratings. This also indicates thatworking during the night was not necessarily perceived as stressful since their stress levelsdeclined until about 3 am and did not significantly increase until the start of the morning rushhour.
Subjective time pressure ratings depicted in Figure 28 show a similar pattern of results, andare highly intercorrelated with the subjective stress scale results. The range of correlationcoefficients, all of which were significant, spanned from r = 0.662 to r = 0.951 with a mediancorrelation value of r = 0.79. The scale value for many of the ratings, especially during first andsecond shifts, was significantly higher for time pressure than for general feelings of stress. Thisconcurs with the subjective report data previously mentioned in which multitasking betweenT&E and MOW crews was identified as a stressor. Yet, as these subjective ratings rarelyreached even 50, it appears as though these dispatchers, on average, did not report feeling overlystressed.
5.4.2 Objective Stress Level
Salivary cortisol samples were collected every 2 hr while the dispatchers were on shift.Figure 29 is a plot of the amount of cortisol found in the saliva (in units of micrograms perdeciliter). The graph shows a well-defined circadian pattern, though there is an additional spikeat the start of the evening and night shifts. These data did not show much variation when time-of-day was controlled. Furthermore, these levels were not above the normal physiological levelfor adults (Laudat, 1988).
Cortisol values within the normal adult population vary little from person to person whentime-of-day is controlled. This held true for the current sample (see Figures 29a and 29b).Therefore, the above results are not likely to be due to individual differences. Furthermore,analysis of the cortisol did not show differences related to number of consecutive days of worknor were differences found when examining cortisol levels collected at each interval for thedispatchers working their given shifts. The greatest number of reported consecutive days workedimmediately prior to the study’s onset was 40, and in fact, many of the dispatchers in this studyhad worked more than 14 consecutive days prior to the start of the study. Often, these longstretches of continuous work ended during the period when this study was conducted, and alldispatchers took at least one day off during the 14 day study period. This situation provided anunanticipated opportunity to examine the effect of extended periods of work (consecutive days)on dispatcher stress and salivary cortisol.
Comparison of 24 hr cortisol patterns for consecutive days of shift also revealed nosignificant pattern other than the previously documented circadian variation, with peak cortisolmeasured at 7 am and lowest cortisol measured between 11 pm to 1 am. This pattern did notvary across consecutive days into shift. Furthermore, there was no indication that thosedispatchers who worked up to 40 consecutive days showed any elevation of cortisol levelattributable to stress, excessive workload, or excessive consecutive days of work. When

84
Figure 29b. Mean salivary cortisol levels as a function of time of day for freightoperation by shift
Figure 29a. Mean salivary cortisol levels as a function of time of day for passengeroperation by shift

85
controlling for time-of-day, both operations showed a small, though significant negativecorrelation between cortisol level and shift (freight r = -0.169, p = 0.000; passenger r = -0.0785,p = 0.36). This could be interpreted as reflecting a less stressful working environment during thenight shift than during the day and evening shifts.
The internal circadian rhythm of dispatchers working regular night shifts or rotating shiftsthat included night work, as indicated by the cortisol concentration, remained set to a phaseposition very similar to that seen in human subjects living on a regular night sleep-day activityschedule. The most plausible explanation for this is that these dispatchers work at night in arelatively dark indoor environment, then commute at the end of their shift in bright outdoormorning sunlight. The low activity level required by the job also probably aids in maintainingthe circadian system. For physiological purposes, therefore, their light-dark cycles have not beenreversed and there is little opportunity for them to reset their circadian phase position to adjust toworking night shift.
Participants’ cortisol data were also directly compared to normative data. Upper and lowerboundaries of normal levels of salivary cortisol were obtained from work published by Laudatand his colleagues (Laudat, 1988). As these data were in nanomoles per liter (nmol/L), theywere first converted into micrograms per deciliter, the unit used in this study.6
Figures 29a and 29b depict both the averaged 2 hr salivary cortisol values over the course ofeach shift and the upper bound of normal cortisol values. Dispatcher salivary cortisol levels fellwell below this upper bound. Individual analysis of dispatcher cortisol levels also revealed thatabout 95 percent of the cortisol samples fell below this bound. In fact, only one participantshowed consistently elevated levels of salivary cortisol. However, as the figures illustrate, thestandard deviation of the cortisol levels was large relative to the mean for the evening and nightshift freight dispatchers, indicating a wider range for these groups.
These results were unexpected. A discussion was held with various cortisol researchers,including Dr. Dirk Hellhammer at Trier University, to understand these results. It is possible thatthese levels were in fact suppressed due to either habituation or burn-out of the cortisolproducing system within the brain. Either of these conditions might result if one is placed underhigh levels of chronic stress. However, Dr. Hellhammer and others similarly concluded that themost likely explanation of the cortisol data, when placed in context with the subjective report andwork schedule data, was that the railroad dispatchers were not under a high level of physiologicalstress.
____________6This conversion was conducted by first multiplying each normative value by the molar mass of cortisol (362.46 g/mol), as foundin the 1998 Merck Index, and then dividing by 1 mole to yield normative values in grams per liter (g/L). Each normative valuewas first converted from nmols/L to mol/L before inputting into the following equation in order to keep mole units ofmeasurement congruent. The conversion formula is as follows: X = normative value mol/L • 362.46 g/mol. Normative g/Lvalues were then converted to µg/dL for comparison with dispatcher cortisol levels.

86
5.4.3 Summary
There is little physiological and self-rating data indicating that these dispatchers were under ahigh stress load. This is surprising given the number of items listed as contributing to their at-work stress. Anecdotal evidence, as well as the safety-critical nature of the job would alsosuggest a high-stress environment. It may be that dispatchers are a self-selected group that havea higher tolerance to stressors or have better coping mechanisms. It was apparent from the casestudy of the person who left dispatching that this individual felt overwhelmed with job stress andwas not able to effectively cope with it. Furthermore, based upon dispatcher self-reports of theirsources of stress, the workload itself seems to be only one of many possible components in whatappears to be a multivariate construct. The balance of these various sources, and inherentindividual differences makes it practically impossible to identify root or primary sources basedon the current sample size.
It is also likely that, as with workload, the cortisol and on-duty self-report data were collectedtoo infrequently. Salivary cortisol data also has the added problems of possessing a long delaybetween the stress trigger and cortisol release, and its ease of being masked. Collecting bloodcortisol levels or increasing the sampling rate was not possible given the in situ constraints. Inaddition, no performance data exists to compare with the various stress levels. It may be that thelevel of reported perceived stress does lead to changes in performance even if the entire length ofthe 100 mm scale was not utilized. Based on the available data, however, it appears that thesedispatchers are not experiencing excessive stress.
5.5 Fatigue
Railroad dispatcher fatigue was explored through both objective and self-report measures.First, sleep-wake behavior was quantified using Actiwatch data. Next, background survey itemsasked specific questions related to participants’ sleep, sleepiness and fatigue. Third, participantsrated their level of subjective fatigue every 2 hr while on duty using a 100 mm VAS. Lastly eachdispatcher completed a daily sleep log after their primary sleep period. The sleep log askedquestions pertaining to the timing and latency of sleep periods, whether sleeping aids were taken,timing of naps, and various sleep quality and sleepiness scales. The sleep logs were intended tocomplement the data collected from the Actiwatches.
Based upon the literature and anecdotal information, the dispatchers were expected to showincreased subjective fatigue both throughout their work shift and across the workweek.Workday/nonworkday differences in sleep length and quality were also expected, especially forthose working nights and irregular shifts. It was also expected that the night shift workers wouldtake more naps than either the day or evening shift workers.
5.5.1 Subjective Fatigue
Subjective fatigue data were collected using at-work self-report forms. As a starting point,all subjective self-rating measures recorded at the start of the shift, including subjective fatigue,were compared to those recorded at the end of the shift. All six subjective measures showed a

87
significant worsening between the start of the shift and the end of the shift (see Table 27).Table 28 partials out these significant effects by shift. All six subjective ratings showedsignificant increases from beginning to end of the day shift. There were fewer differences foundduring the evening and night shifts. Specifically, fatigue and stress showed significant increasesfrom beginning to end of the evening shift, while only fatigue showed a significant increase fromthe beginning to end of the night shift.
All six subjective ratings were also compared between study sites. Very few differenceswere found between these two groups with respect to the subjective workload, stress and fatigue
Table 27. Comparison of the workload, stress and fatigue scales (100 mm VAS) filledin at the beginning and end of work shift by all participants on all shifts
Table 28. Comparison of the workload, stress and fatigue scales (100 mm VAS) groupedby shift, filled in at the beginning and end of work shift by all participants
Variable t Value df p Start Value End Value % Difference
Mental Demands -3.476 344 0.001 44.31 49.43 5.12
Time Pressure -4.173 344 0.000 40.57 46.62 6.05
Level of Effort -2.925 344 0.004 46.41 50.54 4.13
Overall Workload -2.542 344 0.011 40.43 44.15 3.72
Fatigue -14.025 344 0.000 21.39 40.12 18.73
Level of Stress -7.907 344 0.000 26.63 37.96 11.33
Shift Variable t Value df p Start Value End Value % Difference
1 Mental Demands -5.735 151 0.000 35.98 49.25 13.27
1 Time Pressure -5.911 151 0.000 32.43 46.19 13.76
1 Level of Effort -4.806 151 0.000 39.78 50.45 10.67
1 Overall Workload -4.186 151 0.000 34.13 44.51 10.38
1 Fatigue -10.620 151 0.000 19.66 40.13 20.47
1 Level of Stress -7.841 151 0.000 21.95 39.92 17.97
2 Demand 0.609 97 0.544 32.76 31.46 3.97
2 Time 0.032 97 0.974 31.27 32.43 3.58
2 Effort 0.307 97 0.760 32.59 33.49 2.69
2 Workload 0.042 97 0.966 24.96 27.37 8.81
2 Fatigue -6.136 96 0.000 17.02 33.23 16.21
2 Level of Stress -3.047 97 0.003 24.88 32.94 8.06
3 Demand 0.404 94 0.687 26.95 28.89 6.72
3 Time -0.023 94 0.982 25.00 27.68 9.68
3 Effort 0.530 94 0.597 24.67 27.50 10.29
3 Workload 1.317 94 0.191 23.82 24.92 4.41
3 Fatigue -7.198 94 0.000 28.62 47.14 18.52
3 Stress -1.840 94 0.069 22.16 24.35 8.99

88
ratings at the beginning and end of shift. As can be seen in Table 29, the dispatchers from thepassenger operation reported higher levels of mental demand at the start of shift and higherlevels of mental demand and fatigue at the end of shift. No other significant differences werefound.
Next, subjective fatigue reports over the course of the shift were compared between the twofield sites. Figure 30 displays the mean reported levels of subjective fatigue by time-into-shiftand dispatching site. There were significant differences between freight and passenger operationdispatchers at 9 am, 11 am, and 1 pm. No other statistically significant between-site differencesexisted for any of the shifts. As mentioned above, levels of fatigue significantly increasedthroughout the duration of the shift, doubling or nearly doubling in all cases. Interestingly, nosignificant dip in fatigue level was detected mid-shift, even though increased fatigue levels areoften found to occur after lunch, especially during the day shift. Fatigue ratings for the start and
Table 29. Comparison of the workload, stress and fatigue scales (100 mm VAS)grouped by type of operation, filled in at the beginning and end of workshift by all participants on all shifts
Figure 30. Subjective fatigue ratings as a function of time of dayfor passenger and freight operations
Variable t Value df p Freight Passenger % Difference
Mental Demands, Start of Shift -2.082 352 0.038 41.10 47.78 6.68Fatigue, Start of Shift -3.232 351 0.001 18.33 25.32 6.99
Fatigue, End of Shift -2.522 351 0.012 36.47 43.62 7.15

89
end of the night shift were significantly higher than for the day and evening shifts. This is likelyto be due to the dispatchers fighting their circadian rhythm as well as handling theresponsibilities of being on duty.
5.5.2 Primary Sleep
The dispatchers were asked a series of questions pertaining to the quality of their sleep.Working shifts, especially night and irregular shifts, has been shown to negatively impact theduration and quality of one’s sleep, putting individuals at risk for acute and chronic sleepdeprivation effects (Tepas, Paley, and Popkin, 1997; Tepas and Carvalhais, 1990; Tepas, Walsh,Moss and Armstrong, 1981; Johnson and Naitoh, 1974).
Table 30 presents rate and frequency data on dispatcher problems of falling asleep, frequentawakenings, and early awakenings, as well as their rate of waking up tired on workdays andnonworkdays. These data are presented both by shift and aggregated.
About one-third of the dispatchers reported having “problems falling asleep” at least twice aweek. The evening shift dispatchers reporting problems falling asleep twice as often as the othertwo shifts. This was surprising given that, according to the literature, those working the nightshift are usually the ones with the highest incidents of sleep-related difficulties. The rationalemost frequently cited for this finding is that people working this shift are generally less free tosleep when they want and at an appropriate physiological time (Tepas and Monk, 1987). Theobserved difference in this study may be due to some shift by lifestyle interaction unique to thissample or population. Problems with frequent awakenings seem more consistent with theliterature, with people on the night shift and extraboard showing a significantly higher rate.Interestingly, of those dispatchers who reported frequent awakenings, the frequent awakeningsseemed to have occurred between four and five days a week, regardless of shift.
With the exception of the extraboard dispatchers, similar rates were found with problems of“early awakenings.” Again, it was expected that the night shift workers who slept days would
Table 30. Rate and frequency of sleep-related problems
ShiftDay Evening Night Extra Board Overall
Problem Falling Asleep (% yes) 33 33 40 27 32
Frequency of Problem (Days/Week) 2.5 4 2 2 2
Frequent Awakenings (% yes) 33 33 60 46 46Frequency of Problem 5.5 4 5 2 4
Early Awakenings (% yes) 33 33 60 27 35Frequency of Problem 5.5 2 3 3 3
Waking up Tired (% yes):
Workdays 33 17 80 36 41
Nonworkdays 33 17 40 9 22

90
have problems staying asleep given their circadian system, a system which showed no sign ofadaptation based on salivary cortisol (see subsection 3.7.1). Those on the extraboard may have alower rate of occurrence given that: 1) they are not always sleeping days since they may alsowork the day and evening shift, and 2) as mentioned, it does not appear that any of theparticipants’ circadian rhythms were significantly altered from a typical diurnal rhythm.
The rate of those “waking up tired” on workdays and nonworkdays shows a patternconsistent with the literature. Specifically, those working nights have the highest rate of thissymptom, and this problem is dramatically reduced when they return to nighttime sleep. Againthis is probably due to a lack of adjustment in the dispatchers’ circadian rhythms. The reductionin the rate between workday and nonworkday waking-up-tired self-reports of the extraboarddispatchers is also not surprising. This apparent effect could not be explored or confirmed withthe current data due to the small sample size and the variability in the dispatchers’ schedules.
The sleep log data was grouped by whether the dispatcher went to work, a workday, or wasoff, a nonworkday. The following sleep quality measures were examined: ease of falling asleep,ease of arising, sleep duration, overall sleep quality, the Karolinska Sleep Scale and NavalPsychiatric Research Unit (NPRU) positive and negative mood state scores (see Figures 31a, 31band Figure 32). The first five scales are discrete in nature, while the NPRU approaches acontinuous scale. In addition, the number of naps taken during each day and the sleep lengthduring dispatchers’ primary sleep periods, as reported on the sleep logs, were also examined.
The first set of analyses tested the above-mentioned sleep quality data separately for thefreight and passenger operation dispatching sites. The only difference found was for the freightoperation. Specifically, it was slightly easier (1.57 nonworkday, 1.81 workday, where a lowerscale value here denotes greater ease of falling asleep) to fall asleep on nonworkdays (t = -2.236,df = 260, p =0.026).
Analyses were also conducted to determine the differences between the freight and passengersites separately for the workday and nonworkday groupings. Only three differences were found,two during nonworkdays and one during workdays. As seen in Table 31, the dispatchers at thepassenger operation had a slightly, though significantly lower (as signified with a higher scalevalue) overall quality of sleep both during their workdays and nonworkdays. The dispatchers atthe freight operation, however, found it slightly more difficult to arise after their main sleepperiod on nonworkdays.
The data presented in Figures 31a and 31b indicate a relatively high level of satisfaction withsleep quality, independent of shift worked or whether the sleep occurred during a workday.Generally, those dispatchers working the second shift reported being more satisfied with theirsleep quality than the first shift who, in turn, were more satisfied than the third shift. This trendis supported in the shiftwork literature (Gordon, Tepas, Stock and Walsh, 1979). Significantdifferences were not found between the first and third shifts nor were significant differencesfound between workdays and nonworkdays. The NPRU scores, plotted in Figure 32, also showvery little variation among shifts and between workdays and nonworkdays. The positive scaleranges between 0 and 57 and the negative scale between 0 and 30. The mood scores are used as
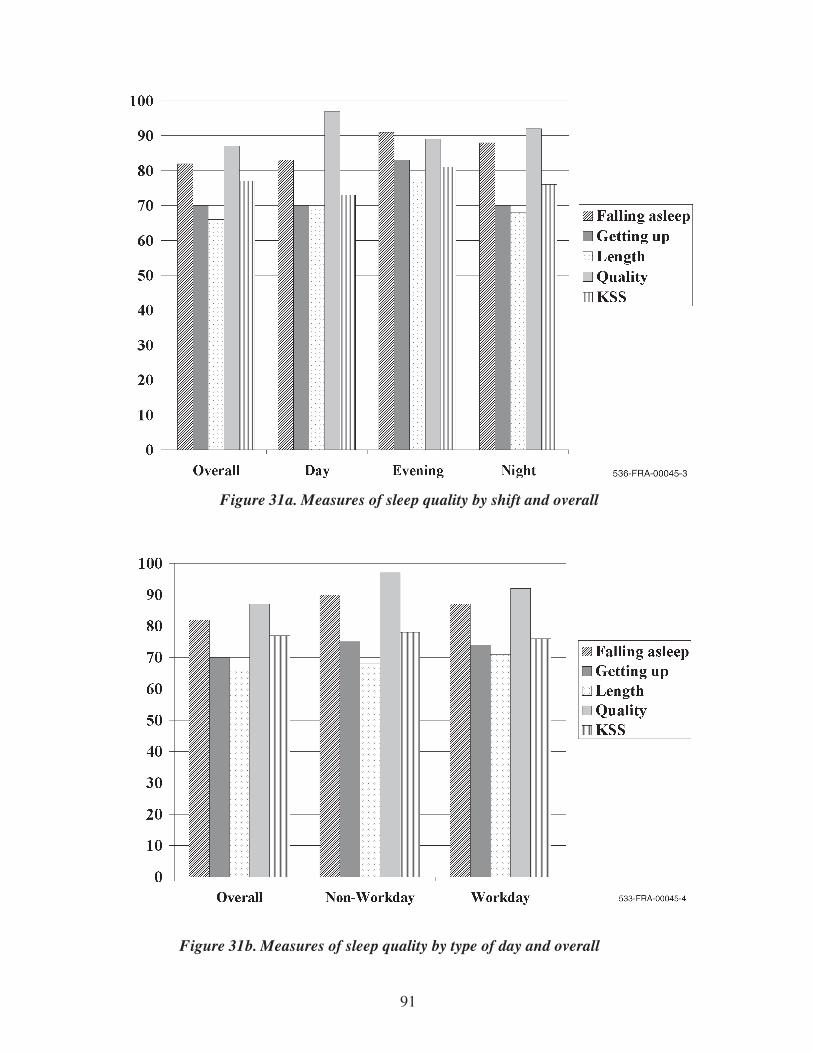
91
Figure 31a. Measures of sleep quality by shift and overall
Figure 31b. Measures of sleep quality by type of day and overall

92
indicators of potential chronic sleep deprivation. As these values were mostly correlated withsleep length at r=0.3, and not statistically significant, there does not appear to be any indicationof chronic sleep deprivation from these dispatchers.
Sleep quality was also measured using sleep efficiency and sleep fragmentation measuresthat were computed by the Actiwatch software. Sleep efficiency refers to the percentage of timein bed spent sleeping while sleep fragmentation refers to the amount of prolonged movementduring sleep, suggesting Stage 1 sleep or wakefulness. These data are presented in Figure 33. Ingeneral, sleep fragmentation was around 30 percent; in other words, 70 percent of the sleep wascontinuous and undisturbed with awakenings. This result did not significantly change whenexamining the data by shift or by whether the sleep occurred on a workday or a nonworkday.
Figure 34 provides four different measures of sleep length data collected from thedispatchers. These data are presented by shift (i.e., day, evening and night) and by workday/nonworkday. Subjective sleep refers to how much sleep the dispatcher reported he or shereceived, while the Actiwatch sleep length measure computes start and end sleep times based ondispatchers’ restfulness. Intermittent awakenings that occurred during the sleep time were
Figure 32. NPRU mood scales
Table 31. Comparison of the sleep quality scales grouped by type of operation andworkday/nonworkday, filled in after each daily main sleep period
Variable t Value df p Freight Passenger
Sleep Quality - Workday -4.059 349 0.000 2.12 2.48Sleep Quality - Nonworkday -2.637 127 0.009 1.93 2.28
Ease of Arising - Nonworkday 2.240 127 0.027 2.32 2.06

93
Figure 33. Sleep quality via Actiwatch
Figure 34. Average sleep lengths using different data collection methods

94
subtracted out of the sleep length. The other two measures reported here, actiwatch log andpaper sleep logs, record sleep start and end times without considering sleep latency or micro-awakenings. Results are quite different between the first two views and the second two views.When considering the first two views, subjective ratings and Actiwatch data, these dispatchers,on average, received between 6 and 7 hr of sleep per day. Dispatchers on evening shifts receivedthe most sleep followed by day and night shift workers. There is no significant differencebetween workday and nonworkday main sleep durations. These results are amplified when usingthe second two sleep length measures, and they show a greater workday/nonworkdaydifferentiation. Based on these data dispatchers received between seven and 8 hr of sleep perday, regardless of workday/nonworkday status. Interestingly, these measures were neither highlynor significantly correlated with the sleep quality measures. An additional analysis revealed thatthose dispatchers who had five or more years of experience slept 1 hr less, on average, than thosewith less experience. This may, of course, be merely a function of age, though the median age ofthe sampled workforce was under 40 years.
When asked whether they napped or took sleep aids, napping was found to be the moreprevalent strategy (see Figure 35). Those working the evening shift reported napping the least,less than 30 percent, while those on the night shift napped the most, more than 60 percent. Thiswas expected. What was unexpected, however, was that the night shift workers tooksignificantly fewer sleep aids than either day or evening shift dispatchers. There were also nosignificant differences between workday and nonworkday responses. Table 32 presents the rateand frequency of use of split sleeps and napping. A nap was defined as a sleep period of lessthan 3 hr duration while a split sleep was defined as two discrete sleep periods with more than
Figure 35. Coping strategies for adequate sleep
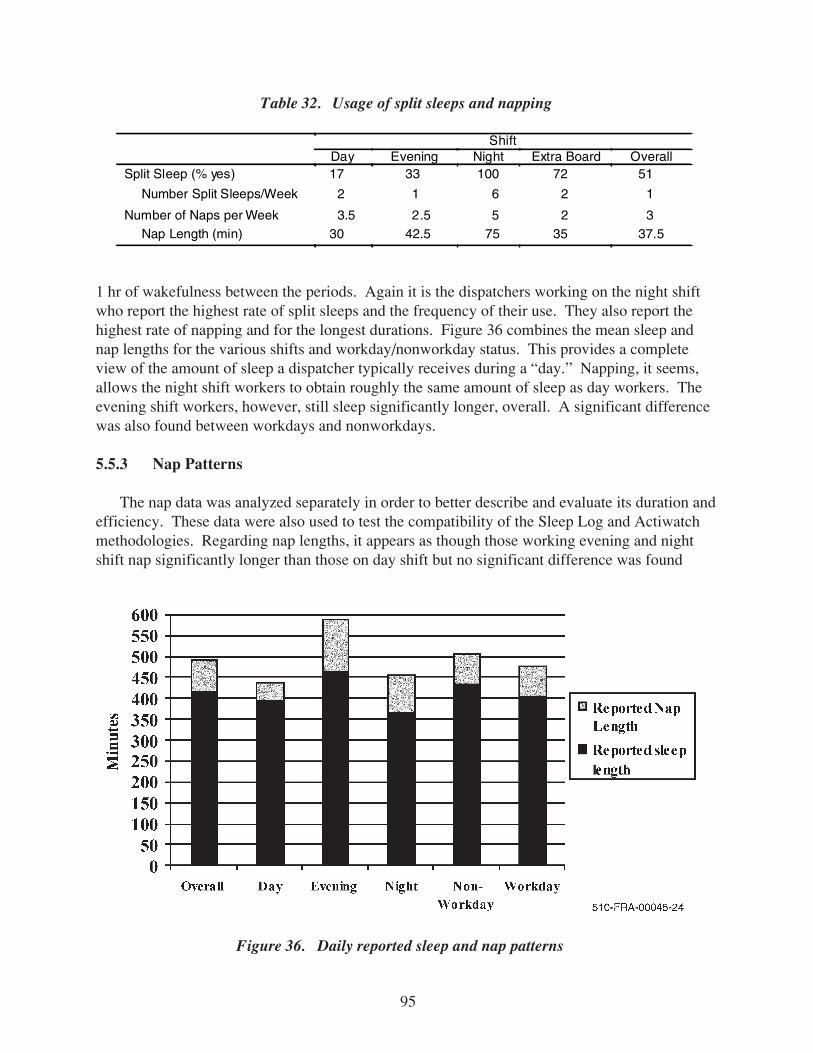
95
1 hr of wakefulness between the periods. Again it is the dispatchers working on the night shiftwho report the highest rate of split sleeps and the frequency of their use. They also report thehighest rate of napping and for the longest durations. Figure 36 combines the mean sleep andnap lengths for the various shifts and workday/nonworkday status. This provides a completeview of the amount of sleep a dispatcher typically receives during a “day.” Napping, it seems,allows the night shift workers to obtain roughly the same amount of sleep as day workers. Theevening shift workers, however, still sleep significantly longer, overall. A significant differencewas also found between workdays and nonworkdays.
5.5.3 Nap Patterns
The nap data was analyzed separately in order to better describe and evaluate its duration andefficiency. These data were also used to test the compatibility of the Sleep Log and Actiwatchmethodologies. Regarding nap lengths, it appears as though those working evening and nightshift nap significantly longer than those on day shift but no significant difference was found
Table 32. Usage of split sleeps and napping
Figure 36. Daily reported sleep and nap patterns
ShiftDay Evening Night Extra Board Overall
Split Sleep (% yes) 17 33 100 72 51
Number Split Sleeps/Week 2 1 6 2 1
Number of Naps per Week 3.5 2.5 5 2 3Nap Length (min) 30 42.5 75 35 37.5

96
when comparing the evening to the night shift (see Figure 37). Similar results were found forboth Sleep Log and Actiwatch data. It was surprising that those nappers working evening shifthad longer nap lengths than those working morning shift. The literature suggests that theevening shift has the greatest opportunity to sleep as long as they wish during their main sleepperiod. Furthermore, background survey data revealed only minimal moonlighting, and thosewere either home businesses or church/organizational work. It may be that these dispatcherseither split their sleep intentionally or engaged in recreational napping. The present data isinadequate to explain the observed napping pattern. There was no statistical difference betweenworkday and nonworkday nap lengths indicating that perhaps naps are more a part of thesedispatchers’ lifestyle than a means for reclaiming any lost sleep.
Some significant differences were found when comparing the nap data collected from theActiwatch and from the Sleep Log. These differences were found when considering just theoverall values and for both workday and nonworkday values. Differences were not found withinthe individual shifts, though this is likely due to low power. In all cases, averaged self-reportednap lengths recorded on the sleep logs were longer than those recorded by the Actiwatches. Themost likely explanation for the shorter Actiwatch nap durations is that, while the dispatchersrecorded when they started to nap and when they stopped, the Actiwatch subtracts sleep latency(i.e., restlessness at the beginning of a sleep or nap period) from the nap length, considering theindividual to be in a wakeful state.
To explore the quality of the naps, the percent of nap efficiency and percent of napfragmentation data were graphed and analyzed (see Figure 38). Nap efficiency refers to theamount of quiet sleep time (i.e., slow wave sleep) over a given sleep period, while napfragmentation refers to the amount of movement recorded during the sleep period. Bothmeasures are recorded as percent values. The amount of fragmentation is relatively low,
Figure 37. Average nap lengths

97
10 percent or less in all but the dispatchers working the evening shift. The increased napduration for the evening shift workers likely compensates for the increased sleep fragmentation.In fact a significant Pearson correlation of r=0.88, p<0.05 was calculated between thesevariables. No other significant correlations were found for the other two shifts. Perhapstemporal placement of the nap is a better explanation for the differences in fragmentation.Specifically, those working the evening and night shift were more apt to sleep and nap in themorning hours, conflicting with the circadian system. Sleeping at physiologically inappropriatetimes due to the circadian system often leads to less efficient sleep, and therefore a longer sleepduration may be required to obtain a sufficient amount of sleep. Those working the day shiftonly had the late afternoon and evening to nap, times that lead to more efficient sleep accordingto circadian theory (Wever, 1979).
Nap lengths were then separately added to sleep lengths calculated from the sleep logs(Figure 36) and from the Actiwatches (Figure 39). When the primary sleep periods and napswere combined, the average daily sleep times reported by the sleep logs for those who nappedrose from about 410 min to 460 min, almost 8 hr. No significant differences were found betweenthe different shifts, although the third shift workers who napped did, on average, sleep 50 minless than the first and second shift workers. A significant difference was found, however,between average workday and nonworkday total sleep length for nappers. Specifically, the totalsleep length on nonworkdays was significantly longer than on workdays. Given what was foundregarding nap length, this would suggest that while napping behavior does not seem dependentupon whether one is working, these dispatchers take advantage of the off days to extend theirmain sleep period. This is consistent with the current literature.
Figure 38. Nap quality via Actiwatch

98
The sleep data gathered by the Actiwatch provided somewhat different results. This wasexpected as this sleep length data did not include sleep latency duration. When nap duration isincluded, overall sleep length increased from 355 min to about 380 min, well under the 460 minindicated by the sleep logs. Unlike the sleep log data, significant shift differences were foundwith respect to total sleep length while the workday/nonworkday difference disappeared. Theevening shift dispatchers who napped had a significantly longer total sleep time than either theday or night shift dispatchers. No other differences were significant. Again, this indicates thatthe napping strategy, like sleep, is affected by the time at which it is taken, and therefore,provides varying amounts of additional sleep. This is also in accordance with the sleepfragmentation results whereby day naps are usually taken by night and afternoon shiftworkers,and therefore would be most susceptible to circadian disruption.
5.5.4 Summary
The sleep patterns of this study population appear to be typical of other shiftworkers.Specifically, those on the afternoon shift had the longest sleep lengths while those on night shiftslept the least. Napping appears to be the most utilized strategy for gaining additional sleep.This extra sleep, when combined with the primary sleep, increased the overall sleep time of thenight shiftworkers as to equate them with the day shiftworkers. The afternoon shiftworkers stillobtained significantly more sleep than did the other two shifts.
There is little evidence to support anecdotal information of severe, acute sleep debt.Furthermore, the only indication of any chronic sleep debt or its resulting increase in fatigue inthis study population was lower than expected NPRU positive scale scores. However, NPRUnegative mood scale scores have been shown to be more predictive of such fatigue states than thepositive scale scores, and they were, on average, quite low for all participants. Furthermore, the
Figure 39. Daily Actiwatch sleep and nap patterns

99
subjective fatigue scale and the self-report sleep log items did not indicate any extreme or strongtendency towards feelings of sleepiness or fatigue while awake.
It was shown, though, that feelings of fatigue did increase monotonically throughout thecourse of a dispatcher’s shift. While these fatigue ratings rarely increased above 60 for an 8 hrshift, shifts of a longer duration, or double shifts given emergency staffing situations, couldresult in substantially more fatigue. A rest break may ease both the level and rate of increase inperceived fatigue. This hypothesis, however, remains to be tested.
Regarding the future use of the sleep log and Actiwatch methodologies, both can providemeaningful data. The sleep log is a low cost tool that seems to be reliable with the currentsubject population. It is especially useful for considering the placement and number of sleepperiods and naps, and to gain an approximation of sleep duration. However, if specific amountsand quality of sleep are sought, then actigraphy data, in this case from an Actiwatch AW4-32, inconjunction with a sleep log, may be a more appropriate methodology. It is currently unknown,though, how well the Actiwatch sleep data, determined from the user’s activity level, parallelsdata collected from EEG recordings for these participants who spent a considerable amount oftime quietly monitoring their territory. While the product itself has been validated using EEGrecordings, it is impossible to say with certainty how well it works in this type of field setting(McConnell, 1998).

100
6. KEY FINDINGS AND RECOMMENDATIONS
This field study offers some important insights into the job demands of a railroad dispatcherand the related levels of workload, stress and fatigue. In reviewing the findings, it is important tokeep in mind that the study involved only 37 dispatchers from two dispatching centers for a two-week data collection period. Therefore, the results may not be generalizable to other centers orto the nation’s dispatcher population as a whole. This section presents key study findings withrespect to dispatcher workload, stress and fatigue as well as lessons learned regarding the fieldmethodology for future studies of these factors. The section concludes with somerecommendations for future research regarding the railroad dispatching environment and relatedworkload, stress and fatigue of dispatchers.
6.1 Key Study Findings
The study findings are presented below to address each of the objectives of the study.
6.1.1 Dispatcher Health
Comparison of the results of the background survey with normative epidemiological dataindicates that participants in the 25 to 44 age group reported incidences of back pain, headachesand skin disorders that significantly exceeded adult norms for this age group. There are manypossible explanations for these problems. Back pain could be due to poor seated postureresulting from a chair not suited to the individual. Headaches can result from poor lighting in thework area, an uncorrected vision problem or glare from a computer screen. Skin disorders canhave any number of causes. All three problems can also be the result of stress. This findingsuggests a further investigation into health-related problems in the U.S. dispatcher population. Inaddition, dispatching center management might want to determine the extent to which anyaspects of their work environment could contribute to these disorders at their center.
6.1.2 Workload
Available activity count data, in terms of number of Form Ds, route blocks, and number oftrain and other track users, appear to be insufficient to gauge the level of the dispatcher’sworkload. These factors accounted for less than half of the variance in the subjective workloadvariations. This suggests that dispatcher workload is a more complex construct than anticipated.Future measurement of dispatcher workload should either take into account additional dispatcheractivities or determine more realistic cognitive loads for these activities. Given the planning anddecision-making duties of a dispatcher, future measurement of a dispatcher’s workload shouldalso take into account these cognitive aspects of the job.

101
Though the subjective workload ratings and work volume counts did not appear to capturethe variability of the dispatcher’s workload, the mTAWL method succeeded in this area. ThemTAWL method proved valuable for identifying the cognitive, visual, auditory and psychomotorcomponents of workload for a given desk and for documenting them over time. Due to its labor-intensive nature, the mTAWL may not be an ideal data collection tool for a research study, butits potential as a diagnostic tool is significant. The mTAWL appears to be very appropriate foridentifying and documenting workload at a particular dispatching desk, and for comparingworkload over time, or across desks within a dispatching center. Ultimately, the value and utilityof the mTAWL technique for researchers and operations personnel must be weighed against itslabor-intense methodology.
6.1.3 Stress
Participants’ responses to the background and exit surveys indicated some level of workplacestress. Forty-three percent of the participants reported “a lot” or “a great deal” of anxiety and athird reported calling in sick due to stress at least “sometimes.” Nearly all participants(92 percent) reported that other dispatchers “sometimes” or “frequently” lose their temper atwork. However, the sources of this stress varied by site and by level of experience. Some of thestress was based on the dispatcher’s job demands, but a significant amount was also attributed toother aspects of the work environment. This suggests that stress in these dispatchers ismultivariate in nature and not completely centered on the work itself.
In contrast to the results of the surveys at both sites, there was little physiological or self-report data from the field study indicative of a high level of stress in the study participants.However, this should not be interpreted as an indication that workplace stress does not exist.Since the dispatcher’s workload and associated stress can change rapidly over short periods oftime due to the inherent nature of the job, it is more likely that the collection of subjective ratingsand the measurement of cortisol, a hormone easily masked by other events, every 2 hr wasinadequate to capture variations in the dispatcher’s stress level. Two other factors may haveaffected stress levels. First, as data was collected in late summer, it is entirely possible that thesedispatchers either had recently returned from vacation or were looking forward to an upcomingone. In addition, seasonal variations in traffic could be responsible for the low workload andstress observed in this study.
6.1.4 Fatigue
Both physiological data and self-report information indicate that dispatchers’ sleep patternsare typical of shiftworkers. Those on the afternoon shift had the longest sleep lengths whilethose on the night shift slept the least. Those working the night shift also relied the most onnapping to gain additional sleep. While the study produced little evidence to support either anacute or chronic sleep debt for this group, study participants did report an increase in perceivedfatigue over the course of the shift. The use of planned breaks during the shift is one recognizedstrategy for alleviating this feeling of fatigue. As was the case with the subjective ratings forworkload and stress, ratings of perceived fatigue every 2 hr were probably inadequate to capturemoment-to-moment variations.

102
6.1.5 Methods
This initial dispatcher study has provided important insight into possible modifications andenhancements to both the measures and protocol for future studies of dispatcher workload, stressand fatigue. As the above findings indicate, the measures of dispatcher workload used in thisstudy may not capture the cognitive or mental components of the dispatcher’s job. This isbecause so much of a dispatcher’s work is “in the head” with little or no visible evidence ofwork. Future workload measures and protocols should try to incorporate these aspects of adispatcher’s work. Ultimately, it will also be necessary to relate any measure of dispatcherworkload to dispatcher performance.
With respect to a physiological measure of stress, recent research has shown salivary amylaseor salivary melatonin to be a more responsive marker of stress than salivary cortisol, and to bemuch more resistant to masking effects. In addition, ambulatory stress monitoring techniquessuch as electromyogram (EMG), electrocardiogram (EKG), galvanic skin response (GSR), orpupillary data should also be considered because they provide continuous data.
Regardless of the workload, stress, and fatigue measures used to collect data during adispatcher’s work, more frequent data collection is necessary to capture the variation, and short-term fluctuations in workload, that are inherent in the dispatcher’s job. Data collected every 2 hrmay be insensitive to these variations. However, based on feedback from dispatchers solicitedthrough a focus group during the pilot study, increasing the frequency of data collection in theworkplace will probably not be acceptable to either railroad management or dispatchers.Because these individuals are conducting safety-critical work, there is also an increased risk ofdistracting them from their work as more is asked of them. A medium- to high-fidelitydispatching simulator would be more suitable for this type of research. Specifically, adispatching simulator would enable researchers to control workload and other conditions of thework environment in order to see their effects on the dispatcher. A dispatcher simulator wouldpermit collection of subjective and physiological data as frequently as needed and dispatcherperformance data could be easily collected.
The in situ nature of this study limited the analyses that could be performed in two importantrespects. First, it was not possible to control any aspects of the work environment or the workitself, e.g., workload. Second, given the constraints of the workplace there were limits on howmuch data could realistically be collected given that the dispatcher had to perform his/her job.These two limitations made it difficult to study individual workload, stress and fatigue factors indepth. The small study population also limited examination of the interactions among thesethree variables. Regardless of the method and measures used to study railroad dispatcherworkload, stress and fatigue, each of these topics should be explored separately, beforeinteractions among them are examined. In doing so, researchers would be able to study eachtopic in more depth than was possible in the current study, leading to a more completeunderstanding of the causes and underpinnings of dispatcher workload, stress and fatigue.

103
6.2 Recommendations for Additional Research
The field study described in this report was the first to explore railroad dispatcher workload,stress and fatigue concurrently. While the present study gave insight on some aspects of thedispatcher’s job and work environment, many issues remain to be explored. The findings andexperience of this study suggest several issues for further research. These issues include thefollowing:
• Dispatcher Performance Measures – The current study did not include any measures ofdispatcher performance. Without performance measures, it is not possible to say how thedispatcher’s ability to adequately perform his duties is affected by increasing levels ofworkload, stress and/or fatigue. A field or simulator study that includes dispatcherperformance measures can help determine how increasing levels of one or all threefactors compromise the dispatcher’s ability to carry out the job responsibilities in anefficient and safe manner. These performance measures should include both safety-related and efficiency-related outcomes.
• Comprehensive Dispatcher Profile – The small number of participants in this study andthe fact that they were from only two dispatching centers make it difficult to drawconclusions about the U.S. dispatcher population as a whole. Administering a survey toall U.S. dispatchers would lead to a much more comprehensive profile of the U.S.dispatcher workforce. This profile would help to identify any population-widecharacteristics that may pose safety risks to railroad operations.
• Rest Breaks – Although study participants reported taking about four breaks per shift,two-thirds reported difficulty getting coverage so that they could take the break. Studyresults also indicated increasing fatigue throughout the workday across all three shifts.Planned rest breaks are a recognized strategy for reducing fatigue. To date only onedispatching center in the U.S. has implemented planned rest breaks and this was only fora limited time. Another center experimented with having an extra dispatcher available tocover during breaks but currently no centers have scheduled breaks. A field or simulatorstudy could explore the value of planned rest breaks for reducing stress and fatigue in thedispatching environment.
• Prediction of Loss of Alertness – Both the Army and Air Force have been working onmodels for predicting performance degradation due to fatigue. Other models also exist.Development of a loss of alertness model for dispatchers would give both the dispatchersand their management a tool for assessing when performance is likely to degrade due tofatigue.
• Measures and Models of Dispatcher Workload – There is a need for valid and reliablemeasures of dispatcher workload. These measures should account for the duration andintensity of the workload over time, and individual differences among dispatchers.

104
• Effect of PTC on Dispatcher – The introduction of Positive Train Control willundoubtedly alter the dispatcher’s job, just as it is expected to affect the locomotiveengineer’s job. With PTC the dispatcher’s job could fundamentally change from one ofactively dispatching trains and other track users to one of passively monitoring orsupervising a closed loop system. Of particular concern is how PTC will affect adispatcher’s situation awareness, especially when time and safety-critical demands aremade on the dispatcher. The impact of PTC on dispatcher workload, stress and fatigueshould be examined in the early stages of PTC development so that the resultant PTCsystem can most effectively take into account the role of the dispatcher as systemsupervisor.

105
7. REFERENCES
Aschoff, J. (1979). Circadian Rhythms: General Features and Endocrinological Aspects. D. T.Krieger (ed.), Endocrine Rhythms (pp. 1-61). New York: Raven Press.
Barnes-Farrell, J. and Peotrowski, M. (1991). Discrepancies Between Chronological Age andPesona Age as a Reflection of Unrelieved Worker Stress. Work and Stress, 5(3), 177-187.
Bartter, F. C., Delea, C. S., and Halberg, F. (1962). A Map of Blood and Urinary ChangesRelated to Circadian Variations in Adrenal Cortical Function in Normal Subjects. Annals ofthe New York Academy of Sciences, 98, 969-983.
Beck, A. (1987). Beck Depression Inventory Manual. Palo Alto, CA: Consulting PsychologistsPress.
Bierbaum, C. R., Fulford, L. A., and Hamilton, D. B. (1990). Task Analysis/Workload (TAWL)User’s Guide (Version 3.0 ed.). Alexandria, VA: U.S. Army Research Institute for theBehavioral and Social Sciences.
Cooper, G. E., and Harper, R. P. (1969). The Use of Pilot Ratings in the Evaluation of AircraftHandling Qualities. (Report No. NASA TN-D-5153). Moffett Field, CA: NASA AmesResearch Center:
Czeisler, C. A., Kronauer, R. E., Allan, J. S., Duffy, J. F., Jewett, M. E., Brown, E. N., andRonda, J. M. (1989). Bright Light Induction of Strong (Type 0) Resetting of the HumanCircadian Pacemaker. Science, 244, 1328-1333.
Dahlgren, K. (1981). Long-term Adjustment of Circadian Rhythms to a Rotating ShiftworkSchedule. Scandinavian Journal of Work, Environment, and Health, 7, 141-151.
Dell’Erba, G., Venturi, P., Rizzo, F., Porcu, S., and Pancheri, P. (1994). Burnout and HealthStatus in Italian Air Traffic Controllers. Aviation, Space, and Environmental Medicine, 65,315-322.
Devoe, D. B. (1974). An Analysis of the Job of Railroad Train Dispatcher. (Report No. FRA-ORD&D-74-37). Springfield, VA: National Technical Information Service.
Federal Railroad Administration. (1990). National Train Dispatcher Safety Assessment.Washington, D.C.: U.S. Department of Transportation.

106
Federal Railroad Administration. (1995). National Train Dispatcher’s Follow-up Review.Washington, D.C.: U.S. Department of Transportation.
Fibiger, W., Evans, O., and Singer, G. (1986). Hormonal Responses to a Graded MentalWorkload. European Journal of Applied Physiology, 55, 339-343.
Gordon, G., Tepas, D., Stock, C., and Walsh, J. (1979). Gaining Access to ShiftworkersThrough Labor Unions. Behavior Research Methods and Instrumentation, 11, 14-17.
Gross, A. L., and Su, W. (1975). Defining a “Fair” or “Unbiased” Selection Model: A Questionof Utilities. Journal of Applied Psychology, 60(3), 345-351.
Hart, S. G., and Staveland, L. E. (1988). Development of the NASA-TLX (Task Load Index):Results of Experimental and Theoretical Research. P. A. Hancock, & N. Meshkati (eds.),Human Mental Workload (pp. 139-183). Amsterdam: North Holland.
Hellhammer, D. H., Kirschbaum, C., and Belkien, L. (1987). Measurement of Salivary CortisolUnder Psychological Stimulation. J. N. Hintigen, D. H. Hellhammer, and G. Huppmann(eds.), Advanced Methods in Psychobiology (pp. 281-289). Toronto: Hogrefe.
Hunter, J. E., and Hunter, R. F. (1984). Validity and Utility of Alternative Predictors of JobPerformance. Psychological Bulletin, 96(1), 72-98.
Johnson, L. C., and Naitoh, P. (1974). The Operational Consequences of Sleep Deprivation andSleep Deficit. (Report No. AGARD-AG-193, NATO). London: Technical Editing andReproduction.
Kirschbaum, C., Read, G. F., and Hellhammer, D. H. (1992). Assessment of Hormones andDrugs in Biobehavioral Research. Seattle: Hogrefe & Huber.
Kirschbaum, C., Read, G. F., and Hellhammer, D. H. (1994). Salivary Cortisol inPsychoneuroendocrine Research: Recent Developments and Applications.Psychoneuroendocrinology, 19(4), 313-333.
Knauth, P., and Rutenfranz, J. (1987). Shiftwork. J. M. Harrington (ed.), Recent Advances inOccupational Health (pp. 263-281). Edinburgh: Churchill Livingstone.
Laudat, M. H., Cerdas, S., Fournier, C., Guiban, D., Guilhaume, B., and Luton, J. P. (1988).Salivary Cortisol Measurement: A Practical Approach to Assess Pituitary-Adrenal Function.Journal of Clinical Endocrinology and Metabolism, 66(2), 343-348.
Matthews, G., Jones, D. M., and Chamberlain, A. G. (1990). Refining the Measurement ofMood: The UWIST Mood Adjective Checklist. British Journal of Psychology, 81, 17-42.
McConnell, E. (1998). Automated Vital Signs Monitoring Devices. Nursing Management, 29(2),49-517.

107
McCord, C. P. (1948). Life and Death by the Minute. Industrial Medicine, (October), 377-382.
Menotti, A., and Seccareccia, F. (1985). Physical Activity at Work and Job Responsibility asRisk Factors for Fatal Coronary Heart Disease and Other Causes of Death. Journal ofEpidemiology and Community Health, 39, 325-329.
Migeon, C. J., Tyler, F. H., Mahoney, J. P., Florentin, A. A., Castle, H., Bliss, E. L., andSamuels, L. T. (1956). The Diurnal Variation of Plasma Levels and Urinary Secretion of 17-hydroxycorticosteroids in Normal Subjects, Night Workers, and Blind Subjects. Journal ofClinical Endocrinology and Metabolism, 16, 622-633.
Moore-Ede, M. C., and Richardson, G. S. (1985). Medical Implications of Shiftwork. AnnualReview of Medicine, 36, 607-617.
Nadler, E., Haines, M., Bonin, J., and Grossberg, M. (1997). Laptop Recording of OperationalTaskload. Proceedings of the Human Factors and Ergonomics Society 41st Annual Meeting.Santa Monica, CA: Human Factors and Ergonomics Society.
Nichols, C. T., and Tyler, F. H. (1967). Diurnal Variation in Adrenal Cortical Function. AnnualReview of Medicine, 18, 313-324.
Peterson, R. E. (1957). Plasma Corticosterone and Hydroxycortisone Levels in Man. Journal ofClinical Endocrinology and Metabolism, 17, 1150-1157.
Pincus, G. (1943). A Diurnal Rhythm in the Excretion of Urinary Ketosteroids by Young Men.Journal of Clinical Endocrinology and Metabolism, 3, 195-199.
Reid, G. B., and Nygren, T. E. (1988). The Subjective Workload Assessment Technique: AScaling Procedure for Measuring Mental Workload. P. A. Hancock, & N. Meshkati (eds.),Human Mental Workload (pp. 185-213). Amsterdam: North Holland.
Riad-Fahmy, D., Read, G. F., Walker, R. F., and Griffith, K. (1982). Steroids in Saliva forAssessing Endocrine Function. Endocrinology Review, 3, 367-395.
Roscoe, A. H. (1987). In-flight Assessment of Workload Using Pilot Ratings and Heart Rate.(Report No. AGARD-AG-282). NATO.
Sauter, S. and Murphy, L. (1995). Organizational Risk Factors for Job Stress. Washington, DC:American Psychological Association.
Schmidt-Reinwald, A., Pruessner, J. C., Hellhammer, D. H., Federenko, I., Rohleder, N.,Schurmeyer, T. H., and Kirschbaum, C. The Cortisol Response to Awakening in Relation toDifferent Challenge Tests and a 12-Hour Cortisol Rhythm. Life Sciences, 64(18), 1653-1660.

108
Selye, H. (1978). The Stress of Life (Revised ed.,). New York: McGraw-Hill.
Spielberger, C. D. (1983). State Trait Anxiety Inventory, Form Y. Palo Alto, CA: ConsultingPsychologists Press.
Tepas, D., and Carlvalhais, A. (1990). Sleep Patterns of Shiftworkers. (pp. 199-208).Philadelphia, PA: Hanley & Belfus, Inc.
Tepas, D., Walsh, J., Moss, P., and Armstrong, D. (1981). Polysomnographic Correlates of ShiftWorker Perofmrance in the Laboratory. A. Reinberg, & N. A. P. Vieux (Editors), Night andShift Work: Biological and Social Aspects. Oxford: Pergamon Press.
Tepas, D., and Monk, T. H. (1987). Work Schedules. G. Salvendy (ed.), Handbook of HumanFactors and Ergonomics (Second ed.,). New York: John Wiley and Sons.
Tepas, D., Paley, M. J., and Popkin, S. M. (1997). Work Schedules and Sustained Performance.G. Salvendy (ed.), Handbook of Human Factors and Ergonomics (Second ed.). New York:John Wiley and Sons.
Thomas, G. R., Raslear, T. G., and Kuehn, G. I. (1997). The Effects of Work Schedule on Train-Handling Performance and Sleep of Locomotive Engineers: A Simulator Study.Washington, D.C.: FRA.
Vanderhorst, J. (1990). A Comparison of Voice and Data Link Communication: RailroadDispatcher's Perspective. (Report No. PB91-130021INZ). Springfield, VA: NationalTechnical Information Service.
Vining, R. F., and McGiley, R. A. (1986). Hormones in Saliva. Critical Review in the ClinicalLaboratory Sciences, 23, 95-146.
Weiten, W. (1992). Psychology Themes and Variations (Second ed.). Pacific Grove, CA:Brooks/Cole.
Weitzman, E. D., Fukushima, D. K., Nogeire, C., Roffwarg, H., Gallagher, T. F., and Hellman,L. (1971). Twenty-four Hour Pattern of the Episodic Secretion of Cortisol in NormalSubjects. Journal of Clinical Endocrinology and Metabolism, 33, 14-22.
Wever, R. (1979). The Circadian System of Man. Results of Experiments Under TemporalIsolation. New York: Springer-Verlag.
Zeier, H. (1994). Workload and Psychophysiological Stress Reactions in Air Traffic Controllers.Ergonomics, 37(3), 525-539.
Zuckerman, M., and Lubin, B. (1986). Multiple Affect Adjective Checklist - Revised. San Diego:Educational and Industrial Testing Service.

109
APPENDIX A
DEFINITION OF ACTIWATCH DATA
Sleep Start – Time of sleep onset.
Sleep End – Time of sleep termination.
Bed Time - Time at which subject went to bed or turned off the lights.
Get up Time - Time at which subject left the bed or turned on the lights.
Time in bed – Difference in hours and minutes between the Bed Time and Get up time.
Estimated sleep time – Difference between the Sleep End and the Sleep Start times.
Sleep latency – Period of time required for sleep onset after going to bed. It is computed as theperiod between Bed Time and Sleep Start.
Sleep efficiency – An index of the amount of time in bed that is actually spent sleeping.Compute by dividing the Actual Sleep Time by the Time in Bed and multiplying by 100.
Number of sleep bouts – A count of continuous blocks of sleep.
Mean length of sleep bouts – The average length of the blocks of continuous sleep. Calculatedby dividing the Actual Sleep Time by the Number of Sleep Bouts.
Movement and fragmentation index – An index of restlessness. Calculated by summing theNumber of Minutes Moving Percentage with the Immobility Phases of 1 Minutes Percentage.
Number of Minutes Moving Percentage – Calculated by dividing the number of Minutes Movingby the Estimated Sleep Time and multiplying by 100.
Immobility Phases of 1 Minute – Number of one-minute increments in which there is no motion.

110
APPENDIX B
FORMS FOR FIELD STUDY
NOTE:This appendix is not available in pdf format. The
printed version of this report contains this appendix.

149
APPENDIX C
PILOT STUDY
The purpose of the pilot study was to test and evaluate the utility and practicality of a numberof data collection measures and procedures for use in a railroad dispatching office. The pilotstudy was also used to identify potentially problematic situations that can occur in a field studyof this nature, and means of addressing those situations. Data from the pilot study were used toevaluate the success of the data collection instruments and their protocols. These data were notused to draw conclusions about railroad dispatcher workload, stress and fatigue.
C.1 Materials
A number of test instruments were used in the pilot study. They included:
1. A background survey that contained questions pertaining to railroad dispatcher healthand well-being; work scheduling and sleep habits; sources of stress in the workplace;interpersonal relationships; control over work; and quality of life.
2. A participant instruction and survey booklet that included an introduction to the study;definitions of workload, stress and fatigue; instructions for completing the dailysubjective ratings; a set of five subjective workload, stress, and fatigue ratings for eachday of the study; one sleep log for every day; and a debriefing survey.
3. Wrist-worn actigraphs.
4. Salivary cortisol assays.
5. A laptop computer-based data collection system.
6. An observation-based workload assessment system.
In addition, an informed consent form was developed for administration in the pilot study.The informed consent form described in detail the conditions of the study, as well asparticipants’ rights and responsibilities.

150
C.2 Pilot Study Sites and Procedures
Three dispatching centers were selected as pilot study sites. These centers were located inthree different geographical regions across the country and represented both types of railroadoperations—freight and commute/passenger. All three pilot studies were conducted in the Fallof 1997. Table C-1 provides some details on the pilot study locations, dates, and procedurestested.
Participants read the instructions and signed an informed consent form prior to the start ofdata collection. It was emphasized that participants’ primary functions of dispatching and safetywere to take precedence over any study activities, and that if any conflict should arise,participants should complete their primary job duties first, and address the study tasks at aconvenient time later.
C.2.1 Pilot Study No. 1
The first of the three pilot studies was conducted in a freight railroad dispatching centerlocated in the Mid-Atlantic. The dispatching center was dimly lit, and each dispatcher worked athis/her own workstation (see Figure C-1). The instruments tested at this location included thebackground survey, daily subjective ratings, and the laptop computer-based modified NIMSworkload data collector. Two participants were recruited and were paid $35 each for theirparticipation. The primary goal for this pilot study was to explore the feasibility of using themodified NIMS data collector to collect railroad dispatching-related information in situ. Datawere collected for two days, following two days of experimenter practice with the laptop PC datacollection system.
Problems using the NIMS data collector were apparent at the outset of the pilot study. Theseproblems are described in subsection C.3.1. As a consequence, the possibility of collectingfrequencies of various activities (e.g., number of incoming versus outgoing calls, number ofForm D’s completed, etc.) by hand was explored as an alternative to the computer-based system.Frequency counts are not sensitive to time since they can be recorded after their occurrence usingcomputer- and paper-based records, and they provide similar information to what the PC systemcould yield. Due to the difficulties in using the computer-based system to collect dispatcher-related task activity at the freight operation, plans for the second pilot study were modified sothat frequency count information would be incorporated into the design of the pilot study.
Table C-1. Pilot study locations, dates and procedures
Study No. Location Type of Operation Procedures Tested
1. Mid-Atlantic Freight Background survey, subjective ratings, sleeplogs, NIMS
2. New England Commuter/passenger Actigraph, background survey, salivarycortisol, sleep logs, subjective ratings,objective workload measures
3. Midwest Commuter mTAWL
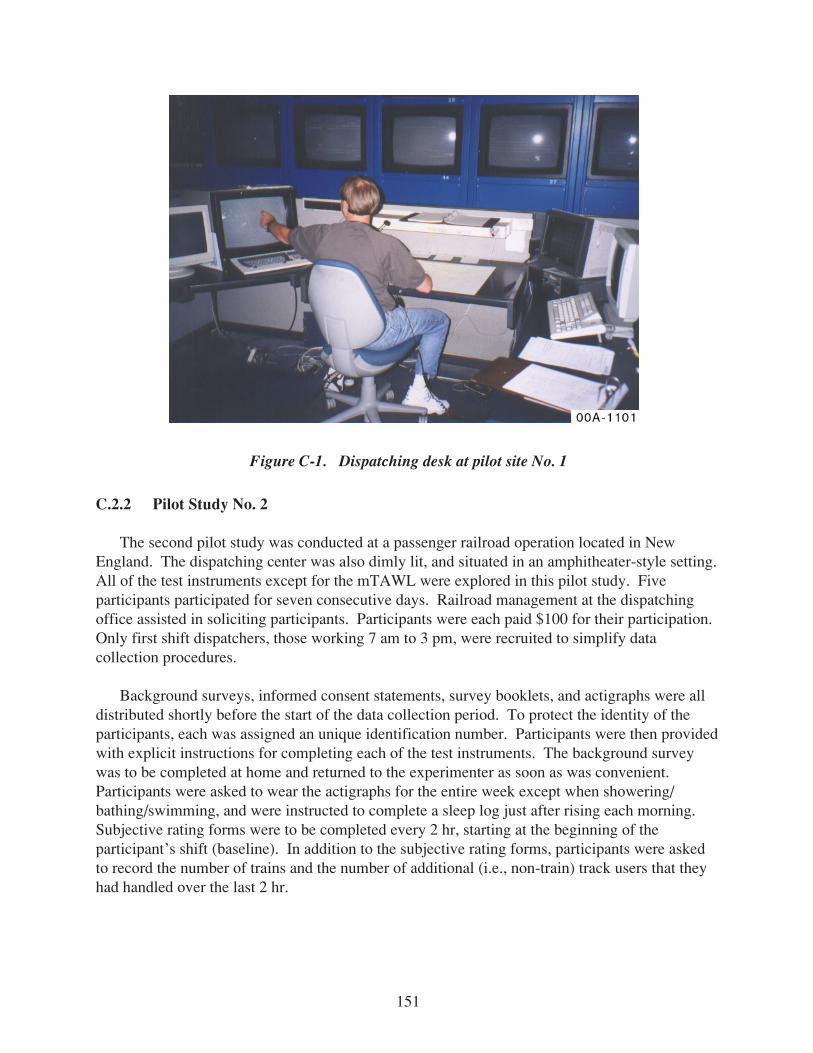
151
C.2.2 Pilot Study No. 2
The second pilot study was conducted at a passenger railroad operation located in NewEngland. The dispatching center was also dimly lit, and situated in an amphitheater-style setting.All of the test instruments except for the mTAWL were explored in this pilot study. Fiveparticipants participated for seven consecutive days. Railroad management at the dispatchingoffice assisted in soliciting participants. Participants were each paid $100 for their participation.Only first shift dispatchers, those working 7 am to 3 pm, were recruited to simplify datacollection procedures.
Background surveys, informed consent statements, survey booklets, and actigraphs were alldistributed shortly before the start of the data collection period. To protect the identity of theparticipants, each was assigned an unique identification number. Participants were then providedwith explicit instructions for completing each of the test instruments. The background surveywas to be completed at home and returned to the experimenter as soon as was convenient.Participants were asked to wear the actigraphs for the entire week except when showering/bathing/swimming, and were instructed to complete a sleep log just after rising each morning.Subjective rating forms were to be completed every 2 hr, starting at the beginning of theparticipant’s shift (baseline). In addition to the subjective rating forms, participants were askedto record the number of trains and the number of additional (i.e., non-train) track users that theyhad handled over the last 2 hr.
Figure C-1. Dispatching desk at pilot site No. 1

152
As part of the procedure for collecting participants’ saliva, participants were asked to refrainfrom eating, drinking and smoking for 20 min prior to each saliva sampling. At the time ofsampling, the dispatcher placed a small, sterile cotton cylinder, similar to those used by dentists,in their mouth without touching the material. Once soaked with saliva, about two minutes, theparticipant placed the cotton into a sterile plastic tube, sealed it, and placed it in an ice chestlocated at their desk as part of the study. Participants were asked to write down the time thatthey completed taking the sample as well as the unique number of the sample. Participantsprovided a saliva sample five times daily, upon starting their shift and every 2 hr thereafter. Atthe end of each day, technicians collected the saliva samples and delivered them to a local lab foranalysis.
An experimenter also observed each participant once for an entire shift to collect frequencycount information (e.g., number of incoming versus outgoing calls, etc.). At the end of the studyperiod, each participant completed the debriefing survey, and returned the background surveys,the survey booklets containing the daily subjective ratings, sleep logs and debriefing survey, andthe actigraphs. Participants were then thanked and paid for their participation. Data fromdispatcher records pertaining to the number of Form Ds and foul time permits issued werecollected after the pilot study was completed.
While most data were analyzed in-house, the Actigraph data were downloaded and analyzedby Ambulatory Monitoring personnel.
C.2.3 Pilot Study No. 3
The third pilot study was conducted at a commuter railroad operation located in the Midwest.The dispatching center was located in a small, modern facility. The goal of this pilot study wasto evaluate the modified TAWL (mTAWL) approach to assessing a railroad dispatcher’sworkload.
In consultation with site personnel, one dispatching desk was selected for observation duringevening rush hour. This desk was considered appropriate for observation since it had a very highlevel of traffic and involved both scheduled commuter and unscheduled freight trains. The firstobservations were made with a floor supervisor present to answer questions and assist in thecreation of task definitions and resource channel loads for the mTAWL tasks. Three 2 to 3 hrobservations were conducted to determine task definitions and channel loadings.
Preliminary observations indicated that the channel loads associated with the performance ofany given task did not fluctuate over time in any predictable way. Consequently, averagechannel loadings were computed for each task. Table C-2 presents the subcategories andaverage channel loadings for each type of task.
During a single 2-1/2 hr observation period, the observed dispatcher handled 118 trackoccupants, with a majority of these occupants present during the 2 hr evening rush home. Thislevel of activity makes it impossible to simultaneously observe, record, and classify thedispatcher’s behaviors. With multiple events occurring in a 1 min period, it was deemed

153
Table C-2. Task types and channel loadings
Channel Loading
Task Area Task Description Audio Visual CognitivePsycho-motor
Background • Auditory monitoring - listening forradio or telephone calls.
1 0 0 0
• Visual monitoring - watching forunanticipated events on theinformational displays.
0 1 0 0
• Background “phone” - telephoneor radio calls made during thecourse of work at times chosenby the dispatcher and not directlyrelated to the anticipated oractual control of a specific train orwork crew.
3 1 2 1
• Background “computer” -computer or paper entriesrequired during the shift that donot require an immediate actionand can be performed at timeschosen by the dispatcher.
0 2 2 6
Foreground • Foreground “phone” – telephoneor radio calls made or receivedduring the course of work whichrequired an immediate responseand which were not directlyrelated to previously anticipatedactions or the current control of aspecific train or work crew.
3 1 2 1
• Foreground “computer” –computer or paper entriesrequired during the shift that werenot directly related to previouslyanticipated actions or the currentcontrol of a specific train or workcrew but that had to be takencare of immediately.
0 2 2 6
Anticipatory • Anticipated unopposed – theanticipated arrival of a trackoccupant whose progress towardthe dispatcher’s territory isexpected to be unimpeded.
1 1 1 0
• Anticipated opposed – theanticipated arrival of a trackoccupant whose progress to thedispatcher’s territory wasexpected to be opposed byanother track occupant oroccupants.
1 1 2 0
TrackManagement
• Track occupant unopposed - aperiod of time during which aspecific track occupant under thedispatcher’s control isunimpeded.
1 1 1 1

154
appropriate to observe and record the events as they occurred, and later classify them as a post-processing activity. Train sheets were especially useful in the categorization process to verifytrack occupancy times and locations after-the-fact.
Observed events were then entered into a time-sequenced spreadsheet that also included agraphical representation of train movements and track occupancy. Columns in the spreadsheetwere used to represent different railroad tracks, and were arranged to represent spatialrelationships, so that conflicts in train movement and track occupancy would be readily apparent.This spreadsheet also revealed the dispatcher’s responses to triggering events and how trackoccupancy conflicts were resolved. A sample spreadsheet is provided in Figure C-2.
C.3 Pilot Study Results
This section describes the findings and experiences from the three pilot studies. The purposeof the pilot studies was to evaluate the feasibility and appropriateness of using the selectedcandidate data collection instruments and procedures in the railroad dispatching workenvironment. Consequently, results are reported in terms of how successful each of the testinstruments or procedures was with respect to field setting and the nature of the dispatcher’s job.Results from the pilot studies were then used to modify the testing instruments and proceduresused in the full field study.
C.3.1 Results from Pilot Study No. 1
The NIMS data collector proved very difficult and inefficient to use for several reasons.First, the dynamic nature of the dispatcher’s work made it difficult to determine when activitiesbegan and ended. For example, calls are put on hold/standby and dispatchers switch back andforth between activities (e.g., from recording something in their train sheet, to changing a switch/signal on their CTC, to returning to the train sheet to complete their entry, etc.). Second, often ittook several seconds to determine what activity was taking place, thereby losing valuablerecording time. For example, it took time to determine if a call or radio communication wasincoming or outgoing. Furthermore, some conversations were very brief. As a result, it waseasy to lose recording time as well as to miss entire events. Third, many dispatcher activitieswere also of short duration, high frequency and highly repetitive, making it very difficult toaccurately capture all of the activities taking place. Finally, individuals, including the traindispatcher under observation, attempted to engage the observer in conversation, making itdifficult to make accurate (i.e., timely) recordings.
For all of these reasons, the NIMS data collection system was abandoned. Instead, simpletask frequency information (e.g., number of incoming versus outgoing calls, number of Form D’scompleted, etc.) was collected. It was both feasible and unobtrusive to collect this information.No attempt was made to analyze either the NIMS data or the task frequency data since data wascollected only on two 8 hr shifts.
Separately, feedback from the two participants indicated no difficulties or problems withcompleting the background survey, daily subjective ratings, or sleep logs.

155
Fig
ure
C-2
. S
ampl
e m
TA
WL
spr
eads
heet

156
C.3.2 Results from Pilot Study No. 2
Results from the second pilot study are organized around the particular instrument that wasbeing tested and evaluated in the pilot study.
C.3.2.1 Background Survey
Based on casual conversations with participants, surveys did not take long to complete, norwere the contents difficult to understand. Data from the background surveys were examined todetermine the quality and range of responses to the various question sections. Among the moreinteresting responses are the following: 1) four out of five dispatchers had experienced or werecurrently experiencing health symptoms related to stress, for example, back and neck pain,intestinal upsets, anxiety, and headaches. 2) In terms of work scheduling, all of the dispatcherscomplained that they were too busy to take breaks and that it was difficult to get anotherdispatcher to cover for them, even in emergencies. In addition, most complained about the lackof a regular lunch break and the attendant necessity of having to eat hurriedly at theirworkstations. 3) Four out of the five dispatchers reported at least one symptom of insomnia andexperienced daytime sleepiness as a consequence. 4) Most of the participants rated the visualdemands of their work as high or very high, and also reported symptoms of eyestrain. 5) Lack ofcontrol over features of their work and working environment were reported as important sourcesof occupational stress. 6) The occasional loss of temper on the job was nearly universal amongsurveyed volunteers, and many also confided that they tend to take their work stress home withthem at the end of the day. The items on the background survey thus seemed sufficientlysensitive to be used in the full field study.
C.3.2.2 Objective Workload
Objective workload data was collected in the form of number of trains and other track usersthat the participants handled, the number of mandatory directives (i.e., track usage authorities)issued and/or canceled by dispatchers, and the number of incoming and outgoing phone calls.The data were collapsed across participants as well as days, and are illustrated in Figures C-3through C-6. Figure C-3 shows that train traffic peaked early in the shift, then decreased aftermorning rush hour.
There was a corresponding increase in other track usage during mid-morning, as maintenancecrews made track repairs and inspections during periods of light train traffic. This pattern is alsoreflected in increases in mandatory directives (Figure C-4) and phone calls (Figure C-5)following rush hour.
Inspection of the data indicates that dispatcher-reported data and official dispatcher recordsare a viable source of workload information. However, there were several potential problemsthat had implications for the field study. First, dispatchers at this pilot study site were notrequired to report when foul time permits were issued; only when they were voided.Furthermore, it would not be feasible to monitor all the participants in the full field study in orderto collect counts on the number of phone and radio calls and the number of Form D’s issued and

157
Figure C-3. Traffic volume
Figure C-4. Track usage authorities
0
1
2
3
4
6:30 AMTime
8:30 AM 10:30 AM 12:30 PM 2:30 PM
3.77
0.59
3.29
1.872.21
3.5
2.92 2.782.55
2.87
TrainsA
vera
ge N
umbe
r of
Tra
ins
and
Trac
k U
sers
Track Users
436-FRA-97120-1
6:30-8:30 AM 8:30-10:30 AM 10:30 -12:30 PMTime
12:30-2:30PM
436-FRA-97120-2
0
1
2
3
4
5
1.73
4.95 5
3.23
Ave
rage
Num
ber
of A
utho
ritie
s Is
sued
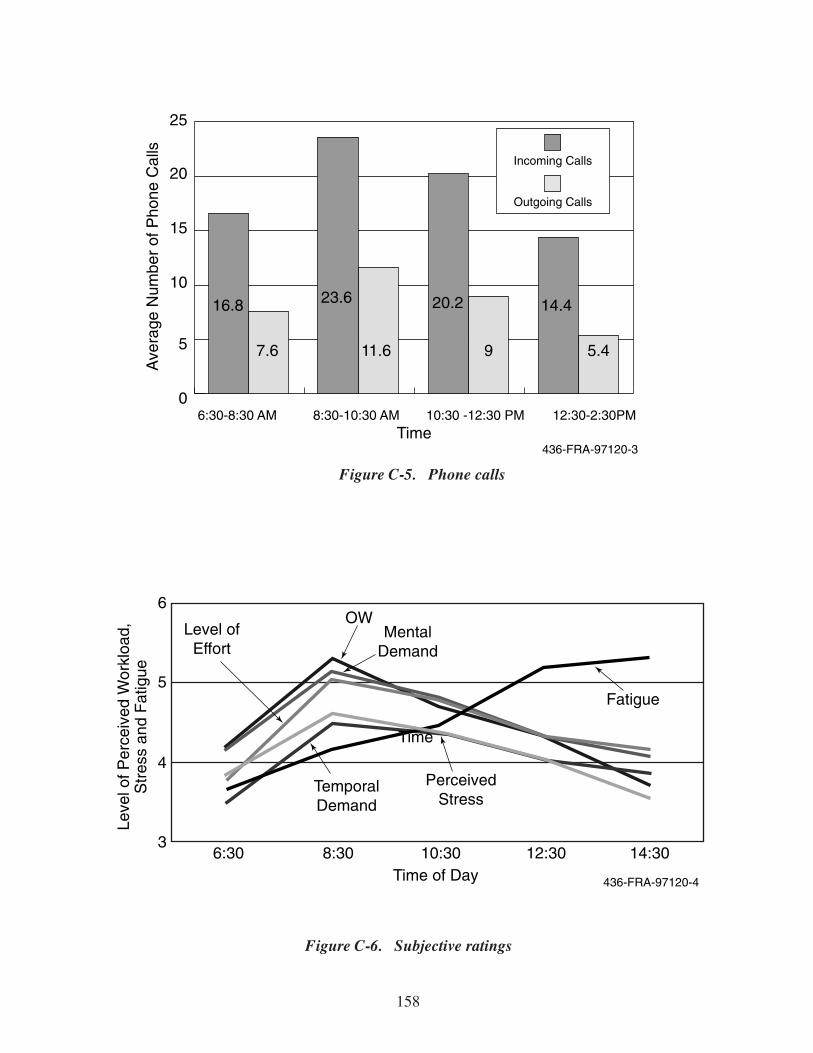
158
Figure C-5. Phone calls
Figure C-6. Subjective ratings
6:30-8:30 AM 8:30-10:30 AM 10:30 -12:30 PMTime
12:30-2:30PM
436-FRA-97120-3
0
5
10
15
20
25
16.8
7.6
23.6
11.6
20.2
9
14.4
5.4
Incoming Calls
Outgoing Calls
Ave
rage
Num
ber
of P
hone
Cal
ls
436-FRA-97120-4
3
4
5
6
6:30 8:30 10:30 12:30 14:30
Level ofEffort
OW
TemporalDemand
PerceivedStress
MentalDemand
Fatigue
Time
Time of Day
Leve
l of P
erce
ived
Wor
kloa
d,
Str
ess
and
Fat
igue
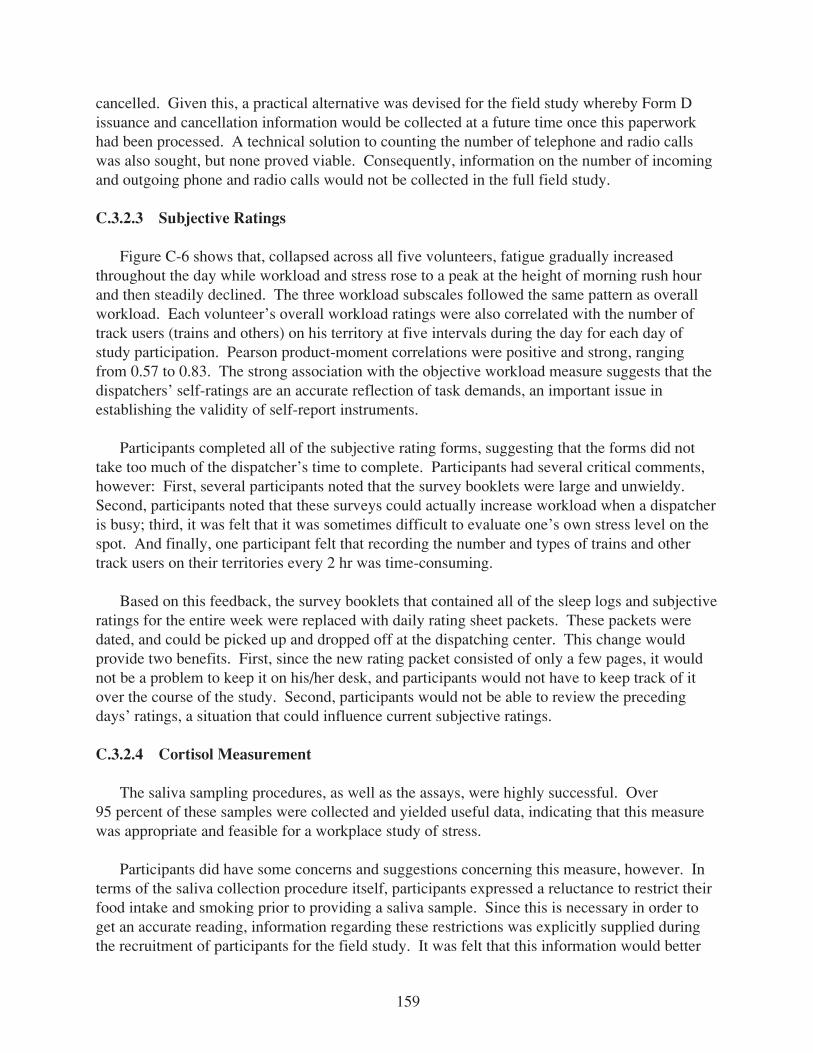
159
cancelled. Given this, a practical alternative was devised for the field study whereby Form Dissuance and cancellation information would be collected at a future time once this paperworkhad been processed. A technical solution to counting the number of telephone and radio callswas also sought, but none proved viable. Consequently, information on the number of incomingand outgoing phone and radio calls would not be collected in the full field study.
C.3.2.3 Subjective Ratings
Figure C-6 shows that, collapsed across all five volunteers, fatigue gradually increasedthroughout the day while workload and stress rose to a peak at the height of morning rush hourand then steadily declined. The three workload subscales followed the same pattern as overallworkload. Each volunteer’s overall workload ratings were also correlated with the number oftrack users (trains and others) on his territory at five intervals during the day for each day ofstudy participation. Pearson product-moment correlations were positive and strong, rangingfrom 0.57 to 0.83. The strong association with the objective workload measure suggests that thedispatchers’ self-ratings are an accurate reflection of task demands, an important issue inestablishing the validity of self-report instruments.
Participants completed all of the subjective rating forms, suggesting that the forms did nottake too much of the dispatcher’s time to complete. Participants had several critical comments,however: First, several participants noted that the survey booklets were large and unwieldy.Second, participants noted that these surveys could actually increase workload when a dispatcheris busy; third, it was felt that it was sometimes difficult to evaluate one’s own stress level on thespot. And finally, one participant felt that recording the number and types of trains and othertrack users on their territories every 2 hr was time-consuming.
Based on this feedback, the survey booklets that contained all of the sleep logs and subjectiveratings for the entire week were replaced with daily rating sheet packets. These packets weredated, and could be picked up and dropped off at the dispatching center. This change wouldprovide two benefits. First, since the new rating packet consisted of only a few pages, it wouldnot be a problem to keep it on his/her desk, and participants would not have to keep track of itover the course of the study. Second, participants would not be able to review the precedingdays’ ratings, a situation that could influence current subjective ratings.
C.3.2.4 Cortisol Measurement
The saliva sampling procedures, as well as the assays, were highly successful. Over95 percent of these samples were collected and yielded useful data, indicating that this measurewas appropriate and feasible for a workplace study of stress.
Participants did have some concerns and suggestions concerning this measure, however. Interms of the saliva collection procedure itself, participants expressed a reluctance to restrict theirfood intake and smoking prior to providing a saliva sample. Since this is necessary in order toget an accurate reading, information regarding these restrictions was explicitly supplied duringthe recruitment of participants for the field study. It was felt that this information would better
160
prepare the participant to follow the procedure, and would provide him/her with the opportunityto decline to participate if this restriction were too inconvenient. Separately, one participantcommented that chewing on the cotton swab interfered slightly with his communications, andanother participant felt that the pressure to produce the sample could increase workload. Therewas also a concern that the timing of the saliva collection was sometimes inconsistent with highworkload periods. Since most participants did not find the salivary cortisol procedure tooinvasive, however, and because it was the only physiological measure of stress incorporated intothe study, salivary cortisol would also be used in the full field study.
C.3.2.5 Actigraphy and Sleep Logs
Inspection of participants’ sleep logs indicated that four of the five were sleeping an averageof 6 hr per night, including days off. Furthermore, it was not uncommon for some dispatchers tooccasionally get only 4 to 5 hr of sleep per night. Subjective reports of sleep duration weregenerally consistent with the results of the actigraphy (a mean of 6.25 hr per night). In a fewcases, however, the actigraphs either overestimated or underestimated the participants’ sleepduration. With respect to overestimation of sleep, the actigraph was apt to score a still butwakeful subject as being asleep. In terms of underestimating sleep length, a participant may betossing and turning in Stage I (light) sleep, but the actigraph data will indicate that s/he wasawake. This is a problem with using motion to infer sleep/wakefulness, not just with theparticular actigraph chosen for the study.
One other problem that arose with the actigraphy related to the physical size of the actigraph.Many of the participants felt that it was rather large, heavy, and uncomfortable. This was aparticular concern to the participants if the watch was to be worn for two consecutive weeks, asin the field study. Based on this feedback, alternative wrist-worn actigraphs were explored forthe field study, and a new watch design was eventually selected that addressed the pilot studyparticipants concerns.
There was one participant whose subjective reports and actigraph conclusions weredissociated. This dispatcher was an extremely restless sleeper, who regularly reported gettingmuch more sleep than was indicated by his actigraph recordings. He also indicated that he usedalcohol as a relaxant and sleep aid. This presents a number of problems. First, frequentawakenings to toilet are likely. Second, alcohol tends to diminish Stages III and IV (deep) sleep,making sleep less restful and restorative. Finally, alcohol has a tendency to affect perceptions,making the individual less accurate at estimating or recalling his previous night’s sleep. In thispilot study, as in many cases of dissociation, it was difficult to tell whether the actigraphrecordings or subjective reports were more accurate.
Regarding the sleep logs, again there was high compliance in completing all the items onthese forms over the entire week. The data provided by these forms appeared to have facevalidity. All but one of the dispatchers reported waking up an average of 1 to 3 times per night,though some awoke as frequently as 5 to 6 times per night. Four out of five volunteers reportedno use of sleep aids, while the fifth dispatcher admitted to using alcohol as a sleep aid. Ease offalling asleep and ease of getting up ranged generally from very easy to fairly difficult, with a

161
few reports of “very difficult.” Ratings of sleep sufficiency were split fairly evenly betweensufficient and insufficient, with only one report each of wholly insufficient and more thansufficient. Assessments of overall sleep quality ranged from fair to good for a majority of thenights (74 percent of the nights, or 26 out of 35 rest periods). Reports of overall fatiguegenerally ranged from somewhat fatigued to fairly rested, with few reports of being either veryfatigued or very rested.
C.3.2.6 Debriefing Survey
This survey served as a mechanism for the participants to provide feedback about the variousmethodologies used during the pilot study. In general, the tested methodologies and protocol didnot compromise the participants’ ability to perform their daily work activities and routine. Allparticipants expressed a willingness to participate again in the longer field study, withappropriate financial remuneration. Participants felt that $100 per week was fair compensationfor the amount of involvement required of study participants. The debriefing survey was alsoused to collect additional information such as the date of the most recent day(s) off immediatelyprior to the start of the field study.
C.3.3 Results from Pilot Study No. 3
The adoption of the TAWL approach from a military flight deck to railroad dispatchingcenter was successful. The task load totals for each channel were used to generate Figure C-7,where the four lines represent Auditory, Visual, Cognitive, and Psychomotor loads. Theduration of the observation was 146 min. Time progresses from left to right on the abscissa. Theheight of the lines represents resource channel loads. When a line exceeds the value of 7 on thevertical scale, it implies an overload for that channel.
The TAWL concept of maximum channel load (7) implies that an operator’s ability toperform a task may be compromised if a channel is loaded beyond that point. Figure C-7 showsa number of overload periods. The most significant of these occurs between the 41st and51st min. During this period, all channels were overloaded. An investigation of the writtenrecord shows that six trains were present during this time period and considerable effort wasexpended in successfully moving them, particularly since many of the movements werepotentially opposed.
During the first 20 min of the session, observed overload primarily involved the cognitivechannel. The written record shows that a long, slow moving freight train unexpectedly appearedand had to be moved across the high-speed passenger main lines. The move was accomplishedwithout delay or incident, but the overload of the cognitive channel implies a high level ofplanning and mental effort.
Based on this information, the mTAWL methodology was incorporated into the design of thefull field study.

162
Fig
ure
C-7
. C
hann
el lo
adin
gs
1121
3141
5161
7181
9110
111
112
113
114
11
536-
FR
A-0
0045
-1
16 15 14 13 12 11 10 9 8 7 6 5 4 3 2 1 0
Channel Load Levels
Tim
e
Aud
itory
Vis
ual
Cog
nitiv
eP
sych
omot
or
146
Min
ute
Obs
erva
tion:
ME
TR
A 1
2/11
/97

163
APPENDIX D
mTAWL RESULTS
A total of 22 mTAWL observations were done, 10 at the freight operation and 12 at thepassenger operation. The mTAWL data for six of the freight observations are presented insubsection 5.3.1. This appendix contains the data for the remaining four freight observationsalong with the data for the 12 passenger observations The last four graphs display the rawmTAWL data for two passenger and two freight observations using a 15 min moving average.
NOTE:This appendix is not available in pdf format. The
printed version of this report contains this appendix.

183
APPENDIX E
SUPPORTING STATISTICAL ANALYSES

184
Table E-1. Post hoc (Tukey HSD) comparisons by shift for each workload variableby study site
Site Variable Day versus Evening Evening versus Night Night versus Day
Freight No. Trains 2h p=0.004 p=0.030 NsNo. Users 2h p=0.010 p<0.001 p<0.001
Passenger No. Trains 2h Ns Ns NsNo. Users 2h Ns Ns Ns
Freight No. Trains 4h p=0.004 p<0.001 NsNo. Users 4h p<0.001 ns p<0.001
Passenger No. Trains 4h Ns p=0.009 p=0.001No. Users 4h p<0.001 ns p<0.001
Freight No. Trains 6h Ns p=0.031 NsNo. Users 6h p<0.001 ns p<0.001
Passenger No. Trains 6h Ns p=0.006 p=0.003No. Users 6h p<0.001 Ns p<0.001
Freight No. Trains 8h Ns Ns NsNo. Users 8h p<0.001 Ns p<0.001
Passenger No. Trains 8h Ns Ns NsNo. Users 8h p=0.027 Ns p=0.001
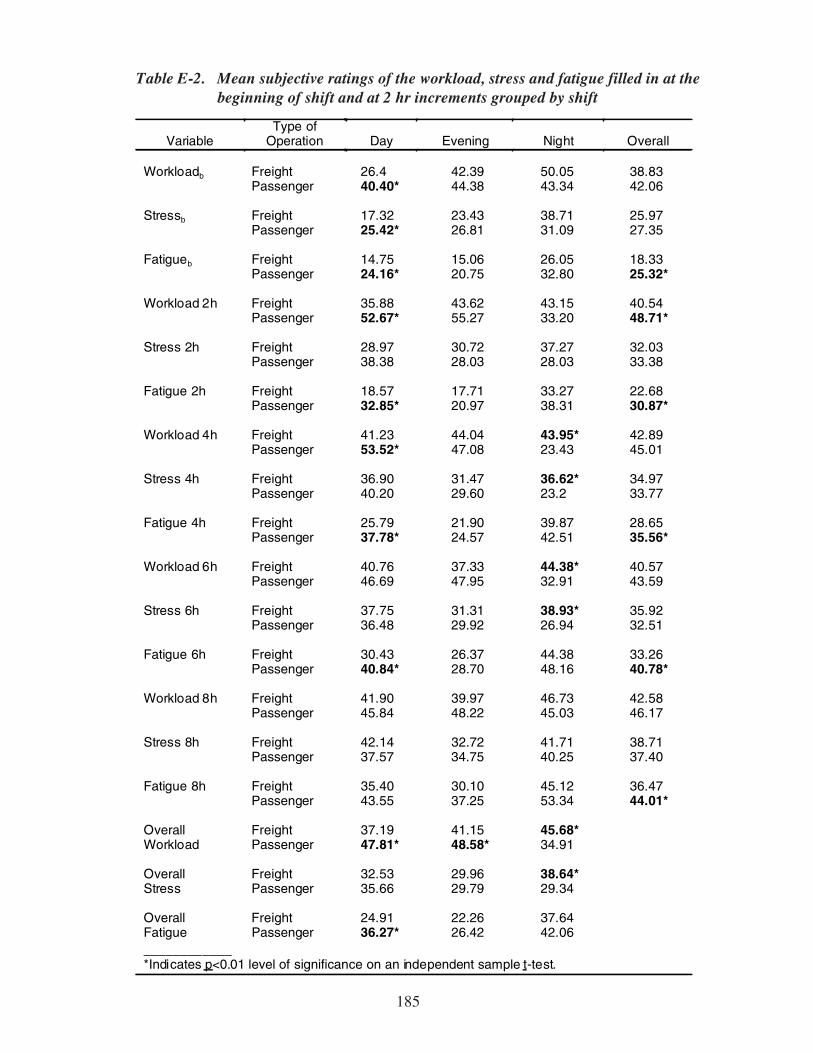
185
Table E-2. Mean subjective ratings of the workload, stress and fatigue filled in at thebeginning of shift and at 2 hr increments grouped by shift
VariableType of
Operation Day Evening Night Overall
Workloadb Freight 26.4 42.39 50.05 38.83Passenger 40.40* 44.38 43.34 42.06
Stressb Freight 17.32 23.43 38.71 25.97Passenger 25.42* 26.81 31.09 27.35
Fatigueb Freight 14.75 15.06 26.05 18.33Passenger 24.16* 20.75 32.80 25.32*
Workload 2h Freight 35.88 43.62 43.15 40.54Passenger 52.67* 55.27 33.20 48.71*
Stress 2h Freight 28.97 30.72 37.27 32.03Passenger 38.38 28.03 28.03 33.38
Fatigue 2h Freight 18.57 17.71 33.27 22.68Passenger 32.85* 20.97 38.31 30.87*
Workload 4h Freight 41.23 44.04 43.95* 42.89Passenger 53.52* 47.08 23.43 45.01
Stress 4h Freight 36.90 31.47 36.62* 34.97Passenger 40.20 29.60 23.2 33.77
Fatigue 4h Freight 25.79 21.90 39.87 28.65Passenger 37.78* 24.57 42.51 35.56*
Workload 6h Freight 40.76 37.33 44.38* 40.57Passenger 46.69 47.95 32.91 43.59
Stress 6h Freight 37.75 31.31 38.93* 35.92Passenger 36.48 29.92 26.94 32.51
Fatigue 6h Freight 30.43 26.37 44.38 33.26Passenger 40.84* 28.70 48.16 40.78*
Workload 8h Freight 41.90 39.97 46.73 42.58Passenger 45.84 48.22 45.03 46.17
Stress 8h Freight 42.14 32.72 41.71 38.71Passenger 37.57 34.75 40.25 37.40
Fatigue 8h Freight 35.40 30.10 45.12 36.47Passenger 43.55 37.25 53.34 44.01*
Overall Freight 37.19 41.15 45.68*Workload Passenger 47.81* 48.58* 34.91
Overall Freight 32.53 29.96 38.64*Stress Passenger 35.66 29.79 29.34
Overall Freight 24.91 22.26 37.64Fatigue Passenger 36.27* 26.42 42.06____________*Indicates p<0.01 level of significance on an independent sample t-test.

186
Table E-3. Post hoc (Tukey HSD) comparisons by shift for each variable by study site
Type ofOperation Variable Day versus Evening Evening versus Night Night versus Day
Freight Workload 0h p=0.001 Ns p<0.001Stress 0h Ns p<0.001 p<0.001Fatigue 0h Ns p<0.001 p<0.001
Passenger Workload 0h Ns Ns NsStress 0h Ns Ns NsFatigue 0h Ns Ns Ns
Freight Workload 2h Ns Ns NsStress 2h Ns Ns NsFatigue 2h Ns p<0.001 p<0.001
Passenger Workload 2h Ns p=0.002 p=0.003Stress 2h Ns Ns NsFatigue 2h p=0.034 p=0.010 Ns
Freight Workload 4h Ns Ns NsStress 4h Ns Ns NsFatigue 4h Ns p<0.001 p<0.001
Passenger Workload 4h Ns p<0.001 p<0.001Stress 4h Ns Ns p=0.001Fatigue 4h p=0.016 p=0.005 Ns
Freight Workload 6h Ns Ns NsStress 6h Ns Ns NsFatigue 6h Ns p<0.001 p=0.002
Passenger Workload 6h Ns p=0.038 p=0.033Stress 6h Ns Ns NsFatigue 6h Ns p=0.003 Ns
Freight Workload 8h Ns Ns NsStress 8h Ns Ns NsFatigue 8h Ns p=0.010 Ns
Passenger Workload 8h Ns Ns NsStress 8h Ns Ns NsFatigue 8h p=0.027 p=0.047 Ns

187
Table E-4. Pearson correlations between subjective workload, stress and fatigue andreported workload by shift and hours into duty
Number of Trains by Number of Track Users bySite Shift Workload Stress Fatigue Workload Stress Fatigue
Freight Day 0.556* 0.407* 0.228 0.392* 0.364* 0.1532 hr Evening 0.554* 0.547* 0.201 0.254* 0.296* 0.188
Night 0.606* 0.644* 0.299* 0.169 -0.019 -0.226
Passenger Day 0.589* 0.281* 0.072 0.032 -0.111 -0.1222 hr Evening 0.642* 0.367* 0.272 -0.120 -0.009 -0.044
Night 0.471* 0.322 0.120 0.471* 0.367* 0.101
Freight Day 0.438* 0.255* 0.166 0.448* 0.379* 0.283*4 hr Evening 0.528* 0.502* 0.323* 0.395* 0.453* 0.318*
Night 0.562* 0.585* 0.146 0.325* 0.483* 0.104
Passenger Day 0.223* 0.039 0.098 0.202 0.008 -0.0674 hr Evening 0.374* 0.165 0.224 0.292 0.262 0.380*
Night 0.409* 0.283 0.171 0.615* 0.604* 0.269
Freight Day 0.463* 0.228 0.097 0.520* 0.396* 0.286*6 hr Evening 0.481* 0.530* 0.435* 0.111 0.095 -0.068
Night 0.492* 0.353* 0.300* 0.344* 0.590* 0.004
Passenger Day 0.185 0.057 0.057 0.017 -0.002 -0.1216 hr Evening 0.451* 0.269 0.268 0.558* 0.553* 0.476*
Night 0.494* 0.428* 0.282 0.372* 0.291 0.097
Freight Day 0.440* 0.336* 0.267* 0.474* 0.450* 0.395*8 hr Evening 0.534* 0.501* 0.358* 0.177 0.352* 0.143
Night 0.648* 0.525* 0.096 0.115 0.108 0.014
Passenger Day 0.361* 0.265* 0.160 -0.055 -0.062 -0.1318 hr Evening 0.320 0.225 0.384* 0.266 0.361* 0.291
Night 0.653* 0.662* 0.347 -0.060 0.009 -0.253
____________*Indicates significance level of p<01.