A Policy Framework for Baseline Data Collection · PDF file01.12.2006 · California...
65
California Marine Life Protection Act Initiative A Policy Framework for Baseline Data Collection December 1, 2006 This document is complementary to the MLPA Initiative document, Baseline Data Collection Programs Tables. Both documents were prepared by MLPA Initiative staff with the assistance and advice of the MLPA Baseline Science- Management Panel, a group of 11 scientists with experience and knowledge of marine protected areas assessment. Comments are welcome on these proposed baseline data collection programs, and suggestions for additional programs or different approaches to this need, at [email protected]
Transcript of A Policy Framework for Baseline Data Collection · PDF file01.12.2006 · California...

California Marine Life Protection Act Initiative
A Policy Framework for Baseline Data Collection
December 1, 2006
This document is complementary to the MLPA Initiative document, Baseline Data Collection Programs Tables. Both documents were prepared by MLPA Initiative staff with the
assistance and advice of the MLPA Baseline Science-Management Panel, a group of 11 scientists with experience
and knowledge of marine protected areas assessment.
Comments are welcome on these proposed baseline data collection programs, and suggestions for additional programs or different
approaches to this need, at [email protected]

Contents
Summary ....................................................................................................................................1 Overarching Structure for Baseline Data Collection ...................................................................2
Baseline Data Collection Program Criteria..............................................................................2 Tiered Structure ......................................................................................................................2
Cross-Cutting Themes................................................................................................................5 Relation to Ongoing and Previous Monitoring.........................................................................5 Relation to Long-Term Monitoring...........................................................................................5 Issues of Scale........................................................................................................................6 Sampling Design.....................................................................................................................6 Evaluation of MPA Impacts .....................................................................................................7 Use of Data .............................................................................................................................8 Prioritization Criteria................................................................................................................8 Habitat Mapping....................................................................................................................11 Socioeconomic Mapping.......................................................................................................12 Policy and Budget Context for Program Cost Estimates.......................................................12 Considerations for Policy-Makers in RFP Process................................................................13
Appendix I: Tiers 1, 2, and 3: Goals, Goal Components, and Overarching Questions .............15
Appendix II: BACI and Multivariate Designs .............................................................................19
Appendix III: Glossary ..............................................................................................................22

California MLPA Initiative – A Framework for Baseline Data Collection Page ii
Acknowledgments This document was prepared by MLPA Initiative staff with the assistance and advice of the MLPA Baseline Science-Management Panel:
Dr. Mary Bergen, consultant Dr. Mark Carr, Associate Professor, Department of Ecology and Evolutionary Biology,
University of California, Santa Cruz Dr. Elizabeth Chornesky, consultant Dr. Christopher Costello, Associate Professor, Donald Bren School of Environmental
Science & Management, University of California, Santa Barbara Dr. Steve Gaines, Director, Marine Science Institute, University of California, Santa
Barbara Dr. Mark Hixon, Professor of Marine Ecology and Conservation Biology, Department of
Zoology, Oregon State University Mr. Christopher LaFranchi, Coordinator, Spatial Assessment and Analysis of Non-
Consumptive Uses in California's Marine Sanctuaries Dr. Caroline Pomeroy, Marine Advisor, Santa Cruz County, California Sea Grant
Extension Program Dr. Jim Sanchirico, Natural Resource Economist, Resources for the Future Dr. Rick Starr, Marine Advisor, Monterey and Santa Cruz Counties, California Sea
Grant Extension Program Ms. Mary Yoklavich, Habitat Ecology Team Leader, NOAA Fisheries, Southwest
Fisheries Science Center Sincere thanks to this group of scientists with experience and knowledge of marine protected areas assessment for their dedication to this project.

Summary In June 2006 the California Marine Life Protection Act (MLPA) Initiative convened the Baseline Science-Management Panel (BSMP), an ad hoc group of scientists expert in marine protected areas (MPA) assessment. Over the past six months, the BSMP and initiative staff have worked to prioritize baseline data collection needs1 for the MLPA Central Coast Study Region in relation to the goals of the MLPA. The objective of this group was to develop a prioritized list of baseline data collection programs that would help address key management questions. The focus of the effort was on baseline data collection in the near-term (i.e., before and concurrent with establishing MPAs) as opposed to long-term monitoring in general. In response to this charter, the MLPA Initiative staff, in collaboration with the BSMP, produced two "working" reports:
1. The Baseline Data Collection Framework (this document). The Baseline Data Collection Framework (BDC Framework) sets forth an overarching management structure for collecting baseline data concurrent with implementing MPAs in the MLPA Central Coast Study Region.
2. The Baseline Data Collection Programs Tables (attached). The Baseline Data
Collection Programs Tables consists of six tables that describe, budget, and prioritize baseline data collection programs in the context of the BDC Framework and the package of MPAs that the California Fish and Game Commission selected at its August 15, 2006 meeting as its preferred alternative. The tables also include an overview of Central Coast MPAs; describe current and previous relevant research; present a list of focal species; and include other information that will be helpful in establishing baseline data collection programs.
The BDC Framework and tables are characterized as "working" reports because:
• The reports do not identify exact locations, sampling methods, and sampling frequencies for baseline data collection. It is expected that this information will be developed during a request for proposals (RFP) process.
• The budget estimates assume standard methods of data collection. As with any
scientific endeavor, it is possible that new techniques will emerge that would lower or raise the costs.
• The reports describe both biophysical and socioeconomic data collection programs and
prioritize programs within each of these broad categories. However, there is no attempt to prioritize between biophysical and socioeconomic data collection; this as a policy decision, not a scientific one.
• Likewise, within the socioeconomic programs, data collection programs were identified
for three distinct user groups — commercial consumptive, recreational consumptive,
1 In the context of the reports, "baseline data collection" is defined as an initial set of data collected before and concurrent with implementation of MPAs.

California MLPA Initiative – A Framework for Baseline Data Collection Page 2 of 25
and non-consumptive — but there was no attempt to prioritize among them since this, too, was understood to be a policy decision. The reports identify other important policy-level decisions that need to be made as well.
Overarching Structure for Baseline Data Collection
Baseline Data Collection Program Criteria Baseline data collection programs comprise a core set of biophysical and socioeconomic variables that fulfill three criteria:
1. The data will be useful for evaluating performance of MPAs relative to various goals
(i.e., statewide goals, MLPA Central Coast Study Region goals, and MPA-specific goals);
2. The data are likely to be sensitive to the changed management status of the MPAs following designation; and
3. Practical, scientifically valid methods exist for collecting the data.
In addition to having to meet these criteria, each recommended program is ranked on the extent to which it fills an important gap in existing data collection activities (see “Prioritization” section below).
Tiered Structure An overarching structure was created to inform the selection and design of the baseline data collection programs. The overarching structure, shown in figures 1 and 2, has five tiers:
• The top tier includes the five regional goals for the central coast that relate to baseline data collection, which are based on the text of the MLPA. It also includes additional goals deemed by Department of Fish and Game (DFG) staff to be relevant to the effective implementation of MPAs (all of these goals are listed in Appendix I and referenced in the Baseline Data Collection Programs Tables, see Table B).
• The second tier breaks the regional goals and other MPA goals into distinct components and converts them into questions. Language consistent with the goals is used whenever possible (goal components are listed in Appendix I and the Baseline Data Collection Programs Tables - see Table B, second column).
• The third tier identifies overarching questions necessary to address each goal component. This tier was developed in consultation with the BSMP and includes questions that further focus the goal components in tier two (overarching questions are listed in Appendix I and the Baseline Data Collection Programs Tables - see Table B, third column).
• The fourth tier outlines more specific, key MPA management questions identified by DFG and MLPA Initiative staff, and links them to overarching questions in tier three (management questions are listed in the Baseline Data Collection Programs Tables - see Table B, fourth column).

California MLPA Initiative – A Framework for Baseline Data Collection Page 3 of 25
• The fifth tier outlines specific baseline data collection programs that address key management questions in tier four. The program descriptions provide general guidelines for how actual baseline data collection should occur. It is expected that more detailed information for each program will be developed during an RFP process (data collection programs are described in the Baseline Data Collection Programs Tables – see Table A).
Multiple management questions from the fourth tier may require the same kind of data described in the fifth tier. As a result, one kind of data gathered may be analyzed in multiple ways to address multiple management questions. Over time, some of the questions posed by managers and policy-makers may change, as may the analytical methods used to assemble data and convert these data into usable knowledge. The identified baseline data collection programs were selected to be robust; that is, it is anticipated that these data will be relevant to future questions and analytical approaches. The overarching questions in tier three are relatively broad and intended to serve as a general framework for organizing the scientific work. Thus, the baseline data collection programs do not fully address any of these questions, nor do they address all of the questions. Rather, the data collection programs target key management questions and focus on the most urgently needed scientific data. The first, second, and third tiers of this overarching structure are described in Appendix I. More detailed information included in the fourth and fifth tier is provided in the separate Baseline Data Collection Programs Tables. Some issues are important to consider in framing all baseline data collection programs as they inform the overall design of the data collection activities and the analysis and interpretation of the results. These issues are identified in the next section of this document entitled “cross-cutting themes.”

Figure 1: Structural Tiers
Baseline Data Collection Programs
Management Questions Identified by Policy Makers
Overarching Questions Specific to Each Goal Component
Key Components of Goals of MLPA and Related MPA Goals
MLPA Goals
Q2Q1Q2Q1Q2Q1Q2Q1
M1 M2 M3 M4 M5 M6 M7 M8 M9
D1 D2 D3 D4 D5 D6 D7
M10
Q2 Q1
Goal Comp. 2b ….cont. Goal Comp. 2a Goal Comp. 1b Goal Comp. 1a
MLPA Goals
Figure 2: Layout of Structural Tiers
California MLPA Initiative – A Framework for Baseline Data Collection Page 4 of 25

Cross-Cutting Themes
Relation to Ongoing and Previous Monitoring In defining and prioritizing new baseline data collection programs, we considered previous and ongoing monitoring programs (some described in the Baseline Data Collection Programs Tables). Whenever possible, we sought to make use of existing data sets to establish a baseline.
Relation to Long-Term Monitoring We focused on describing new baseline data collection programs, rather than long-term monitoring programs, understanding that baseline data programs will make a critical contribution to long-term monitoring. However, baseline data programs do not address the full set of monitoring needs for MPAs because other important monitoring needs exist that do not fulfill the three criteria we used. For example, methods will need to be developed and tested for monitoring values that the MPAs seek to support, such as ecosystem function and integrity and network properties. Although much is known in these areas, and potential methods exist, in some cases development of scientifically valid operational methods will require further research. In addition, several of the goals and objectives developed for the MLPA Central Coast Study Region address issues of institutional function and accountability (e.g., Goal 3, Objective 3; Goal 5, objectives 2 and 3; Goal 6, objectives 1 and 2). While tracking such aspects of institutional performance will need to be a part of the MLPA monitoring approach,2 in practical terms, because the starting place is zero, no baseline information regarding these goals and objectives will need to be gathered concurrent with the MPAs’ designation. Consistent with the MLPA Master Plan Framework1 and the MLPA Initiative Adaptive Management, Monitoring and Evaluation Framework,3 a long-term monitoring plan is being developed. This plan will:
• Specify the relationships among MPA goals, objectives, questions, and Data Collection;
• Present provisional guidance and benchmarks for interpreting the resulting data; • Describe sampling designs; • Provide for data quality control and long-term data archiving, management, and
access;
2 See: California Department of Fish and Game. August 22, 2005. Marine Life Protection Act, Master Plan Framework, p. 74. Available at http://www.dfg.ca.gov/MRD/mlpa/pdfs/mpf082205.pdf 3 See: MLPA Initiative. May 26, 2006.. Adaptive Management, Monitoring and Evaluation Framework.
California MLPA Initiative – A Framework for Baseline Data Collection Page 5 of 25

• Consider how the data will be integrated into adaptive management decision, identify audiences, and provide for the analysis and communication of results;
• Integrate peer and expert review processes to ensure scientific credibility; and • Present an organized work plan for organizing and implementing these various
monitoring activities.
Issues of Scale The focus of this report is on baseline data collection and sampling design within the MLPA Central Coast Study Region that helps elucidate the condition and performance of ecosystems in MPAs and on how people use and derive value from them. In many cases baseline data may need to be collected outside of the MPAs to reveal, for example, the condition of protected populations and habitats relative to unprotected ones or how the protected ecosystems affect socioeconomic conditions in nearby coastal communities. The baseline data collection programs descriptions take into account important temporal and spatial patterns that influence the sampled variables; they also aim to enable analyses of the data in order to evaluate performance relative to goals and objectives for both the region and individual MPAs. For the region, it should be possible to make comparisons among MPAs having different designations (i.e., state marine conservation areas, state marine reserves) by comparing baseline and long-term data sets. However, not all variables will be sampled at each MPA because goals and objectives vary among the individual MPAs.
Sampling Design The Baseline Data Collection Programs Tables outlines general programs for collecting baseline data. However, it does not describe specific methods of sampling design. Sampling design, including identification and selection of control sites and considerations for size, location, and contiguity of habitats should be coordinated and standardized. it is recommended that a working group be convened as part of any RFP process so that an overarching design informs and creates consistency among the various sampling schemes. This overarching design should be consistent with the approach adopted in the initial central coast monitoring plan. Potential discussion topics for such a group may include the following:
1. Determining what constitutes an appropriate control or reference site. - What are the criteria for a control or reference site? - What are appropriate control or reference sites for the central coast
MPAs?
2. Discussing other considerations affecting sampling design. - What size of habitat is appropriate for a sampling program (minimum
patch size)?
California MLPA Initiative – A Framework for Baseline Data Collection Page 6 of 25

- How does location of a habitat within an MPA affect the sampling program?
- How does contiguity of habitats within and outside of MPAs affect sampling design?
- How does spatial organization of human activities, on and off the water, affect sampling design?
3. Discussing the desirability and overall approach for a before-after control-impact
(BACI) or multivariate design as data from these baseline surveys will likely be compared with data gathered during a long-term monitoring effort (see Appendix II for issues to be considered in such designs).
Evaluation of MPA Impacts Discriminating cause and effect between the MPAs’ designation and specific biophysical and socioeconomic changes by comparing baseline and long-term monitoring data will be scientifically challenging. Multiple factors will affect human uses, the status of nearby coastal communities, and the condition of ecosystems within the MPAs. Some changes may occur very slowly. Seemingly contradictory or temporary trends may well emerge, especially over the short-term. While this issue will be more fully addressed by future policy-makers, it has important implications for baseline data collection. Consideration should be given to which data collected are intended to specifically evaluate the effects of MPA designation versus those intended to track the status and trends of the MPAs’ valued ecosystems, species, and human uses. The design of sampling protocols for the former will need to make it possible to discriminate among various possible causal factors. For example, the entire ocean system is changing directionally, often in unknown ways, as the result of global warming. Thus, discerning the effects of MPAs will require not only monitoring control (or reference) areas outside the MPAs, but also statistical designs that will reveal the differences between MPAs and control areas as all sites change through time. Water quality within and outside of MPAs is one important factor that should be considered in evaluating the impacts of MPA designation. Though data collection regarding water quality was considered to be outside of the scope of this report, water quality information will certainly help to separate MPA effects from other causal factors. Water quality data gathered inside and adjacent to MPAs will be particularly useful. Existing regulatory measures, including state and federal fisheries management, should also be considered when evaluating the impact of MPAs. The biophysical and socioeconomic effects of spatial closures, such as rockfish conservation areas and essential fish habitat, as well as gear and seasonal closures, will be important to recognize as they may confound analyses of MPA effectiveness.
California MLPA Initiative – A Framework for Baseline Data Collection Page 7 of 25

Use of Data Policy-makers will use data from baseline data collection programs and from long-term monitoring programs to inform a variety of decisions relating to and affecting MPAs. These decisions will be made as part of the adaptive management process as MPAs are managed to meet the goals of the MLPA. These management decisions can be broken into five major categories:
1. Addition and removal of MPAs; 2. Changes in designation and allowable activities within existing MPAs; 3. Changes to boundaries of existing MPAs; 4. Changes in how existing MPAs are managed (e.g. enforcement measures); 5. Changes in other policies and management measures that affect ecosystems
within existing MPAs (e.g. water quality management, fisheries management) Once collected, the data will need to be appropriately compiled and analyzed so that they are useful in answering key management questions and informing adaptive management of MPAs. During the RFP process for data collection projects, contractors should be required to identify what analytical frameworks, data analysis and synthesis will be used to address specific MPA goals and management questions.
Prioritization Criteria Prioritization of baseline data collection programs is different from the prioritization of ongoing monitoring programs. Ongoing monitoring programs assess long-term changes in the status of protected ecosystems and effects of MPA designations. Baseline data collection programs, on the other hand, must fill critical near-term data gaps before and as MPAs are established, particularly if BACI studies are employed. For this reason, certain topics are omitted from the recommended baseline data collection programs. For example, Goal 6 of the MLPA speaks to the functioning of the statewide MPA network. This might be addressed through long-term monitoring or research on connectivity or larval dynamics. Similarly, the recommended baseline programs do not include habitat mapping (Goal 4 of the MLPA), although accurate habitat maps will be useful for the creation of effective baseline surveys and ongoing monitoring programs (see also “Habitat Mapping” section below). Factors considered in designing and prioritizing baseline data collection programs included relevant existing data sets, ease and cost of data collection, usefulness of data in the adaptive management process, and how data might inform specific management decisions. Also considered was the extent to which data collection programs fulfilled the three criteria listed under “Overarching Structure.” For the biophysical baseline data collection programs, deep rock habitat surveys is identified as the top priority because only a small amount of data exists for this habitat, yet it is critical to several focal species. Kelp-forest surveys are ranked second because
California MLPA Initiative – A Framework for Baseline Data Collection Page 8 of 25

this habitat is important to many focal species and with focused data collection it will be relatively easy to create a complete data set. Since MPAs are expected to have the greatest impact on benthic species and habitats, these are the focus of most programs. Data for some programs, such as surveys of soft-bottom habitat, will likely be collected by deep rock and kelp forest data collection programs due to the intermixed nature of hard and soft bottom substrates on the central coast. Human-use baseline data collection programs are prioritized within three separate user categories: non-consumptive, consumptive recreational, and consumptive commercial. Within each of these three groups, data collection programs are prioritized based on usefulness in addressing the goals of the MLPA, ease of data collection, and other factors. Data collection among non-consumptive user-groups is prioritized in a limited fashion, recommending that effort and welfare data for SCUBA divers be of high priority4, but recognizing that prioritization of data for other non-consumptive user-groups is largely a policy decision. Scientists may inform such a decision by providing better characterizations of user-groups and information on how multiple groups might be sampled in an integrated effort. Policy-makers should also consider inclusion of stakeholder input. Analyses of existing recreational and commercial fishing data sets were conducted in order to identify critical data gaps and explore how existing data sets might be better utilized. Extension and better use of the California Recreational Fisheries Survey (CRFS) data is ranked high for recreational fisheries, while collection of fine-scale spatial harvest and effort data is ranked high for commercial fisheries. Prioritizing among these three human-use data categories was determined to be a policy decision rather than a scientific judgment. Policy-makers may want to consider several criteria in this regard. One possible criterion is the expected direct impact of MPAs (positive or negative) on the welfare of a user group. Another is the completeness of existing data sets for each group. A third possible criterion is the equitable distribution of research funds among the three groups. Each of these criteria suggests a different prioritization for funding baseline research. For instance, based on data availability, one might fund data collection on non-consumptive, then consumptive recreational, and finally consumptive commercial users. It should be noted that data on all three of these groups would help elucidate socioeconomic tradeoffs, assess socioeconomic impacts and attempt to “minimize negative socioeconomic impacts and optimize positive socioeconomic impacts for all users, to the extent possible” (Central Coast Regional Goals and Objectives, Goal 5, Objective 1). Policy-makers for the central coast might consider how funding for research and monitoring activities in the Channel Islands was prioritized across user-groups, where the following four criteria were applied:
1. Fund at least one project per user group (to the extent financially feasible).
4 Effort and welfare associated with SCUBA diving can be directly correlated with biophysical conditions in the marine environment because of divers’ direct contact with and/or exposure to protected and unprotected underwater environments.
California MLPA Initiative – A Framework for Baseline Data Collection Page 9 of 25

2. Give higher priority to groups with little or no existing data (e.g., non-consumptive users).
3. Give higher priority to groups impacted by no-take marine reserves (e.g., consumptive users).
4. Prioritize according to issues, not funds (i.e., work toward equity in relation to how well existing data and analysis can inform highly prioritized issues, not according to funds allocated by the CINMS Social Science Program).5
Collection of socioeconomic baseline data for coastal communities in the central coast was determined to be important for understanding the broad effects of MPAs. However, given limited funds, these data were considered to be a lower priority than data on direct consumptive and non-consumptive users. Also considered for this report were the monitoring design principles identified by the California Ocean Protection Council (OPC)6 for creating baseline data collection programs. In keeping with the emerging OPC approach, data collected with funding through any baseline RFP should be delivered to the state entity charged with developing, managing, and reporting MPA monitoring data. These design principles are: Supporting Ecosystem-Based Management (EBM) and Adaptive Management. Ocean and coastal monitoring programs should be based on EBM and adaptive management principles and should be designed to apply new scientific knowledge and changing parameters to management and conservation of coastal and ocean resources by making it possible to do the following: (1) evaluate impacts of specific management choices, (2) build knowledge about managed ecosystems and thereby improve future management decisions, (3) identify emerging threats, and (4) determine the extent to which the ecological and/or socioeconomic management goals for the ecosystem are being met. Integration with Existing Statewide Monitoring Programs and Ocean Observing Systems. Ocean and coastal monitoring programs should be designed to leverage and integrate with existing statewide monitoring programs as part of the state’s ocean observing program. This program should be created in cooperation with Ocean Science Applications to assure coordination with developing observing efforts. The program should consider existing protocols for data collection in nearshore environments, particularly the Cooperative Resource Assessment of Nearshore Ecosystems (CRANE) protocol developed jointly by DFG and various universities and other researchers. The program should also conform to data management and communication standards adopted by the national Integrated Ocean Observing System and to statewide marine mapping standards established at the OPC-supported December 2005 Statewide Marine Mapping Planning Workshop.
5 Stated differently, policy-makers should consider how effectively distributed funds will be used to gather useful information that will inform decisions on key issues for different user-groups.
6 Memorandum to the California Ocean Protection Council from Sam Schuchat and Marina Cazorla, Consideration of Adoption of MPA monitoring program design principles, June 8t, 2006.
California MLPA Initiative – A Framework for Baseline Data Collection Page 10 of 25

Monitoring System Institutional Functions. Ocean and coastal monitoring programs should be designed to perform the following functions:
1. Leadership and Coordination: This function includes coordination and management of monitoring activities; ensuring that monitoring priorities are responsive to the needs of decision-makers, stakeholders, and other key audiences; maintenance of relationships with partner institutions; coordination of funding for monitoring; and integration of monitoring data with other relevant data, observations and maps.
2. Science: This function includes facilitation of the development of monitoring plans and related scientific models, indicators and protocols; ensuring that quality control procedures are implemented; and analysis and interpretation of monitoring information.
3. Information Technology and Data Management: This function includes development and maintenance of databases and web-based information systems that provide for long-term data archiving; provision of access to data through search and assembly of data; and provision of links to related systems and users.
4. Communication: This function includes provision of an interface for decision-makers, stakeholders, and the public with monitoring activities and results; identification of audiences and development of appropriate online and printed information products and reports; and implementing structured processes to deliver results to decision-makers and to facilitate public comment where appropriate.
Credibility and Accessibility. Ocean and coastal monitoring programs should create value and impact by directly linking monitoring to resource decision-making and ensuring that the data are highly credible. The system should begin with an integrated information system and maximize data access, analysis, and reporting in order to support public processes. Longevity and Agility. Ocean and coastal monitoring programs should be designed to ensure longevity by formalizing accountability of the participants and by developing sustained funding streams. Programs should be endowed with adequate dedicated capacity and institutional autonomy, in order to retain agility and the ability to anticipate and plan for change.
Habitat Mapping Although habitat mapping was not included in the scope of this analysis, accurate habitat maps are valuable for designing effective baseline surveys and ongoing monitoring as they improve sampling efficiency and thereby reduce costs. Adequate substrate maps do exist for the MLPA Central Coast Study Region, with the exception of a few key areas along the Big Sur coast. In consultation with other marine scientists,
California MLPA Initiative – A Framework for Baseline Data Collection Page 11 of 25

this report recommends that the following sites be considered for additional mapping to better inform baseline survey and ongoing monitoring design:
• Big Creek SMR7 and SMCA and suitable control sites in depths greater than approximately 150 meters (approx 20 sq. mi.)
• Piedras Blancas SMR and SMCA and suitable control sites between Point Piedras Blancas and Point Estero (approx 20 sq. mi.).
• Point Buchon SMR and SMCA and suitable control sites between Point Buchon and Point Avila (approx 20 sq. mi.).
The additional mapping described above would be conducted using multibeam acoustic surveys at a conservative vessel speed (less than 6 knots) and sonar swath coverage (2.5X water depth). Those implementing such a mapping effort should consider line-spacing at wider-than-optimal intervals and focus on discerning interfaces of rock outcrops and surrounding sand. The rough estimated cost for this mapping effort is $75,000 to $100,000 and is contingent upon ship and gear availability.
Socioeconomic Mapping Althoughbaseline socioeconomic data on coastal communities is not recommended as a priority, accurate information on marine-dependent infrastructure and key socioeconomic linkages among those communities and the resource users that are the focus of the recommended baseline research is essential to informing the question: What are the socioeconomic impacts of the MLPA on coastal communities? (related MPA goal R1, overarching question 4 in Appendix I) Mapping of these socioeconomic attributes could be done using rapid assessment process research focused on the major coastal ports and a sample of non-port coastal access sites. The estimated cost for this effort is $150,000 to $300,000.
Policy and Budget Context for Program Cost Estimates The cost of each baseline data collection program is estimated, taking into account the following factors:
• Priority of the program in relation to the MLPA goals (see discussion above) • Minimum threshold for achieving a credible data set • Existence of complementary data collection activities • Overall budget of $4 million
Minimum Threshold. In practice some programs become ineffective below a minimum threshold level. For example, the top recommended biophysical baseline program, deep rock habitat surveys, will likely require access to research vessels and remotely operated vehicles. There is a significant minimum funding threshold needed to
7 state marine reserve (SMR) and state marine conservation area (SMCA)
California MLPA Initiative – A Framework for Baseline Data Collection Page 12 of 25

undertake this work in a manner that will enable the deepwater portions of all MPAs to be adequately surveyed. In addition, some portion of these research costs may depend on the availability of leveraged funds, as described in the section entitled "creating funding efficiencies," below. Ongoing Research. In some instances, presently existing research efforts in the region could satisfy some of the need for baseline data. Therefore, the recommended baseline data collection programs are designed to compliment this ongoing research. Baseline surveys of kelp forest and shallow rocky reef habitats, for example, could be coordinated with existing and recent monitoring by the existing Partnership for Interdisciplinary Study of Coastal Oceans (PISCO) subtidal program and the recent Cooperative Research and Assessment of Nearshore Ecosystems (CRANE) program. Baseline data collection for recreational consumptive human-use activities, on the other hand, could be coordinated with the existing California Recreational Fisheries Survey (CRFS) program. These existing and recent programs were taken into account when developing budget estimates for future baseline data collection programs and suggested incremental funds to develop more complete datasets, rather than full funding for a new data collection activity. Funding Scalability. It is recommended that critical baseline data be collected for all MPAs within the MLPA Central Coast Study Region, as these data can only be collected prior to or shortly after MPA implementation and will be necessary for effective evaluation of MPA performance. However, adequate funding may not be available to establish equivalent baseline data sets for all MPAs in the central coast. In the event that sufficient funding cannot be secured, some baseline data collection programs may be implemented in fewer MPAs than suggested in this document, recognizing that scaling back programs in this manner may reduce the geographic scope and statistical power of the data. Overall Budget. Since an overall budget for baseline data collection was not available in preparing this report, a hypothetical $4 million budget was equally divided between biophysical and human-use baseline data collection programs. While estimated costs may differ from actual program costs, they provide useful guidance to the relative importance of each data collection program.
Considerations for Policy-Makers in RFP Process Differential Time and Funding Requirements. The baseline data collection programs outlined in this document provide guidelines for any RFP process. Specific details of these programs, especially time and funding requirements, will likely differ among RFP applicants. For example, applicants may have varying access to leveraged funds (equipment, salaries, etc.) and may have different sampling designs that require varying amounts of time and money. For this reason, policy-makers should consider the program details outlined in this document as a useful guide for evaluating RFP proposals, rather than a prescription for how baseline data collection efforts should be designed.
California MLPA Initiative – A Framework for Baseline Data Collection Page 13 of 25

Budget and Budget Allocations. Establishing a budget for baseline data collection is a critical first step in rolling-out any RFP process. Along with the considerations below, a budget will enable policy makers to re-prioritize, expand or cutback the baseline programs identified in this report and the tables. The allocation of a budget between biophysical baseline data collection and human use baseline data collection is another critical policy decision. While the BSMP split funds equally between the two subgroups, policy-makers may choose a different allocation. On the one hand, the goals of MLPA largely address ecosystem health, structure, and function as well as protection and enhancement of marine life populations and habitats. On the other hand, the successful implementation of the MLPA depends on developing better understanding and monitoring of human-use patterns. There is also a strong political impetus for monitoring human-uses and assessing socioeconomic impacts8. Creating Funding Efficiencies. The cost estimates provided in this document are approximate and, in some cases, assume the use of leveraged funds9. These supplemental funds may be provided by public or private sources and may contribute to baseline data collection by providing incremental funds necessary to achieve a particular baseline program or by providing new funds to support additional baseline priorities. In the Baseline Data Collection Programs Tables, programs with cost estimates that do not represent the total actual cost of baseline data collection have been identified and approximate total cost figures have been provided. Funding efficiencies should be pursued by incorporating existing data collection programs and leveraging outside funding, but it is not recommend that a fixed threshold for matching funds be defined in an RFP process. Requiring RFP applicants to provide matching funds may not only unnecessarily limit the pool of applicants, but may also jeopardize the success of baseline data collection programs by creating an unachievable requirement for RFP application.
8 For instance, if there are socioeconomic benefits to stakeholders promised or expected, a baseline should be established to support the determination of whether these benefits are realized. A socio-economic baseline is also critical for determining quickly whether there are unintended consequences (positive or negative) of MPA implementation, especially so that negative – and potentially costly – consequences can be averted or minimized.
9 The terms “leveraged funds” and “matching funds” are defined in the glossary, Appendix III.
California MLPA Initiative – A Framework for Baseline Data Collection Page 14 of 25

Appendix I: Tiers 1, 2, and 3: Goals, Goal Components, and Overarching Questions Goal 1. To protect the natural diversity and abundance of marine life, and the structure, function, and integrity of marine ecosystems. G1a: Did the MLPA protect the natural diversity and abundance of marine life? Overarching Questions 1) What is the natural (current) diversity and abundance of marine life and how does it
change through time within and outside of MPAs? 2) How do human activities affect the natural diversity and abundance of marine life
and how do these activities and effects change through time within and outside of MPAs?
G1b: Did the MLPA protect the structure, function, and integrity of marine ecosystems? Overarching Questions 1) What are the structure, function, and integrity of marine ecosystems and how do
they change through time within and outside of MPAs? 2) How do human activities affect the structure, function, and integrity of marine
ecosystems and how do these activities and effects change through time as a result of MPAs?
Goal 2. To help sustain, conserve, and protect marine life populations, including those of economic value, and rebuild those that are depleted. G2a: Did the MLPA help to sustain, conserve, and protect harvested marine life populations? Overarching Questions 1) How does the establishment of MPAs affect populations of harvested marine
species and how do these effects change through time? 2) How do human activities affect these populations and how do these activities and
effects change through time as a result of MPAs? G2b: Did the MLPA help to sustain, conserve, and protect non-harvested marine life populations? Overarching Questions 1) How does the establishment of MPAs affect populations of non-harvested marine
species and how do these effects change through time? 2) How do human activities affect these populations and how do these activities and
effects change through time as a result of MPAs?
California MLPA Initiative – A Framework for Baseline Data Collection Page 15 of 25

G2c: Did the MLPA help to rebuild marine life populations that are depleted? Overarching Questions 1) How does the establishment of MPAs affect populations of depleted marine species
and how do these effects change through time? 2) How do the human activities that affect rebuilding potential of depleted marine
species change through time as a result of MPAs? Goal 3. To improve recreational, educational, and study opportunities provided by marine ecosystems that are subject to minimal human disturbances, and to manage these uses in a manner consistent with protecting biodiversity. G3a: Did the MLPA improve recreational opportunities provided by marine ecosystems that are subject to minimal human disturbances? Overarching Questions 1) How has the MLPA changed recreational opportunities and uses within undisturbed
marine ecosystems? 2) What are the effects of MPAs on the quality and quantity of non-consumptive
recreational uses and values? 3) What are the effects of MPAs on the quality and quantity of consumptive (consistent
with minimal human disturbance) recreational uses and values? G3b: Did the MLPA improve educational opportunities provided by marine ecosystems that are subject to minimal human disturbances? Overarching Questions 1) How has the MLPA changed educational uses and opportunities to study
undisturbed marine ecosystems? G3c: Did the MLPA improve study (research) opportunities provided by marine ecosystems that are subject to minimal human disturbances? Overarching Questions 1) How has the MLPA affected marine research within undisturbed marine
ecosystems? 2) How has the MLPA affected marine research as a whole by protecting undisturbed
marine ecosystems (e.g. as a control)? G3d: How do recreational, educational, and study activities affect biodiversity in MPAs? Overarching Questions 1) What are the spatial and temporal effects of recreational activities on biodiversity in
MPAs? 2) What are the spatial and temporal effects of educational activities on biodiversity in
MPAs?
California MLPA Initiative – A Framework for Baseline Data Collection Page 16 of 25

3) What are the spatial and temporal effects of research activities on biodiversity in MPAs?
Goal 4. To protect marine natural heritage, including protection of representative and unique marine life habitats in central California waters, for their intrinsic value. G4a: Did the MLPA protect cultural sites and geological features in central California waters? Overarching Questions 1) What are the cultural sites and geological features that can be protected by MPAs,
and what proportion of these are included within the MPA network? 2) How do human activities affect cultural sites and geological features and how do
these activities and effects change through time within and outside of MPAs? G4b: Did the MLPA protect representative marine life habitats in central California waters? Overarching Questions 1) What proportion of representative marine life habitats (defined in the MPF) was
actually included in the MPA network? 2) How do these habitats change over time inside and outside of MPAs? 3) How does the abundance of associated species change as a function of area of
habitats included in the MPA network? G4c: Did the MLPA protect unique marine life habitats in central California waters? Overarching Questions 1) What are the unique habitats within the central coast region? 2) What proportion of unique marine life habitats was actually included in the MPA
network? 3) How do these habitats change over time inside and outside of MPAs? 4) How does the abundance of associated species change as a function of area of
unique habitats included in the MPA network? Goal 5. To ensure that central California’s MPAs have clearly defined objectives, effective management measures, and adequate enforcement, and are based on sound scientific guidelines. Data collection to evaluate the implementation and effectiveness of management and enforcement measures should begin as MPAs are established, but will not be included in the baseline data collection programs designed by the MLPA Baseline Science-Management Panel.
California MLPA Initiative – A Framework for Baseline Data Collection Page 17 of 25

Goal 6. To ensure that the central coast’s MPAs are designed and managed, to the extent possible, as a component of a statewide network. G6: To what extent do MPAs created under the MLPA function as a network? Overarching Questions 1) How do different combinations of MPA size and spacing influence the amount of
time that individuals stay in MPAs and how does this influence larval supply? 2) How do different combinations of MPA size and spacing influence the larval
dispersal from one MPA to another in the network? 3) To what extent do MPAs within the network benefit from and contribute to
populations outside of the network? Additional Consideration: Assessing socioeconomic impacts R1: What are the socioeconomic impacts of the MLPA? Overarching Questions 1) What are the socioeconomic impacts of the MLPA on consumptive commercial
users? 2) What are the socioeconomic impacts of the MLPA on consumptive recreational
users? 3) What are the socioeconomic impacts of the MLPA on non-consumptive recreational
users? 4) What are the socioeconomic impacts of the MLPA on coastal communities?
California MLPA Initiative – A Framework for Baseline Data Collection Page 18 of 25

Appendix II: BACI and Multivariate Designs Data gathered using baseline surveys will likely be compared to long-term monitoring data to inform management decisions, as described above. The discussion of BACI and multivariate sampling designs below is included to demonstrate how baseline data may be used, so that baseline data collection programs can be efficiently designed. Before-After Control-Impact (BACI) Designs A BACI design may be set up with: 1) paired sites inside and outside of MPAs, 2) multiple sites within and without MPAs, 3) samples randomly distributed throughout an MPA and within comparable outside habitat, or 4) with samples randomly distributed throughout all MPAs and comparable outside habitat. The power of the BACI design in large part depends having appropriate reference sites and on sufficient temporal sampling to detect a trend. Paired sites A paired site design can be used to answer the question: Is there a change in an indicator (e.g., organism density and/or size) in one or more sites within MPAs over time relative to sites outside of MPAs? With this approach, one or more MPAs with high historical fishing pressure would be chosen, with the number of MPAs dependant on budget. Sites could be deliberately picked or randomly selected. Random samples would be distributed throughout the sites. Statistically this sampling design provides information about a site, but not the whole MPA. It will determine if there is any response at all, but will not provide information about the functioning of individual MPAs or multiple MPAs. However, if a number of MPAs are sampled and all show a response, it might be inferred that the larger system is also responding. This is a low cost alternative and the most likely to detect a difference if there is one. For shallow water hard bottom, it also has the advantage of being compatible with PISCO sampling. Multiple sites The multiple site design is similar to the paired site design except additional sites are sampled within and without MPAs. The sites could be deliberately or randomly chosen. The idea is to make the sampling more representative while constraining the variance associated with habitat variability. The sampling still has the disadvantage of not being representative of the MPA as a whole and costs increase with each additional sampling site. This design is compatible with PISCO sampling. Random sampling within and outside of an MPA
California MLPA Initiative – A Framework for Baseline Data Collection Page 19 of 25

Random sampling within and outside of an MPA can be used to answer the question: Is there a change in an indicator in an MPA over time? With this design, the samples are randomly distributed in all appropriate habitats within a MPA and in a comparable amount of habitat outside the MPA. This is the only design that provides information to statistically evaluate individual MPAs. If all MPAs are sampled, the data would be applicable to the network. However, because there is a range in habitat quality, there is a danger with this design that variability within the sampling unit will make MPA effects undetectable. Spreading samples across a large area also increases sampling costs by decreasing sampling efficiency. The problem of variability can be ameliorated to some degree by constraining sampling to “high quality” habitat. But there is danger with this approach, too, because populations may expand to low quality habitat in good times and be limited to high quality habitat in hard times. If only high quality habitat is sampled, these population changes may not be measured. There is also the problem of defining high quality habitat and each species has different habitat preferences. Random sampling across all MPAs Random sampling across all MPAs can be used to answer the question: Is there a change in an indicator within MPAs as a whole over time? With this design, samples would be randomly distributed throughout the MPAs and in outside reference areas. There would be sufficient sample size to represent MPAs as a whole but not any one MPA. In theory, because the number of samples could be limited, this might be the lowest cost alternative; however, reduced sample size might be largely offset by large travel distances and the logistical nightmare of trying to sample the whole central coast within a limited amount of time. There is also a good probability that variability would overwhelm any MPA effects. The problem with variability could be ameliorated by stratifying the sampling by such factors as fishing pressure, depth, but each stratum requires replication. With only a few strata, this could be a high cost alternative that answers a limited question of limited interest. Another alternative would be to limit sampling to MPAs with historically high fishing pressure to answer the question: is there a change in an indicator in MPAs with high fishing pressure over time? Multivariate Designs Multivariate analysis uses statistical techniques such as non-metric multidimensional scaling and principal components analysis to associate patterns in the data with forcing factors such as depth, fishing pressure, and geographical position. Changes in patterns and associated factors can be followed over time. Most often multivariate techniques are used to evaluate species composition, but regression analysis could be used to measure changes in individual population parameters such as density. Multivariate techniques can also be used to assess socioeconomic impacts and are critical for separating impacts of MPAs from other factors such as economic change, environmental change, and other regulatory changes (e.g., dedicated access privileges, gear restrictions, and catch limits).
California MLPA Initiative – A Framework for Baseline Data Collection Page 20 of 25

Data from a BACI design can be evaluated with multivariate techniques. However, to fully utilize the power of multivariate statistics, it would be better to distribute samples so that they fall across the full gradient of a forcing factor. For instance, it is generally accepted that depth is a primary factor affecting species’ distributions. With a BACI design, variability associated with depth would be held constant by sampling a restricted depth zone that was the same both inside and outside MPAs. With this constraint (and others), it is assumed that differences between the sites are due to the status (MPA vs. non-MPA). With a multivariate design, samples would be taken across the full range of depth and fishing pressure. The analysis would then show how the sites cluster and the relationship between the clusters and depth and fishing pressure. Presumably sites in the same depth zone but with high and low fishing pressure would form separate clusters. Regression analysis could be used to determine if differences in population characteristics such as density varied significantly with fishing pressure. The issue really isn’t whether to use multivariate analysis or normal statistics with a BACI design. If samples are randomly distributed in an MPA, they can be analyzed with both types of statistics. With the BACI design, it will be necessary to control variability by stratifying the samples either before or after the sampling. With multivariate analysis, the variability will drive the statistics. The real issue is how to sample in a way that provides sufficient information about the MPAs with a limited budget.
California MLPA Initiative – A Framework for Baseline Data Collection Page 21 of 25

Appendix III: Glossary
The following terms are defined in California Fish and Game Code Section 2852:
“(a) "Adaptive management," with regard to marine protected areas, means management policy that seeks to improve management of biological resources, particularly in areas of scientific uncertainty, by viewing program actions as tools for learning. Actions shall be designed so that, even if they fail, they will provide useful information for future actions, and monitoring and evaluation shall be emphasized so that the interaction of different elements within marine systems may be better understood.” “(b) "Biogeographical regions" refers to the following oceanic or near shore areas, seaward from the high tide line or the mouth of coastal rivers, with distinctive biological characteristics, unless the master plan team establishes an alternative set of boundaries (emphasis added): (1) The area extending south from Point Conception. (2) The area between Point Conception and Point Arena. (3) The area extending north from Point Arena.” “(c) "Marine protected area" (MPA) means a named, discrete geographic marine or estuarine area seaward of the high tide line or the mouth of a coastal river, including any area of intertidal or subtidal terrain, together with its overlying water and associated flora and fauna that has been designated by law, administrative action, or voter initiative to protect or conserve marine life and habitat. An MPA includes marine life reserves and other areas that allow for specified commercial and recreational activities, including fishing for certain species but not others, fishing with certain practices but not others, and kelp harvesting, provided that these activities are consistent with the objectives of the area and the goals and guidelines of this chapter. MPAs are primarily intended to protect or conserve marine life and habitat, and are therefore a subset of marine managed areas (MMAs), which are broader groups of named, discrete geographic areas along the coast that protect, conserve, or otherwise manage a variety of resources and uses, including living marine resources, cultural and historical resources, and recreational opportunities.” “(d) "Marine life reserve," for the purposes of this chapter, means a marine protected area in which all extractive activities, including the taking of marine species, and, at the discretion of the commission and within the authority of the commission, other activities that upset the natural ecological functions of the area, are prohibited. While, to the extent feasible, the area shall be open to the public for managed enjoyment and study, the area shall be maintained to the extent practicable in an undisturbed and unpolluted state.”
California MLPA Initiative – A Framework for Baseline Data Collection Page 22 of 25

The following additional terms have been drawn from other legislative documents and scientific publications: Abundance: The total number of individuals of a species present in a specific area (Art 1993). Other relevant definitions from California legislation include: Natural abundance, or the total number of individuals in a population protected from, or not subjected to, human-induced change (adapted from DFG 2004 and Kelleher 1992) and Relative abundance, an index of species population numbers used to compare populations from year to year (DFG 2002a). Biodiversity: Refers to the variety and variability among living organisms and the ecological complexes in which they occur. Diversity can be defined as the number of different items and their relative frequencies. For biological diversity, these items are organized at many levels, ranging from complete ecosystems to the biochemical structures that are the molecular basis of heredity. Thus, the term encompasses different ecosystems, species, and genes (E11th Hour, 2006). Other relevant definitions from California legislation include: A component and measure of ecosystem health and function. It is the number and genetic richness of different individuals found within the population of a species, of populations found within a species range, of different species found within a natural community or ecosystem, and of different communities and ecosystems found within a region (Public Resources Code subsection 12220[b]). Natural Biodiversity is biodiversity when protected from, or not subjected to, human-induced change. Community: Natural community means a distinct, identifiable, and recurring association of plants and animals that are ecological interrelated within a certain area or habitat (adapted from Fish and Game Code subsection 2702[d]). Ecosystem: The physical and climatic features and all the living and dead organisms in an area that are interrelated in the transfer of energy and material, which together produce and maintain a characteristic type of biological community (DFG 2002b). Ecosystem disturbance: An event that changes the local environment by removing organisms or opening an area, facilitating colonization by new organisms (Art 1993) Ecosystem function: The processes through which the constituent living and nonliving elements of ecosystems change and interact, including biogeochemical processes and succession (Kaufmann 1994). Ecosystem integrity: A living system exhibits integrity if, when subjected to disturbance, it sustains and organizes self-correcting ability to recover toward a biomass end-state that is normal for that system (E11th hour, 2006). Previous documents have used the following definition: “The ability of an ecosystem to support and maintain a balanced, harmonious, adaptive biological community that demonstrates species composition, diversity and functional organization comparable to that of natural habitat in the region” (FAO 2003).
California MLPA Initiative – A Framework for Baseline Data Collection Page 23 of 25

Ecosystem structure: Attributes related to the instantaneous physical state of an ecosystem; examples include species population density, species richness or evenness, and standing crop biomass (E11th Hour, 2006). Habitat: The living place of an organism or community, characterized by its physical or biotic properties (Allaby 1998). Intrinsic value: The value that that thing has “in itself,” or “for its own sake,” or “as such,” or “in its own right” (Zimmerman 2004). Leveraged Funds: A broadly interpreted term for funding not provided by an agency issuing an RFP. In this document, leveraged funds may include money from other state or federal programs, foundations, or other outside sources. Matching Funds: Specifically defined funding not provided by an agency issuing an RFP. Usually a defined amount of matching funds, equal to some percentage of the awarded grant, is required to receive funding. Applicants are required to bring these funds to the table. Matching funds may include salaries, expendable supplies and equipment, capital equipment, ship time, or services provided by other agencies or sources. Natural diversity: The species richness of a community or area when protected from, or not subjected to, human-induced change (drawn from Allaby 1998 and Kelleher 1992). Glossary References Allaby, M. 1998. Concise Oxford dictionary of ecology. New York Oxford University
Press (UK). Art, H.W. (ed). 1993. The dictionary of ecology and environmental science. Holt, New
York. Beebe, J. 2001. Rapid Assessment Process. Walnut Creek, CA: AltaMira Press. E11th Hour, 2006. “Glossary, Terms of Environment” < http://www.e11th-
hour.org/resources/backgrounders/environmental.glossary.b.html> Kaufmann, M. R., Graham, R. T., Boyce, D. A., Jr., Moir, W. H., Perry, L., Reynolds, R.
T., Bassett, R. L., Mehlhop, P., Edminster, C. B., Block, W. M., and Corn, P. S. 1994. An ecological basis for ecosystem management. Gen. Tech. Rep. RM 246. Fort Collins, CO: U.S. Department of Agriculture, Forest Service, Rocky Mountain Forest and Range Experiment Station. 22 p.
California MLPA Initiative – A Framework for Baseline Data Collection Page 24 of 25

California MLPA Initiative – A Framework for Baseline Data Collection Page 25 of 25
Kelleher, K, Kenchington, R. 1992. Guidelines for Establishing Marine Protected Areas. International Union for the Conservation of Nature. State of California Department of Fish and Game, Marine Region (DFG 2002a). 2002.
Draft Abalone Recovery and Management Plan. State of California Department of Fish and Game, Marine Region (DFG 2002b). 2002.
Nearshore Fishery Management Plan. State of California Department of Fish and Game, Marine Region (DFG 2004). 2004.
Draft Market Squid Fishery Management Plan. United Nations Food and Agriculture Organization (FAO). 2003. The Ecosystem
Approach to Fisheries. FAO Technical Guidelines for Responsible Fisheries, No.4, Suppl.2.
Zimmerman, M.J. 2004. "Intrinsic vs. Extrinsic Value." The Stanford Encyclopedia of
Philosophy (Fall 2004 Edition), Edward N. Zalta (ed.). http://plato.stanford.edu/archives/fall2004/entries/value-intrinsic-extrinsic/.

California Marine Life Protection Act Initiative
Baseline Data Collection Programs Tables
December 1, 2006
This set of tables is complementary to the MLPA Initiative document, A Framework for Baseline Data Collection Programs. Both documents were prepared by MLPA
Initiative staff with the assistance and advice of the MLPA Baseline Science-Management Panel, a group of 11 scientists
with experience and knowledge of marine protected areas assessment.
Comments are welcome on these proposed baseline data collection programs, and suggestions for additional programs or different
approaches to this need, at [email protected]

Baseline Data Collection Programs Tables
Table A: Draft Baseline Data Collection Programs for the California Fish and Game
Commission's August 2006 Preferred Alternative for Central Coast MPAs Table B: Overarching Structure for Baseline Data Collection Programs Table C: Definitions of Terms Used in the Overarching Structure for Baseline Science
Collection Programs Table D: MPA-Specific Information to Aid in the Design of Baseline Data Collection Programs
for the California Fish and Game Commission's August 2006 Preferred Alternative for Central Coast MPAs
Table E: List of Focal Species for Baseline Science Monitoring Programs (taken from the
Draft MLPA Central Coast Study Region MPA Monitoring Plan)

California MLPA Initiative - Baseline Data Collection Programs TablesTable A: Draft Baseline Data Collection Programs
Revised November 2006
Table A: Draft Baseline Data Collection Programs for the California Fish and Game Commission's August 2006 Preferred Alternative for Central Coast MPAs
Biophysical Data Collection
Reference number Indicator Data Priority Description
Relation to Existing
Programs
Goals Addressed
Overarching Questions Addressed
Management Questions Addressed
Estimated Cost Potential Study Sites Comments
1
Distribution, diversity, relative abundance, and sizes of species and habitat attributes for deep canyons, coral, and rocky reef habitats.
High (1st for bio-physical group)
This program would use submersible and ROV surveys and other appropriate technologies to study deepwater species and habitats inside and outside of designated MPAs in the Central Coast. Surveys would focus on approximately 60-80 species of fish and 20-30 species of invertebrates at depths representative of deep canyons and rocky habitats. These surveys would focus on depths ranging from 50-300 meters at approximately 30 sites (15 MPAs based on Package FGC proposal).
These data are not being collected by existing programs.
Goals 1, 2, and 4
G1a-1, G1b-1, G2a-1, G2c-1, G4b-3
1, 2, 3, 4 $1,600,000 Soquel Canyon SMCA, Portuguese Ledge SMCA, Pacific Grove Marine Gardens SMCA, Carmel Pinnacles SMR, Point Lobos SMR, Point Lobos SMCA, Point Sur SMR, Point Sur SMCA, Big Creek SMCA, Big Creek SMR, Piedras Blancas SMR, Piedras Blancas SMCA, Point Buchon SMR, Point Buchon SMCA, Vandenberg SMR (15 MPAs)
The estimated cost figure for this program assumes approximately $500,000 in leveraged funds. The total cost of starting this program from scratch would therefore be $2,100,000.
2
Distribution, diversity, relative abundance, and sizes of species and habitat attributes for kelp forest and shallow rocky reef habitats.
High (2nd for bio-physical group)
This program would use SCUBA surveys and other appropriate technologies to study kelp forest and shallow rocky reef species and habitats inside and outside of designated MPAs in the Central Coast. Surveys would focus on approximately 25 species of fish, 30 species of invertebrates, and 10 species of algae representative of kelp forests and shallow rocky reef at approximately 36 sites (18 MPAs based on Package FGC proposal).
This program would compliment existing monitoring programs.
Goals 1, 2, and 4
G1a-1, G1b-1, G2a-1, G2c-1, G4b-3
1, 2, 3, 4 $400,000 Ano Nuevo SMR, Greyhound Rock SMCA, Natural Bridges SMR, Ed Ricketts SMCA, Lovers Point SMR, Pacific Grove Marine Gardens SMCA, Asilomar SMR, Carmel Pinnacles SMR, Carmel Bay SMCA, Point Lobos SMR, Point Sur SMR, Big Creek SMCA, Big Creek SMR, Piedras Blancas SMR, Cambria SMP, Cambria SMR, Point Buchon SMR, Vandenberg SMR (18 MPAs)
The estimated cost figure for this program assumes approximately $400,000 in leveraged funds. The total cost of starting this program from scratch would therefore be $800,000.
A-1

California MLPA Initiative - Baseline Data Collection Programs TablesTable A: Draft Baseline Data Collection Programs
Revised November 2006
Reference number Indicator Data Priority Description
Relation to Existing
Programs
Goals Addressed
Overarching Questions Addressed
Management Questions Addressed
Estimated Cost Potential Study Sites Comments
3
Distribution, diversity, relative abundance, and sizes of species and habitat attributes for kelp forest and shallow rocky reef habitats.
High (3rd for bio-physical group)
This program use non-lethal fishing gear surveys and other appropriate technologies to study kelp forest and shallow rocky reef species inside and outside of designated MPAs with kelp forest habitats in the Central Coast. Surveys would focuson 25 species of fish representative of kelp forests and shallow rocky reef at approximately 36 sites (18 MPAs based on Package FGC proposal) and would likely require several months to complete. These surveys would focus on species not easily accessed with SCUBA surveys such as cabezon and grass rockfish.
These data are not being collected by existing programs.
Goals 1, 2, and 4
G1a-1, G1b-1, G2a-1, G2c-1, G4b-3
1, 2, 3, 4 $250,000 Ano Nuevo SMR, Greyhound Rock SMCA, Natural Bridges SMR, Ed Ricketts SMCA, Lovers Point SMR, Pacific Grove Marine Gardens SMCA, Asilomar SMR, Carmel Pinnacles SMR, Carmel Bay SMCA, Point Lobos SMR, Point Sur SMR, Big Creek SMCA, Big Creek SMR, Piedras Blancas SMR, Cambria SMP, Cambria SMR, Point Buchon SMR, Vandenberg SMR (18 MPAs)
The estimated cost figure for this program assumes approximately $60,000 in leveraged funds. The total cost of starting this program from scratch would therefore be $310,000.
4
Distribution, diversity, relative abundance, and sizes of species and habitat attributes for mid and deep soft bottom habitats
Medium (4th for bio-physical group)
This program would use sled, ROV surveys, and other appropriate technologies to study soft bottom species and habitats inside and outside of designated MPAs in the Central Coast at depths of 15-300 meters. Surveys would focus on selected fish and invertebrates representative of deep soft bottom habitats at approximately 42 sites (21 MPAs based on Package FGC proposal).
These data are not being collected by existing programs.
Goals 1 and 4
G1a-1, G1b-1, G4b-3
1, 2 $400,000 Ano Nuevo SMR, Greyhound Rock SMCA, Soquel Canyon SMCA, Portuguese Ledge SMCA, Pacific Grove Marine Fish Gardens SMCA, Asilomar SMR, Carmel Pinnacles SMR, Carmel Bay SMCA, Point Lobos SMR, Point Lobos SMCA, Point Sur SMR, Point Sur SMCA, Big Creek SMCA, Big Creek SMR, Piedras Blancas SMR, Piedras Blancas SMCA, Cambria SMR, Cambria SMP, Point Buchon SMR, Point Buchon SMCA, Vandenberg SMR (21 MPAs)
The estimated cost figure for this program assumes approximately $100,000 in leveraged funds. The total cost of starting this program from scratch would therefore be $500,000. Sleds will be used to cover more area than ROV's and will study fish and epifaunal inverts.
A-2

California MLPA Initiative - Baseline Data Collection Programs TablesTable A: Draft Baseline Data Collection Programs
Revised November 2006
Reference number Indicator Data Priority Description
Relation to Existing
Programs
Goals Addressed
Overarching Questions Addressed
Management Questions Addressed
Estimated Cost Potential Study Sites Comments
5
Distribution, diversity, relative abundance, and sizes of species and habitat attributes for rocky intertidal habitats.
Medium (5th for bio-physical group)
This program would use visual surveys and other appropriate methods to study rocky intertidal species and habitats inside and outside of designated MPAs in the Central Coast. Surveys would focus on algae and invertebrates at approximately 34 sites (17 MPAs based on Package FGC proposal).
This program would compliment existing monitoring programs.
Goals 1 and 4
G1a-1, G1b-1, G4b-3
1, 2 $200,000 Ano Nuevo SMR, Greyhound Rock SMCA, Natural Bridges SMR, Ed Ricketts SMCA, Lovers Point SMR, Pacific Grove Marine Gardens SMCA, Asilomar SMR, Carmel Bay SMCA, Point Lobos SMR, Point Sur SMR, Big Creek SMCA, Big Creek SMR, Piedras Blancas SMR, Cambria SMP, Cambria SMR, Point Buchon SMR, Vandenberg SMR (17 MPAs)
The estimated cost figure for this program assumes approximately $70,000 in leveraged funds. The total cost of starting this program from scratch would therefore be $270,000. .
6
Distribution, species composition, abundance (density), group size, and behaviors or marine mammal and bird populations
Medium (6th for bio-physical group)
This program would use shipboard surveys (line transect methodology for mammals, strip transect methods for birds) as the vessel is underway at approximately 10 knots. Surveys would follow randomly placed transect lines inside and adjacent to designated MPAs in the Central Coast. The surveys could be conducted in association with vessel use for other projects, while the vessel is cruising between sampling stations. Four observers would be used for each survey trip (two for mammals, one for birds, and one data recorder would be ideal, although a stripped-down version could be done with 2 observers). Surveys would gather information of a wide variety of species, with special attention to Marbled Murrelets, Common Murre, Sooty Shearwaters, Cassin's Auklet, Harbor seals, and Harbor porpoise. Surveys would focus on 10 MPAs in the network where marine birds and mammals were listed as a priority in MPA-specifc objectives.
This program would compliment existing programs that collect data using shipboard surveys as well as other programs that collect data using other methods.
Goals 1, 2, and 4
G1a-1, G1b-1, G2b-1, G4b-3
1, 2 $184,000 Ano Nuevo SMR, Greyhound Rock SMCA, Elkhorn Slough SMR, Elkhorn Slough SMP, Moro Cojo Slough SMR, Lovers Point SMR, Asilomar SMR, Morro Bay SMR, Morro Bay SMRMA, Vandenberg SMR
The estimated cost presented does not assume use of leveraged funds.
A-3

California MLPA Initiative - Baseline Data Collection Programs TablesTable A: Draft Baseline Data Collection Programs
Revised November 2006
Reference number Indicator Data Priority Description
Relation to Existing
Programs
Goals Addressed
Overarching Questions Addressed
Management Questions Addressed
Estimated Cost Potential Study Sites Comments
7
Distribution, diversity, relative abundance, and sizes of species and habitat attributes for estuarine habitats
Low (7th for bio-physical group)
This program would use midwater trawl surveys, mudflat transects, and other appropriate technologies to study estuarine species, especially burrowing macroinvertebrates, flatfishes, surfperches, top smelt, and staghorn sculpin and habitats inside and outside of designated MPAs in the Central Coast (5 MPAs based on Package FGC proposal). Data on larger species (e.g. bat rays and leopard sharks) and burrowing fishes (e.g. gobies) would not be captured in this work, but these data have been collected in recent and ongoing studies by researchers at MBNMS and MLML.
This program would compliment existing monitoring programs by ESNERR, MBNMS, and MLML as well as future potential studies by LS Power.
Goals 1 and 4
G1a-1, G1b-1, G4b-3
1, 2 $80,000 Elkhorn Slough SMR, Elkhorn Slough SMP, Moro Cojo Slough SMR, Morro Bay SMR, Morro Bay SMRMA (5 MPAs)
Estimated costs for this program include $30k for trawls, and $10 for mudflat transects, in both Elkhorn Slough and Morro Bay
8
Distribution, diversity, relative abundance, and sizes of species and habitat attributes for sandy beach habitats
Low (8th for bio-physical group)
This program would use tag and recapture programs and visual and SCUBA surveys to study shallow soft bottom species and habitats in less than 15 meter depths inside and outside of designated MPAs in the Central Coast. Surveys would focus on fish, particularly surfperch, at all MPAs with shallow soft bottom habitats.
These data are not being collected by existing programs.
Goals 1 and 4
G1a-1, G1b-1, G4b-3
1, 2 $200,000 Ano Nuevo SMR, Greyhound Rock SMCA, Ed Ricketts SMCA, Lovers Point SMR, Pacific Grove Marine Gardens SMCA, Asilomar SMR, Carmel Bay SMCA, Point Lobos SMR, Point Sur SMR, Big Creek SMCA, Big Creek SMR, Piedras Blancas SMR, Cambria SMP, Cambria SMR, Point Buchon SMR, Vandenberg SMR (16 MPAs)
The estimated cost figure for this program assumes approximately $60,000 in leveraged funds. The total cost of starting this program from scratch would therefore be $260,000. .
9
Additional baseline indicators
Low Additional baseline studies that could be conducted include surveys of oceanographic processes, recruitment studies, movement surveys, bird surveys (possibly already existing), and marine mammal surveys (possibly already existing).
A-4

California MLPA Initiative - Baseline Data Collection Programs TablesTable A: Draft Baseline Data Collection Programs
Revised November 2006
Reference number Indicator Data Priority Description
Relation to Existing
Programs
Goals Addressed
Overarching Questions Addressed
Management Questions Addressed
Estimated Cost Potential Study Sites Comments
Human-Use Data Collection
10
Non-consumptive effort and welfare data (primary group).
High This program would measure effort and welfare (number of trips, number of dives, etc.) of non-consumptive SCUBA divers across time and space. Divers are identified as the "primary" non-consumptive user group for baseline data collection because their effort and welfare associated with these activities can be directly correlated with biophysical conditions in the marine environment, because of their direct contact with and/or exposure to protected and unprotected underwater environments. This is not the case for other types of non-consumptive users. Zip code information (travel cost) and expenditure patterns data would also be collected. This sampling effort would build on the efforts of others in the Channel Islands and Monterey Bay and sampling methods might include postcard mailback surveys to identify the user populations, internet surveys for more in-depth info and intercept surveys for fine scale spatial data including looking at charts/maps and creating shapefiles to determine where use occurs.
These data are being collected in the Monterey Bay NMS for some of these user-groups. This program would allow for similar methods to be used for an expanded number of geographies and user-groups.
Goals 3, and R1.
G3a-2. R1-3 10, 24 $400,000
(Note that the marginal cost increase for addressing groups that use similar coastal access points will be relatively small)
The estimated costs of this program are dependent on coordination with existing non-consumptive data collection efforts. Though the delineation of "primary" and "secondary" groups in programs 10 and 11 can be further refined based on non-consumptive user data collection expected in 2007, prioritization of non-consumptive user-group data collection will ultimately be a decision for policy-makers.
A-5

California MLPA Initiative - Baseline Data Collection Programs TablesTable A: Draft Baseline Data Collection Programs
Revised November 2006
Reference number Indicator Data Priority Description
Relation to Existing
Programs
Goals Addressed
Overarching Questions Addressed
Management Questions Addressed
Estimated Cost Potential Study Sites Comments
11
Non-consumptive effort and welfare data (secondary group)
Medium This program would expand the effort outlined above in program 9 to measure effort and welfare of non-consumptive users for a "secondary" group, including kayakers, wildlife viewers (tidepool, bird, whale) and unplanned ancillary activities. These users are less directly affected by MPAs than the "primary" group described above, though they may be greater in number.
These data are being collected in the Monterey Bay NMS for some of these user-groups. This program would allow for similar methods to be used for an expanded number of geographies and user-groups.
Goals 3 and R1
G3a-2, R1-3 11, 25 $200,000 The estimated costs of this program are dependent on coordination with program 10, described above. Note that it may be possible to further prioritize between user-groups in the secondary category.
12
Non-consumptive user knowledge, attitudes, and perceptions.
Medium This program would gather data on the knowledge, attitudes, and perceptions of non-consumptive users across time, space, and user-group. Information would be gathered for core non-consumptive user groups including divers, kayakers, and wildlife viewers (whale, bird, tidepool). Data would be gathered by means of surveys, group sessions, data mining, and other methods. These data may be collected in the same fashion as programs 10 and 11 above, but may be collected separately to ease time requirements on participants. Some of these data may be collected in programs 10 and 11. These data are useful to the extent that they inform programs 10 and 11 above and also have secondary value.
These data are not being collected by existing programs.
Goal 3 G3a-2 10, 11 $100,000 The estimated costs of this program are dependent on coordination with programs 10 and 11, described above.
A-6

California MLPA Initiative - Baseline Data Collection Programs TablesTable A: Draft Baseline Data Collection Programs
Revised November 2006
Reference number Indicator Data Priority Description
Relation to Existing
Programs
Goals Addressed
Overarching Questions Addressed
Management Questions Addressed
Estimated Cost Potential Study Sites Comments
13
CRFS data, intercept surveys, and microblock data for recreational consumptive users [phase 1]
High This program will assimilate, compile, and analyze this existing CRFS information to make it more usable in assessing MPAs in the Central Coast Study Region. Catch and fishing effort data for recreational consumptive users (including commercial passenger fishing vessels) are currently being collected from a variety of sources. This program will also develop GIS tools that will aid in the effective use of these data. Note that a minimal amount of knowledge, attitudes, and perceptions data is collected as part of this program.
These data are already being collected, but the resulting information has not been synthesized.
Goals 2, 3 and R1.
G2a-2, G2c-2, G3a-3, R1-2
7, 8, 9, 19, 22, 23
$100,000
14
CRFS data, intercept surveys, and microblock data for recreational consumptive users [phase 2]
High This program will expand the collection of these data in order to better assess MPAs in the Central Coast Study Region by increasing the number of samples collected. Catch and fishing effort data for recreational consumptive users (including commercial passenger fishing vessels) are currently being collected from a variety of sources.
These data are already being collected, but collection programs need to be expanded.
Goals 2, 3 and R1.
G2a-2, G2c-2, G3a-3, R1-2
7, 8, 9, 19, 22, 23
$300,000 This expanded program will require close coordination with CRFS program. This program already samples ca. 20% of recreational effort, and anglers are sensitive to more direct presence from other programs. Currently, CRFS samplers are experiencing some open hostility and interview refusal from anglers due to recent awareness of newly proposed central coast MPAs.
A-7
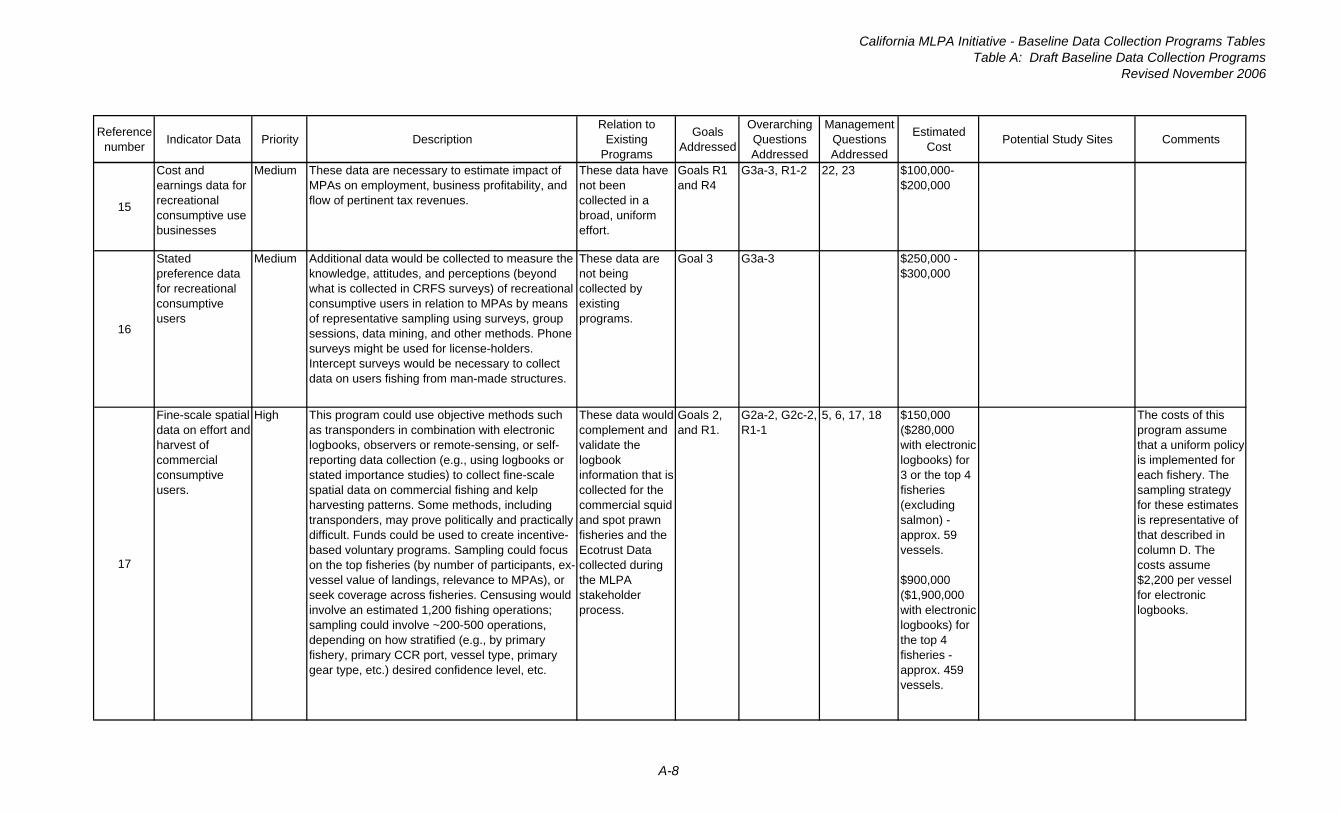
California MLPA Initiative - Baseline Data Collection Programs TablesTable A: Draft Baseline Data Collection Programs
Revised November 2006
Reference number Indicator Data Priority Description
Relation to Existing
Programs
Goals Addressed
Overarching Questions Addressed
Management Questions Addressed
Estimated Cost Potential Study Sites Comments
15
Cost and earnings data for recreational consumptive use businesses
Medium These data are necessary to estimate impact of MPAs on employment, business profitability, and flow of pertinent tax revenues.
These data have not been collected in a broad, uniform effort.
Goals R1 and R4
G3a-3, R1-2 22, 23 $100,000-$200,000
16
Stated preference data for recreational consumptive users
Medium Additional data would be collected to measure the knowledge, attitudes, and perceptions (beyond what is collected in CRFS surveys) of recreational consumptive users in relation to MPAs by means of representative sampling using surveys, group sessions, data mining, and other methods. Phone surveys might be used for license-holders. Intercept surveys would be necessary to collect data on users fishing from man-made structures.
These data are not being collected by existing programs.
Goal 3 G3a-3 $250,000 - $300,000
17
Fine-scale spatial data on effort and harvest of commercial consumptive users.
High This program could use objective methods such as transponders in combination with electronic logbooks, observers or remote-sensing, or self-reporting data collection (e.g., using logbooks or stated importance studies) to collect fine-scale spatial data on commercial fishing and kelp harvesting patterns. Some methods, including transponders, may prove politically and practically difficult. Funds could be used to create incentive-based voluntary programs. Sampling could focus on the top fisheries (by number of participants, ex-vessel value of landings, relevance to MPAs), or seek coverage across fisheries. Censusing would involve an estimated 1,200 fishing operations; sampling could involve ~200-500 operations, depending on how stratified (e.g., by primary fishery, primary CCR port, vessel type, primary gear type, etc.) desired confidence level, etc.
These data would complement and validate the logbook information that is collected for the commercial squid and spot prawn fisheries and the Ecotrust Data collected during the MLPA stakeholder process.
Goals 2, and R1.
G2a-2, G2c-2, R1-1
5, 6, 17, 18 $150,000 ($280,000 with electronic logbooks) for 3 or the top 4 fisheries (excluding salmon) - approx. 59 vessels.
$900,000 ($1,900,000 with electronic logbooks) for the top 4 fisheries - approx. 459 vessels.
The costs of this program assume that a uniform policy is implemented for each fishery. The sampling strategy for these estimates is representative of that described in column D. The costs assume $2,200 per vessel for electronic logbooks.
A-8

California MLPA Initiative - Baseline Data Collection Programs TablesTable A: Draft Baseline Data Collection Programs
Revised November 2006
Reference number Indicator Data Priority Description
Relation to Existing
Programs
Goals Addressed
Overarching Questions Addressed
Management Questions Addressed
Estimated Cost Potential Study Sites Comments
18
Stated importance data (e.g. Ecotrust) for commercial consumptive users
Medium This program would use interviews with commercial fishermen to determine the stated importance of fishing locations (similar to what was done by Ecotrust). This program should be considered an alternative to program 17 above as there is significant overlap in the kind of data collected.
This program would refine and build on the work done by Ecotrust.
Goals 2, and R1.
G2a-2, G2c-2, R1-1
5, 6, 17, 18 $250,000-500,000
19
Cost and Earnings Data for commercial consumptive users.
Medium This program would entail the use of survey or keyinformant interviews, or carefully designed focus groups, to collect data on costs and earnings, employment, and other relevant characteristics of commercial fishing operations and fishery participants before MPA implementation. These data should be linked to use pattern data, so that the baseline relationship between the two can be determined, and so that MPA impacts can be effectively and accurately measured. The research should build on available understanding of the social and economic organization of CCR fisheries, and insure representative coverage across fisheries and fishing communities using stratified sampling strategies or other appropriate techniques. The resulting baseline should provide basic, holistic understanding by port area and fishery, as well as for the region as a whole, as it relates to the CCR marine environment in general and the MPA network. These are the best data to collect in order to ascertain the impact of MPAs on coastal communities.
These data have been collected in recent years for selected CCR fisheries and coastal communities, and through selected studies (recent and ongoing) led or sponsored by the Pacific States Marine Fisheries Commission’s EFIN Program. Limited data have been collected in recent years on a sample of Moss Landing fishery participants.
R1 R1-1, R1-4 17, 18 $300,000-$400,000
Major fishing ports within and adjacent to the study region
A-9

California MLPA Initiative - Baseline Data Collection Programs TablesTable B: Overarching Structure for Baseline Data Collection Programs
Revised November 30, 2006
Table B: Overarching Structure for Baseline Data Collection Programs
Color coding key:
Biophysical programs in yellow
Human-use programs in green
Goal Goal Component Overarching Questions Management Questions Other Overarching Q's addressed
Data Collection Programs (refers to
Table A)
Notes
Goal 1 G1a: Did the MLPA protect the natural diversity and abundance of marine life?
1) What is the natural (current) diversity and abundance of marine life and how does it change through time within and outside of MPAs?
1) How do the diversity and abundance of affected species change within MPAs as opposed to similar areas outside of MPAs?
G1b-1, G4b-3
1, 2, 3, 4, 5, 6, 7, and 8
As diversity is difficult to measure in many habitats, proxies for diversity will be used in many cases.
2) How do different levels of allowable take and associated protection levels in MPAs affect the diversity and abundance of affected species?
G1b-1, G4b-3
1, 2, 3, 4, 5, 6, 7, and 8
2) How do human activities affect the natural diversity and abundance of marine life and how do these activities and effects change through time within and outside of MPAs?
G1b: Did the MLPA protect the structure, function, and integrity of marine ecosystems?
1) What are the structure, function, and integrity of marine ecosystems and how do they change through time within and outside of MPAs?
See mgmt questions for G1a-1.
1, 2, 3, 4, 5, 6, 7, and 8
While specific rubrics for assessing ecosystem structure, function, and integrity have not been identified, measuring diversity and abundance will help to address this overarching question.
B-1
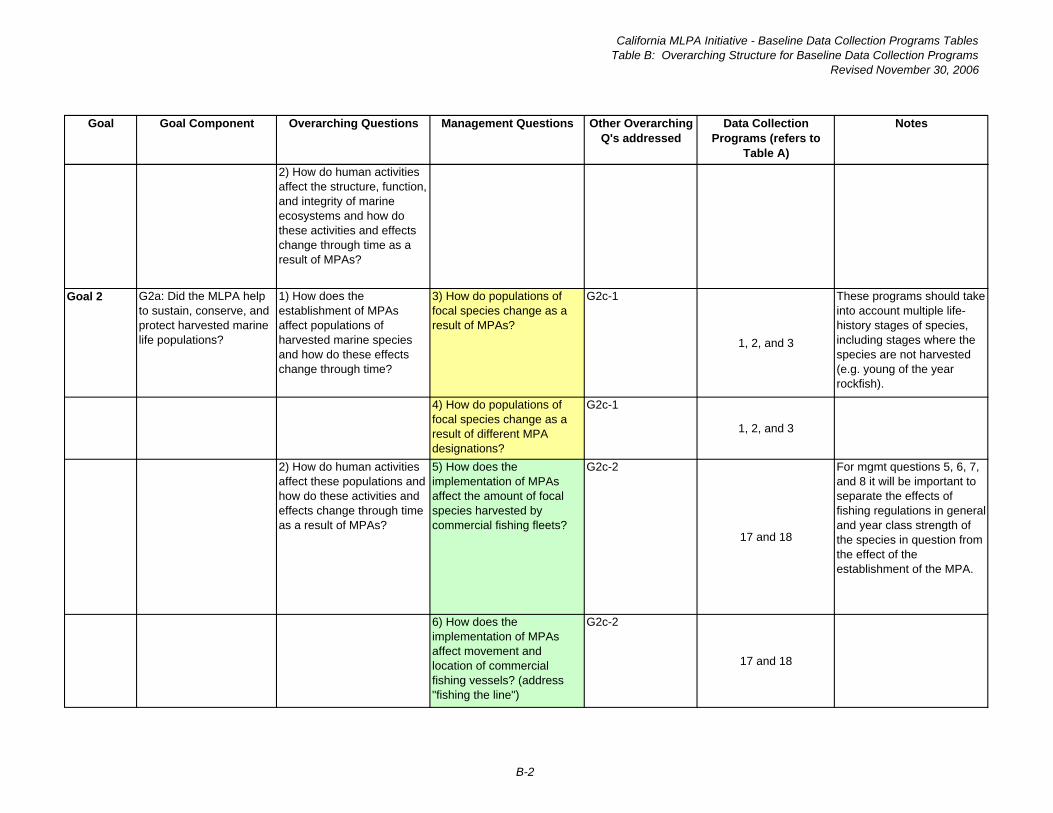
California MLPA Initiative - Baseline Data Collection Programs TablesTable B: Overarching Structure for Baseline Data Collection Programs
Revised November 30, 2006
Goal Goal Component Overarching Questions Management Questions Other Overarching Q's addressed
Data Collection Programs (refers to
Table A)
Notes
2) How do human activities affect the structure, function, and integrity of marine ecosystems and how do these activities and effects change through time as a result of MPAs?
Goal 2 G2a: Did the MLPA help to sustain, conserve, and protect harvested marine life populations?
1) How does the establishment of MPAs affect populations of harvested marine species and how do these effects change through time?
3) How do populations of focal species change as a result of MPAs?
G2c-1
1, 2, and 3
These programs should take into account multiple life-history stages of species, including stages where the species are not harvested (e.g. young of the year rockfish).
4) How do populations of focal species change as a result of different MPA designations?
G2c-1
1, 2, and 3
2) How do human activities affect these populations and how do these activities and effects change through time as a result of MPAs?
5) How does the implementation of MPAs affect the amount of focal species harvested by commercial fishing fleets?
G2c-2
17 and 18
For mgmt questions 5, 6, 7, and 8 it will be important to separate the effects of fishing regulations in general and year class strength of the species in question from the effect of the establishment of the MPA.
6) How does the implementation of MPAs affect movement and location of commercial fishing vessels? (address "fishing the line")
G2c-2
17 and 18
B-2

California MLPA Initiative - Baseline Data Collection Programs TablesTable B: Overarching Structure for Baseline Data Collection Programs
Revised November 30, 2006
Goal Goal Component Overarching Questions Management Questions Other Overarching Q's addressed
Data Collection Programs (refers to
Table A)
Notes
7) How do MPAs affect the amount of focal species harvested by the recreational fishing fleet?
G2c-2, G3a-3
13, 14
8) How do MPAs affect the amount of focal species harvested by the recreational consumptive divers?
G2c-2, G3a-3
13, 14
9) How do MPAs affect the locations where recreational anglers choose to fish?
G2c-2
13, 14
G2b: Did the MLPA help to sustain, conserve, and protect non-harvested marine life populations?
1) How does the establishment of MPAs affect populations of non-harvested marine species and how do these effects change through time?
6
2) How do human activities affect these populations and how do these activities and effects change through time as a result of MPAs?
G2c: Did the MLPA help to rebuild marine life populations that are depleted?
1) How does the establishment of MPAs affect populations of depleted marine species and how do these effects change through time?
See mgmt questions for G2a-1.
1, 2, and 3
Rockfish are both harvested and depleted.
2) How do the human activities that affect rebuilding potential of depleted marine species change through time as a result of MPAs?
See mgmt questions for G2a-2.
13, 14, 17, 18
Rockfish are both harvested and depleted.
B-3
California MLPA Initiative - Baseline Data Collection Programs TablesTable B: Overarching Structure for Baseline Data Collection Programs
Revised November 30, 2006
Goal Goal Component Overarching Questions Management Questions Other Overarching Q's addressed
Data Collection Programs (refers to
Table A)
Notes
Goal 3 G3a: Did the MLPA improve recreational opportunities provided by marine ecosystems that are subject to minimal human disturbances?
1) How has the MLPA changed recreational opportunities and uses within undisturbed marine ecosystems?
2) What are the effects of MPAs on the quality and quantity of non-consumptive recreational uses and values?
10) How do MPAs affect the number, quality, and location of non-consumptive dives per year?
10 and 12
11) How do MPAs affect the number of passive wildlife viewers (whale watchers, bird watchers, etc.) per year and the location and quality of these trips?
11 and 12
3) What are the effects of MPAs on the quality and quantity of consumptive (consistent with minimal human disturbance) recreational uses and values.
See mgmt questions for G2a-2 and R1-2.
13, 14, 15, 16
The amount of fish landed per person is one way to address quality of consumptive experiences. The number of consumptive users is one way to measure quantity of consumptive use.
G3b: Did the MLPA improve educational opportunities provided by marine ecosystems that are subject to minimal human disturbances?
1) How has the MLPA changed educational uses and opportunities to study undisturbed marine ecosystems?
12) How do MPAs affect the quality and quantity of educational trips taken per year? Do the number of trips in an area increase once an MPA is established?
Note that no data collection programs are identified here.
B-4

California MLPA Initiative - Baseline Data Collection Programs TablesTable B: Overarching Structure for Baseline Data Collection Programs
Revised November 30, 2006
Goal Goal Component Overarching Questions Management Questions Other Overarching Q's addressed
Data Collection Programs (refers to
Table A)
Notes
G3c: Did the MLPA improve study (research) opportunities provided by marine ecosystems that are subject to minimal human disturbances?
1) How has the MLPA affected marine research within undisturbed marine ecosystems?
13) How does the implementation of an MPA in an area affect the number of research activities occurring in and around that area?
Note that no data collection programs are identified here.
2) How has the MLPA affected marine research as a whole by protecting undisturbed marine ecosystems (e.g. as a control)?
G3d: How do recreational, educational, and study activities affect biodiversity in MPAs?
1) What are the spatial and temporal effects of recreational activities on biodiversity in MPAs?
2) What are the spatial and temporal effects of educational activities on biodiversity in MPAs?3) What are the spatial and temporal effects of research activities on biodiversity in MPAs?
Goal 4 G4a: Did the MLPA protect cultural sites and geological features in central California waters?
1) What are the cultural sites and geological features that can be protected by MPAs, and what proportion of these are included within the MPA network?
Interpretation of "natural heritage" to include cultural and geologic sites is from discussions with DPR.
B-5

California MLPA Initiative - Baseline Data Collection Programs TablesTable B: Overarching Structure for Baseline Data Collection Programs
Revised November 30, 2006
Goal Goal Component Overarching Questions Management Questions Other Overarching Q's addressed
Data Collection Programs (refers to
Table A)
Notes
2) How do human activities affect cultural sites and geological features and how do these activities and effects change through time within and outside of MPAs?
G4b: Did the MLPA protect representative marine life habitats in central California waters?
1) What proportion of representative marine life habitats (defined in the MPF) were actually included in the MPA network?
14) What proportion of representative marine life habitats (defined in the MPF) were actually included in the MPA network?
Note that no baseline data collection programs are identified here at this time. While this management question is important, it is not a priority for current baseline data collection programs. Some habitats, including rocky habitats (esp. deeper than 100m), pinnacles, larval retention zones, and upwelling centers are currently not well mapped and will need to be better researched to adequately address this question.
2) How do these habitats change over time inside and outside of MPAs?3) How does the abundance of associated species change as a function of area of habitats included in the MPA network?
See mgmt questions for G1a-1.
1, 2, 3, 4, 5, 6, 7, and 8
B-6

California MLPA Initiative - Baseline Data Collection Programs TablesTable B: Overarching Structure for Baseline Data Collection Programs
Revised November 30, 2006
Goal Goal Component Overarching Questions Management Questions Other Overarching Q's addressed
Data Collection Programs (refers to
Table A)
Notes
G4c: Did the MLPA protect unique marine life habitats in central California waters?
1) What are the unique habitats within the central coast region?
2) What proportion of unique marine life habitats were actually included in the MPA network?
3) How do these habitats change over time inside and outside of MPAs?4) How does the abundance of associated species change as a function of area of unique habitats included in the MPA network?
Goal 6 G6: To what extent do MPAs created under the MLPA function as a network?
1) How do different combinations of MPA size and spacing influence the amount of time that individuals stay in MPAs and how does this influence larval supply?
15) How much do adults of focal species move into and out of MPAs (address spillover)?
Note that no data collection programs are identified here. While these management questions are important, they are not priorities for baseline data collection programs.
2) How do different combinations of MPA size and spacing influence the larval dispersal from one MPA to another in the network?
16) Do larvae of focal species move between MPAs?
Note that no data collection programs are identified here. While these management questions are important, they are not priorities for baseline data collection programs.
B-7

California MLPA Initiative - Baseline Data Collection Programs TablesTable B: Overarching Structure for Baseline Data Collection Programs
Revised November 30, 2006
Goal Goal Component Overarching Questions Management Questions Other Overarching Q's addressed
Data Collection Programs (refers to
Table A)
Notes
3) To what extent do MPAs within the network benefit from and contribute to populations outside of the network?
Assess-ing socio-economic impacts
R1: What are the socioeconomic impacts of the MLPA?
1) What are the socioeconomic impacts of the MLPA on consumptive commercial users?
17) How does the implementation of MPAs affect the structure of commercial fishing fleets? 17, 18, 19
Analysis of effects of MPAs on user groups should take into account other factors including regulation changes, the economy, price of fuel, weather, etc.
18) How does the implementation of MPAs affect the catch per unit effort of commercial fishing fleets?
17, 18, 19
2) What are the socioeconomic impacts of the MLPA on consumptive recreational users?
19) How do MPAs affect the total number of recreational anglers in the central coast?
G3a-3
13, 14
20) How do MPAs affect the total number of recreational consumptive divers in the central coast?
G3a-3 Note that no data collection programs are identified here.
21) How do MPAs affect the total number of boat registrations in the central coast?
G3a-3 Note that no data collection programs are identified here.
22) How do MPAs affect the structure of the CPFV fleet? 13, 14, 15
23) How do MPAs affect the catch per unit effort of recreational fishermen?
13, 14, 15
B-8

California MLPA Initiative - Baseline Data Collection Programs TablesTable B: Overarching Structure for Baseline Data Collection Programs
Revised November 30, 2006
Goal Goal Component Overarching Questions Management Questions Other Overarching Q's addressed
Data Collection Programs (refers to
Table A)
Notes
3) What are the socioeconomic impacts of the MLPA on non-consumptive recreational users?
24) How do MPAs affect the income of dive-related businesses? 10
25) How do MPAs affect the income of kayak-related businesses?
11
4) What are the socioeconomic impacts of the MLPA on coastal communities?
B-9

California MLPA Initiative - Baseline Data Collection Programs TablesTable C: Definitions of Terms and Criteria Used in the Overarching Structure
September 25, 2006
Table C: Definitions of Terms and Criteria Used in the Overarching Structure for Baseline Science Collection Programs
Term DefinitionGoals (column A) "Goals" in this column refer to the five goals of the MLPA that relate to baseline data collection, as well as
other MPA goals not included in the MLPA that policy makers have identified (labeled R1). This is the top tier of the overarching structure for baseline data collection programs.
Goal components (column B) "Goal components" in this column break the goals of the MLPA and other MPA goals into distinct components and convert them into questions. Where possible, they use language directly from the MLPA. This is the second tier of the overarching structure for baseline data collection programs.
Overarching questions (column C) "Overarching questions" in this column are more specific questions that need to be addressed to answer the broader goal component questions. This third tier allows members of the BSMP to clarify ambiguous language provided by the MLPA and better define the broad categories of information that needs to be gathered.
Management Questions (column D) "Management questions" in this column constitute specific, measurable policy questions that can be easily converted to scientific hypotheses. These more focused questions help to answer the more broad overarching questions. In some cases a single management question may contribute to answering multiple overarching questions. In this case, the management question has been placed under the overarching question that it best addresses and a reference to other overarching questions addressed is provided. While it is possible to create management questions for all overarching questions, this document provides a smaller subset of critical management questions identified by policy makers.
Other overarching questions addressed (column E)
The column entitled "Other overarching questions addressed" provides a reference to overarching questions that are also addressed by the identified management question (e.g. G1b-1 refers to Goal component 1b, overarching question 1.
Data collection programs (column F) "Data collection programs" in this column refer to the specific data that BSMP members have identified as important to collect considering importance of the data in establishing a baseline, usefulness of data in adaptive management, lack of similar kinds of data, ease of data collection, data collection cost, time-dependency of collecting data, and other factors. A complete list of these programs is provided, with reference numbers, in the sheet entitled "Data collection programs." In many cases, multiple data collection programs help to answer a single management question. Likewise, a single data collection program might address multiple management questions. These program descriptions provide general guidelines for how actual baseline data collection should occur and it is expected that more detailed information should be provided by applicants under a request for proposal (RFP) process.
C-1

California MLPA Initiative - Baseline Data Collection Programs TablesTable C: Definitions of Terms and Criteria Used in the Overarching Structure
September 25, 2006
Color-coding key Management questions that primarily concern data collection by biophysical scientists are colored yellow, while management questions that primarily concern data collection by human-use scientists are colored green.
Estimated Cost (under "Data Collection Programs" worksheet)
"Estimated Costs" associated with each data collection program reflect rough estimates of the cost of initial data collection. These estimates are based on a hypothetical $4 million budget total for the bio-physical and human-use subgroups. While these estimated costs may differ from actual program costs, they represent a valuable reference to the relative importance of each data collection program. In practice, funding allocation may be less than the figure presented here, but it should be recognized that many programs may become less effective below an unidentified threshold level. In addition, these cost estimates do not represent the total cost of conducting baseline research, as actual research costs include expected matching funds provided by RFP applicants.
Prioritization CriteriaBiophysical Sub-group Bio-physical baseline data collection programs were prioritized such that deep rock habitat surveys were
identified as the number one priority because a small amount of data exists for this habitat which is important to several focal species. Kelp-forest surveys were listed as the second highest priority because this habitat is important to many focal species and enough information exists where it will be relatively easy to create a complete data set. Benthic species are the focus of most programs, as MPAs have the greatest impact on benthic, rather than pelagic communities. It should be noted that data for some programs, including surveys of soft-bottom habitat, will likely be collected by deep rock and kelp forest data collection programs due to the intermixed nature of hard and soft bottom substrates on the central coast. Furthermore, connectivity between MPAs (Goal 6 of the MLPA) and habitat mapping (Goal 4 of the MLPA) were not addressed as these were not considered to be priorities for baseline data collection.
Human-Use Sub-group Human-use baseline data collection programs were prioritized within three separate categories: non-consumptive data, consumptive recreational data, and consumptive commercial data. Within each of these three groups, some data collection programs are prioritized over others based on usefulness in addressing the goals of the MLPA, ease of data collection, and other factors. Prioritization among these three human-use data categories was determined to be outside the purview of the BSMP, though factors to consider are described in the framework document.
C-2

California MLPA Initiative - Baseline Data Collection Programs TablesTable D: MPA-Specific Information to Aid in the Design of Baseline Data Collection Programs
Revised November 2006
Table D: MPA-Specific Information to Aid in the Design of Baseline Data Collection Programs for the California Fish and Game Commission's August 2006 Preferred Alternative for Central Coast MPAs
MPA Name Type Protection Level
Rec. Fish?
Comm. Fish?
Allowed Take
Area (sq.mi)
Depth Range (ft)
Focal Species Present
Targeted Populations (from MPA objectives)
Rocky Shore*
Sandy Shore*
Avg. Kelp
Shallow Rock (0-30 m)
Mid-Range Rock (30-100m)
Deep Rock (>100m)
Shallow Sand (0-30m)
Mid-Range Sand (30-100m)
Deep Sand (>100m)
Shallow Canyon (0-30m)
Shallow Canyon (30-100m)
Deep Canyon (>100m) Estuary
Ano Nuevo SMR SMR SMR No No No take 11.07 0-175 4.89 10.47 0.01 3.56 0.00 0.00 4.80 2.70 0.00 0.00 0.00 0.00 0.00 Nearshore rockfish, intertidal inverts
Marine birds, mammals
Greyhound Rock SMCA
SMCA SMCA low Yes - shore, salmon
Yes - squid, salmon
Squid, Salmon, hand kelp, shorefishing
11.81 0-216 3.31 2.72 0.01 1.96 0.00 0.00 0.81 9.03 0.00 0.00 0.00 0.00 0.00 Nearshore rockfish
Marine birds
Habitat Amount in Lin. Miles*, Sq. Miles (or P = Present)
Note that habitat values for shallow, deep, and midrange rock are based on a combination of coarse scale data and proxies and therefore represent approximations of actual habitat coverage.
D-1

California MLPA Initiative - Baseline Data Collection Programs TablesTable D: MPA-Specific Information to Aid in the Design of Baseline Data Collection Programs
Revised November 2006
MPA Name
Ano Nuevo SMR
Greyhound Rock SMCA
Targeted Habitats
(from MPA objectives)
MPAs with Replicate Habitats and Species
Potential Comparative Study Opportunities (from
MPA objectives)
Potential Consumptive-Recr. User Group Impacts to Monitor (from internal
recreational fisheries report)
Potential Consumptive-Comm. User
Group Impacts to Monitor
Monitoring Programs at Site
Past Monitoring Birds and Mammals Monitoring
BSMP Biophysical
Data Collection Programs at
this Site
PR- private and rental boats; CPFV - commercial passenger fishing vessel; MM - fishing from man-made structures; BB -Fishing from beaches and banks
This column may be filled in using the Ecotrust data from the MLPA Central Coast process.
intertidal Natural Bridges SMR (intertidal, surfgrass and mussel beds), Greyhound Rock SMCA (intertidal, shallow rock)
Possible comparison between similar habitats with different levels of allowable take between Ano Nuevo SMR and Greyhound Rock SMCA.
Potential medium impact to CPFV and PR (foul weather use by Half Moon Bay fishermen)
1 PISCO monthly intertidal at Waddell creek
1. Strip transects of birds and mammals, line transect data for Marbled Murrelets and sea otters from 19 October 1999 – 22 March 1999 (n=21). Also shore surveys conducted on all those days plus two additional days. We collected data on prey resources (fish and invertebrates by conducting three otter trawls on 4 April 2000. (Henkel and Harvey 2000 final report to CalTrans).2. Seabird work conducted by PRBO and Michelle Hester (Hester 1998 MS thesis from MLML regarding Rhinoceros auklets on ANI). 3. Numerous studies on elephant seal use of ANI and nearby beaches, mostly conducted by Burney LeBoeuf (UCSC) and colleagues. Current counts of elephant seals in area conducted by UCSC (Dan Costa and colleagues).4. Studies of California sea lions on ANI and their foraging ecology by Mike Weise (2006, Ph.D. from UCSC).5. Aerial surveys of pinnipeds on ANI and adjacent beaches by Mark Lowry (NMFS, La Jolla).6. Sea otters are surveyed annually via aircraft and shore-based observers by USGS-BRD (Brian Hatfield).
2, 3, 5, 6, 8
Natural Bridges SMR (intertidal), Ano Nuevo (intertidal, shallow rock)
Possible comparison between similar habitats with different levels of allowable take between Ano Nuevo SMR and Greyhound Rock SMCA.
2 PISCO intertidal (annual and monthly), 1 MARINe, all at Scott Creek
1. Strip transects of birds and mammals, line transect data for Marbled Murrelets and sea otters from 19 October 1999 – 22 March 1999 (n=21). Also shore surveys conducted on all those days plus two additional days. We collected data on prey resources (fish and invertebrates by conducting three otter trawls on 4 April 2000. (Henkel and Harvey 2000 final report to CalTrans).2. Sea otters are surveyed annually via aircraft and shore-based observers by USGS-BRD (Brian Hatfield).
2, 3, 5, 6, 8
D-2

California MLPA Initiative - Baseline Data Collection Programs TablesTable D: MPA-Specific Information to Aid in the Design of Baseline Data Collection Programs
Revised November 2006
MPA Name Type Protection Level
Rec. Fish?
Comm. Fish?
Allowed Take
Area (sq.mi)
Depth Range (ft)
Focal Species Present
Targeted Populations (from MPA objectives)
Habitat Amount in Lin. Miles*, Sq. Miles (or P = Present)
Natural Bridges SMR
SMR SMR No No No take 0.58 0-21 3.58 3.10 0.02 0.58 0.00 0.00 0.00 0.00 0.00 0.00 0.00 0.00 0.00 Intertidal inverts
surfgrass, mussels
Elkhorn Slough SMR
SMR SMR No No No take 1.48 0-10 0.00 0.00 0.00 0.00 0.00 0.00 1.48 0.00 0.00 0.00 0.00 0.00 1.48 Intertidal inverts
birds, sea otter
Elkhorn Slough SMP
SMP SMP low Yes - shore and boat finfish, clams
No Shorefishing, clams
0.09 0-10 0.00 0.17 0.00 0.00 0.00 0.00 0.09 0.00 0.00 0.00 0.00 0.00 0.09 Intertidal inverts
birds
Moro Cojo Slough SMR
SMR SMR No No No take 0.46 0-10 0.00 0.00 0.00 0.00 0.00 0.00 0.46 0.00 0.00 0.00 0.00 0.00 0.46 Intertidal inverts
birds
Soquel Canyon SMCA
SMCA SMCA high Yes - pelagics
Yes - pelagics
Pelagic finfish
23.39 247-2113 0.00 0.00 0.00 0.00 2.38 2.92 0.00 13.20 4.91 0.00 0.02 2.85 0.00 Shelf and slope rockfish
rockfish, groundfish
Portuguese Ledge SMCA
SMCA SMCA high Yes - pelagics
Yes - pelagics
Pelagic finfish
19.82 302-4838 0.00 0.00 0.00 0.00 0.38 3.13 0.00 1.46 5.93 0.00 0.00 1.72 0.00 Shelf and slope rockfish, spot prawn, dungeness crab
rockfish, groundfish
D-3

California MLPA Initiative - Baseline Data Collection Programs TablesTable D: MPA-Specific Information to Aid in the Design of Baseline Data Collection Programs
Revised November 2006
MPA Name
Natural Bridges SMR
Elkhorn Slough SMR
Elkhorn Slough SMP
Moro Cojo Slough SMR
Soquel Canyon SMCA
Portuguese Ledge SMCA
Targeted Habitats
(from MPA objectives)
MPAs with Replicate Habitats and Species
Potential Comparative Study Opportunities (from
MPA objectives)
Potential Consumptive-Recr. User Group Impacts to Monitor (from internal
recreational fisheries report)
Potential Consumptive-Comm. User
Group Impacts to Monitor
Monitoring Programs at Site
Past Monitoring Birds and Mammals Monitoring
BSMP Biophysical
Data Collection Programs at
this Site
intertidal Ano Nuevo SMR (intertidal, surfgrass and mussel beds), Greyhound Rock SMCA (intertidal)
Potential medium impact to BB (low effort)
3 PISCO (monthly intertidal at long marine lab, annual intertidal at terrace point, and subtidal at long marine lab), 2 LIMPET (at natural bridges and wilder ranch), 1 MARINe (terrace point)
1. Sea otters are surveyed annually via aircraft and shore-based observers by USGS-BRD (Brian Hatfield).
2, 3, 5
estuary Morro Bay SMR and SMRMA, Elkhorn Slough SMP, Moro Cojo Slough SMR (estuary).
4 CENCOS sites
6, 7
estuary Morro Bay SMR and SMRMA, Elkhorn Slough SMR, Moro Cojo Slough SMR (estuary).
6, 7
estuary Morro Bay SMR and SMRMA, Elkhorn Slough SMR and SMP (estuary)
1 CENCOS site
6, 7
submarine canyon
Portuguese Ledge SMCA, Pt Lobos SMCA, Big Creek SMR (deepwater hardbottom, soft bottom and submarine canyon)
3 CENCOS sites
1, 4
submarine canyon
Soquel Canyon SMCA, Pt Lobos SMCA, Big Creek SMR (deepwater hardbottom, soft bottom and submarine canyon)
1, 4
1. Surveys of shorebirds in Elkhorn Slough were conducted by PRBO from 1988 to 1992 (Page et al. 1992), by Bernadette Ramer in the late 1970s (Ramer 1985 MLML thesis; Ramer etal. 1991), from 1 March 1999 to 1 July 2000 by Sarah Connors (2003 MLML Thesis), and currently conducted 2-4 times per year by Jim Harvey (MLML) and Kirsten Wasson (ESNERR). 2. Harbor seals in Elkhorn Slough have been surveyed through time by numerous Jim Harvey and students at MLML (Harvey and Connors 2002, Oxman, Eguchi, Greig, and others).3. Harbor seals and sea otters also have been counted annually by Yohn Gideon (Elkhorn Slough Safari) and by Tom Kieckhefer. 4. Sea otters are surveyed annually via aircraft and shore-based observers by USGS-BRD (Brian Hatfield).
1. Surveys (strip transects) of seabirds were conducted by MLMl students from 1981 – 1987 (Croll and others), then by John Mason and Jim Harvey (Mason 1997 MLML thesis) from 1992 – 1994 that included surveys through this area. 2. In 1996 MLML and UCSC began a collaborative bird and mammal survey of Monterey Bay, which included transects in this area (Benson and Harvey 1997 final report to MBNMS). Surveys were conducted only in fall (Aug – Nov) but have recently been expanded to include surveys throughout the year (Don Croll and colleagues, UCSC. The current surveys (funded by CIMT) include strip transects of birds, line transects of mammals, CTD, water and net sampling stations, continuous bioacoustics monitoring, SST, and fluorescence (Croll and colleagues, UCSC).3. The American Cetacean Society (Richard Ternullo) has been recording
NERR conducts extensive monitoring of water quality, plant communities, benthic algae and invertebrates, amphibians and reptiles, birds, and habitat and land-use change. MBNMS, MLML, and LS Power are also collecting or planning to collect baseline ecological data.
D-4

California MLPA Initiative - Baseline Data Collection Programs TablesTable D: MPA-Specific Information to Aid in the Design of Baseline Data Collection Programs
Revised November 2006
MPA Name Type Protection Level
Rec. Fish?
Comm. Fish?
Allowed Take
Area (sq.mi)
Depth Range (ft)
Focal Species Present
Targeted Populations (from MPA objectives)
Habitat Amount in Lin. Miles*, Sq. Miles (or P = Present)
Edward F Ricketts SMCA
SMCA SMCA low Yes - finfish from shore, boats
Yes - hand kelp
Shorefishing, hand kelp
0.22 0-74 0.80 0.34 0.05 0.06 0.00 0.00 0.12 0.00 0.00 0.00 0.00 0.00 0.00
Nearshore rockfish, intertidal inverts
Lovers Point SMR
SMR SMR No No No take 0.30 0-88 1.42 0.62 0.08 0.09 0.00 0.00 0.12 0.00 0.00 0.00 0.00 0.00 0.00
Nearshore rockfish, intertidal inverts
sea otter, marine birds
Pacific Grove Marine Gardens SMCA
SMCA SMCA low Yes - finfish by hook and line and spear
Yes - hand kelp
Finfish, hand kelp
2.44 0-172 1.92 1.72 0.14 0.48 0.14 0.00 0.17 0.02 0.00 0.00 0.00 0.00 0.00
Nearshore rockfish, intertidal inverts
Asilomar SMR SMR SMR No No No take 1.51 0-172 2.85 2.05 0.11 0.59 0.08 0.00 0.25 0.01 0.00 0.00 0.00 0.00 0.00
Nearshore rockfish, intertidal inverts
sea otter, marine birds
Carmel Pinnacles SMR
SMR SMR No No No take 0.53 69-223 0.00 0.00 0.01 0.07 0.37 0.00 0.02 0.07 0.00 0.00 0.00 0.00 0.00
Nearshore rockfish
Bull kelp, Macrocystis, hydrocorals
D-5

California MLPA Initiative - Baseline Data Collection Programs TablesTable D: MPA-Specific Information to Aid in the Design of Baseline Data Collection Programs
Revised November 2006
MPA Name
Edward F Ricketts SMCA
Lovers Point SMR
Pacific Grove Marine Gardens SMCA
Asilomar SMR
Carmel Pinnacles SMR
Targeted Habitats
(from MPA objectives)
MPAs with Replicate Habitats and Species
Potential Comparative Study Opportunities (from
MPA objectives)
Potential Consumptive-Recr. User Group Impacts to Monitor (from internal
recreational fisheries report)
Potential Consumptive-Comm. User
Group Impacts to Monitor
Monitoring Programs at Site
Past Monitoring Birds and Mammals Monitoring
BSMP Biophysical
Data Collection Programs at
this Site
Lovers Point SMR, Pacific Grove Marine Gardens SMCA, Asilomar SMR, Carmel Bay SMCA, Point Lobos SMR (intertidal, kelp, shallow rock)
Potential comparison between sites with hook and line but not spearfishing (Ed Ricketts SMCA), hook and line with spearfishing (Carmel Bay/PG Marine Gardens SMCA), and no take (Point Lobos SMR)
3 PISCO subtidal 5 CENCOS, 1 CIAP
1. Harbor seal counts along coastal haul-outs were conducted by Teri Nickolson (MLML student) from 1995 to date.2. Pinniped counts at haul-out sites during aerial surveys are conducted a periodically by NMFS (Mark Lowry Sea otters are surveyed annually via aircraft and shore-based observers by USGS-BRD (Brian Hatfield). 2, 3, 5, 8
Ed Ricketts SMCA, Pacific Grove Marine Gardens SMCA, Asilomar SMR, Carmel Bay SMCA, Point Lobos SMR (intertidal, kelp, shallow rock)
6 PISCO (monthly intertidal, annual intertidal, 4 subtidal), 1 MARINe,
4 CENCOS, 1 CIAP
1. Harbor seal counts along coastal haul-outs were conducted by Teri Nickolson (MLML student) from 1995 to date.2. Pinniped counts at haul-out sites during aerial surveys are conducted a periodically by NMFS (Mark Lowry Sea otters are surveyed annually via aircraft and shore-based observers by USGS-BRD (Brian Hatfield).
2, 3, 5, 6, 8
Ed Ricketts SMCA, Lovers Point SMR, Asilomar SMR, Carmel Bay SMCA, Point Lobos SMR (intertidal, kelp, shallow rock)
Potential comparison between sites with hook and line but not spearfishing (Ed Ricketts SMCA), hook and line with spearfishing (Carmel Bay/PG Marine Gardens SMCA), and no take (Point Lobos SMR). Also potential comparison for kelp harvest/spearfishing.
1 CENCOS site
1. Harbor seal counts along coastal haul-outs were conducted by Teri Nickolson (MLML student) from 1995 to date.2. Pinniped counts at haul-out sites during aerial surveys are conducted a periodically by NMFS (Mark Lowry Sea otters are surveyed annually via aircraft and shore-based observers by USGS-BRD (Brian Hatfield).
2, 3, 5, 8
Ed Ricketts SMCA, Lovers Point SMR, Pacific Grove Marine Gardens SMCA, Carmel Bay SMCA, Point Lobos SMR (intertidal, kelp, shallow rock)
Potential high impact to recreational fishermen (including PR, CPFV, BB, and MM)
1 Limpet site 1. Pinniped counts at haul-out sites during aerial surveys are conducted a periodically by NMFS (Mark Lowry) Sea otters are surveyed annually via aircraft and shore-based observers by USGS-BRD (Brian Hatfield).
2, 3, 5, 6, 8
higher relief hard bottom (pinnacles)
Point Lobos SMCA (mid-level rock)
Potential high impact to CPFV and PR
1. Pinniped counts at haul-out sites during aerial surveys are conducted a periodically by NMFS (Mark Lowry) Sea otters are surveyed annually via aircraft and shore-based observers by USGS-BRD (Brian Hatfield). 2, 3
D-6

California MLPA Initiative - Baseline Data Collection Programs TablesTable D: MPA-Specific Information to Aid in the Design of Baseline Data Collection Programs
Revised November 2006
MPA Name Type Protection Level
Rec. Fish?
Comm. Fish?
Allowed Take
Area (sq.mi)
Depth Range (ft)
Focal Species Present
Targeted Populations (from MPA objectives)
Habitat Amount in Lin. Miles*, Sq. Miles (or P = Present)
Carmel Bay SMCA
SMCA SMCA low Yes - finfish by hook and line and spear
Yes - hand kelp
Finfish, hand kelp
2.12 0-471 2.62 3.03 0.30 0.71 0.04 0.00 0.84 0.05 0.00 0.14 0.02 0.00 0.00
Nearshore rockfish, intertidal inverts
Point Lobos SMR
SMR SMR No No No take 5.36 0-408 13.67 2.09 0.27 1.03 1.13 0.00 0.50 2.32 0.06 0.07 0.01 0.00 0.00
Nearshore rockfish, intertidal inverts
Point Lobos SMCA
SMCA SMCA moderate
Yes - salmon, albacore
Yes - salmon, albacore, spot prawn
Salmon, albacore, spot prawn
8.85 268-1858 0.00 0.00 0.00 0.00 0.26 2.59 0.00 0.18 5.82 0.00 0.02 0.30 0.00 Slope and shelf rockfish
rockfish
Point Sur SMR SMR SMR No No No take 8.69 0-178 3.71 5.80 0.84 3.41 1.80 0.00 2.16 2.34 0.00 0.00 0.00 0.00 0.00Nearshore rockfish, intertidal inverts
rockfish
Point Sur SMCA SMCA SMCA high Yes - salmon, albacore
Yes - salmon, albacore
Salmon, albacore
9.50 134-424 0.00 0.00 0.00 0.00 1.84 0.01 0.00 8.10 0.00 0.00 0.00 0.00 0.00 Slope and shelf rockfish
rockfish
Big Creek SMCA SMCA SMCA moderate
Yes - salmon, albacore
Yes - salmon, albacore, spot prawn
Salmon, albacore, spot prawn
10.11 0-1964 1.77 1.08 0.17 0.40 0.06 0.07 0.91 2.19 6.48 0.00 0.12 2.39 0.00 Slope and shelf rockfish
rockfish
D-7

California MLPA Initiative - Baseline Data Collection Programs TablesTable D: MPA-Specific Information to Aid in the Design of Baseline Data Collection Programs
Revised November 2006
MPA Name
Carmel Bay SMCA
Point Lobos SMR
Point Lobos SMCA
Point Sur SMR
Point Sur SMCA
Big Creek SMCA
Targeted Habitats
(from MPA objectives)
MPAs with Replicate Habitats and Species
Potential Comparative Study Opportunities (from
MPA objectives)
Potential Consumptive-Recr. User Group Impacts to Monitor (from internal
recreational fisheries report)
Potential Consumptive-Comm. User
Group Impacts to Monitor
Monitoring Programs at Site
Past Monitoring Birds and Mammals Monitoring
BSMP Biophysical
Data Collection Programs at
this Site
Ed Ricketts SMCA, Lovers Point SMR, Pacific Grove Marine Gardens SMCA, Asilomar SMR, Point Lobos SMR (intertidal, kelp, shallow rock)
Potential comparison between sites with hook and line but not spearfishing (Ed Ricketts SMCA), hook and line with spearfishing (Carmel Bay/PG Marine Gardens SMCA), and no take (Point Lobos SMR)
5 PISCO subtidal, 1 Limpet
14 CENCOS sites, 1 CIAP
1. Pinniped counts at haul-out sites during aerial surveys are conducted a periodically by NMFS (Mark Lowry) Sea otters are surveyed annually via aircraft and shore-based observers by USGS-BRD (Brian Hatfield).
2, 3, 5, 8
pinnacles, submarine canyon head, granitic shallow hardbottom
Ed Ricketts SMCA, Lovers Point SMR, Pacific Grove Marine Gardens SMCA, Asilomar SMR, Carmel Bay SMCA (intertidal, kelp, shallow rock)
Potential comparison between sites with hook and line but not spearfishing (Ed Ricketts SMCA), hook and line with spearfishing (Carmel Bay/PG Marine Gardens SMCA), and no take (Point Lobos SMR)
9 PISCO subtidal 4 CENCOS, 3 CIAP
1. Pinniped counts at haul-out sites during aerial surveys are conducted a periodically by NMFS (Mark Lowry).2. Sea otters are surveyed annually via aircraft and shore-based observers by USGS-BRD (Brian Hatfield).
2, 3, 4, 5, 8
Portuguese Ledge SMCA, Soquel Canyon SMCA, Big Creek SMR (deepwater hardbottom, soft bottom and submarine canyon), Carmel Pinnacles (mid-level rock)
1. The American Cetacean Society (Richard Ternullo) has been recording sightings of marine mammals (especially cetaceans) since 1993 that includes data from this area.2. Sea otters are surveyed annually via aircraft and shore-based observers by USGS-BRD (Brian Hatfield). 1, 4
upwelling plume, submarine canyon head
Pt Sur SMCA, Piedras Blancas SMCA, and Pt Buchon SMR (mid-range rock)
Potential low impact (far from population centers and suitable substitutes nearby)
6 PISCO (2 annual intertidal, 4 subtidal), 1 MARINe
3 CENCOS, 1 CIAP
1. Pinniped counts at haul-out sites during aerial surveys are conducted a periodically by NMFS (Mark Lowry).2. Sea otters are surveyed annually via aircraft and shore-based observers by USGS-BRD (Brian Hatfield).
2, 3, 5, 8
upwelling plume
Pt Sur SMR, Piedras Blancas SMCA, Pt Buchon SMR (mid-range rock) 1, 4
Big Creek SMR (intertidal, kelp, rock, deep sand), Piedras Blancas SMR, Cambria SMR and SMP (intertidal, kelp, rock), Point Buchon SMCA (deep sand)
Provide opportunity for collaborative research involving commercial fishermen, including possible study of the impact of salmon fishing
1, 2, 3, 5, 8
D-8

California MLPA Initiative - Baseline Data Collection Programs TablesTable D: MPA-Specific Information to Aid in the Design of Baseline Data Collection Programs
Revised November 2006
MPA Name Type Protection Level
Rec. Fish?
Comm. Fish?
Allowed Take
Area (sq.mi)
Depth Range (ft)
Focal Species Present
Targeted Populations (from MPA objectives)
Habitat Amount in Lin. Miles*, Sq. Miles (or P = Present)
Big Creek SMR SMR SMR No No No take 12.35 0-2393 2.95 1.54 0.21 0.57 0.11 0.04 0.73 2.61 7.89 0.00 0.25 3.46 0.00
Nearshore rockfish, intertidal inverts
rockfish
Piedras Blancas SMR
SMR SMR No No No take 10.40 0-157 5.83 5.49 0.50 1.60 0.15 0.00 6.09 2.56 0.00 0.00 0.00 0.00 0.01
Nearshore rockfish, intertidal inverts
rockfish
Piedras Blancas SMCA
SMCA SMCA high Yes - salmon, albacore
Yes - salmon, albacore
Salmon, albacore
8.76 94-337 0.00 0.00 0.00 0.00 0.56 0.00 0.00 8.20 0.00 0.00 0.00 0.00 0.00 Slope and shelf rockfish
rockfish
Cambria SMP SMP SMP low Yes - all species
No All species 6.26 0-105 3.77 5.40 0.57 1.34 0.00 0.00 4.48 0.44 0.00 0.00 0.00 0.00 0.01
Nearshore rockfish, intertidal inverts
rockfish
Cambria SMR SMR SMR No No No take 2.32 0-99 4.00 1.19 0.38 1.02 0.02 0.00 0.94 0.33 0.00 0.00 0.00 0.00 0.00
Nearshore rockfish, intertidal inverts
rockfish, cabezon and greenling
Morro Bay SMR SMR SMR No No No take 0.30 0-10 0.00 0.00 0.00 0.00 0.00 0.00 0.30 0.00 0.00 0.00 0.00 0.00 0.30 Intertidal inverts
birds, sea otter
D-9
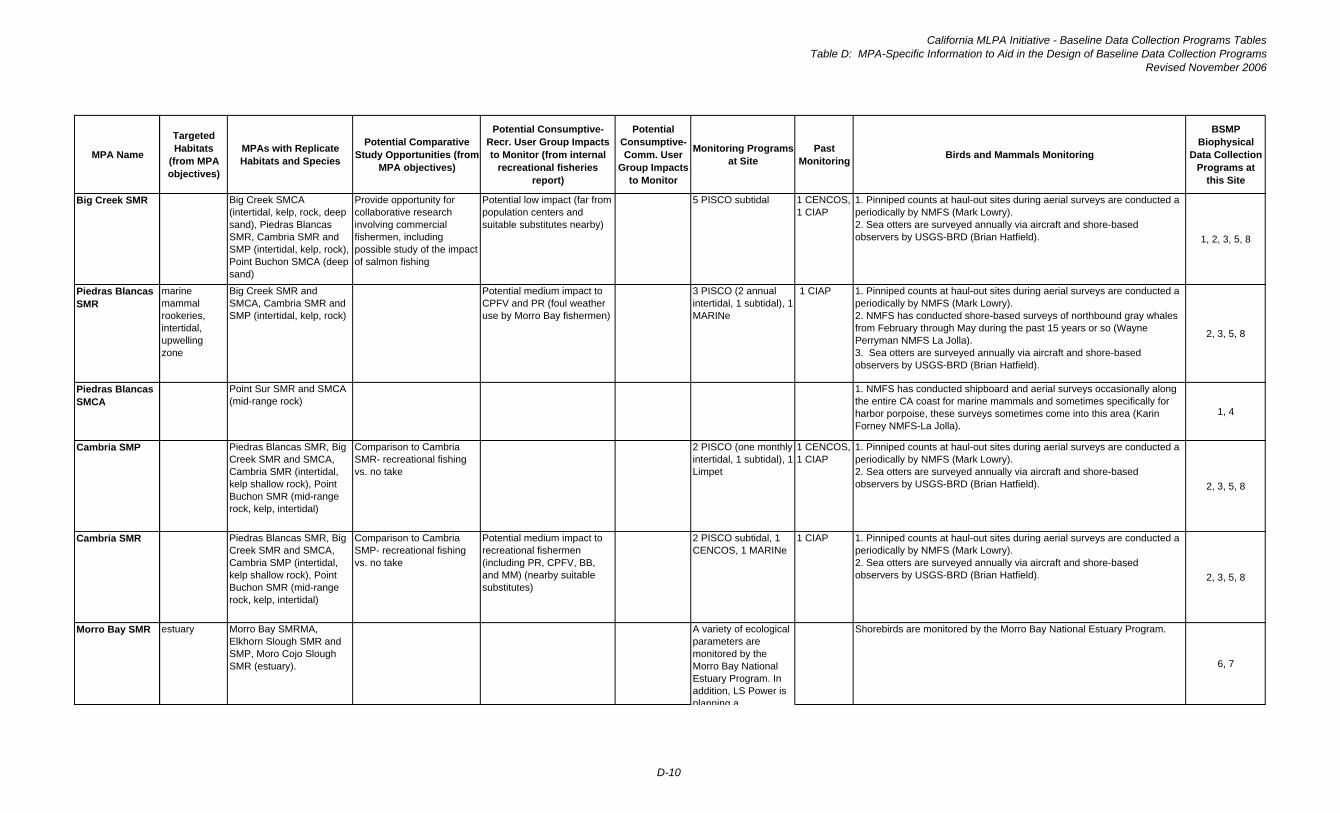
California MLPA Initiative - Baseline Data Collection Programs TablesTable D: MPA-Specific Information to Aid in the Design of Baseline Data Collection Programs
Revised November 2006
MPA Name
Big Creek SMR
Piedras Blancas SMR
Piedras Blancas SMCA
Cambria SMP
Cambria SMR
Morro Bay SMR
Targeted Habitats
(from MPA objectives)
MPAs with Replicate Habitats and Species
Potential Comparative Study Opportunities (from
MPA objectives)
Potential Consumptive-Recr. User Group Impacts to Monitor (from internal
recreational fisheries report)
Potential Consumptive-Comm. User
Group Impacts to Monitor
Monitoring Programs at Site
Past Monitoring Birds and Mammals Monitoring
BSMP Biophysical
Data Collection Programs at
this Site
Big Creek SMCA (intertidal, kelp, rock, deep sand), Piedras Blancas SMR, Cambria SMR and SMP (intertidal, kelp, rock), Point Buchon SMCA (deep sand)
Provide opportunity for collaborative research involving commercial fishermen, including possible study of the impact of salmon fishing
Potential low impact (far from population centers and suitable substitutes nearby)
5 PISCO subtidal 1 CENCOS, 1 CIAP
1. Pinniped counts at haul-out sites during aerial surveys are conducted a periodically by NMFS (Mark Lowry).2. Sea otters are surveyed annually via aircraft and shore-based observers by USGS-BRD (Brian Hatfield). 1, 2, 3, 5, 8
marine mammal rookeries, intertidal, upwelling zone
Big Creek SMR and SMCA, Cambria SMR and SMP (intertidal, kelp, rock)
Potential medium impact to CPFV and PR (foul weather use by Morro Bay fishermen)
3 PISCO (2 annual intertidal, 1 subtidal), 1 MARINe
1 CIAP 1. Pinniped counts at haul-out sites during aerial surveys are conducted a periodically by NMFS (Mark Lowry).2. NMFS has conducted shore-based surveys of northbound gray whales from February through May during the past 15 years or so (Wayne Perryman NMFS La Jolla).3. Sea otters are surveyed annually via aircraft and shore-based observers by USGS-BRD (Brian Hatfield).
2, 3, 5, 8
Point Sur SMR and SMCA (mid-range rock)
1. NMFS has conducted shipboard and aerial surveys occasionally along the entire CA coast for marine mammals and sometimes specifically for harbor porpoise, these surveys sometimes come into this area (Karin Forney NMFS-La Jolla).
1, 4
Piedras Blancas SMR, Big Creek SMR and SMCA, Cambria SMR (intertidal, kelp shallow rock), Point Buchon SMR (mid-range rock, kelp, intertidal)
Comparison to Cambria SMR- recreational fishing vs. no take
2 PISCO (one monthly intertidal, 1 subtidal), 1 Limpet
1 CENCOS, 1 CIAP
1. Pinniped counts at haul-out sites during aerial surveys are conducted a periodically by NMFS (Mark Lowry).2. Sea otters are surveyed annually via aircraft and shore-based observers by USGS-BRD (Brian Hatfield). 2, 3, 5, 8
Piedras Blancas SMR, Big Creek SMR and SMCA, Cambria SMP (intertidal, kelp shallow rock), Point Buchon SMR (mid-range rock, kelp, intertidal)
Comparison to Cambria SMP- recreational fishing vs. no take
Potential medium impact to recreational fishermen (including PR, CPFV, BB, and MM) (nearby suitable substitutes)
2 PISCO subtidal, 1 CENCOS, 1 MARINe
1 CIAP 1. Pinniped counts at haul-out sites during aerial surveys are conducted a periodically by NMFS (Mark Lowry).2. Sea otters are surveyed annually via aircraft and shore-based observers by USGS-BRD (Brian Hatfield). 2, 3, 5, 8
estuary Morro Bay SMRMA, Elkhorn Slough SMR and SMP, Moro Cojo Slough SMR (estuary).
Shorebirds are monitored by the Morro Bay National Estuary Program.
6, 7
A variety of ecological parameters are monitored by the Morro Bay National Estuary Program. In addition, LS Power is planning a
D-10

California MLPA Initiative - Baseline Data Collection Programs TablesTable D: MPA-Specific Information to Aid in the Design of Baseline Data Collection Programs
Revised November 2006
MPA Name Type Protection Level
Rec. Fish?
Comm. Fish?
Allowed Take
Area (sq.mi)
Depth Range (ft)
Focal Species Present
Targeted Populations (from MPA objectives)
Habitat Amount in Lin. Miles*, Sq. Miles (or P = Present)
Morro Bay SMRMA
SMRMA SMCA low Yes - finfish
Yes - oysters (mariculture), bait receivering
Finfish, oysters
3.01 0-22 0.18 1.00 0.00 0.00 0.00 0.00 3.01 0.00 0.00 0.00 0.00 0.00 3.01 Intertidal inverts
birds, sea otter
Point Buchon SMR
SMR SMR No No No take 6.66 0-208 2.74 1.46 0.21 0.60 0.75 0.00 0.65 4.66 0.00 0.00 0.00 0.00 0.00Nearshore rockfish, intertidal inverts
rockfish
Point Buchon SMCA
SMCA SMCA high Yes - salmon, albacore
Yes - salmon, albacore
Salmon, albacore
11.55 191-377 0.00 0.00 0.00 0.00 0.69 0.02 0.00 7.93 2.91 0.00 0.00 0.00 0.00 Slope and shelf rockfish
Vandenberg SMR
SMR SMR No No No take 32.84 0-127 9.55 13.16 0.02 3.27 0.25 0.00 19.58 9.69 0.00 0.00 0.00 0.00 0.00Nearshore rockfish, intertidal inverts
marine birds and mammals
D-11

California MLPA Initiative - Baseline Data Collection Programs TablesTable D: MPA-Specific Information to Aid in the Design of Baseline Data Collection Programs
Revised November 2006
MPA Name
Morro Bay SMRMA
Point Buchon SMR
Point Buchon SMCA
Vandenberg SMR
Targeted Habitats
(from MPA objectives)
MPAs with Replicate Habitats and Species
Potential Comparative Study Opportunities (from
MPA objectives)
Potential Consumptive-Recr. User Group Impacts to Monitor (from internal
recreational fisheries report)
Potential Consumptive-Comm. User
Group Impacts to Monitor
Monitoring Programs at Site
Past Monitoring Birds and Mammals Monitoring
BSMP Biophysical
Data Collection Programs at
this Site
estuary Morro Bay SMR, Elkhorn Slough SMR and SMP, Moro Cojo Slough SMR (estuary).
1 CENCOS site
Shorebirds are monitored by the Morro Bay National Estuary Program.
6, 7
pinnacle Point Sur SMR, Cambria SMR and SMP (mid-range rock, kelp, intertidal)
Potential high impact to CPFV and PR
1 CIAP site 1. Pinniped counts at haul-out sites during aerial surveys are conducted a periodically by NMFS (Mark Lowry).2. Sea otters are surveyed annually via aircraft and shore-based observers by USGS-BRD (Brian Hatfield).
2, 3, 5, 8
Point Sur SMCA (mid-range rock) Big Creek SMR and SMCA (deep sand)
1. Pinniped counts at haul-out sites during aerial surveys are conducted a periodically by NMFS (Mark Lowry).2. Sea otters are surveyed annually via aircraft and shore-based observers by USGS-BRD (Brian Hatfield).
1, 4
Replicate for Pt Sal fished areas
3 PISCO (1 monthly intertidal, 2 subtidal)
1 Coastal Impact Assessment Program
1. Pinniped counts at haul-out sites during aerial surveys are conducted a periodically by NMFS (Mark Lowry).2. Sea otters are surveyed annually via aircraft and shore-based observers by USGS-BRD (Brian Hatfield).
2, 3, 5, 6, 8
planning a coordinated baseline data collection effort in Morro Bay, Elkhorn Slough, and Southern California.
D-12

California MLPA Initiative - Baseline Data Collection Programs TablesTable E - Focal Species for Baseline Science Monitoring Programs in the MLPA Central Coast Study Region
Table E: List of Focal Species for Baseline Science Monitoring Programs (taken from the Draft MLPACentral Coast Study Region MPA Monitoring Plan - November 2006 )
1. Focal fish and invertebrate species for deep water (> 30m) hard bottom habitatsCommon Name Scientific Name Reason for Selection
Bocaccio Sebastes paucispinus shift number, sizeCowcod Sebastes levis shift number, sizeBlue rockfish Sebastes mystinus shift number size Greenspotted rockfish Sebastes chlorostichus shift sizeCopper rockfish Sebastes caurinus shift sizeOlive rockfish Sebastes serranoides shift sizeSquarespot rockfish Sebastes hopkinsi fishedYelloweye rockfish Sebastes ruberrimus shift numberYellowtail rockfish Sebastes flavidus shift sizeWidow rockfish Sebastes entomelas shift numberVermilion rockfish Sebastes miniatus shift sizeGalatheid crabs fishedRed rock crabs Cancer spp fishedCorals habitat formingGorgonians habitat formingSponges habitat formingSea stars keystone speciesSpot prawn Panalus platyceros fished
2. Focal fish and invertebrate species for shallow water (< 30m) hard bottom habitatsCommon Name Scientific name Reason for selection
Lingcod Ophiodon elongatus shift number Kelp greenling Hexagrammos decagrammus fishedGrass rockfish Sebastes rastrelliger fishedBrown rockfish Sebastes auriculatus fishedVermilion rockfish Sebastes miniatus shift sizeCopper rockfish Sebastes caurinus shift sizeBlack rockfish Sebastes melanops shift numberBlue rockfish Sebastes mystinus shift sizeOlive rockfish Sebastes serranoides shift sizeGopher rockfish Sebastes carnatus fishedCabezon Scorpaenichthys marmoratus fishedBlack surfperch Embiotoca jacksoni major component of ecosystemStriped surfperch Embiotoca lateralis major component of ecosystemAbalones Haliotis spp shift number, sizeRed urchin Strongylocentrotus franciscanus fished, removal effects other speciesPurple urchin Strongylocentrotus purpuratus population level effects other speciesSea stars Pisaster spp. keystone speciesBrown rock crab Cancer spp. fishedBull kelp Nereocystis luetkeana habitat formingGiant kelp Macrocystis pyrifera habitat forming
E-1

California MLPA Initiative - Baseline Data Collection Programs TablesTable E - Focal Species for Baseline Science Monitoring Programs in the MLPA Central Coast Study Region
3. Focal fish and invertebrate species for mid and deep water (> 30 m) soft bottom habitatsCommon Name Scientific Name Reason for Selection
Petrale sole Eopsetta jordani shift number, sizeDover sole Microstomus pacificus fishedEnglish sole Parophrys vetulus fishedSlender sole Lyopsetta exilis fishedRex sole Glyptocephalus zachirus fishedPacific sandab Citharichthys sordidus fishedSablefish Anoplopoma fimbria fishedSplitnose rockfish Sebastes diploproa fishedSea pens Stylatula spp, Ptilosarchus spp habitat formingSea stars Astropecten spp. keystone speciesDungeness crab Cancer magister fished
4. Focal fish and invertebrate species for intertidal hard bottom habitatsCommon Name Scientific Name Reason for Selection
Black abalone Haliotis cracherodii shift number, sizeOwl limpets Lottia gigantea shift sizeCalifornia mussels Mytilus californianus keystone speciesOcre sea star Pisaster ochraceus keystone speciesAggregating anemone Anthropleura elegantissima/sola ecosystem componentSmall acorn barnacle Chthamalus dalli/fissus/Balanus
glandulaecosystem component
Large acorn barnacle Tetraclita rubescens ecosystem componentGooseneck barnacle Pollicipes polymerus ecosystem componentTurban snails Tegula funebralis harvestedFeather boa kelp Egregia menziesii habitat formingRockweed Hesperophycus californicus habitat formingRockweed Silvetia compressa habitat formingTurfweed Endocladia muricata habitat formingSurfgrass Phyllospadix scouleri/torreyi habitat formingMonkeyface prickleback Cebidicthys violaceus local depletion
5. Focal marine birds and mammalsCommon Name Scientific Name Reason for Selection
Brandt's cormorant Phalacrocorax penicillatus disturbance, increase in forage baseBrown pelican Pelecanus occidentalis disturbance, increase in forage baseCommon murre Uria aalge disturbance, increase in forage base, relatively
nearshore, are suscepible to oil spills, numbers have decreased in some areas, and are a good indicator of prey availabilty (e.g. anchovy, juvenile rockfish, market squid)
Double-crested cormorant Phalacrocorax auritus disturbance, increase in forage base
Marine Birds
E-2

California MLPA Initiative - Baseline Data Collection Programs TablesTable E - Focal Species for Baseline Science Monitoring Programs in the MLPA Central Coast Study Region
5. Focal marine birds and mammals (continued)Common Name Scientific Name Reason for Selection
Pelagic cormorant Phalacrocorax pelagicus disturbance, increase in forage baseRhinocerous auklet Cerorhinca monocerata disturbance, increase in forage basePigeon guillemot Cepphus columba disturbance, increase in forage baseGrebes Podicipedidae increase in forage baseLoons Gaviidae increase in forage baseMarbled murrelet Brachramphus marmoratus disturbance, increase in forage base, very nearshore,
a listed species, and have some specific habitats that are used frequently, especially during breeding
Sooty Shearwater Wide-ranging, but hits hot spots for prey, (e.g. Monterey Bay, Farallones, off San Luis Obispo), indicator of prey availabilty (e.g. anchovy, juvenile rockfish, market squid), and although the most numerous seabird off CA during the summer, their numbers are going down for some unknown reason
Cassin's Auklet Planktivores - Indicators of krill an larval fish
Sea otters Enhydra lutris keystone speciesSea lions Otariidae keystone speciesHarbor seals Phocidae keystone species, coastal species and because their
diet is more benthic, they are a good indicator of the health of benthic communities
Elephant seals Mirounga angustirostris keystone speciesHarbor Porpoise aggregate in specific areas, coastal, interesting small
stock structure
6. Focal species for estuaries Common Name Scientific Name Reason for SelectionTopsmelt Atherinops affinis lay eggs on plantsLeopard Shark Triakis semifasciata Use estuary as nursery, fishedBlack surfperch Embiotoca jacksoni fishedShiner surfperch Cymatogaster aggregata fishedGhost shrimp Calianassa spp. collected for baitInnkeeper worms Urechis caupo ecosystem componentGaper clams Tresus spp. ecosystem component
Marine Mammals
E-3