A Pluralist Account of Economic Growth Wendy Olsen 26 ...
34
1 A Pluralist Account of Economic Growth Wendy Olsen 26 November 2005 Abstract Theories of economic growth usually refer to investment, human capital, trade, and other economic factors (Barro 1991, 1998). A pluralist account can also allow for variations in economic output that are caused by levels of democracy, culturally grounded patterns of labour market participation, gender, and health. In this paper innovative tests of these relationships are conducted using a 40-year international data set. Regression analysis is well suited to the pluralist account because it can test each variable for apparent additional „effect by augmenting a basic time-series model. Fertility effects disappear once women‟s labour-force participation is brought in. Attainments in school (averaged over all working- age people) are positively associated with growth but school enrolments per se are not. The data refer to the period 1972-2002. The data are compiled from the ILO, UN Common Database, UNDP, Freedom House, and other sources for each decadal time point 1972, 1982, 1992, and 2002. Thus the results are highly up to date as well as innovatively using fixed-effects models to distinguish growth rates from the acceleration of growth. Acknowledgement: I am grateful for Sylvia Walby’s input into our joint research on Democracy, Economic Growth, Economic Development and Gender (ESRC research grant RES-000-22-0526 2004/5).
Transcript of A Pluralist Account of Economic Growth Wendy Olsen 26 ...

1
A Pluralist Account of Economic Growth
Wendy Olsen
26 November 2005
Abstract
Theories of economic growth usually refer to investment, human capital, trade, and other economic
factors (Barro 1991, 1998). A pluralist account can also allow for variations in economic output that are
caused by levels of democracy, culturally grounded patterns of labour market participation, gender, and
health. In this paper innovative tests of these relationships are conducted using a 40-year international
data set. Regression analysis is well suited to the pluralist account because it can test each variable for
apparent additional „effect by augmenting a basic time-series model. Fertility effects disappear once
women‟s labour-force participation is brought in. Attainments in school (averaged over all working-
age people) are positively associated with growth but school enrolments per se are not. The data refer
to the period 1972-2002. The data are compiled from the ILO, UN Common Database, UNDP,
Freedom House, and other sources for each decadal time point 1972, 1982, 1992, and 2002. Thus the
results are highly up to date as well as innovatively using fixed-effects models to distinguish growth
rates from the acceleration of growth.
Acknowledgement: I am grateful for Sylvia Walby’s input into our joint research on Democracy,
Economic Growth, Economic Development and Gender (ESRC research grant RES-000-22-0526
2004/5).

2
A Pluralist Account of Economic Growth
Introduction
Among other factors, gender relations may make a difference to the rate of economic growth. Estimates
of models by Barro (1991, 1998, and Barro and Lee, 2001) have suggested that gender was not a
significant factor in determining the rate of economic growth. Gender‟s role in structuring the world
economy has been documented by a number of authors, though, such as Çagatay and Özler 1995; Elson
1995; Sparr 1994; Standing 1989, 1999; World Bank 2001). In this paper the gender issues are
integrated with a wider pluralist model is used in order to allow for a wide range of economic, political
and demographic factors as well as the social and social-policy factors that surround the gendered work
outcomes of the countries of the world. Some generalizations are known to be true about gender in the
world economy and in local micro-economies that make direct or indirect global-local linkages: for
instance, women‟s participation in public politics and decision-making processes makes a difference to
the trajectories of each country‟s economic development (Afshar 1996; Moser 1993; Waylen 1996).
However considerable local and national variation in gender regimes also exists, and it may be
dangerous to generalize about gender and labour-market exploitation. Evidence at country level for
Malaysia shows considerable exploitation and gender-stereotyping, whilst evidence for many European
countries shows a reduction in gender stereotypes and a declining but diverse gender pay gap (Ng,
1999; cf. Rubery, 1998; Macrae, 1999, 2003).
A further important connection is that economic growth in turn has implications for gender equality
(Bergmann 1986; Çagatay and Özler 1995; Dollar and Gatti 1999; Tzannatos 1999; Walby, 2000).
Gender relations have been included in some models of economic growth (Dollar and Gatti 1999;
Forsythe, Korzeniewicz and Durrant 2000; Klasen 1999; Lorgelly and Owen 1999; Seguino 2000). For
instance, analysis can link the gini coefficient and the fertility rate. In this paper, the inequality issues
and the knock-on effects of growth are not the central issue. Instead I try to estimate statistical models
that will help to set some boundaries on what generalizations can and cannot be made about gender and
economic growth for the period 1972-2002.
Pluralism and economic growth models
Barro‟s (1991, 1998) work has been important in establishing that a range of social and political
institutions are relevant to explaining differences in the rate of economic growth in different countries.1
These institutions include education, especially in its contribution to the development of human capital,
and governance, such as political instability, the rule of law and government expenditure, as well as
more traditionally economic ones, such as type of economic system and market regulations.
Barro includes fertility in his model, finding that the higher the level of human capital, the higher the
rate of economic growth and the lower the fertility rate. He presents fertility as if it were ungendered
by referring to the effects of fertility on parents‟ time rather than that of mothers: „The effect on fertility
involves an increase in the value of parents‟ time and thereby a rise in the cost of raising children.
1 I acknowledge Sylvia Walby‟s contributions to this review of literature. Her related publications include Walby (2000 and
2005). We have also jointly produced analyses of women‟s employment achievement (Walby and Olsen, 2005a) and of
gendered political democracy (Walby with Olsen, 2005b).

3
More generally, any change that increases the cost of raising children tends to reduce fertility and to
increase desired saving per person. In effect, people shift from saving in the form of children to saving
in the form of physical and human capital (Barro 1991: 422).‟
However, the effects of different rates of fertility tend to have greater implications for women than for
men, since women are disproportionately involved in the care of children. Hence fertility is a gendered
phenomenon, rather than gender-neutral. The effects on mothers are not the same as the effects on
fathers. Fertility is associated with a range of gendered institutions and factors, including differential
gender rates of participation in education, the labour force and the formal political system (Abadian
1996; Ainsworth, Beegle and Nyamete 1996; Becker 1981; Galor and Weil 1996; Gillie 1987; Hobcraft
1987). This means that it is possible that the inclusion of fertility in a model prevents the effects of
gendered education, gendered labour force participation, and gendered democracy from being
identified. Could a more nuanced understanding of the relationship between a range of dimensions of
gender relations and economic growth be developed if gendered variables other than fertility were to be
included in the model?
Economic factors associated with economic growth
The paper investigates the impact of gendering a range of institutions that have been shown to be
associated with economic growth. Since gender relations vary between different domains (Connell;
Walby 1990, 1994), there is no single variable that can capture „gender‟ in any given country. Rather it
is necessary to gender each of the main domains that are pertinent to the analysis. In the estimates that
follow I have have re-operationalised the concepts of „education‟, „employment‟, and „democracy‟, to
make visible specifically gendered aspects of them, so as to be able to test for the importance of diverse
forms of gender relations. In the case of „democracy‟, gender does not appear to matter for growth,
but the more economic factors do matter in their gendered form. The pluralist approach with a gender-
aware process of operationalisation takes the debate toward new explanatory factors.
Investment
Capital investment is a strand of causality that permeates most economic theories of growth (Agarwal,
*; Rostow, 1958; Bhaduri, 1986 to name a few). Thirlwall (*) provides a survey. Increased capital not
only makes more production possible, it also tends to push outward the production frontier for a given
set of resources through the renewal of equipment and land using newer techniques and technologies.
In recent years it has become easier to obtain adequate measures of gross capital formation and of
foreign direct investment. These important factors are in the background of my pluralist explanation
and they form the core of a basic growth model.
Innovation through trade
Furthermore it has been argued that exporting creates a tendency for each country‟s manufacturing
firms to compete better by adopting techniques that are more efficient or more intensive in the inputs
that are most easily and cheaply obtained within the country. Imports may need to be increased in
order for exporters to obtain either raw materials or critical inputs, so a trade measure is used in the
models of this paper. Other authors have explored the relationship between trade and growth in more
detail than is possible here (surveys by Solow, 2001; Aghion, 1999).

4
A further link between trade and growth may occur when international companies enter a country,
permeate its labour market, and upgrade the skills of certain sets of workers. These companies also
create possibilities of copying techniques, sub-contracting to set standards, and worker movement
between National and international firms, so endogenous sources of growth may arise. The
endogenous growth theories focus on the synergy of various inputs to production and their implicit,
hard-to-measure link with output and productivity. In some estimates the endogenous growth term is
the positive residual term for some cases in a growth equation, although there is also wide recognition
that endogenous growth is rather hard to measure. Errors in the measurement of the other real causal
factors may be part for the reason for the apparent frequency of endogenous growth to have occurred.
In this paper, we allow for endogenous growth by allowing for as many factors as possible, but not by
allowing interaction terms. (Interaction terms in the regression would seek to find synergies between
specific inputs to production – but the degrees of freedom of the equation are already too small for this
to be a reasonable search under reasonable assumptions. In particular, I do not think a random-effects
model in which the time-dependence of observations on each country is neglected would be a
reasonable growth model. Random effects models are sometimes used to inflate the „N‟ of
observations and are presented here only for comparison with a more reasonable fixed-effects model.)
Economic History
Each country has its own history, legacy of social structures, traditional cultures, primary products, and
consumer preferences. We expect them to each have a unique trajectory, and I am only seeking the
commonalities that arise from either having parallel capitalist growth patterns or from being part of
waves of upward (and downward) swelling of production in the global economy. Some countries are
more or less well connected to these „swellings‟ of production. Therefore each country needs to have
an indicator variable reflecting its starting level of GDP as they enter the 1972-2002 period that is
studied here. I allow for that in the models. A whole series of historical, political and structural factors
are subsumed – and almost hidden – by creating such models.
Human Capital
There is a well established empirical association of formal (school and university) education and
economic growth. The explanation has usually been framed in terms of human capital (Barro 1991,
1998; Barro and Lee 1994). Competing interpretations sometimes note the social status of higher
education and the way it generates expectations in the minds of both employers and employees of
higher wages (Fevre, Rees, and Gorard, 1999). These competing interpretations do not dispute the
noted tendency for wages to be higher for those with more education. In the work of Barro (1991,
1998), Barro and Lee (1996, 2000) and Barro and Sala-i-Martin (1995), the effect of education, in
particular, schooling, is seen to be either gender neutral or to be associated with boys‟ rather than girls‟
education. This tendency is consistent with both human capital theory and the more socially grounded,
subjective interpretation.
However, this finding of a positive association between boys‟ education and a negative association
with girls‟ education could be spurious because there is a high correlation of boys‟ and girls‟ schooling
in the regression equations. One or other should be dropped from the equation, or orthogonality should
be aimed at if two variables are used. The attainments of men and women in formal schooling (years)
can be treated as a measure of gender inequality by creating a ratio of women‟s to men‟s education
5
(Benavot 1989; Lorgelly 2000; Lorgelly and Owen 1999). This variable is orthogonal to average
school attainment.
By contrast with Barro, Klasen (1999, 2002) found that gender inequality in education reduces the rate
of economic growth. Klasen (2002) found that male-biased gender inequality in education reduced per
capita growth rates directly by lowering the average level of human capital and indirectly because of its
impact on investment and population growth. He found that differences of between 0.4-0.9 percentage
points in the growth rates of East Asia and Sub-Saharan Africa, South Asia, and the Middle East were
accounted for by differences in the gender education gaps in these regions. He concludes that gender
equity in education is important for economic and human development.
Employment
A growth in the level of employment has traditionally been associated with a process of economic
development and with the overall level as well as rate of economic growth. Employment is generally
considered to include both salaried employment and more informal forms of paid work such as having
a business, casual paid work, farming, and the informal sector. Unemployment would be expected to
be associated with lower rates of growth but it is so poorly recorded in developing countries – and falls
under very different welfare regimes – that the variable unemployment cannot be used in world-wide
statistical tests. (We have tried to use it but no association was discovered, probably for reasons to do
with measurement error and invalidity of the measurements.)
However, the relationship of gendered employment to the rate of economic growth is much more
complex. There are two issues: the extent and nature of women‟s paid employment; and the extent and
nature of gender inequality in the labour market.
The first issue is the classic issue of the implications of the extent to which women are engaged in paid
employment rather than unpaid domestic work (Boserup 1970). On the one hand is the view that an
increase in women‟s employment is likely to be associated with the growth in the size of the market
economy, as women make a transition from unpaid domestic work to paid work in the labour market,
and indeed that there may be a mutually reinforcing effect between women‟s employment and
economic growth (Bergmann 1986; Çagatay and Özler 1995; Grown, Elson and Çagatay 2000). On the
other hand an increase in women‟s paid employment that is at the expense of their domestic work may
lead to a deterioration in the conditions of existence of the household and be unsustainable, leading to
long-term problems (Elson 1991; Sparr 1994).
The notion or assumption that women without „employment‟ are not doing productive work has long
been questioned. In economics it is widely recognized that women‟s domestic work has an opportunity
cost both in time spent on informal-sector farming and in their lost wages from possible employment
(Ellis, 1993). Therefore the trade-off between informal work and paid work is a delicate and
complicated one. Because these issues are much more prominent and widely recognized now than in
the past, the ILO has begun to include all forms of unpaid labour within its category of occupations and
hence in the part of the labour force that is „active‟. Unpaid helpers are presently considered to be
„active‟ in the labour market whereas in the past they were considered to be inactive. The current
terminology for what used to be called „unpaid helpers‟ is „unpaid family labour‟ which more
appropriately designates their tasks, such as farming and shop-keeping, as labour. Labour force

6
participation rates for different countries have gradually been modernized to take into account these
unpaid forms of working – which also might include tenancy, street trading, cooking for eventual street
sale by another household member, smoking or winnowing food, and many other activities. Because of
this change in the nature of that which is measured by the term „active in the labour force‟ – ie by the
referent of the term – its measurement must be considered approximate. Women as a percentage of the
labour force, in this sense, is rather a different measure from the classical gender ratio among
employees. The two are not highly correlated.
The second issue is whether gender inequality within the practices of paid employment is associated
with higher or lower rates of economic growth. The various dimensions of this inequality include the
size of the gender pay gap (Seguino 2000), the conditions of employment such as job security
(Standing 1989, 1999), occupational and industrial segregation by sex (Anker 1998; Forsythe,
Korzeniewicz and Durrant 2000), and the extent to which women or men occupy professional and
managerial jobs.
Seguino (2000) finds a negative association between gender wage equity and economic growth in Asia,
that is, that the high rates of economic growth in Asia are associated with a larger than average gender
pay gap. However, the gender pay gap is not a particularly good signifier of gender equity in
employment overall. It is also not available for a wide enough range of countries to be used in a global
study. An alternative measure of gender inequality in employment is the proportion of women in
managerial and professional jobs. This is investigated in the following models. We have studied this
factor as a dependent variable in its own right in a related paper (Walby and Olsen, 2005a).
Political and Other Factors Associated with Economic Growth
Health
Ideally differentials in people„s health would be put into growth models to allow for deviations from
what trends otherwise would be. In other words poverty itself (which is associated with ill health but to
varying degrees) can affect the growth rate and create a vicious circle of poverty. Furthermore in
recent years the HIV virus and related AIDS deaths have created a serious loss of labour power in a
few countries. 17 countries have a rate of HIV infection of over 5% and I have tested for whether this
is yet (in 2002, using the 1972-2002 model) having an impact on production. It is difficult to get other
measures of health of the working-age population. Using the child mortality rate or maternal mortality
rate would not be ideal because they do not refer to current workers. Health is an area in which it may
be useful to further explore the effect by linking demographic data sets to the economic and political
data used here. In order to make this possible, I have been negotiating to provide a simple table of the
combined data for all UN countries in 2002, with their histories back to 1972, via the ESRC Data
Archive. It is likely to be available by 2007 and it will be possible to share the data informally under
certain legal conditions before that (contact the author via email).
Governance
There is an established association between various dimensions of the form of governance and the rate
of economic growth (World Bank 1992). Barro (1991) found that the rule of law, and lower rates of
government expenditure were associated with higher rates of economic growth. There is a more
contested debate as to the relationship between democratic governance and economic growth and
development, in which the outcome varies according to the operationalisation of the concepts (Barro

7
1996; Bollen and Jackson 1995; Bruetti 1997; Diamond 1992; Ersson and Lane 1996; Leftwich 1996a,
1996b, 2000; Muller 1995a, 1995b). The most satisfactory analyses are those that have included
factors that mediate between democracy and economic development, for example, Bornschier and
Scholtz (2002) find an important mediating role in human and social capital development, while Muller
(1995) finds that social inequality is a mediating factor (though see Bollen and Jackson 1995).
Conventional definitions of liberal democracy have centred on processes that deliver the opportunity
for all citizens to contribute to collective political decision-making via a system of representation,
especially the right to vote for political representatives in free and competitive elections in the context
of free speech and free association (Dahl 1989; Gastil 1982). Although accounts of democracy have
not always considered women‟s suffrage as necessary for a country to be considered democratic
(Muller 1995; Rueschemeyer et al 1992), a gender-based critique suggests that a polity is not fully
democratic when there is not equitable representation of women (Phillips 1995). There are substantial
variations in the representation of women in national elected assemblies, from 8% in the Arab states,
15% in the US, to 40% in Nordic countries in 2005 (Inter-Parliamentary Union 2005). The concept of
democracy could be re-operationalised in a gender-inclusive manner by additionally including
processes that generate a proportionate presence of women in parliament.
Methodology
The works referred to so far in the review of literature are already pluralist. They are theoretical
pluralist as suggested by Dow (2004; 1997), who has recommended a „structured pluralism‟ that admits
there are structural patterns and regular tendencies in the economy even though there is also much that
is unique and locally specific. My work on pluralism has stressed the ontic overlaps between theories
– seen here as the overlap between human capital theory and endogenous growth theory; and again in
the links between gender theories generally and each of the other factors – whilst recognizing the
difficulties that arise when theories are partly incommensurate (Olsen, 2006 forthcoming). It is
important to tolerate the theories that have a good grounding in empirical data. It is also important to
explore empirical measurement issues that can either improve, or change and modify, existing theories.
Given the disputes that have occurred about the role of gender in growth – related to women‟s fertility,
to their education, and to their productivity – this paper stresses a careful, but feasible,
operationalisation of each factor in its gendered form.
The paper‟s methodology is thus based on a realist assessment that countries are not an ideal unit of
analysis but that they exist and have collected data, so we can make several compromises in using
country data. Furthermore I recognize the weaknesses as well as strengths of regression as a method
(Olsen and Morgan, 2005). The use of regression tends to omit factors that are specific to 30 or less
cases because they cannot „appear‟ to be significant; it tends to make us forget measurement error; and
it tends to make us infer causality when it is more appropriate to note correlations (ibid.). I have tried
to avoid the latter problem by using time series data. The critique of statistics issued by other realists
like Lawson (1997) does apply to much of what is presented in this paper. The critique tends to lead to
a complete unwillingness to use statistical analysis at all (Sayer, 1992; Kemp and Holmwood, 2003).
Instead it would be better to remember that many causal mechanisms will exist without showing their
effect(s) in the regression, and that some patterns in the regression do not tease out the real, basic,
general or universal causes. Most importantly, although the review of literature has described the
characteristics of capitalist development that are typically found in orthodox economics, there is every

8
possibility that the huge variations of country data away from the means of each variable (and the huge
unexplained variance in growth rates) are due to a wide range of important, real, causal factors such as
institutions, attitudes, governments, aid interventions, and so on.
Having mentioned this caveat I will proceed to a statistical analysis of a large data set.
The Data
The data were collected from several locations.2 The data made available by Barro were used where
relevant in order to establish the closest possible compatibility with this work. Additional information
was included on economic factors from the World Bank and the International Labour Office; on
women‟s parliamentary presence from the Inter-Parliamentary Union; on civil and political liberties,
based on Gastil‟s scaling, from FreedomHouse. Appendix 1 provides all the means of the variables
used, both for the whole range of countries and for those used in the main results (73 countries).
Appendix 2 provides details of the source of each variable used. Tables 1 and 2 give an overview of
the average levels in 2002 and the preceding decades for each main variable.
The dependent variables include growth rates, gross domestic product per capita and the level of
investment. The last of these three (expressed as a percentage of GDP) is used as an instrument in the
two-stage least squares regressions that comprise the main results. The instrument is shown in Table 3
to be suitable for this purpose, since it is affected by its own independent variables (trade and lagged
GDP) but is not associated by the other main independent variables of the growth equations. In Table 3
two measures of growth outcomes are examined. The first is the growth rate of per-capita GDP,
calculated as an overall rate over four years surrounding the dates 1982, 1992, 2002. The four-year
period‟s annual GDP levels (per capita) were examined. The rate of growth from 1979 to 1983 was first
measured as an exponential annualised rate. If either end-point were missing of the 4-year period, the
average (exponential annualised) annual rate of growth for the available years within this period was
substituted for this overall measure. In most cases the full four years could be used. Data converted to
purchasing-power parity adjusted dollars were not available for enough countries to be useful. Instead,
GDP in 1995 constant US Dollars was used. These data are widely available in the World
Development Indicators. Each decade-ending growth rate estimate was calculated in the same way
(1989 to 1993; and 1999 to 2003). The on-line World Development Indicators database was used to
get the latest 2003 data.
Before settling on this measure three alternative measures were examined. First, annual growth rates
(ie not per capita, sic) were found to be highly unstable and not to have any close association with the
causal variables in the growth models. This was true even with population growth rates in the models.
Figures 1 and 2 indicate the relative instability of annual (one-year) growth rates of per-capita income
compared with the overall movement of GDP (per capita) over the long 40-year period. The 4-year
period chosen for study gives an intermediate level of stability in the dependent variable used in Table
3. In Figure 1 the dependent variable for Table 3, columns 3 and 4, can be visualised by seeing the
overall movement of GDP over a ten-year period (similar to the ten-year growth rates studied by Barro
2 The Economic and Social Research Council (UK) grant no. RES-000-22-0526 funded the research.
Note: In addition, the support of the ESRC through the programme of the ESRC Global Poverty
Research Group is also gratefully acknowledged.

9
(2000)). Secondly ten-year average growth rates were examined. They did not differ from the four-
year interval growth rates by much. They did not show any associations with the other variables in the
models. Weighing by population, using lagged values, and inserting a baseline GDP per capita level in
a random effects model were all tested. None offered a reasonable model of growth.
Thirdly, PPP per capita growth rates were examined, but there were too many missing values in these
rates for the time-series model to give significance. Using data for 2002 only, an association of PPP
growth rates with investment can be discerned. However, time-series estimates are needed to tease out
the causality that is involved.
The second main dependent variable is the level of GDP per capita (logarithmically transformed to
reduce skewness). This variable is placed in fixed-effects models where the dependent variable‟s
change over time (ie growth) is compared with the associated changes over time of all other variables
in the model. The model estimates the slope of the line relating a change in X to a change in Y. The
grand means of X and Y are outside of the remit of the fixed-effects model coefficients. Fixed-effects
models have one advantage and one disadvantage in this respect (see Table 3 for a comparison with
random-effects models).
The advantage is that they measure the overall growth effects of each causal factor in the model whilst
allowing for the very different starting levels of GDP of the various countries. The starting level of
GDP (or, to be precise, the grand mean of log of GDP per capita over the whole period) works its way
into country-specific error terms in the fixed-effects equations. These can be analysed in their own
right, but are left as controls in this paper. The overall structure of the world economy 1982-2002 is
revealed in the country-specific error terms. A separate residual error term for each country in each
year was randomly distributed relative to the dependent variable (no heteroskedasticity). There was no
problem of errors being associated with particular explanatory variables, once the instrumental
variables approach had been used. I found a low association of the overall residual error term from the
fixed-effects equations with the dependent variable, log of GDP per capita. The fixed-effects models
thus performed well.
The disadvantage of fixed-effects models is that one cannot put a constant term into them if that
constant is not changed over the whole period of time. The political orientation of country
governments, their region or OPEC membership, and the starting-point level of GDP all must be left
out of the equation. These constants would be hidden in the time-series results and will get little
attention here. Authors such as Plumper and Martin (2003) use overall grand mean models, instead of
time-series models, to good effect and in that context the constant values can be included. They tend to
show important causal factors over a 40-year period, and not distinguishing between changes in these
patterns, whereas this paper is focusing on causal factors over the shorter term of a decade or so.
In the time-series models, the year of the survey (which enters as the decadal time points 1982, 1992
and 2002) is put in as an independent variable. By controlling for time, the overall average growth rate
is weeded out of the model. The remaining variation across countries reflects their individual relative
economic growth rates. The error term includes any residual not explained by (or at least not
associated with) the independent variables.

10
The economic variables present in growth models include investment, labour inputs, and the
educational qualifications of labour. The investment rate (gross capital formation as a percent of GDP)
includes any form of investment – public, private, or foreign investment. However, records of foreign
direct investment show it to have a low but positive association with gross capital formation. Both
variables are used here, so that foreign investment can be tested for having a separate effect on growth.
Labour inputs are measured in the basic model using the economic activity rate of people aged 15 and
over. The educational qualifications of these workers are measured using the attainment levels
estimated by Barro and Lee (2001) and made available online (sources are listed in Appendix 2).
Attainment is measured as the average years of education of the population over age 15. These
attainment levels were provided on a five-yearly basis, and I have utilised the decadal time points. Up
to 1995 these were estimates with interpolation, but for 2000 they were forecasts. Barro and Lee have
created the best data on attainments in the world, even with caveats about estimation and extrapolation.
Comparisons with UNESCO data on attainments showed limited coverage, especially going back into
earlier decades, in the published UNESCO data sets. Barro and Lee themselves utilised a wide range
of sources including UNESCO so the estimates are consistent with that source.
Barro and Lee provided attainments data for each gender, as well as overall. The basic growth model is
then augmented using measures of attainment among women, relative to the level among men. This
ratio is positively but not highly correlated with the overall attainment ratio.
Alternative measures of human capital might include literacy rates and enrolment rates. Close
examination of literacy rates showed that they are not always available for the two genders separately,
so coverage (from UNESCO) was not as good as Barro‟s attainments data. The enrolments data are
provided in rich detail by UNDP in its annual Human Development Report, but this source does not
cover the earlier decades of the 1970s and 1980s. These variables are not used here.
The augmentation of the model with democracy variables took three stages. First, the democracy
indicator used by Barro was created by averaging the political rights scale and the civil liberties scale
created by Gastil (Freedom House indices; see Appendix 2.) Secondly, the involvement of women in
public democratic processes was measured by the proportion of women in parliament. This variable‟s
mean has risen overall for four decades, but still there is considerable variation from country to
country. Thirdly, curved variants are measured by allowing the variables‟ squared values to enter the
regressions.
The study of gendered employment began by modifying the economic activity rate to consider
women‟s activity rate. However, when using data from the International Labour Office (ILO Laborsta
database), many countries‟ data are selectively unavailable. A new database, the United Nations
Common Database (accessed via www.esds.ac.uk), has compiled all available UN data and developed
estimates which (like Barro) use a mixture of interpolation, estimation and extrapolation to fill all
available dates with the ILO‟s best estimates. The female economic activity rate is presented there in
the form of the proportion of the workforce that is female (ages 15+; variable code 4270). This
proportion rises above 50% in some countries in some years. Job quality among women is measured
by the percentage of all the higher ISCO categories‟ workers that are female. This variable is the
percent of all professional, administrative, managerial and technical workers in ISCO categories 1 to 3
that are female. Unfortunately it is not widely available so only 44 countries have the full time-series
data for this variate.

11
Controls for the rate of population growth (annual rate at the decadal time-points 1972, 1982, 1992,
2002) and the level of fertility (births per woman on average at the decadal time-points) were included
in each regression. These results were rather surprisingly not significant in most cases.
The Regressions
Time-series regressions with fixed effects are used in Tables 4 to 7. These regressions effectively
allow for country dummies. Hausman-Wu tests indicated that a random effects model would differ
substantially from the fixed-effects models even after instruments compensated for endogeneity. On
grounds of consistency the fixed-effects models are preferred. A random effects model – illustrated in
Table 3 for completeness – would wrongly assume all observations over time to be independent of each
other. This pushes up the r-squared values, but is still an invalid assumption.
The Figures
Illustrations of the movement of the dependent variables are provided in Figures 1 and 2. These are,
however, annual data whereas the regressions use panel data for decadal time-points. Only the growth
variables are decadal summary variables. The GDP per capita (logged) is a snapshot at each time-
point. Figures 3 and 4 illustrate how regression can tease out a positive association from the time-
series data, in spite of the fact that gross overall figures suggest no association at all. Thus descriptive
statistics in Figure 3 are contrasted with the use of regression predictions in Figure 4 to discover
underlying causal mechanisms. The latter method is shown to be worthy of attention. A caveat must be
applied, however, that the association of two variables – in this case growth and women‟s
predominance in the labour force – does not simply or necessarily imply that one causes the other.
Behind this association are complex country-level scenarios in which women‟s work can be either
„counted‟ or not counted, recorded or not recorded, high-paid or low-paid. Depending on these
measurement and reward factors, as well as the underlying human capital and production technologies,
there is a positive net association between the two factors in a regression context.
Findings
In Table 3 a growth model is presented and the underlying investment relationship is shown. The
lagged GDP affecting investment has a negative sign. This suggests that poorer economies (in GDP
per capita) that have GDP per capita which is low tend to have higher investment rates (as a proportion
of total GDP). Once an economy is rich in per-capita GDP terms, this effect disappears, and the
investment rate can be low as a percent of GDP. Using „growth rate‟ as a dependent variable, one can
examine the factors associated with this phenomenon, but the results in Columns 3-4 of Table 3 are not
promising. Contradicting Barro (1998), there is a low correlation of decadal growth rates with almost
every independent variable. Investment overall and foreign direct investment, however, do have
positive associations with growth rates of per-capita income.
In turning to the use of the level of per-capita GDP to measure the factors causing growth, I move away
from a model of acceleration and toward a model of growth per se (Columns 1 and 2 of Table 3). A
positive coefficient indicates that the rise in an independent variable causes a higher the level of GDP
per capita. Thus growth would be increased (but not accelerated) by a rise in human capital, as column
1 of Table 3 shows (cf. Column 3). The acceleration of growth would happen later, after a lag, if
12
growth then caused a rise in investment which in turn created more growth, and if no counteracting
factor offset this tendency.
In this model, the level of attainments is statistically significant and positive. Each year of education
attained (on average) is associated with a .09 rise in the log of GDP. This is a large effect because a .09
rise in mean log GDP would imply a doubling of GDP for an average country. A rise of .09 on a mean
of 7.4 brings the level to 8.066, and after unlogging these numbers, GDP per capita rises from
$1635/year to $3184/year. Average attainments actually rise more slowly than this because of the
predominantly older populations with low levels of schooling. Nevertheless the strong positive
coefficient tends to reaffirm that human capital is an important component affecting growth rates.
A random-effects version of this model gives even stronger results but makes the invalid assumption
that the observations are independent for each country between the decades.
An important result from this basic model is that the economic activity rate is not associated with the
growth rate. It is neither positive nor negative, just as fertility rates and population growth rates have
no statistically significant association with the growth outcomes.
Turning to Table 4, the educational attainment effect is tested to find whether gender-sensitive
measurement improves the fit or offers additional explanatory power. The results are negative for
attainments. Tests of female attainments (not shown here) and of the ratio of female to male
attainments both suggest that rising girls‟ and women‟s attainments are not closely associated with
higher growth rates. However there have been large increases in these attainments over time.
Attainments as well as enrolments tend to stop rising once their average levels reach the highest levels
found in high-income countries. Therefore there are difficulties in discerning the impact of increasing
women‟s education. Ironically, increases are concentrated (over the decades 1970-2000) among the
lowest income countries. The insignificance of the result for this time period 1972-2002 contradicts the
negative (and significant) coefficient that has been found in some other studies.
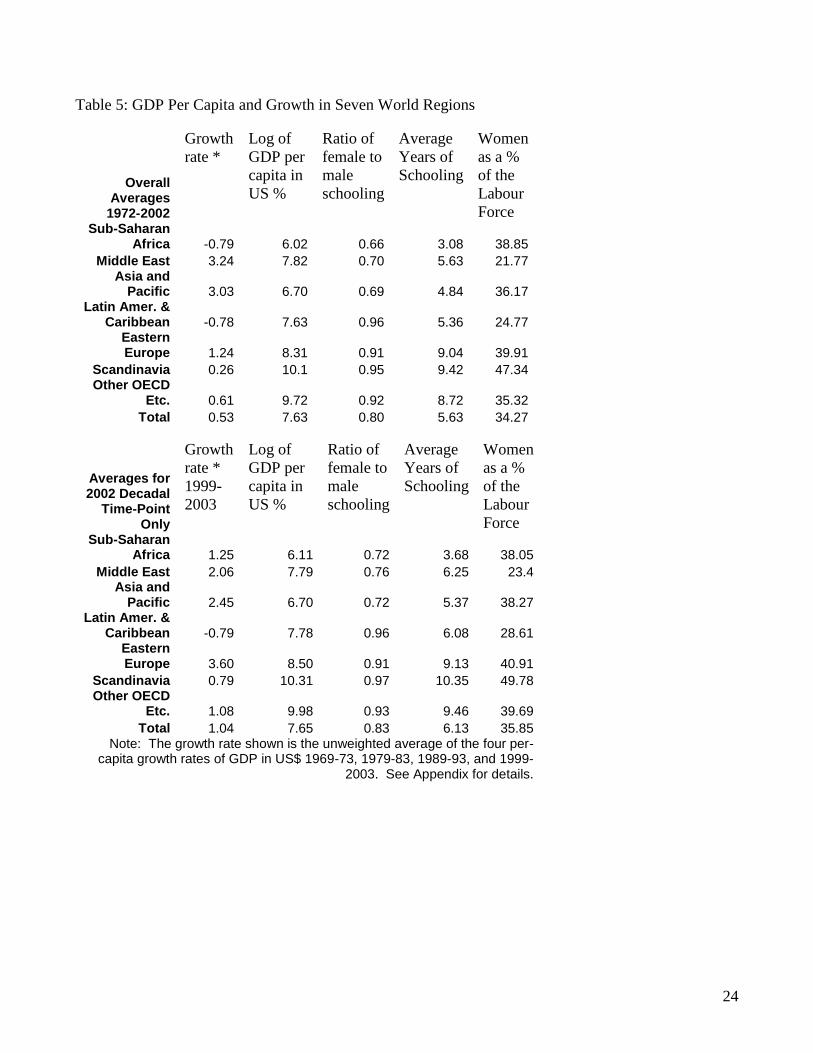
Table 5 illustrates the differences in attainments (both overall, and for females relative to males) in
each region of the world. Regions have large differences in log GDP per capita which tend to be
associated with low levels of schooling and a low ratio of female to male attainments. Furthermore,
Table 5 shows that the legacy of historical trajectories creates poor performance in Sub-Saharan Africa
on the GDP per capita indicator, whilst the Middle East has experienced rapid increases in GDP per
capita (ie rapid growth) over this period in spite of low attainments and very low female labour force
participation. Variation away from the means of all countries is vast.
Table 7 (in an Appendix) shows the results of adding democracy to the model.
A test of political factors shows that for political rights and civil liberties, a curved fit works best, as
Barro and Plumper and Martin (2003) suggest. The relationship is falling, then rising with GDP. This
U curve may have reverse causality since economic growth can affect the capacity to afford and
manage public democratic processes, whilst democracy itself may have impacts on growth rates. I
tested whether the percentage of women in parliament appears associated with growth. Using various
combinations of variables, the impact of women in parliament on growth seems to be insubstantial. It
is also noticeably not negative.

13
Table 6 adds a gender-sensitive measure of economic activity to the overall model. The democracy
indicator used by Barro is retained, and the overall level of economic activity of people aged 15+ is still
„in‟ the model but not significant. The level of employment of women, measured here as the percent of
the labour force that is female, is significantly positive in its association with growth. A rising level of
women‟s employment, compared with men, is found along with higher growth rates. The types of
„employment‟ included in this measure are employees, salaried workers, casual workers, farmers, self-
employed and contingent workers. However the unpaid workers and domestic workers are not
considered to be employed. In other words it is a broad measure of paid employment. (See Appendix
2 for details.) For women‟s employment to be associated with higher growth rates, there must be either
rising human capital in women‟s jobs, or else technical change associated with women‟s employment.
Further research will need to explore the causes behind the finding in Table 6, Column 1. This result is
illustrated using Figures 3 and 4.
In Figure 3, the original gross relationship of women‟s employment (as a percent of the labour force)
with per-capita GDP is depicted. All points from all 3 decades 1982, 1992, 2002 are plotted together.
In Figure 4 the predictions from the regression are plotted. Here a positive association emerges.
Various other factors have masked this association in the Figure 3 plot.
A further exploration of the data set attempts to examine whether high-quality jobs among women –
taken as the ISCO categories 1, 2, and 3 – are the real causal factor behind the result in Table 6.
However, only 44 countries could be included in this estimate. Many important countries were left out
due to missing data. The attainment variable is insignificant in the equation for this reason, and the
results are disappointing. Further research on this topic will require a concerted effort to fill in gaps in
the ILO datasets.
Discussion
Overall, two competing interpretations of the main growth model results vie for attention. One
interpretation would be that the new data for 2002, which include Barro‟s variables for democracy and
attainments and a variety of other sources of data, have created a new situation in which Barro‟s older
models no longer fit. This interpretation could help explain the lack of significance of women‟s
fertility in the growth models. By placing the Barro and Lee models into a pluralist context and
updating the data to 2002, I have made it possible to open up such questions.
The competing interpretation is that the model of Barro and Lee only accounted for human capital and
other factors in gender-blind ways. By creating gender sensitivity in critical parts of the model, a new
explanation of growth rates begins to emerge. Further research will be needed to explore the
interaction of the gendered variants of employment variables with other conditions within particular
countries. Notably the policies that influence women‟s employment rates – and new measurement
practices that place self-employment, family labour, and unpaid contributing labour in small businesses
“inside” the labour force rather than out of it – will be seen as important parts of the explanation of why
women‟s employment appears to be causing higher growth rates. Example of policies that induce
women into employment include flexible and cheap child care; flexibility about working hours (some
countries still discourage part-time working whereas in western countries part-time work is a crucial
area for women‟s employment); and strengthening the inducements to keeping girls in school.

14
Educational policy interweaves with employment policy when it comes to girls‟ school careers and
work trajectories. The more schooling they have, the more likely they are to work in „employment‟
rather than in private domestic care-work alone.
The growing tendency to measure „unpaid family labour‟ in small businesses as if the person was
actually „in‟ the labour force clouds the picture by changing the measurements used in the time series
data. Nevertheless, these changes of measurement are inevitable re-interpretations. Through these
changes, the data sets catch up with the growing recognition that women make important contributions
to national commercialized production. The data for countries with large farming systems, whose
industrial output is a smaller percentage of total GDP, are more affected by such changes. The ILO
data on women‟s employment used here are compiled using a wide variety of sample surveys, censuses
and other means of making estimates within each country. (Sources are described in detail on the
Laborsta database.) The data may not be perfectly comparable across countries. By comparison, data
on attainments is likely to be a more accurate, consistent and coherent measure of formal schooling
over time. Thus there are several weak points in the data used in the regressions of which the
employment-rate data is a major one.
Complementing both interpretations is the possibility that factors in Sub-Saharan African countries
have radically changed the causal configurations that explain growth in the recent period (UNDP
2005). In descriptive statistics for 2002, the levels of women‟s empowerment in some Sub-Saharan
African countries appeared as a high outlier on graphs of regional average attainment and the Human
Development Indicator. (See appendix Figures 5 and 6. The schooling attainments of women in Sub-
Saharan Africa appear to be above the main line of best fit of the rest of the world. The proportion of
parliament that is female is also above what would be expected, given the Human Development Index
level, in many Sub-Saharan African countries.) Whereas its poverty levels would tend to imply low
levels of women’s empowerment (and low percentages of parliament that are female), the actual data
for some Sub-Saharan African countries deviate upward from this expectation. Causal models of the
female percentage of parliament have used GDP per capita and female literacy rates or education as
explanatory factors (Paxton, et al., 2003; Kenworthy and Malami, 1999; Paxton and Kunovitch, 2003).
The situation in most of Sub-Saharan Africa is dire, yet it is also rather better than might be expected as
far as women‟s education goes. (This phrase „rather better‟ depends on comparing individual countries
with a line of best fit across all countries.) the results suggest that raising women‟s education levels in
Sub-Saharan Africa would have a noticeable effect on these countries growth rates, ceteris paribus.
The growth rates in these countries have been low (Table 5). The UNDP suggests that the HIV virus
and associated morbidity have had a noticeable negative impact on GDP levels (UNDP, 2005). Cross-
sectional statistical tests using a dummy for the level of HIV infection (0 for low, and 1 for levels of
5% or greater of the population, which 18 countries had reached in 2002) were not conclusive. No
statistical significance was found. Nevertheless it is important to decide whether the first or second
interpretation of the emerging pattern is correct.
The evidence makes me favour the second interpretation. Gendering employment in the Barro model
improves the model and would cause us to revise our interpretations of the older Barro estimates. The
results are not different merely because of the inclusion of 2002 data. Gendering part of the model also
made it reasonable to test for gender-differentiated effects in the rest of the model. For educational

15
attainments and for public political democracy there was no evidence of a gender-specific association.
The results in the main economic part of the model were quite stable whilst these other tests were being
carried out.
The role of fertility has disappeared. Tests were also run with and without population growth rates. It
made little difference whether these demographic factors were included. Demography matters very
much because it influences the employment rates and the economic activity rates. These rates must be
calculated carefully. If the people over 64 are excluded from the denominator but are often working –
as in many low-income countries – economic activity rates will typically exceed 100%. After all, many
children are economically active but the workforce is considered (here, and elsewhere) to include only
those of age 15 or 16 and over. High economic activity rates were observed in some poor countries
which have low GDP per capita.
The results suggest that gender-blind research needs much improvement to make it gender-sensitive.
Indicators are available for serious analysis of secondary data on gender and economic growth. The
strengths and weaknesses of specific indicators have made the analysis rather more narrow and focused
than one might wish. Future research could attempt to explore the links over time and between
generations between education policy, educational attainments, labour force participation and growth.
So far we found that whilst human capital matters to growth, there are particular gender differences that
matter especially. More research along these lines is called for.

16
References
Abadian, Sousan (1996) „Women‟s autonomy and its impact on fertility‟, World Development, 24, 12,
1793-1809.
Abu-Ghaida, Dina and Stephan Klasen (2004) „The costs of missing the Millennium Development
Goal on gender equity‟, World Development, 32, 7, 1075-1107.
Afshar, Haleh (ed) (1996) Women and Politics in the Third World. (London: Routledge).
Agarwal, Bina (1997) „Editorial: Resounding the alert – Gender, resources and community action‟,
World Development, 25, 9, 1373-80.
Aghion, P., E. Caroli, et al. (1999). "Inequality and Economic Growth: The Perspective of the New
Growth Theories." Journal of Economic Literature 37(4): 1615-1660.
Ainsworth, Martha, Kathleen Beegle and Andrew Nyamete (1996) „The impact of women‟s schooling
on fertility and contraceptive use: A study of fourteen Sub-Saharan African countries‟, The
World Bank Economic Review, 10, 1, 85-122.
Anker, Richard (1998) Gender and Jobs: Sex Segregation of Occupations in the World. (Geneva:
International Labour Office).
Bakker, Isabella (1998) Unpaid Work and Macroeconomics: New Discussions, New Tools for Action.
(Ottawa, Canada: Status of Women Canada).
Bakker, Isabella (ed.) (1994) The Strategic Silence: Gender and Economic Theory. (London: Zed
Press).
Barro, R. J. (2000). "Inequality and growth in a panel of countries." Journal of Economic Growth 5(1):
5.
Barro, R. J. and J.-W. Lee (2001). "International Data on Educational Attainment: Updates and
Implications." Oxford Economic Papers 3: 541-563. See also: Barro, Robert, and Jong-Wha
Lee (2000) “International Data on Educational Attainment: Updates and Implications”, working
paper, Harvard CID, available online. Data accessed at:
http://www.cid.harvard.edu/ciddata/ciddata.html, last accessed June 20, 2005.
Barro, Robert J. (1991) „Economic growth in a cross-section of countries‟, The Quarterly Journal of
Economics, May, 407-443.
Barro, Robert J. (1996) „Democracy and growth‟, Journal of Economic Growth, 1, 1-27.
Barro, Robert J. (1998) Determinants of Economic Growth: A Cross-Country Empirical Study.
(Cambridge, Mass.: MIT Press).
Barro, Robert J. and Jong-Wha Lee (1994) „Sources of economic growth‟, Cearnegie-Rochester Series
on Public Policy, 40, 1-46.
Barro, Robert J. and Jong-Wha Lee (1996) „International measures of educational attainment‟,
American Economic Review, 86, 218-23.
Barro, Robert J. and Jong-Wha Lee (2000) „International data on educational attainment: updates and
implications‟. CID Working Paper No. 42, Harvard University, April 2000.
Barro, Robert J. and Racehl M. McCleary (2003) „Religion and economic growth across countries‟,
American Sociological Review, 68, 760-781.
Barro, Robert J. and Xavier Sala-i-Martin (1995) Economic Growth. (New York: McGraw-Hill).
Becker, Gary S. (1981) A Treatise on the Family. (Cambridge, Mass.: Harvard University Press).
Becker, Gary S. (1993) Human Capital: A Theoretical and Empirical Analysis with Special Reference
to Education. 3rd
edition. (Chicago: Chicago University Press).
Benavot, Aaron (1989) „Education, gender, and economic development: A cross-national study‟,
Sociology of Education, 107, 682-714.
Bergmann, Barbara R. (1986) The Economic Emergence of Women. (New York: Basic Books).

17
Berkovitch, Nitza (1999) From Motherhood to Citizenship: Women’s Rights and International
Organizations. (Baltimore: John Hopkins University Press).
Bhaduri, A. (1986). "Forced Commerce and Agrarian Growth." World Development 14(2): 267-272.
Blau, Francine D. and Lawrence M. Kahn (1996) „Wage-structure and gender earnings differentials:
An international comparison‟, Economica, 63, S29-S62.
Blau, Francine D. and Lawrence M. Kahn (2003) „Understanding international differences in the
gender pay gap‟, Journal of Labor Economics, 21, 1, 106-144.
Bollen, Kenneth A. and Robert W. Jackson (1995) „Income inequality and democratization revisited‟,
American Sociological Review, 60, 983-89.
Bornschier, Volker and Hanno Scholtz (2002) „Democracy, economic growth and techno-economic
change‟. Paper presented to ISA conference, Brisbane, July.
Boserup, Ester (1970) Women’s Role in Economic Development. (New York: St Martin‟s Press).
Bruetti, Aymu (1997) Politics and Economic Growth: A Cross-Country Data Perspective. (Paris:
OECD Development Centre Studies).
Çagatay, N. and S. Özler (1995) „Feminization of the labor force: The effects of long-term
development and structural adjustment‟, World Development, 23, 11, 1883-894
Çagatay, Nilüfer and Günseli Berik (1994) „What has export-oriented manufacturing meant for Turkish
women?‟ in Pamela Sparr (ed.) Mortgaging Women’s Lives: Feminist Critiques of Structural
Adjustment. (London: Zed Press).
Çagatay, Nilüfer, Diane Elson and Caren Grown (1995) „Introduction‟, World Development, 23, 11,
1827-1836.
Collier, P., D. Dollar (2002) Globalization, Growth, and Poverty. World Bank/ Oxford.
Crompton, R., M. Brockmann, et al. (2005). "Attitudes, women‟s employment and the domestic
division of labour: a cross-national analysis in two waves." Work Employment and Society 19:
211-231.
Deininger, Klaus and Lyn Squire (1996) „A new data set measuring income inequality‟, The World
Bank Economic Review, 10, 1, 565-91.
Diamond, Larry (1992) „Economic development and democracy reconsidered‟, in G. Marks and L.
Diamond (eds) Reexamining Democracy. (Newbury Park, CA: Sage).
Dollar, David and Roberta Gatti (1999) Gender Inequality, Income, and Growth: Are Good Times
Good for Women? World Bank Development Research Group. Gender and Development
Working Paper Series No. 1. (Washington: World Bank).
Dow, S. (1997). Methodological Pluralism and Pluralism of Method. Pluralism in Economics: New
Perspectives in History and Methodology. A. Salanti, and Ernesto Screpanti. Cheltenham, UK
and Brookfield, US, Edward Elgar: 89-99.
Dow, S. (2004). "Structured Pluralism." Journal of Economic Methodology 7(3).
Ellis, F. (1993). Peasant economics: farm households and agrarian development. Cambridge, England,
Cambridge University Press.
Elson, Diane (1995) „Gender awareness in modeling structural adjustment‟, World Development, 23,
11, 1851-1995.
Elson, Diane (ed.) (1991) Male Bias in the Development Process. (Manchester: Manchester University
Press).
Ersson, Svante and Jan-Erik Lane (1996) „Democracy and development: A statistical exploration‟ in
Adrian Leftwich (ed.) Democracy and Development. (Cambridge: Polity Press).

18
Fevre, R., G. Rees, and S. Gorard (1999). "Some sociological alternatives to hman capital theory and
their implications for research on post-compulsory education and training." Journal of
Education and Work 12(2): 117-140.
Forbes, Kristin J. (2000) „A reassessment of the relationship between inequality and growth‟, American
Economic Review, 90, 4, 869-887.
Forsythe, Nancy, R. P. Korzeniewicz and V. Durrant (2000) „Gender inequalities and economic
growth‟, Economic Development and Cultural Change, 573-617
Freedom House (2002) Freedom Country Ratings www.freedomhouse.org/ratings/
Galor, Oded and David N. Weil (1996) „The gender gap, fertility and growth‟, American Economic
Review, 86, 3, 374-387
Gastil, Raymond D. (1982) Freedom in the World. (Westport, Conn.: Greenwood).
Gillie, Halvor „Social and economic implications‟ in John Cleland and Chris Scott (eds) (1987) The
World Fertility Survey: an Assessment. (Oxford: Oxford University Press). Pp. 986-1010.
Grown, Caren, Diane Elson and Nilüfer Çagatay (2000) „Introduction‟, World Development, 28, 7,
1145-1156.
Hall, Peter A. and Soskice, David (eds) (2001) Varieties of Capitalism: The Institutional Foundations
of Comparative Advantage. (Oxford: Oxford University Press).
Haxton, Eva and Claes Olsson (eds) (1999) Gender Focus on the WTO. (Uppsala, Sweden: Global
Publications Foundation).
Hobcraft, John (1987) „The proximate determinants of fertility‟ in John Cleland and Chris Scott (eds)
The World Fertility Survey: an Assessment. (Oxford: Oxford University Press), pp. 796-837.
Hollingsworth, J. Rogers and Robert Boyer (eds) (1997b) Contemporary Capitalism: The
Embeddedness of Institutions. (Cambridge: Cambridge University Press).
Huber, Evelyne and John D. Stephens (2000) „Partisan governance, women‟s employment, and the
social democratic service state‟, American Sociological Review, 65, 323-342.
Huber, Evelyne and John D. Stephens (2001) Development and Crisis of the Welfare State: Parties and
Policies in Global Markets. (Chicago: Chicago University Press).
International Labour Office (2001) Yearbook of Labour Statistics. (Geneva: ILO).
Inter-Parliamentary Union (1995) Women in Parliaments: 1945-1995. (Geneva: IPU).
IPU (2002) Women in National Parliaments. http://www.ipu.org/wmn-e/world.htm
Kemp, S. and J. Holmwood (2003). "Realism, Regularity and Social Explanation." Journal for the
Theory of Social Behaviour 33(2): 165-187.
Kenworthy, Lane and Melissa Malami (1999) „Gender inequality in political representation: A
worldwide comparative analysis‟, Social Forces, 78, 1, 235-269.
Klasen, Stephan (1999) Does Gender Inequality Reduce Growth and Development? World Bank.
Klasen, Stephan (2002) „Low schooling for girls, slower growth for all? Cross-country evidence on the
effect of gender inequality in education on economic development‟, The World Bank Economic
Review, 16, 3, 345-373.
Lawson, T. (1997). Economics and reality. London; New York, Routledge.
Lawson, T. (2003) Reorienting Economics. (London: Routledge).
Leftwich, Adrian (1996b) „On the primacy of politics in development‟ in Adrian Leftwich (ed.)
Democracy and Development Theory (Cambridge: Polity Press).
Leftwich, Adrian (2000) States of Development: On the Primacy of Politics in Development.
(Cambridge: Polity).
Leftwich, Adrian (ed.)(1996a) Democracy and Development Theory (Cambridge: Polity).

19
Lorgelly, Paula K. (2000) Are there gender-separate human capital effects on growth? A review of the
recent empirical literature. Centre for Research in Economic Development and International
Trade (CREDIT) Research Paper No. 00/13, University of Nottingham.
Lorgelly, Paula K. and P. Dorian Owen (1999) „The effect of female and male schooling on economic
growth in the Barro-Lee model‟, Empirical Economics, 24, 537-557.
Lovenduski, Joni and Pippa Norris (ed.) (1993) Gender and Party Politics. (Sage).
Manza, Jeff and Clem Brooks (1998) „The gender gap in US elections‟, AJS, 103, 5, 1235-66.
Macrae, S. (1993). "Returning to Work after Childbirth - Opportunities and Inequalities." European
Sociological Review 9(2): 125-137.
Macrae, S. (2003). "Constraints and choices in mothers' employment careers: a consideration of
Hakim's preference theory." British Journal Of Sociology 54(3).
Moser, Caroline, O.N. (1993) Gender Planning and Development. (London: Routledge).
Muller, Edward N. (1995a) „Economic determinants of democracy‟, American Sociological Review, 60,
966-982.
Muller, Edward N. (1995b) „Income inequality and democratization: Reply to Bollen and Jackman‟,
American Sociological Review, 60, 990-996.
Murphy, Josette L. (1995) Gender Issues in World Bank Lending. (Washington, DC: World Bank).
Ng, C. (1999). Positioning women in Malaysia: class and gender in an industrializing state.
Basingstoke, Macmillan.
Olsen, W. K. (2006). "Pluralism, Poverty, and Sharecropping: Cultivating Open-Mindedness in Poverty
Studies." Journal Of Development Studies forthcoming.
Olsen, W. K. and J. Morgan (2005). "A Critical Epistemology of Analytical Statistics: Addressing the
Sceptical Realist." Journal for the Theory of Social Behaviour 35(3): 255-284.
Paxton, Pamela and Sheri Kunovitch (2003) „Women‟s political representation: The importance of
ideology‟, Social Forces, 82, 1, 87-113.
Plumper, T. and C. W. Martin (2003). "Democracy, Government Spending, and Economic Growth: A
Political-Economic Explanation of the Barro-Effect." Public Choice 117(1-2): 27.
Rai, Shirin M. (ed.) (2003) Mainstreaming Gender, Democratising the State? Institutional
Mechanisms for the Advancement of Women. (Manchester: Manchester University Press).
Rama, Martin (1997) „Organized labour and the political economy of product market distortions‟
World Bank Economic Review, 11, 2, 327-355.
Ramirez, F.O., Y. Soysal, S. Shanahan (1997) 'The changing logic of political citizenship' American
Sociological Review, 1997, 62, 735-745.
Rankin, Katharine N. (2001) „Governing development: Neoliberalism, microcredit, and rational
economic woman‟, Economy and Society, 30, 1, 18-37.
Rice, Patricia (1999) Gender Earnings Differentials: The European Experience. Policy Research
Report on Gender and Development Working Paper Series No. 8. (Washinton DC: World
Bank).
Rostow, W. W. (1958). The Take-Off into Self-Sustained Growth. The Economics of
Underdevelopment. A. N. Agarwala and S. P. Singh. Delhi, Oxford University Press: 154-186.
Rubery, J. (1998). Women and European employment. London; New York, Routledge.
Rueschemeyer, D., E.H. Stephens, J. D.Stephens (1992) Capitalist Development and Democracy.
(Cambridge: Polity).
Sayer, A. (1992 (orig. 1984)). Method in Social Science: A Realist Approach. London, Routledge.

20
Seguino, Stephanie (2000) „Accounting for gender in Asian economic growth‟ Feminist Economics, 6,
3, 27-58.
Solow, R., M. (2001). "Applying growth theory across countries." The World Bank Economic Review
15(2): 283.
Sparr, Pamela (ed.) (1994) Mortgaging Women’s Live. (London: Zed Press).
Standing, Guy (1989) 'Global feminization through flexible labour' World Development, 17, 7, 1077-
95.
Standing, Guy (1999) Global Labour Flexibility: Seeking Distributive Justice. (Basingstoke:
Macmillan).
Subbarao, K. and Laura Raney (1995) „Social gains from female education: A cross-national study‟,
Economic Development and Cultural Change, 44, 1, 105-128.
Tzannatos, Zafiris (1999) „Women and labor market changes in the global economy: Growth helps,
inequalities hurt and public policy matters‟, World Development, 27, 3, 551-569.
UNDP (2002) Human Development Report 2002. (New York: Oxford University Press).
UNDP (2005) Human Development Report 2005. (New York: Oxford University Press).
Walby, S., and W. Olsen, 2005a, “Is economic growth good for women? Gendered professional and
managerial jobs and economic development”, mimeo, submitted 2005, to World Development.
Walby, S., with W. Olsen, 2005b, “Gendering Democracy Globally”, submitted 2005, to American
Journal of Sociology.
Walby, Sylvia (1997) Gender Transformations. (London: Routledge).
Walby, Sylvia (2000) „Gender, globalization and democracy‟, Gender and Development, 8, 1, 20-28.
Walby, Sylvia (2005) „Measuring the progress of women in a global era‟, International Social Science
Journal, September, 543-559.
World Bank (1992) Governance and Development. (Washington DC: The World Bank).
World Bank (2001) Engendering Development. (Washington DC: The World Bank).
World Bank (2004) World Development Indicators 2004. (Washington DC: The World Bank).

21
Table 1: Average Levels of Growth, Educational Attainment and Other Factors, 2002 Mean
(N=73) Mean (All Countries)
Standard Deviation (All Countries)
Units
GDP Per Capita 7.62 7.5 1.59 Logged, US$1995
Investment 21.7 22.1 9.21 Percent of GDP
Attainment 5.6 6.1 2.84 Years of Schooling
Fertility (Log) 1.15 1.01 .512 Births Per Woman
FDI 7.9 16.7 28.4 Percent of GDP
Pop. Growth 1.7 1.4 1.11 Annual Rate
Economic Activity Rate .66 .69 .117 Percent of Population in Labour Force
Trade 67.4 84 41.5 Exports and Imports as Percent of GDP
Democracy 4.9 4.6 1.97 Average of Two Scales Each 1-7
Attainment, F/M Ratio .80 .83 .199 Ratio of Female to Male Years of Schooling
Women in Parliament 11.7 13.4 9.70 Percent of Total in Lower House
Women in Labour Force
34.3 36.8 10.39 Percent of Total Labour Force
Sources: See Appendix 2.
Table 2: Change Over Time in Levels of Income, Education, Employment, Democracy and Other
Factors, 1972-2002 Mean (All Countries)
1972 1982 1992 2002 All Years
GDP Per Capita 7.3 7.4 7.4 7.5 7.4
Investment 21.0 25.1 22.4 22.1 22.7
Attainment 4.0 4.7 5.4 6.1 5.1
Fertility (Log) 1.5 1.4 1.2 1.0 1.3
FDI 5.1 4.2 9.2 16.7 9.5
Pop. Growth 2.2 2.1 1.8 1.4 1.9
Economic Activity Rate
.66 .66 .66 .69 .67
Trade 53.7 71.9 76.3 84.4 73.1
Democracy 3.7 3.8 4.4 4.6 4.1
Attainment, F/M Ratio .71 .75 .79 6.1 .77
Women in Parliament 6.1 9.2 9.0 13.4 9.9
Women in the Labour Force
30.4 32.6 34.4 36.8 33.6
Sources: See Appendix 2.

22
Table 3: Factors Associated With Growth in Per-Capita Income Over 1972-2002 Growth Models Acceleration Models Endogenous
Variable
Dependent Variable
Log of Per-Capita GDP
Log of Per-Capita GDP
Growth Rate of Per-Capita GDP
Growth Rate of Per-Capita GDP
Investment Ratio (Percent of GDP)
Column no. (1) (2) (3) (4) (5)
Estimation Method
Fixed Effects
Random Effects
Fixed Effects Random Effects
Fixed Effects
Investment .006(.003)** .008(.003) ** .208(.047)*** .157(.028)*** nim
Attainment .093(.039)** .309(.032)*** -.982(.591)* -.29(.128)** -1.37(.964)
Fertility (Log) -.029(.162) -.734(.173)*** -2.577(2.46) -2.74(1.07)** -2.76(3.96)
FDI -.002(.001) -.002(.002) .074(.023)*** .024(.018) -.007(.041)
Economic Activity Rate
.167(.281) -.397(.311) 2.900(4.268) 1.73(1.69) Nim
Trade nim Nim nim nim .056(.025)**
Lagged GDP per capita
nim nim nim nim -5.08(1.95)***
Significance of Whole Estimate
<1% *** <1% *** <1% *** 3% ** F of regression 4.14 with 7 and 156 d.f.
Wald Chi-Squared
365361 299.8 65.54 15.31
R-Squared Overall
.62 .82 .13 .21 .001
Number 84 84 84 84 94
Columns 1 to 4 have investment as the endogenous variable in a generalised
least squares instrumental variables fixed-effects estimate. Investment is
considered to be endogenous. Trade, logged GDP in 1982, and lagged gdp per
capita have been used as instruments in two-stage least squares regression
in these columns. Controls for year and population growth rates were put in
all equations.
Note: *** means <1% significance, ** means <5% significance, and * means <10% significance.
Figures in brackets are standard errors. NIM = not in model.
Table 4: Gendered Growth Outcomes and Gender-Sensitive Educational Attainments Estimation Method
Fixed Effects
Fixed Effects
Investment .006(.003)* .004(.003)
Attainment .092(.039)** nim
Fertility (Log) -.054(.170) -.123(.171)
FDI -.002(.002) -.002(.002)
Economic Activity Rate
.182(.283) .194(.288)
Attainment Ratio (Female to Male Percent)
-.139(.287) -.167(.291)
Significance of Whole Estimate
<1% *** <1% ***
Wald Chi-Squared
13594 350478

23
R-Squared Overall
.60 .003
N 84 84
Columns 1 to 4 have investment as the endogenous variable in a generalised
least squares instrumental variables fixed-effects estimate. Investment is
considered to be endogenous. Trade, logged GDP in 1982, and lagged gdp per
capita have been used as instruments in two-stage least squares regression
in these columns. Controls for year and population growth rates were put in
all equations. The dependent variable is the log of GDP per capita in
constant US$.
Note: *** means <1% significance, ** means <5% significance, and * means <10% significance.
Figures in brackets are standard errors. NIM = not in model.
24
Table 5: GDP Per Capita and Growth in Seven World Regions
Overall Averages
1972-2002
Growth
rate *
Log of
GDP per
capita in
US %
Ratio of
female to
male
schooling
Average
Years of
Schooling
Women
as a %
of the
Labour
Force Sub-Saharan
Africa -0.79 6.02 0.66 3.08 38.85
Middle East 3.24 7.82 0.70 5.63 21.77 Asia and
Pacific 3.03 6.70 0.69 4.84 36.17 Latin Amer. &
Caribbean -0.78 7.63 0.96 5.36 24.77 Eastern Europe 1.24 8.31 0.91 9.04 39.91
Scandinavia 0.26 10.1 0.95 9.42 47.34 Other OECD
Etc. 0.61 9.72 0.92 8.72 35.32
Total 0.53 7.63 0.80 5.63 34.27
Averages for 2002 Decadal
Time-Point Only
Growth
rate *
1999-
2003
Log of
GDP per
capita in
US %
Ratio of
female to
male
schooling
Average
Years of
Schooling
Women
as a %
of the
Labour
Force Sub-Saharan
Africa 1.25 6.11 0.72 3.68 38.05
Middle East 2.06 7.79 0.76 6.25 23.4 Asia and
Pacific 2.45 6.70 0.72 5.37 38.27 Latin Amer. &
Caribbean -0.79 7.78 0.96 6.08 28.61 Eastern Europe 3.60 8.50 0.91 9.13 40.91
Scandinavia 0.79 10.31 0.97 10.35 49.78 Other OECD
Etc. 1.08 9.98 0.93 9.46 39.69
Total 1.04 7.65 0.83 6.13 35.85 Note: The growth rate shown is the unweighted average of the four per-
capita growth rates of GDP in US$ 1969-73, 1979-83, 1989-93, and 1999-2003. See Appendix for details.

25
Table 6: Gendered Growth Outcomes and a Gender-Sensitive Employment Measure Estimation Method
Fixed Effects
Fixed Effects Fixed Effects
Column no. (1) (2) (3)
Investment .006(.003) **
.008(.002) *** .006(.003) **
Attainment .078(.039) **
.072(.034) ** .068(.040) *
Fertility (Log) .026(.154) .071(.145) -.039(.159)
FDI -.002(.001) -.002(.001) -.002(.002)
Economic Activity Rate
.064(.271) nim .230(.278)
Women in Labour Force
.021(.006) ***
.014(.006) ** Nim
Democracy -.176(.081) **
-.166(.070) ** -.231(.081) ***
Democracy Squared
.024(.010) **
.020 (.008) ** .029(.010) ***
Significance of Whole Estimate
<1% *** <1% *** <1% ***
Wald Chi-Squared
407177 453594 379484
R-Squared Overall
.45 .36 .66
N 83 93 84
Columns 1 to 4 have investment as the endogenous variable in a generalised
least squares instrumental variables fixed-effects estimate. Investment is
considered to be endogenous. Trade, logged GDP in 1982, and lagged gdp per
capita have been used as instruments in two-stage least squares regression
in these columns. Controls for year and population growth rates were put in
all equations. The dependent variable is the log of GDP per capita in
constant US$.
Note: *** means <1% significance, ** means <5% significance, and * means <10% significance.
Figures in brackets are standard errors. Column 1 (bold) indicates the regression used for Figures 3 and
4. NIM = not in model.

26
Figure 1: Movement of the Growth-Rate of Countries, Annual Rates, Over Time
Source: World Development Indicators 2004 CD Rom. They are the annual percentage growth of GDP per capita in 1995 (constant) US dollars, as reported in WDI for each year; unweighted averages.
Figure 2: Movement of the Level of Per-Capita Income in Real Terms Over Time
Movement of GDP Per Capita in Real Terms 1972-
2002
0
1000
2000
3000
4000
5000
6000
7000
8000
1971
1974
1977
1980
1983
1986
1989
1992
1995
1998
2001
Year
GD
P P
er
Cap
ita (
1995 U
S$),
Un
weig
hte
d
Avera
ge
Source: World Development Indicators 2004 CD ROM, all available countries; unweighted average.
Growth Rates of GDP Per Capita Over
1972-2002
-2
-1
0
1
2
3
4
1971 1973 1975 1977 1979 1981 1983 1985 1987 1989 1991 1993 1995 1997 1999 2001
Ra
te o
f G
row
th
(%)
Year

27
Figure 3: GDP‟s Gross Association with Women as a Percentage of the Labour Force, Raw Data, 1982-
2002
46
810
12
GD
P P
er
Capita (
Real D
ollars
, Logged)
0 20 40 60Females as a Percent of the Labour Force
Source: WDI. The actual values of logarithm of GDP per capita (in real
Figure 4: Net Effect of Women as a Percentage of the Labour Force on GDP, 1982-2002
77.5
88.5
Lin
ear
pre
dic
tion/F
itte
d v
alu
es
0 20 40 60Females as a Percent of the Labour Force - ILO Estimates
Linear prediction Fitted values
Source: the predictions from Table 6, Column 1, are graphed using the time-points 1982, 1992, and
2002.

28
Appendix 1: The Countries Included in the Regression in Table 6 (Column 1)
Argentina Malawi
Australia Malaysia
Austria Mali
Bangladesh Mauritius
Benin Mexico
Bolivia Mozambique
Botswana Nepal
Brazil Netherlands
Cameroon New Zealand
Central African Republic Norway
Chile Pakistan
China Panama
Colombia Paraguay
Congo Philippines
Dem. Rep. of the Congo Rwanda
Costa Rica Senegal
Denmark Sierra Leone
Dominican Republic
South Africa
Ecuador Spain
Egypt Sri Lanka
Finland Sudan
France Swaziland
Gambia Sweden
Germany Switzerland
Ghana Syrian Arab Republic
Greece Thailand
Guatemala Togo
Guyana Turkey
Honduras United Kingdom
Hungary United States
Iceland Zambia
India Zimbabwe
Indonesia
Islamic Rep. of Iran
Israel
Italy
Jamaica
Jordan
Kenya
Lesotho

29
Appendix 2: Data Sources
Name Label Definition Source
Country Country name within United
Nations system
Year Decadal time points 2002,
1992, 1982 and 1972
LogGDPpcPPP Log of GDP per
capita PPP
Logarithm of gross domestic
product per capita using
Purchasing Power Per Capita
US dollars.
WDI
LogGDPpc Log of GDP per
capita in
constant US$
Logarithm of gross domestic
product per capita using 1995
US dollars.
WDI
Growth Rate of growth
of per-capita
domestic
product
Annual growth rate of per-
capita gross domestic product
using 1995 US dollars,
calculated as an overall rate
over four years surrounding
the dates 1982, 1992, 2002.
The dates are 1979-83, 1989-
93, 1999-2003.
WDI
Gcap Gross capital
formation (%
GDP)
Gross capital invested as a %
of domestic product
WDI
Trade Trade (% of
GDP)
Exports plus imports as % of
GDP
WDI
FDI Foreign Direct
Investment
Foreign Direct Investment WDI
EcActiv Economic
Activity Rate of
those aged 15+
Those in occupations as a
percentage of the workforce of
the working age group ages
15+. Calculated using WDI
labour force size divided by
the working age population.
The latter is total population
minus the population aged 0-
14 years, ie the age 15+
population. For the UK, the
ILO Laborsta figures are used.
WDI**, “all
people who
supply labor
for the
production of
goods and
services,
including both
the employed
and the
unemployed.”
EcActivILO ILO Activity
Rate of those
aged 15+
Those in occupations as a
percentage of the workforce of
the working age group ages
15+
ILO Laborsta:
the number
employed
(ISCO)
divided by the
working-age

30
population.
ILOlfPF – This
is the variable
used in Tables
3-6.
ILO Projected
Percentage of
the Labour
Force Which is
Female
ILO Projections and Estimates
of the proportion of the
workforce that is female. 5-
year period centres are used
including 1970 (here labelled
as 1972), 1980 (here 1982),
1990 (here 1992), and 2000
(here shown as 2002)
UNCDB,
originally from
ILO, UNCDB
code 4270,
averaged
across 13 age
groups
Profmanf Professional
and managerial
workers, %
female
The percentage of
professionals and technicians
and managers that are female.
(ISCO 1968 0/1 and 2;
ISCO1988 1 and 2 and 3)
ILO Laborsta
AttainFM Gender Ratio
in Educational
Attainment
Ratio of female to male
average attainment estimated
by Barro and Lee in years,
ages 15+
Barro and Lee
Attain Educational
Attainment
(Years)
Average Attainment estimated
by Barro and Lee in years, for
people aged 15+
Barro and Lee
ParliamtF Women in
Parliament, %
of Total
Percentage of parliamentary
seats held by women. Where
there are two houses, the lower
house is chosen.
Inter-
Parliamentary
Union (2005)
Polrghts Political Rights Political rights on a scale of 1
to 7, where 7 is the most rights.
FreedomHouse
Civillibs Civil Liberties Civil liberties on a scale of 1 to
7, where 7 is the most liberties.
FreedomHouse
Democ Democracy,
Average of 2
Gastil Scales
Average of the above political
rights scale and civil liberties
scales
As used by
Barro
Fertility Fertility Average births per woman WDI
Logfertility Log of Fertility WDI (derived)
Popgrow Population
Growth Rate
(Percent)
Annual percentage growth rate
of population
WDI
Sources
Barro and Lee:
Barro, R. J. and J.-W. Lee (2001). "International Data on Educational Attainment: Updates and
Implications." Oxford Economic Papers 3: 541-563. See also: Barro, Robert, and Jong-Wha
Lee (2000) “International Data on Educational Attainment: Updates and Implications”, working
paper, Harvard CID, available online. Data accessed at:
http://www.cid.harvard.edu/ciddata/ciddata.html, last accessed June 20, 2005.
31
Freedom House:
Freedom House (2004) Annual Survey of Freedom Country Ratings. www.freedomhouse.org/ratings/
ILO Laborsta:
ILO Bureau of Statistics (2004). LABORSTA Internet, International Labour Office. Available from:
laborsta.ilo.org [accessed December 2004].
Inter-Parliamentary Union:
Inter-Parliamentary Union (1995) Women in Parliaments: 1945-1995. (Geneva: Inter-Parliamentary
Union).
Inter-Parliamentary Union (2005) Women in National Parliaments. http://www.ipu.org/wmn-e/world-
arc.htm (see also: Inter-Parliamentary Union (2005) Parline Data Base. Accessed at:
http://www.ipu.org/parline-e/parlinesearch.asp for details of quotas).
WDI:
World Bank (2005) World Development Indicators 2005. Accessed at:
http://esds.mcc.ac.uk/WDS_WB/TableViewer/dimView.aspx?ReportId=29 courtesy of Economic and
Social Data Service. **The WDI 2004 CD ROM was used for overall labour force participation.

32
Appendix Table 7: Gendered Growth Outcomes and Gender-Sensitive Democracy Measure
Estimation Method
Fixed Effects
Fixed Effects Fixed Effects
Investment .006(.003) **
.007(.003) ** .006(.003) **
Attainment .067(.039)* .127(.040)*** .093(.037) **
Fertility (Log) -.057(.167) .209(.169) .178(.157)
FDI -.002(.002) -.002(.002) -.002(.002)
Economic Activity Rate
.239(.279) -.194(.252) -.131(.244)
Attainment Ratio (Female to Male Percent)
-.101(.284) .220(.265) .200(.261)
Democracy -.231(.081) ***
Nim -.172(.079) **
Democracy Squared
.029(.010) ***
nim .019(.009) **
Women in Parliament
Nim .002(.007) -.001(.003)
Women in Parliament Squared
Nim -.000(.000) Nim
Significance of Whole Estimate
<1% *** <1% *** <1% ***
Wald Chi-Squared
376792 15051 519073
R-Squared Overall
.65 .63 .61
N 84 79 79
Columns 1 to 4 have investment as the endogenous variable in a generalised
least squares instrumental variables fixed-effects estimate. Investment is
considered to be endogenous. Trade, logged GDP in 1982, and lagged gdp per
capita have been used as instruments in two-stage least squares regression
in these columns. Controls for year and population growth rates were put in
all equations. The dependent variable is the log of GDP per capita in
constant US$.
Note: *** means <1% significance, ** means <5% significance, and * means <10% significance.
Figures in brackets are standard errors.

33
Figure 5 Women’s Schooling Attainments Vs. Human Development Index, 2002
0
51
01
5
.2 .4 .6 .8 1 .2 .4 .6 .8 1
0 1
Educational Attainment of Females (Years) Fitted values
Educational A
ttain
ment of F
em
ale
s (
Years
)/F
itte
d v
alu
es
Human Development Index
Graphs by Sub-Saharan Africa
Sources: See appendix. Data for 2002 only. The left-hand figure shows data for the whole world
except Sub-Saharan Africa, subject to data availability, and the right-hand figure is for Sub-Saharan
Africa only.

34
Figure 6 Female Proportion in Parliament Vs. Human Development Index, 2002
02
04
06
0
.2 .4 .6 .8 1 .2 .4 .6 .8 1
0 1
Wom
en in P
arl
iam
ent, %
of T
ota
l
Human Development IndexGraphs by Sub-Saharan Africa
Sources: See appendix. Data for 2002 only. The left-hand figure shows data for the whole world
except Sub-Saharan Africa, subject to data availability, and the right-hand figure is for Sub-Saharan
Africa only.