A Picture Is Worth a Thousand Words...A Picture Is Worth a Thousand Words Understanding Quantities...
30
© 2012 Carnegie Learning 1 LESSON 1.1 Skills Practice Name Date A Picture Is Worth a Thousand Words Understanding Quantities and Their Relationships Vocabulary Write a definition for each term in your own words. 1. independent quantity The quantity that the dependent quantity depends on is the independent quantity. 2. dependent quantity When one quantity depends on another in a problem situation, it is said to be the dependent quantity. Problem Set Determine the independent and dependent quantities in each scenario. 1. Selena is driving to visit her grandmother who lives 325 miles away from Selena’s home. She travels an average of 60 miles per hour. Independent quantity: time (hours) Dependent quantity: distance (miles) 2. Benjamin works at a printing company. He is making T-shirts for a high school volleyball team. The press he runs can imprint 3 T-shirts per minute with the school’s mascot. Independent quantity: time (minutes) Dependent quantity: number of T-shirts imprinted 3. On her way to work each morning, Sophia purchases a small cup of coffee for $4.25 from the coffee shop. Independent quantity: number of cups Dependent quantity: cost (dollars) Chapter 1 Skills Practice 251
Transcript of A Picture Is Worth a Thousand Words...A Picture Is Worth a Thousand Words Understanding Quantities...

© 2
012
Car
negi
e Le
arni
ng
1Lesson 1.1 Skills Practice
Name Date
A Picture Is Worth a Thousand WordsUnderstanding Quantities and Their Relationships
Vocabulary
Write a definition for each term in your own words.
1. independent quantity
The quantity that the dependent quantity depends on is the independent quantity.
2. dependent quantity
When one quantity depends on another in a problem situation, it is said to be the dependent quantity.
Problem Set
Determine the independent and dependent quantities in each scenario.
1. Selena is driving to visit her grandmother who lives 325 miles away from Selena’s home. She travels an average of 60 miles per hour.
Independent quantity: time (hours)
Dependent quantity: distance (miles)
2. Benjamin works at a printing company. He is making T-shirts for a high school volleyball team. The press he runs can imprint 3 T-shirts per minute with the school’s mascot.
Independent quantity: time (minutes)
Dependent quantity: number of T-shirts imprinted
3. On her way to work each morning, Sophia purchases a small cup of coffee for $4.25 from the coffee shop.
Independent quantity: number of cups
Dependent quantity: cost (dollars)
Chapter 1 Skills Practice 251
8069_Skills_Ch01.indd 251 23/04/12 1:14 PM
© 2
012
Car
negi
e Le
arni
ng
1
252 Chapter 1 Skills Practice
Lesson 1.1 Skills Practice page 2
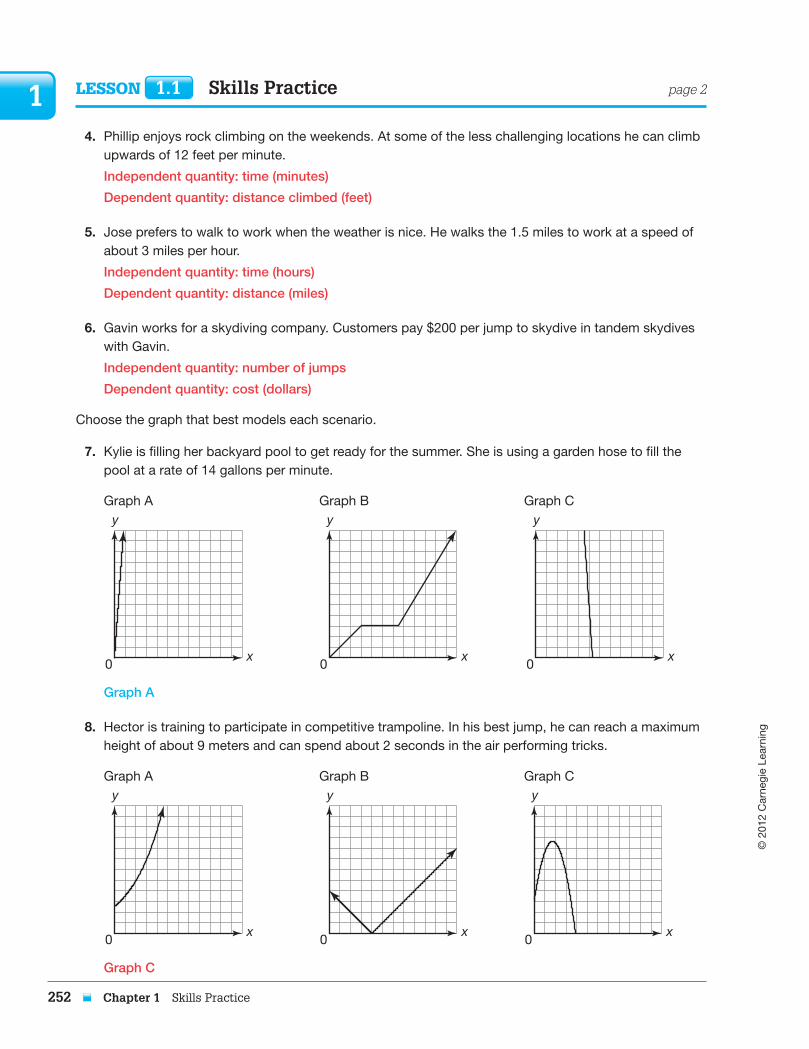
4. Phillip enjoys rock climbing on the weekends. At some of the less challenging locations he can climb upwards of 12 feet per minute.
Independent quantity: time (minutes)
Dependent quantity: distance climbed (feet)
5. Jose prefers to walk to work when the weather is nice. He walks the 1.5 miles to work at a speed of about 3 miles per hour.
Independent quantity: time (hours)
Dependent quantity: distance (miles)
6. Gavin works for a skydiving company. Customers pay $200 per jump to skydive in tandem skydives with Gavin.
Independent quantity: number of jumps
Dependent quantity: cost (dollars)
Choose the graph that best models each scenario.
7. Kylie is filling her backyard pool to get ready for the summer. She is using a garden hose to fill the pool at a rate of 14 gallons per minute.
Graph A Graph B Graph C
0x
y
0x
y
0x
y
Graph A
8. Hector is training to participate in competitive trampoline. In his best jump, he can reach a maximum height of about 9 meters and can spend about 2 seconds in the air performing tricks.
Graph A Graph B Graph C
0x
y
0x
y
0x
y
Graph C
8069_Skills_Ch01.indd 252 23/04/12 1:14 PM

© 2
012
Car
negi
e Le
arni
ng
1
Chapter 1 Skills Practice 253
9. Jasmine is saving for college. She has invested $500 in a mutual fund that is expected to earn an average of 7% annually.
Graph A Graph B Graph C
0x
y
0x
y
0x
y
Graph B
10. Each day Maria starts her walk to school at 7:45 am. At 7:50 am she stops at her friend Jenna’s house. Jenna is usually late and Maria must wait at least 5 minutes for her to get ready. At 7:55 am Maria and Jenna leave Jenna’s house and arrive at school at 8:10 am.
Graph A Graph B Graph C
0x
y
0x
y
0x
y
Graph B
Lesson 1.1 Skills Practice page 3
Name Date
8069_Skills_Ch01.indd 253 23/04/12 1:14 PM

© 2
012
Car
negi
e Le
arni
ng
1 Lesson 1.1 Skills Practice page 4
11. Marcus is at the top of an observation tower. He drops an action figure with a parachute attached and watches it descend to the ground.
Graph A Graph B Graph C
0x
y
0x
y
0x
y
Graph C
12. Janelle holds a raffle to raise money for a children’s hospital. Participants who enter the raffle guess the number of peanuts in a jar. Janelle records the number of peanuts each participant guesses and the number of peanuts their guess is off by.
Graph A Graph B Graph C
0x
y
0x
y
0x
y
Graph A
254 Chapter 1 Skills Practice
8069_Skills_Ch01.indd 254 23/04/12 1:14 PM

© 2
012
Car
negi
e Le
arni
ng
1Lesson 1.1 Skills Practice page 5
Name Date
Label the axes of the graph that models each scenario with the independent and dependent quantities.
13. Madison enjoys bicycling for exercise. Each Saturday she bikes a course she has mapped out around her town. She averages a speed of 12 miles per hour on her journey.
0x
y
Time (hours)
Distance Madison Bikes
Dis
tanc
e (m
iles)
14. Natasha is filling the bathtub with water in order to give her dog Buster a bath. The faucet fills the tub at an average rate of 12 gallons per minute.
0x
y
Time (minutes)
Amount of Water in Bathtub
Vo
lum
e (g
allo
ns)
Chapter 1 Skills Practice 255
8069_Skills_Ch01.indd 255 23/04/12 1:14 PM
© 2
012
Car
negi
e Le
arni
ng
1 Lesson 1.1 Skills Practice page 6
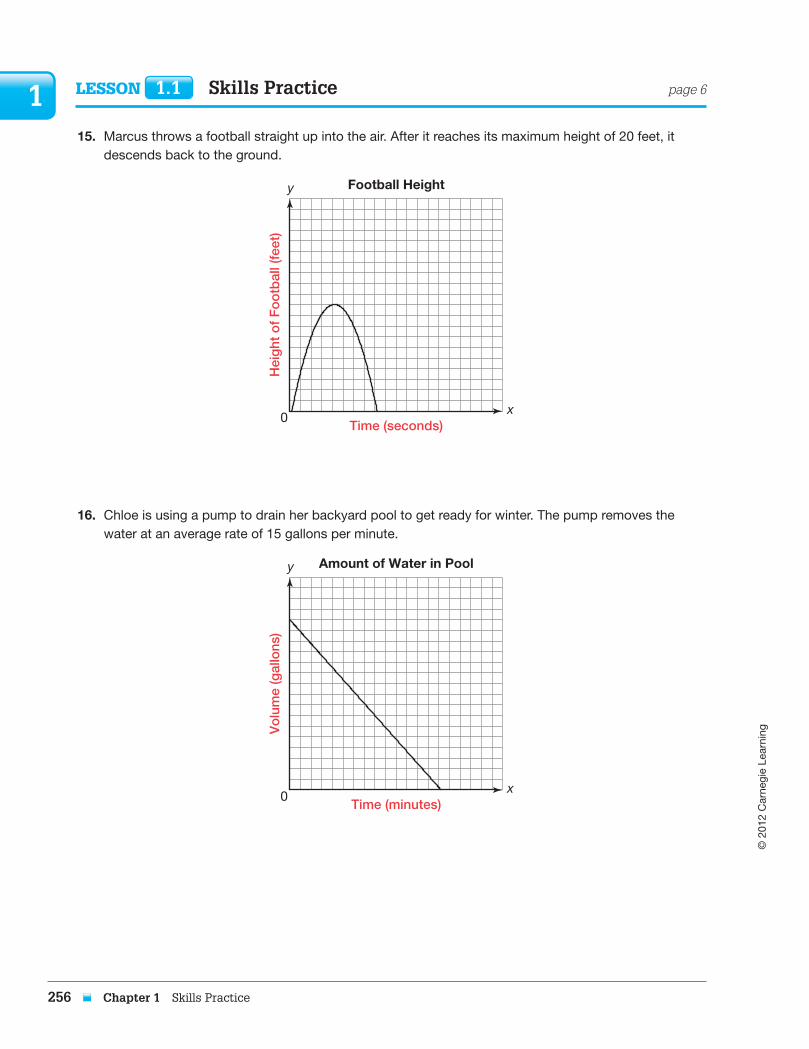
15. Marcus throws a football straight up into the air. After it reaches its maximum height of 20 feet, it descends back to the ground.
0x
y
Time (seconds)
Football Height
Hei
ght
of
Fo
otb
all (
feet
)
16. Chloe is using a pump to drain her backyard pool to get ready for winter. The pump removes the water at an average rate of 15 gallons per minute.
0x
y
Time (minutes)
Amount of Water in Pool
Vo
lum
e (g
allo
ns)
256 Chapter 1 Skills Practice
8069_Skills_Ch01.indd 256 23/04/12 1:14 PM

© 2
012
Car
negi
e Le
arni
ng
1
17. Jermaine is saving money to purchase a used car. He places $850 dollars in a savings account that earns 1.65% interest annually.
0x
y
Time (years)
Interest Earned
Inte
rest
(do
llars
)
18. Zachary enjoys hiking. On the first day of his latest hiking trip, he hikes through flat terrain for about 8 miles. On the second day, he hikes through very steep terrain for about 3 miles. On the third day he hikes through some hilly terrain for about 6 miles.
0x
y
Time (days)
Distance Hiked
Dis
tanc
e (m
iles)
Lesson 1.1 Skills Practice page 7
Name Date
Chapter 1 Skills Practice 257
8069_Skills_Ch01.indd 257 23/04/12 1:14 PM

© 2
012
Car
negi
e Le
arni
ng
1
258 Chapter 1 Skills Practice
8069_Skills_Ch01.indd 258 23/04/12 1:14 PM
© 2
012
Car
negi
e Le
arni
ng
1
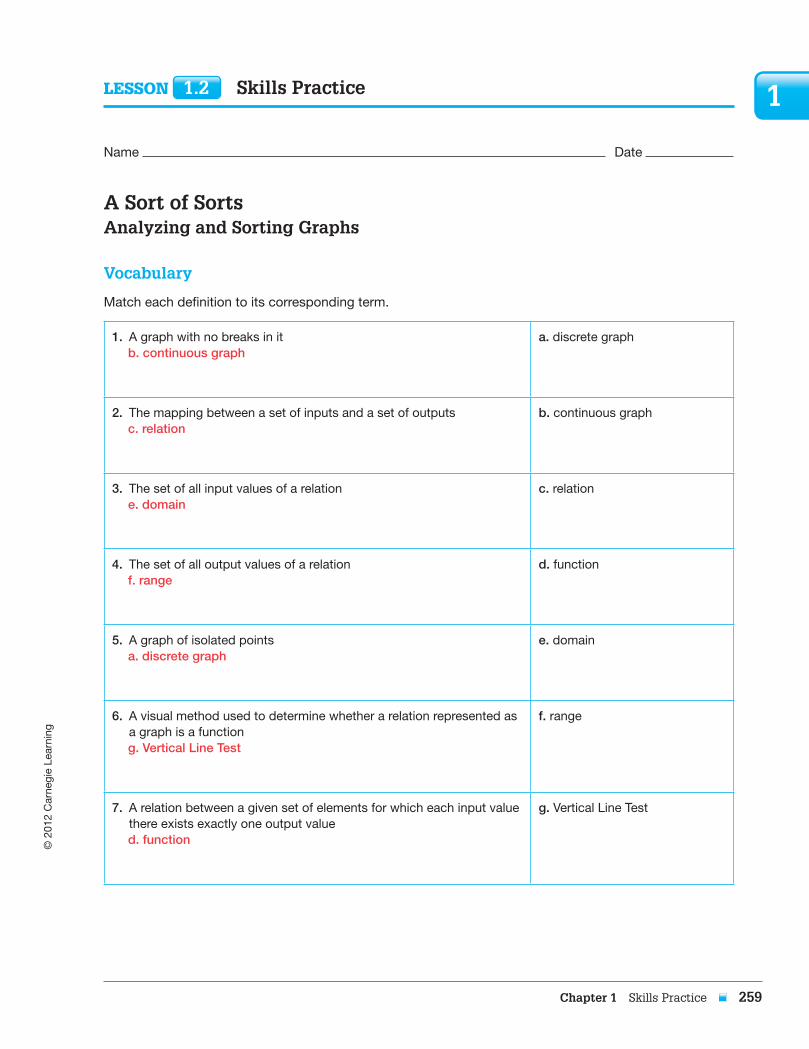
A Sort of SortsAnalyzing and Sorting Graphs
Vocabulary
Match each definition to its corresponding term.
1. A graph with no breaks in itb. continuous graph
a. discrete graph
2. The mapping between a set of inputs and a set of outputsc. relation
b. continuous graph
3. The set of all input values of a relatione. domain
c. relation
4. The set of all output values of a relationf. range
d. function
5. A graph of isolated pointsa. discrete graph
e. domain
6. A visual method used to determine whether a relation represented as a graph is a functiong. Vertical Line Test
f. range
7. A relation between a given set of elements for which each input value there exists exactly one output valued. function
g. Vertical Line Test
Lesson 1.2 Skills Practice
Name Date
Chapter 1 Skills Practice 259
8069_Skills_Ch01.indd 259 23/04/12 1:14 PM
© 2
012
Car
negi
e Le
arni
ng
1 Lesson 1.2 Skills Practice page 2
Problem Set
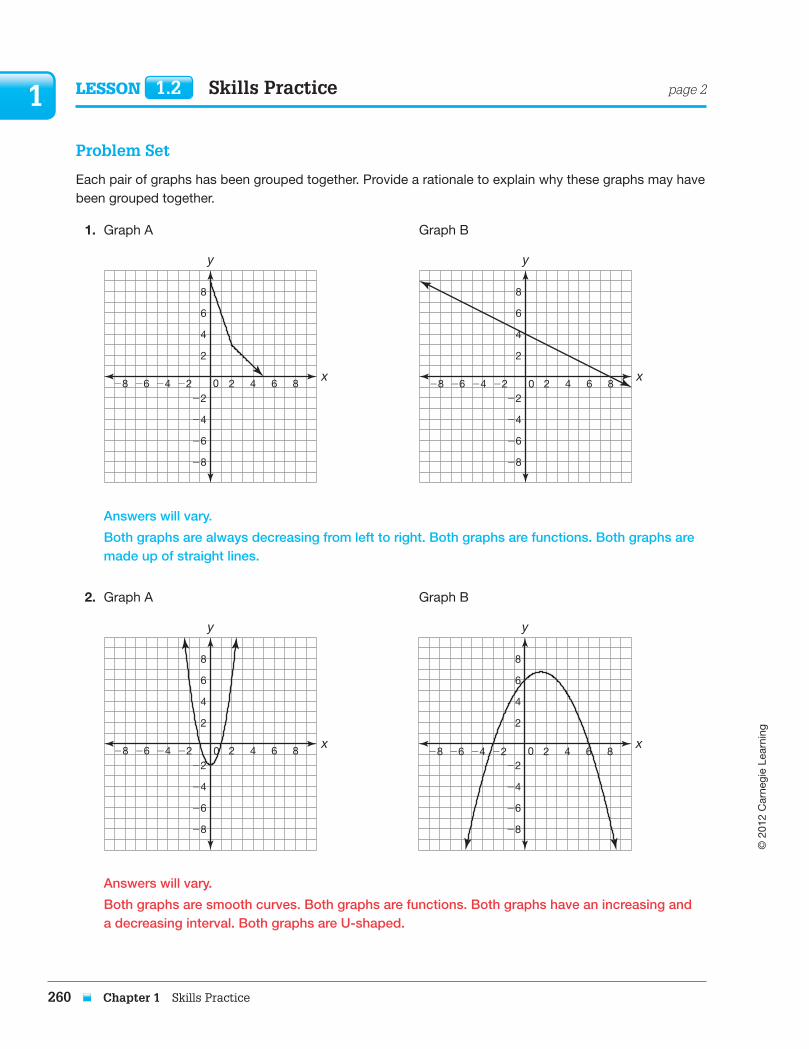
Each pair of graphs has been grouped together. Provide a rationale to explain why these graphs may have been grouped together.
1. Graph A Graph B
28 26 24 22 0 2
2
22
24
26
28
4
6
8
4 6 8x
y
28 26 24 22 0 2
2
22
24
26
28
4
6
8
4 6 8x
y
Answers will vary.
Both graphs are always decreasing from left to right. Both graphs are functions. Both graphs are made up of straight lines.
2. Graph A Graph B
28 26 24 22 0 2
2
22
24
26
28
4
6
8
4 6 8x
y
28 26 24 22 0 2
2
22
24
26
28
4
6
8
4 6 8x
y
Answers will vary.
Both graphs are smooth curves. Both graphs are functions. Both graphs have an increasing and a decreasing interval. Both graphs are U-shaped.
260 Chapter 1 Skills Practice
8069_Skills_Ch01.indd 260 23/04/12 1:14 PM
© 2
012
Car
negi
e Le
arni
ng
1
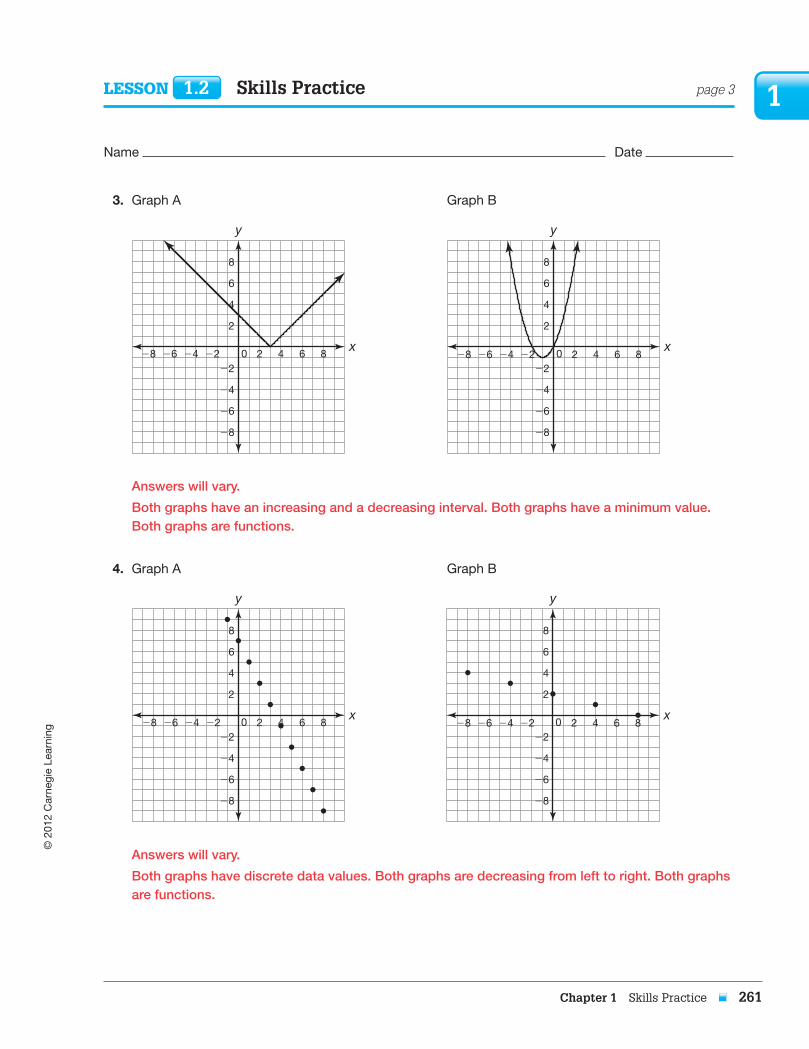
3. Graph A Graph B
28 26 24 22 0 2
2
22
24
26
28
4
6
8
4 6 8x
y
28 26 24 22 0 2
2
22
24
26
28
4
6
8
4 6 8x
y
Answers will vary.
Both graphs have an increasing and a decreasing interval. Both graphs have a minimum value. Both graphs are functions.
4. Graph A Graph B
28 26 24 22 0 2
2
22
24
26
28
4
6
8
4 6 8x
y
28 26 24 22 0 2
2
22
24
26
28
4
6
8
4 6 8x
y
Answers will vary.
Both graphs have discrete data values. Both graphs are decreasing from left to right. Both graphs are functions.
Lesson 1.2 Skills Practice page 3
Name Date
Chapter 1 Skills Practice 261
8069_Skills_Ch01.indd 261 23/04/12 1:14 PM

© 2
012
Car
negi
e Le
arni
ng
262 Chapter 1 Skills Practice
1 Lesson 1.2 Skills Practice page 4
5. Graph A Graph B
28 26 24 22 0 2
2
22
24
26
28
4
6
8
4 6 8x
y
28 26 24 22 0 2
2
22
24
26
28
4
6
8
4 6 8x
y
Answers will vary.
Both graphs are increasing from left to right. Both graphs are functions.
6. Graph A Graph B
28 26 24 22 0 2
2
22
24
26
28
4
6
8
4 6 8x
y
28 26 24 22 0 2
2
22
24
26
28
4
6
8
4 6 8x
y
Answers will vary.
Both graphs have an increasing and a decreasing interval. Both graphs have a maximum value. Both graphs are functions.
8069_Skills_Ch01.indd 262 23/04/12 1:14 PM

© 2
012
Car
negi
e Le
arni
ng
Chapter 1 Skills Practice 263
1Lesson 1.2 Skills Practice page 5
Name Date
Determine whether the graph is discrete or continuous.
7. 8. 9.
x
y
x
y
x
y
The graph is discrete. The graph is continuous. The graph is continuous.
10. 11. 12.
x
y
x
y
x
y
The graph is continuous. The graph is discrete. The graph is continuous.
8069_Skills_Ch01.indd 263 23/04/12 1:14 PM

© 2
012
Car
negi
e Le
arni
ng
264 Chapter 1 Skills Practice
1 Lesson 1.2 Skills Practice page 6
Determine if each graph represents a function by using the Vertical Line Test.
13. 14.
28 26 24 22 0 2
2
22
24
26
28
4
6
8
4 6 8x
y
28 26 24 22 0 2
2
22
24
26
28
4
6
8
4 6 8x
y
Yes. The graph is a function. No. The graph is not a function.
15. 16.
28 26 24 22 0 2
2
22
24
26
28
4
6
8
4 6 8x
y
28 26 24 22 0 2
2
22
24
26
28
4
6
8
4 6 8x
y
No. The graph is not a function. Yes. The graph is a function.
8069_Skills_Ch01.indd 264 23/04/12 1:14 PM

© 2
012
Car
negi
e Le
arni
ng
Chapter 1 Skills Practice 265
1Lesson 1.2 Skills Practice page 7
Name Date
17. 18.
28 26 24 22 0 2
2
22
24
26
28
4
6
8
4 6 8x
y
28 26 24 22 0 2
2
22
24
26
28
4
6
8
4 6 8x
y
No. The graph is not a function. Yes. The graph is a function.
8069_Skills_Ch01.indd 265 23/04/12 1:14 PM
© 2
012
Car
negi
e Le
arni
ng
266 Chapter 1 Skills Practice
1
8069_Skills_Ch01.indd 266 23/04/12 1:14 PM
© 2
012
Car
negi
e Le
arni
ng
Chapter 1 Skills Practice 267
1Lesson 1.3 Skills Practice
Name Date
There Are Many Ways to Represent FunctionsRecognizing Algebraic and Graphical Representations of Functions
Vocabulary
Choose the term from the box that best completes each statement.
function notation increasing function exponential functionsfunction family linear functions linear absolute value functionsabsolute maximum quadratic functions constant functionlinear piecewise functions decreasing function absolute minimum
1. Function notation is a way to represent equations algebraically that makes it more efficient to recognize the independent and dependent variables.
2. The family of exponential functions includes functions of the form f(x) 5 a ? bx, where a and b are real numbers, and b is greater than 0 but is not equal to 1.
3. The family of linear piecewise functions includes functions that have an equation that changes for different parts, or pieces, of the domain.
4. When both the independent and dependent variables of a function increase across the entire domain, the function is called an increasing function .
5. A function has an absolute maximum if there is a point on its graph that has a y-coordinate that is greater than the y-coordinates of every other point on the graph.
6. A function family is a group of functions that share certain characteristics.
7. The family of linear absolute value functions includes functions of the form f(x) 5 a | x 1 b | 1 c, where a, b, and c are real numbers, and a is not equal to 0.
8. When the dependent variable of a function decreases as the independent variable increases across the entire domain, the function is called a decreasing function .
9. The family of quadratic functions includes functions of the form f(x) 5 ax2 1 bx 1 c, where a, b, and c are real numbers, and a is not equal to 0.
10. The family of linear functions includes functions of the form f(x) 5 ax 1 b, where a and b are real numbers, and a is not equal to 0.
11. If the dependent variable of a function does not change or remains constant over the entire domain, then the function is called a constant function .
12. A function has an absolute minimum if there is a point on its graph that has a y-coordinate that is less than the y-coordinates of every other point on the graph.
8069_Skills_Ch01.indd 267 23/04/12 1:14 PM

© 2
012
Car
negi
e Le
arni
ng
268 Chapter 1 Skills Practice
1 Lesson 1.3 Skills Practice page 2
Problem Set
Rewrite each function using function notation.
1. Rewrite the function y 5 3x 2 8 using function notation so that the dependent quantity, defined as f, is a function of the independent quantity x.
f(x) 5 3x 2 8
2. Rewrite the function y 5 3 x 2 1 6x 21 using function notation so that the dependent quantity, defined as C, is a function of the independent quantity x.
C(x) 5 3 x 2 1 6x 2 1
3. Rewrite the function y 5 3 x 1 8 using function notation so that the dependent quantity, defined as P, is a function of the independent quantity x.
P(x) 5 3 x 1 8
4. Rewrite the function l 5 |n 2 2| using function notation so that the dependent quantity, defined as L, is a function of the independent quantity n.
L(n) 5 |n 2 2|
5. Rewrite the function d 5 2 1 __ 2
m 1 5 using function notation so that the dependent quantity, defined as
A, is a function of the independent quantity m.
A(m) 5 2 1 __ 2 m 1 5
6. Rewrite the function c 5 2p r2 using function notation so that the dependent quantity, defined as C, is a function of the independent quantity r.
C(r) 5 2p r2
8069_Skills_Ch01.indd 268 23/04/12 1:14 PM

© 2
012
Car
negi
e Le
arni
ng
Chapter 1 Skills Practice 269
1Lesson 1.3 Skills Practice page 3
Name Date
Choose the graph that represents each function. Use your graphing calculator.
7. f(x) 5 2 __ 3 x 1 2
Graph A Graph B Graph C
x
y
x
y
x
y
Graph A
8. f(x) 5 2x2 1 4
Graph A Graph B Graph C
x
y
x
y
x
y
Graph C
9. f(x) 5 2x 1 5
Graph A Graph B Graph C
x
y
x
y
x
y
Graph B
8069_Skills_Ch01.indd 269 23/04/12 1:14 PM
© 2
012
Car
negi
e Le
arni
ng
270 Chapter 1 Skills Practice
1 Lesson 1.3 Skills Practice page 4
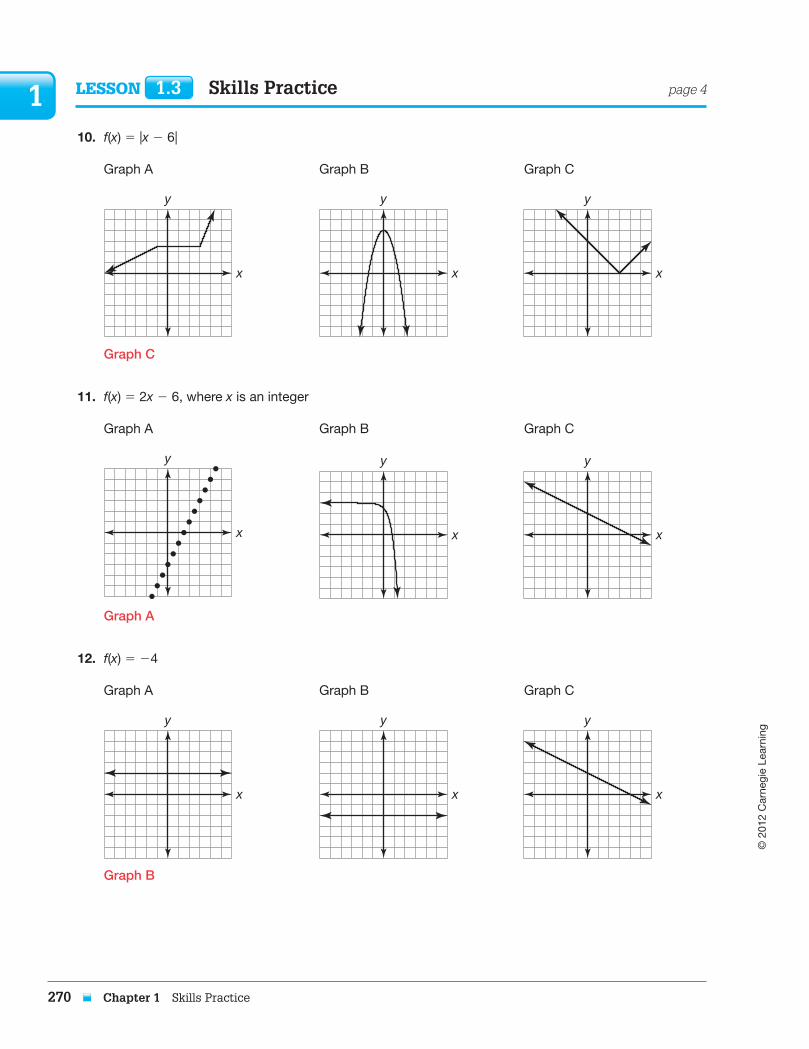
10. f(x) 5 |x 2 6|
Graph A Graph B Graph C
x
y
x
y
x
y
Graph C
11. f(x) 5 2x 2 6, where x is an integer
Graph A Graph B Graph C
x
y
x
y
x
y
Graph A
12. f(x) 5 24
Graph A Graph B Graph C
x
y
x
y
x
y
Graph B
8069_Skills_Ch01.indd 270 23/04/12 1:14 PM

© 2
012
Car
negi
e Le
arni
ng
Chapter 1 Skills Practice 271
1Lesson 1.3 Skills Practice page 5
Name Date
Determine whether each graph represents an increasing function, a decreasing function, a constant function, or a combination of increasing and decreasing functions.
13. 14. 15.
x
y
x
y
x
y
The graph represents an The graph represents an The graph represents a increasing function. increasing function. function with a combination of an increasing interval and a decreasing interval.
16. 17. 18.
x
y
x
y
x
y
The graph represents a The graph represents a The graph represents a decreasing function. constant function. decreasing function.
8069_Skills_Ch01.indd 271 23/04/12 1:14 PM

© 2
012
Car
negi
e Le
arni
ng
272 Chapter 1 Skills Practice
1 Lesson 1.3 Skills Practice page 6
Determine whether each graph represents a function with an absolute minimum, an absolute maximum, or neither.
19. 20. 21.
x
y
x
y
x
y
The graph represents a The graph represents a The graph represents a function with an absolute function with neither an function with an absolute minimum. absolute minimum nor an maximum. absolute maximum.
22. 23. 24.
x
y
x
y
x
y
The graph represents a The graph represents a The graph represents a function with neither an function with an absolute function with an absolute absolute minimum nor an maximum. minimum. absolute maximum.
8069_Skills_Ch01.indd 272 23/04/12 1:14 PM
© 2
012
Car
negi
e Le
arni
ng
Chapter 1 Skills Practice 273
1Lesson 1.3 Skills Practice page 7
Name Date
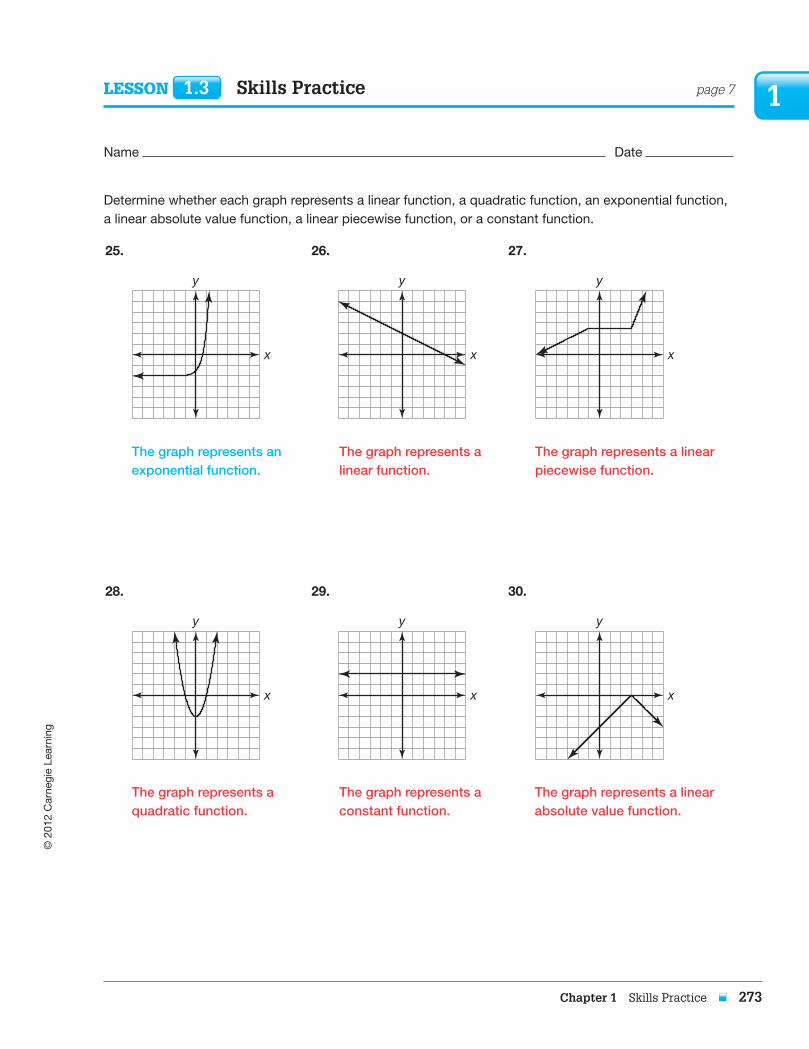
Determine whether each graph represents a linear function, a quadratic function, an exponential function, a linear absolute value function, a linear piecewise function, or a constant function.
25. 26. 27.
x
y
x
y
x
y
The graph represents an The graph represents a The graph represents a linearexponential function. linear function. piecewise function.
28. 29. 30.
x
y
x
y
x
y
The graph represents a The graph represents a The graph represents a linear quadratic function. constant function. absolute value function.
8069_Skills_Ch01.indd 273 23/04/12 1:14 PM

© 2
012
Car
negi
e Le
arni
ng
274 Chapter 1 Skills Practice
1
8069_Skills_Ch01.indd 274 23/04/12 1:14 PM

© 2
012
Car
negi
e Le
arni
ng
Chapter 1 Skills Practice 275
1
Function Families for 200, Alex…Recognizing Functions by Characteristics
Problem Set
Choose the appropriate function family or families to complete each sentence based on the given characteristic(s).
linear functions quadratic functionsexponential functions linear absolute value functions
1. The graph of this function family is a straight line. The function family is linear functions .
2. The graph of this function family has an increasing interval and a decreasing interval. The function family is quadratic functions or linear absolute value functions .
3. The graph of this function family has an absolute minimum. The function family is quadratic functions or linear absolute value functions .
4. The graph of this function family in decreasing over the entire domain. The function family is linear functions or exponential functions .
5. The graph of this function family forms a V shape. The function family is linear absolute value functions .
6. The graph of this function family has an increasing interval and a decreasing interval and forms a U shape. The function family is quadratic functions .
7. The graph of this function family does not have an absolute maximum or absolute minimum and is a smooth curve. The function family is exponential functions .
8. The graph of this function family has an absolute maximum or absolute minimum and is made up straight lines. The function family is linear absolute value functions .
9. The graph of this function family is made up straight lines and does not have an absolute maximum or absolute minimum. The function family is linear functions .
10. The graph of this function family decreases over the entire domain and is a smooth curve. The function family is exponential functions .
Lesson 1.4 Skills Practice
Name Date
8069_Skills_Ch01.indd 275 23/04/12 1:14 PM

© 2
012
Car
negi
e Le
arni
ng
276 Chapter 1 Skills Practice
1 Lesson 1.4 Skills Practice page 2
Create an equation and sketch a graph for a function with each set of given characteristics. Use values that are any real numbers between 210 and 10.
11. Create an equation and sketch a graph that:
• is a smooth curve,
• is continuous,
• has a minimum, and
• is quadratic.
Answers will vary.
f(x) 5 x2
12. Create an equation and sketch a graph that:
• is linear,
• is discrete, and
• is decreasing across the entire domain.
Answers will vary.
f(x) 5 2x, where x is an integer
28 26 24 22 0 2
2
22
24
26
28
4
6
8
4 6 8x
y
28 26 24 22 0 2
2
22
24
26
28
4
6
8
4 6 8x
y
8069_Skills_Ch01.indd 276 23/04/12 1:14 PM

© 2
012
Car
negi
e Le
arni
ng
Chapter 1 Skills Practice 277
1Lesson 1.4 Skills Practice page 3
Name Date
13. Create an equation and sketch a graph that:
• is a smooth curve,
• is increasing across the entire domain,
• is continuous, and
• is exponential.
Answers will vary.
f(x) 5 2x
14. Create an equation and sketch a graph that:
• has a maximum,
• is continuous, and
• is a linear absolute value function.
Answers will vary.
f(x) 5 |x|
28 26 24 22 0 2
2
22
24
26
28
4
6
8
4 6 8x
y
28 26 24 22 0 2
2
22
24
26
28
4
6
8
4 6 8x
y
8069_Skills_Ch01.indd 277 23/04/12 1:14 PM

© 2
012
Car
negi
e Le
arni
ng
278 Chapter 1 Skills Practice
1 Lesson 1.4 Skills Practice page 4
15. Create an equation and sketch a graph that:
• is linear,
• is continuous,
• is neither increasing nor decreasing across the entire domain, and
• does not pass through the origin.
Answers will vary.
f(x) 5 3
16. Create an equation and sketch a graph that:
• is discrete,
• has a maximum,
• does not pass through the origin, and
• is quadratic.
Answers will vary.
f(x) 5 2x2 1 3, where x is an integer
28 26 24 22 0 2
2
22
24
26
28
4
6
8
4 6 8x
y
28 26 24 022
24
26
28
4
6
8
4 6 8x
y
8069_Skills_Ch01.indd 278 23/04/12 1:14 PM

© 2
012
Car
negi
e Le
arni
ng
Chapter 1 Skills Practice 279
1Lesson 1.4 Skills Practice page 5
Name Date
Choose the function family represented by each graph.
linear function quadratic function exponential functionlinear absolute value function linear piecewise function
17. 18.
28 26 24 22 0 2
2
22
24
26
28
4
6
8
4 6 8x
y
28 26 24 22 0 2
2
22
24
26
28
4
6
8
4 6 8x
y
The graph represents a quadratic function. The graph represents a linear function.
19. 20.
28 26 24 22 0 2
2
22
24
26
28
4
6
8
4 6 8x
y
28 26 24 22 0 2
2
22
24
26
28
4
6
8
4 6 8x
y
The graph represents a linear The graph represents an exponential absolute value function. function.
8069_Skills_Ch01.indd 279 23/04/12 1:14 PM

© 2
012
Car
negi
e Le
arni
ng
280 Chapter 1 Skills Practice
1 Lesson 1.4 Skills Practice page 6
21. 22.
28 26 24 22 0 2
2
22
24
26
28
4
6
8
4 6 8x
y
28 26 24 22 0 2
2
22
24
26
28
4
6
8
4 6 8x
y
The graph represents a linear The graph represents a linear function. piecewise function.
8069_Skills_Ch01.indd 280 23/04/12 1:14 PM