A Physiological Profile Approach to Falls Risk Assessment ... · A Physiological Profile Approach...
16
A Physiological Profile Approach to Falls Risk Assessment and Prevention The purpose of this perspective article is to describe the use of a physiological profile approach to falls risk assessment and prevention that has been developed by the Falls and Balance Research Group of the Prince of Wales Medical Research Institute, Sydney, Australia. The profile’s use for people with a variety of factors that put them at risk for falls is discussed. The Physiological Profile Assessment (PPA) involves a series of simple tests of vision, peripheral sensation, muscle force, reaction time, and postural sway. The tests can be administered quickly, and all equipment needed is portable. The results can be used to differentiate people who are at risk for falls (“fallers”) from people who are not at risk for falls (“nonfallers”). A computer program using data from the PPA can be used to assess an individual’s performance in relation to a normative database so that deficits can be targeted for intervention. The PPA provides valid and reliable measurements that can be used for assessing falls risk and evaluating the effectiveness of interventions and is suitable for use in a range of physical therapy and health care settings. [Lord SR, Menz HB, Tiedemann A. A physiolog- ical profile approach to falls risk assessment and prevention. Phys Ther. 2003;83:237–252.] Key Words: Accidental falls, Aged, Assessment, Balance, Muscle force, Physical therapy, Reaction time, Vision. Stephen R Lord, Hylton B Menz, Anne Tiedemann Physical Therapy . Volume 83 . Number 3 . March 2003 237 Perspective
Transcript of A Physiological Profile Approach to Falls Risk Assessment ... · A Physiological Profile Approach...

A Physiological Profile Approach toFalls Risk Assessment and Prevention
The purpose of this perspective article is to describe the use of aphysiological profile approach to falls risk assessment and preventionthat has been developed by the Falls and Balance Research Group ofthe Prince of Wales Medical Research Institute, Sydney, Australia. Theprofile’s use for people with a variety of factors that put them at risk forfalls is discussed. The Physiological Profile Assessment (PPA) involvesa series of simple tests of vision, peripheral sensation, muscle force,reaction time, and postural sway. The tests can be administeredquickly, and all equipment needed is portable. The results can be usedto differentiate people who are at risk for falls (“fallers”) from peoplewho are not at risk for falls (“nonfallers”). A computer program usingdata from the PPA can be used to assess an individual’s performance inrelation to a normative database so that deficits can be targeted forintervention. The PPA provides valid and reliable measurements thatcan be used for assessing falls risk and evaluating the effectiveness ofinterventions and is suitable for use in a range of physical therapy andhealth care settings. [Lord SR, Menz HB, Tiedemann A. A physiolog-ical profile approach to falls risk assessment and prevention. Phys Ther.2003;83:237–252.]
Key Words: Accidental falls, Aged, Assessment, Balance, Muscle force, Physical therapy, Reaction time,
Vision.
Stephen R Lord, Hylton B Menz, Anne Tiedemann
Physical Therapy . Volume 83 . Number 3 . March 2003 237
Pers
pect
ive �
����������������������������������������������������������������������������������������������������������������������������������������������������������
������
������
������
������
������
������
������
������
������
������
������
������
������
�����

One of the major problems associated withaging is an increased susceptibility to falling.1One in 3 older people living in the commu-nity are likely to fall one or more times in a
year,2–4 and rates of falling are even higher in olderpeople living in intermediate and nursing home carefacilities.5–7 One quarter to one half of all falls amongcommunity-dwelling older people result in injury, 10%to 15% of falls are associated with serious injuries, 2% to6% of falls are associated with fractures, and approxi-mately 1% of falls are associated with hip fractures.8–10
The most commonly self-reported injuries includesuperficial cuts and abrasions, bruises, and sprains. Themost common injuries that require hospitalization arefemoral neck fractures and other fractures of the leg;fractures of the radius, ulna, and other bones in the arm;and fractures of the neck and trunk.1
Many researchers1–3,11 have attempted to identify riskfactors for falls and to develop strategies for prevention.Older people (ie, those aged 65 years and over) withmultiple chronic illnesses have higher rates of falls thanactive older people without known pathology or impair-ments.1–3,11 Stroke,2,3 Parkinson disease,12 a history offalls,2,4 the presence of impaired gait,13 muscle weak-ness,4 arthritis,3,11 foot problems,2,14 impaired cogni-tion,2,11 abnormal neurological signs,11 and the taking ofpsychoactive medications6 and multiple medications6
have been shown to be important predictors for falls.However, attributing a degree of falls risk to a specificmedical diagnosis is problematic because the relativeseverity of the above conditions may vary considerablyamong individuals. Furthermore, declines in sensori-motor function associated with age,15 inactivity, medica-tion use, or minor pathology may be evident in olderpeople with no documented medical illness.
In response to this problem, we have taken a “physiolog-ical” rather than “disease-oriented” approach to evaluat-ing falls risk factors, an approach that deals with impair-ments irrespective of their cause. This approach involvesdirect assessment of sensorimotor abilities rather thandocumenting the presence or absence of a diagnoseddisease. For example, in an older person with cataractsand associated visual impairment, the identified risk
factor is impaired vision (eg, poor visual acuity andcontrast sensitivity), rather than cataracts. Similarly,poor peripheral sensation is likely to be a major riskfactor for people with diabetic neuropathy, and muscleweakness is the main risk factor for people with musclewasting subsequent to bed rest and for people with ahistory of poliomyelitis. The aim of this article is tooutline our approach to falls risk factor assessment (thePhysiological Profile Assessment [PPA]) and illustratethe efficacy of this approach through the use ofexamples.
Conceptual ModelThe maintenance of balance depends on the interactionof multiple sensory, motor, and integrative systems.1 Thephysiological factors that are the primary contributors tostability are shown in Figure 1. Functioning of each ofthese factors declines with age,15 and impairments ineach factor are associated with increased risk of fall-ing.16–19 A marked deficit in any one of these factors maybe sufficient to increase the risk of falling; however, acombination of mild or moderate impairments in mul-tiple physiological domains also may increase the risk offalling. By directly assessing an individual’s physiologicalabilities, intervention strategies can be implemented totarget areas of deficit.
Rationale for Test SelectionIn order for our physiological assessment to be practicalin a clinical setting, the individual tests we developedwere designed so that they met the following criteria:
1. Simple to administer. As with all tests of physical func-tioning, the PPA needs to be administered in a standard-ized, rigorous way. However, each test has been designedin an effort to facilitate test administration. Only 1 day oftraining is required for allied health care personnel(ie, those working in the fields of physical therapy,psychology, exercise science, and nursing, including
SR Lord, PhD, is Associate Professor, Prince of Wales Medical Research Institute, University of New South Wales, Barker Street, Randwick, NewSouth Wales, 2031, Australia ([email protected]). Address all correspondence to Dr Lord.
HB Menz, PhD, is Research Fellow, Prince of Wales Medical Research Institute, University of New South Wales.
A Tiedemann, BSc (Hum Movt), Grad Dip Exerc Sc, is Research Officer, Prince of Wales Medical Research Institute, University of New SouthWales.
Dr Lord and Dr Menz provided concept/idea and writing. Dr Lord and Ms Tiedemann provided data collection, and all authors provided dataanalysis. Dr Lord provided project management, fund procurement, and institutional liaisons. Dr Menz and Ms Tiedemann provided consultation(including review of manuscript before submission).
The PPA provides valid and reliable
measurements that can be used for
assessing falls risk and evaluating the
effectiveness of interventions.
238 . Lord et al Physical Therapy . Volume 83 . Number 3 . March 2003

physical therapists and nurses’ aides) to be proficient intest administration and use of the computer program.
2. Short administration time. To test the many domainsimportant in balance control in one session, it is impor-tant that each test item take only a few minutes toadminister. Quick administration time, we contend, aidsparticipation and avoids fatigue in frail older people.
3. Feasible for older people to undertake. The selected testsneed to be acceptable to older people, in that they needto be noninvasive and not require excessive effort orcause pain or discomfort. Nonetheless, the tests need tobe challenging so as to discriminate between olderpeople with and without sensorimotor and balanceimpairments. The tests that comprise the PPA haveproved to be acceptable to older people and have beenused by the Falls and Balance Research Group of the
Prince of Wales Medical ResearchInstitute for over 10 years with morethan 4,000 subjects.15–19
4. Valid and reliable measurements. Themeasurements obtained with the testmust have high criterion validity20; thatis, they must be able to predict fallingin older people. When combined inmultivariate discriminant analyses,these measurements have been foundto predict those at risk of falling with75% accuracy in both community andinstitutional settings.16–19 The vision,muscle force, reaction time, and bal-ance tests have high test-retest reliabil-ity,21–23 and although the sensory testshave only moderate test-retest reliabil-ity (due to the more exacting nature ofthe test administration and increasedconcentration required by the sub-jects), they yield reliability coefficientsconsistent with what can be expectedin clinical populations (ie, intraclasscorrelation coefficients [ICCs] in therange of .5 to .7).21,24
5. “Low-tech” and robust. If the tests areto be used successfully in large com-munity studies they need to be “low-tech” and robust.
6. Portability. A compact, lightweighttest apparatus enables testing in a vari-ety of physical settings. Thus, assess-ment can be done on a temporary orpermanent basis in community set-
tings, retirement villages, and health care institutions.Such portability improves participation and adherence,because the clinic can be brought to the target popula-tion of often older frail people, rather than relying onthem attending a fixed-location laboratory. The equip-ment for the PPA tests can be easily carried by a singleperson, and all equipment has been designed to fit intothe trunk of a car for easy transport.
7. Quantitative measurements. Finally, a fundamental crite-rion for each test is that they provide continuouslyscored measurements, that is, quantitative rather thandiscrete or graded scores. This criterion enables themeasurements to be analyzed by parametric statistics,such as analysis of variance, correlation and regressiontechniques, and discriminant analysis. Because the testsare standardized, we believe this minimizes judgmentson part of the test administrator. Quantitative measure-ments also avoid ceiling and floor effects, which can be
Figure 1.Systems involved in the maintenance of postural stability.1
Physical Therapy . Volume 83 . Number 3 . March 2003 Lord et al . 239
������
������
������
������
����

quite common in other measures of vision, sensation,muscle force, and balance.
The Physiological Tests
Vision Tests
High- and low-contrast visual acuity. Visual acuity ismeasured for the PPA by using a letter chart (Fig. 2A)with high- and low-contrast (10%) letters (wherecontrast�the difference between the maximum andminimum luminance divided by their sum). Acuity isassessed binocularly with subjects wearing their distanceglasses (if applicable) at a test distance of 3 m andmeasured in terms of the minimum angle resolvable(MAR) in minutes of arc. Starting with the high-contrastchart, subjects are asked to read aloud the letters on thechart. The test is scored using a visual acuity conversion
chart (Appendix 1). The scoredepends on the lowest line on whichsubjects can read any correct lettersand the number of correct letters onthat line.21
Contrast sensitivity. Edge contrastsensitivity is assessed using the Mel-bourne Edge Test.25 The chart has 20circular 25-mm-diameter patches con-taining edges with reducing contrastwith variable orientation as the identi-fying feature (Fig. 2B). The test uses a4-alternative forced-choice method ofpresentation. The edges are presentedin the orientations: horizontal, verti-cal, 45 degrees left, and 45 degreesright. A key card containing the 4possible edge angles is provided forsubject instruction. The lowest con-trast patch correctly identified isrecorded as the subject’s contrast sen-sitivity in decibel units, where 1 dB�10log10 contrast.
Vestibular Function Tests
Visual field dependence. The visualfield dependence test26 places visionin conflict with vestibular and otherpostural senses and provides an indi-rect measurement of vestibular func-tioning. In this test, subjects attemptto align a straight edge to the truevertical while exposed to a rotatingvisual stimulus that extends overmost of the visual field (Fig. 2C).
Errors in aligning the rod to the true vertical aremeasured in degrees.
Our group16,18 has used 2 other screening tests ofvestibular function: Fukuda’s vestibular x-writing andstepping tests.27,28 However, we found that poor testperformances were not related to either poor balance21
or falls18 and that measurements obtained with thesetests had low to moderate test-retest reliability (ICCs[3,1] of .16 for the x-writing test and .51 for the steppingtest). Therefore, we have removed these tests from thescreening battery. We are currently developing what wehope will be more precise screening tests of vestibularfunctioning for subsequent versions of the PPA.
Peripheral Sensation Tests
Tactile sensitivity. Tactile sensitivity is measured with aSemmes-Weinstein–type pressure aesthesiometer.29 This
Figure 2.Visual and visual field dependence tests: (A) high- and low-contrast visual acuity, (B) contrastsensitivity, (C) visual field dependence.
240 . Lord et al Physical Therapy . Volume 83 . Number 3 . March 2003

instrument contains 8 nylon filaments of equal length,but varying in diameter. The force (in grams) requiredto bend each filament is precalibrated and ranges from0.0045 g to 447 g. The filaments are applied to thecenter of the lateral malleolus of the ankle (Fig. 3A).Subjects are instructed that the filament will be placed
on their ankle when the examiner says “A” or “B,” and ifthey feel the filament in contact with the skin, they mustreport to the examiner whether they felt it on “A” or “B.”Tactile threshold is determined using a staircase tech-nique, which involves presenting suprathreshold fila-ments initially, then applying smaller and smaller fila-ments until the subject can no longer detect them. Theexaminer then applies larger filaments until a filament isdetected. The touch threshold is determined from aminimum of 3 ascending and descending steps. Thepressure (in grams) exerted by this filament is convertedto log10 0.1 mg, yielding a scale of approximately equal-intensity intervals between filaments.
Vibration sense. Vibration sense is measured using anelectronic device* that generates a 200-Hz vibration ofvarying intensity. The vibration is applied to the tibialtuberosity via a 1-cm-diameter rubber stopper and ismeasured in microns of motion perpendicular to thebody surface (Fig. 3B). Three readings in the ascendingmode and 3 readings in the descending mode are made,and an average of these 6 measurements is recorded asthe vibration threshold.21
Proprioception (position sense). Proprioception has beendefined as the discrimination of the positions and move-ments of body parts based on information other thanvisual, auditory, or verbal.30 Proprioception is assessedfor the PPA using an established and validated lower-limb matching task.31 In this test, subjects are seated withtheir eyes closed and are asked to align their lower limbssimultaneously on either side of a vertical clear acrylicsheet (60�60�1 cm) inscribed with a protractor andplaced between their legs (Fig. 3C). To prevent limitedmotion at the knee joint from confounding the results ofthis test, the examiner needs to ensure that subjectsmatch their limbs near the midrange of knee jointmotion.31 Each trial is undertaken relatively quickly, withrests between trials, to avoid weakness unduly influenc-ing the results. Any difference in aligning the lowerlimbs (indicated by disparities in matching the great toeson either side of the acrylic sheet) is measured indegrees. After 2 practice trials, an average of 5 experi-mental trials is recorded.
We have previously found that lower-extremity muscleforce is weakly correlated with performance on this test,suggesting that it is not a major confounding factor(Lord SR, unpublished observations, 2001). Similarly,because the test is performed quickly and subjects areallowed to rest between trials, muscular endurance isunlikely to influence the results.
* Balance Systems, PO Box 915, Caringbah, Sydney, New South Wales, 1495,Australia.
Figure 3.Peripheral sensation tests: (A) tactile sensitivity, (B) vibration sense, (C)proprioception.
Physical Therapy . Volume 83 . Number 3 . March 2003 Lord et al . 241
������
������
������
������
����

Muscle Force TestsForce production of 3 lower-extremity muscle groups(knee flexors and extensors and ankle dorsiflexors) aremeasured for the PPA because these muscle groups areimportant when performing daily tasks such as risingfrom a chair32 and walking.13 Whipple et al33 and Stu-denski et al34 have compared the force production ofthese muscle groups (as well as that of the ankle plantarflexors) in residents of nursing homes with and withouta history of falls (“fallers” and “nonfallers”). Both studiesdemonstrated that fallers were weaker than nonfallers ineach muscle group, with ankle muscle weakness partic-ularly evident in the fallers.
Maximal isometric muscle force for the PPA is measuredfollowing the experimental protocol described by Gan-devia35 (Fig. 4). Testing of the knee extensor and flexormuscles is performed using a spring gauge attached tothe subject’s leg using a webbing strap with a Velcrofastener.† The force of the knee extensor and flexormuscles is measured with the subject sitting in a tall chairwith a strap around the leg 10 cm above the ankle joint,and the hip and knee joint angles positioned at 90degrees. In 3 trials per muscle group, the subjectattempts to pull against the strap assembly with maximalforce for 2 to 3 seconds, and the greatest force for eachmuscle group is recorded. The testing of ankle dorsiflex-ion force is done using a footplate attached to a springgauge. While the subject is sitting in a tall chair, the footis secured to the footplate using a webbing strap with aVelcro fastener with the angle of the knee at 110degrees. In 3 trials, the subject attempts maximal dorsi-flexion of the ankle, and the greatest force (in kilo-grams) is recorded.21,35
For the knee extension test, the spring gauge is affixedto a crossbar position behind the subject. For the kneeflexion test, the spring gauge is affixed to a crossbarpositioned in front the subject. For the ankle dorsiflex-ion test, the spring gauge is fixed to the bottom of afootplate. The subject’s own weight stabilizes the rig forthe knee extension test and for all except the strongestsubjects in the knee flexion test. For testing of kneeflexion force in stronger subjects, the chair can beaffixed to the floor or a baseplate. The footplate for theassessment of ankle dorsiflexion force is designed so thatit can be stabilized by the test administrator placing afoot on its baseplate.
Although we believe it is a desirable measure, ankleplantar-flexion force is not included in the PPA becauseit is difficult to assess with screening equipment, in thatequipment is required to stabilize the knee. However,ankle dorsiflexion force may provide an adequate mea-
† Velcro USA Inc, 406 Brown Ave, Manchester, NH 03103.
Figure 4.Muscle force tests: (A) knee flexion, (B) knee extension, (C) ankledorsiflexion.
242 . Lord et al Physical Therapy . Volume 83 . Number 3 . March 2003

sure of ankle muscle force, as a study by our group hasshown that ankle dorsiflexion force and ankle plantar-flexion force (when assessed using a rig that stabilizesthe leg) are highly correlated (r �.81, P �.001) in agroup of 45 young and elderly subjects (Lord SR,unpublished observations, 2002). Sherrington36 alsofound that muscle force measurements obtained using aspring gauge were strongly correlated with measure-ments obtained using a strain gauge, a sphygmomano-meter, and a hand-held dynamometer.
Reaction Time TestsReaction time for the PPA is assessed in millisecondsusing a hand-held electronic timer* and a light as thestimulus and depression of a switch by the finger and thefoot as the responses.21 The light stimulus is locatedadjacent to the response switches and is bright(ie, supra-threshold) to ensure that the tests are notinfluenced by the subject’s visual acuity. The timer has abuilt-in variable delay of 1 to 5 seconds to remove anycues that could be gained from the test administratorcommencing each trial by pressing the “start” button. A
modified computer mouse is used asthe response box for the finger presstask, and a pedal switch is used for thefoot press task (Figs. 5A and 5B). Fivepractice trials are undertaken, followedby 10 experimental trials.
Balance TestsPostural sway is measured using a swaymeter that measures displacements ofthe body at waist level. The deviceconsists of a 40-cm-long rod with avertically mounted pen at its end. Therod is attached to the subject by a firmbelt and extends posteriorly. As thesubject attempts to stand as still aspossible for 30 seconds, the penrecords the subject’s sway on a sheet ofmillimeter graph paper fastened to thetop of an adjustable-height table (Figs.6A and 6B). Testing is performed, witheyes open and closed, on a firm surfaceand on a medium-density foam rubbermat (15 cm thick). One trial of eachcondition is performed in the order ofthe difficulty of the test: on floor witheyes open, on floor with eyes closed, onfoam rubber mat with eyes open, andon foam rubber mat with eyes closed.Total sway (number of square milli-meter squares traversed by the pen)and anteroposterior and mediolateralsway are recorded for the 4 tests.21 Sher-rington36 also found that sway measure-
ments obtained with the sway meter are strongly associatedwith center-of-pressure sway measurements obtained froma forceplate, indicating that this simple technique providessimilar information about standing balance.
Validity of PPA MeasurementsA series of large-scale studies have been performed toevaluate the ability of the PPA tests to discriminatebetween elderly fallers and nonfallers. In each of thesestudies, a fall was defined as “an event that results in aperson coming to rest unintentionally on the ground orlower level, not as the result of a major intrinsic event(such as a stroke) or overwhelming hazard.” In a 1-yearprospective study of 95 residents of an intermediate carehostel, aged 59 to 97 years, the PPA measurements wereused to correctly classify subjects into a multiple fallsgroup (2 or more falls) or a non–multiple falls group(no falls or 1 fall) with an accuracy of 79%.18 Thiscategorization of falls status was used because it hasfrequently been found that multiple falls within a yearare more likely to indicate physiological impairmentsand chronic conditions than does a single fall.1,37,38 In a
Figure 5.Reaction time tests: (A) hand, (B) foot.
Physical Therapy . Volume 83 . Number 3 . March 2003 Lord et al . 243
������
������
������
������
����

second 1-year prospective study, thistime involving 414 community-dwelling women aged 65 to 99 years,the PPA measurements could be usedto correctly classify subjects into amultiple falls group or a non–multiple falls group with an accuracyof 75%.16 The largest-scale studyusing the PPA was a cross-sectionalinvestigation of 1,762 community-dwelling people aged 60 to 100 years.Subjects with a history of falls exhib-ited reduced knee extension force,poorer tactile sensitivity, greatervisual field dependence, and greatersway (independently of age) thanthose without a history of falls.19
Reliability of PPAMeasurementsTest-retest reliability of measure-ments obtained with the PPA hasbeen determined in several studieswith varying intertest periods.19,21,22
Table 1 presents data from 2 studiesthat involved administration of thetests to community-dwelling olderpeople on 2 occasions, 2 weeks apart.The sample for the vision, sensation,muscle force, and reaction time testscomprised 31 people (13 men, 18women) aged 76 to 87 years (X�80.8,SD�3.1) (Lord SR, unpublisheddata, 2002). These subjects took partin other research studies conductedby the Falls and Balance ResearchGroup of the Prince of Wales MedicalResearch Institute.32 The prevalenceof self-reported major medical condi-tions and limitations in activities ofdaily living in these subjects was sim-ilar to that of the larger sample fromwhich it was drawn. Eight subjects(25.8%) reported having heart dis-ease, 3 (9.7%) reported having astroke, 11 (35.5%) reported havinghigh blood pressure, 12 (38.7%)reported having osteoarthritis, and 2(6.5%) reported having diabetes. Thesample for the sway tests comprised34 people (13 men, 21 women) aged50 to 70 years (X�62.4, SD�6.3).22
In this sample, 4 subjects (11.8%)reported having a history of heartattack or stroke, 11 (32.4%) reportedhaving high blood pressure, 17
Figure 6.Postural sway tests: (A) standing on the floor, (B) standing on a foam rubber mat.
244 . Lord et al Physical Therapy . Volume 83 . Number 3 . March 2003

(50.0%) reported having osteoarthritis, and 2 (5.9%)reported having diabetes. Many subjects in both sampleshad multiple conditions.
In a third study, interrater reliability was determined forthe 2 sensation tests that demonstrated only moderatetest-retest reliability: tactile sensitivity and propriocep-tion (Lord SR, unpublished data, 2002). In this study, 2examiners independently conducted the tests with 10 ofthe subjects who took part in the test-retest reliabilitystudy. The ICC for the tactile sensitivity test was .81 (95%confidence interval [CI]�.40–.95), and the ICC for theproprioception test was .70 (95% CI�.17–.92).
Application of the PPAThe PPA has 2 versions: a comprehensive (or long)version and a screening (or short) version. The 2 ver-sions provide the same overall falls risk score. However,the comprehensive version provides information on abroad array of physiological measures that provideinsight into each subject’s impairments, including mea-surements of force in multiple lower-extremity musclegroups. Thus, we believe the comprehensive version issuitable for clinical settings (rehabilitation, physical ther-apy, and occupational therapy clinics and departmentsand dedicated falls clinics) that can dedicate 45 minutesper person for a falls risk assessment. The screeningversion takes 10 to 15 minutes to administer and is moresuitable for settings in which time constraints are anissue (ie, acute care hospitals and where the PPA formsonly part of a general health screening). The screeningversion contains 5 of these items: a test of vision (edge
contrast sensitivity), peripheral sensation (propriocep-tion), lower-extremity force (knee extension force), reac-tion time using a finger press as the response, and bodysway (sway when standing on the medium-density foamrubber mat). We identified these 5 items from discriminantfunction analyses as being the most important for discrim-inating between fallers and nonfallers in both institutionaland community settings.16,18,19
For both the short and long forms, a Web-based com-puter software program‡ has been developed to assess anindividual’s performance in relation to a normativedatabase compiled from the large-scale studies.16,18,19
This program produces a falls risk assessment report foreach individual that includes the following 4components:
1. A graph indicating an individual’s overall falls riskscore.
2. A profile of the individual’s test performances. Thisprofile allows a quick identification of physiologicalstrengths and weaknesses.
3. A table indicating the individual’s test performancesin relation to age-matched norms.
4. A written report that explains the results and makesrecommendations for improving functional perfor-mances or compensating for any impairmentsidentified.
Figures 7 and 8 and Table 2 present the output of thecomprehensive version of the PPA for a 79-year-old woman.
‡ www.powmri.unsw.edu.au/FBRG/calculator.htm.
Table 1.Test-Retest Reliability Data for the Physiological Profile AssessmentMeasuresa
Measure ICC (95% CI)
Visual acuity–high contrastb .82 (.66–.91)Visual acuity–low contrastb .81 (.64–.90)Contrast sensitivityb .81 (.70–.88)Visual field dependenceb .71 (.46–.86)Tactile sensitivityb .51 (.19–.74)Vibration senseb .78 (.59–.89)Proprioceptionb .50 (.15–.74)Knee flexion forceb .88 (.77–.94)Knee extension forceb .97 (.93–.98)Ankle dorsiflexion forceb .88 (.76–.94)Reaction time–handb .69 (.45–.84)Reaction time–footb .78 (.59–.89)Sway on floor–eyes openc .68 (.45–.82)Sway on floor–eyes closedc .85 (.72–.92)Sway on foam rubber mat–eyes openc .57 (.30–.76)Sway on foam rubber mat–eyes closedc .83 (.69–.91)
a ICC�intraclass correlation coefficient (2,1), CI�confidence interval.b Unpublished data from 31 people (13 men, 18 women) aged 76 to 87 years(X�80.8, SD�3.1).c Data from 34 people (13 men, 21 women) aged 50 to 70 years (X�62.4,SD�6.3).22
Figure 7.Falls risk graph for a 79-year-old woman. Normal ranged based ondata for a randomly selected sample of 550 community-dwelling womenaged 20 to 99 years.15
Physical Therapy . Volume 83 . Number 3 . March 2003 Lord et al . 245
������
������
������
������
����

Figure 7 shows her falls risk score—a single index scorederived from discriminant function analysis using the datafrom large-scale studies.16,18,19 The discriminant function ismade up of weighted scores of independent risk factors (ie,visual contrast sensitivity, lower-extremity proprioception,knee extension force, reaction time, and sway on thecompliant [foam rubber] surface). The graph presents thefalls risk score in relation to people of the same age andfalls risk criteria ranging from very low to marked.
Figure 8 shows the subject’s test performance profilegraph. This graph presents the test results in standard-ized (z) scores form, using the reference data from thelarge-scale studies.16,18,19 Thus, a score of zero indicatesaverage performance for people aged 65 years and over,
positive scores indicate above-average performances,and negative scores indicate below-average perfor-mances. Each unit represents one standard deviation.Because the scores have been standardized, the testresults can be compared with each other.
Table 2 shows the subject’s raw test scores presented ina conventional manner that complement the test perfor-mance profile graph. For each individual, referenceranges for each test are provided for (1) sex-matchedyoung subjects without known pathology or impairmentsand (2) age- and sex-matched subjects.15,19
Finally, the computer program compiles a written reportfor each subject. An example is presented in Appendix
Figure 8.Comprehensive Physiological Profile Assessment (PPA) z-score output for a 79-year-old woman.
246 . Lord et al Physical Therapy . Volume 83 . Number 3 . March 2003

2. It summarizes the findings, highlights below-averageperformances, and makes individual recommendationsfor reducing the risk for falls.
Examples of the PPA in Clinical GroupsThe Falls and Balance Research Group of the Prince ofWales Medical Research Institute have used the PPA fornumerous groups who have an increased risk of falling,including people aged 65 years and over,16–19 people withdiabetes mellitus,39 and people with a history of poliomy-elitis.40 Figure 9 shows typical examples of the z-scoreoutput for a young person without known pathology orimpairments (27 years of age), a person with age-relatedmacular degeneration (82 years of age), a person withdiabetes mellitus (67 years of age), and a person with ahistory of poliomyelitis (51 years of age). As shown in thegraphs for subjects with diagnosed diseases, their perfor-mance reflects the known manifestations of their diseases.
As expected, the older person with macular degenera-tion performed poorly in each of the visual tests. She alsodemonstrated impaired balance, particularly in the pos-tural sway test with eyes open on the foam rubber mat.Our research group has previously found that althoughvision is not critical for the maintenance of stability whenstanding on a firm surface, standing on a compliantsurface relies more strongly on visual input because
proprioceptive input from the feet andankles is reduced.15,21,41 In this situa-tion, visual acuity and stereopsis play animportant role in stabilizing balance.41
This finding indicates that people withmacular degeneration are at risk forfalling, not only because of a reducedability to perceive hazards in the envi-ronment but also because of impairedbalance. Older people with this condi-tion are likely to be at particular riskwhen standing or walking in challeng-ing environmental conditions such ason uneven or compliant surfaces.
The older person with diabetes mellitusscored poorly on tests of peripheralsensation, which reflects the presenceof diabetic peripheral neuropathy. Thisfinding is consistent with the resultsfrom a previous study conducted by ourgroup39 comparing 25 people with dia-betes mellitus with 40 age-matched con-trol subjects. Despite exhibiting above-average lower-extremity muscle force,this subject also performed poorly onthe postural sway tests, most notably (inrelative terms) in the unchallengedstanding on floor conditions. This find-
ing is consistent with research that has shown thatperipheral sensation is the most important contributorto postural stability in quiet standing15,21 and providesinsight into why patients with diabetes have an increasedrisk for falls.42,43
The older person with a history of poliomyelitis per-formed poorly on the tests of lower-extremity force,proprioception, and postural sway on a foam rubbermat, but exhibited above-average vision and averagetactile sensation and vibration sense. A recently com-pleted study of 40 people with a history of poliomyelitis(28–71 years of age) and 38 age-matched control sub-jects confirmed that people with a history of poliomyeli-tis represent a clinical group with lower-limb weakness,but in whom most other physiological factors associatedwith balance are similar to those in the general commu-nity.40 Consistent with previous studies of older peo-ple,15,21,41 reduced muscle force impairs standing bal-ance when subjects stand on a compliant surface. Thissubject’s reduced proprioceptive score is also of interestas recent research that has shown that muscle spindles(which provide an important contribution to proprio-ceptive acuity44) are much less effective in signalingmovement when contraction levels are high.45 Thissuggests that muscle weakness results in a relative failureof proprioceptive input from the legs, and with such
Table 2.Individual Test Performance for a 79-Year-Old Woman in Relation to Reference Ranges forSex-Matched Young Subjects Without Known Pathology or Impairments (Group 1) and Age-and Sex-Matched Subjects (Group 2)15
Test Score Group 1 Group 2a
VisionVisual acuity–high contrast 2.5b 0.54–0.82 0.83–1.58Visual acuity–low contrast 6b 0.76–1.05 1.32–2.65Edge contrast sensitivity 13b 23–24 20–24Visual field dependence 1.5 0.0–2.0 0.5–6.5
SensationTactile sensitivity–ankle 3.7 3.22–4.08 3.61–4.31Vibration sense–knee 15.5 2–5 7–34Proprioception 1 0.2–1.4 0.4–2.4
Muscle forceAnkle dorsiflexion 7 10–15 6–10.5Knee extension 21 35–58 15–29Knee flexion 10 22–29 7–34
Reaction timeHand 251 182–236 197–267Foot 278 213–273 230–305
BalanceSway on floor–eyes open 120b 35–70 40–100Sway on floor–eyes closed 158 55–95 50–160Sway on foam rubber mat–eyes open 286b 60–110 65–163Sway on foam rubber mat–eyes closed 581b 70–185 108–285
a Women aged 75 to 79 years.b Worse than average age-matched.
Physical Therapy . Volume 83 . Number 3 . March 2003 Lord et al . 247
������
������
������
������
����

Figure 9.Physiological Profile Assessment z-score outputs for various groups: (A) young adult (27 years of age), falls risk score��0.87; (B) older person withmacular degeneration (82 years of age), falls risk score�1.55; (C) person with diabetic peripheral neuropathy (67 years of ages), falls riskscore�1.55; (D) older person with a history of poliomyelitis, (51 years of age) falls risk score�1.75.
248 . Lord et al Physical Therapy . Volume 83 . Number 3 . March 2003
reduced motor output, the availability of other sensoryinputs becomes increasingly important for maintainingstability.
Use of the PPA in Clinical TrialsWe believe the individual muscle force, speed, andbalance tests are not just important for assessing falls riskbut also can be useful outcome measures in exercisestudies.22,46 The Falls and Balance Research Group ofthe Prince of Wales Medical Research Institute is cur-rently conducting a randomized controlled trial involv-ing 600 community-dwelling people aged 75 years andover. The major aim of the study is to determine whethertailored interventions identified by the comprehensivePPA can reduce the rate of falling by maximizing per-formance in muscle force, balance, vision, peripheralsensation, and visual field dependence.
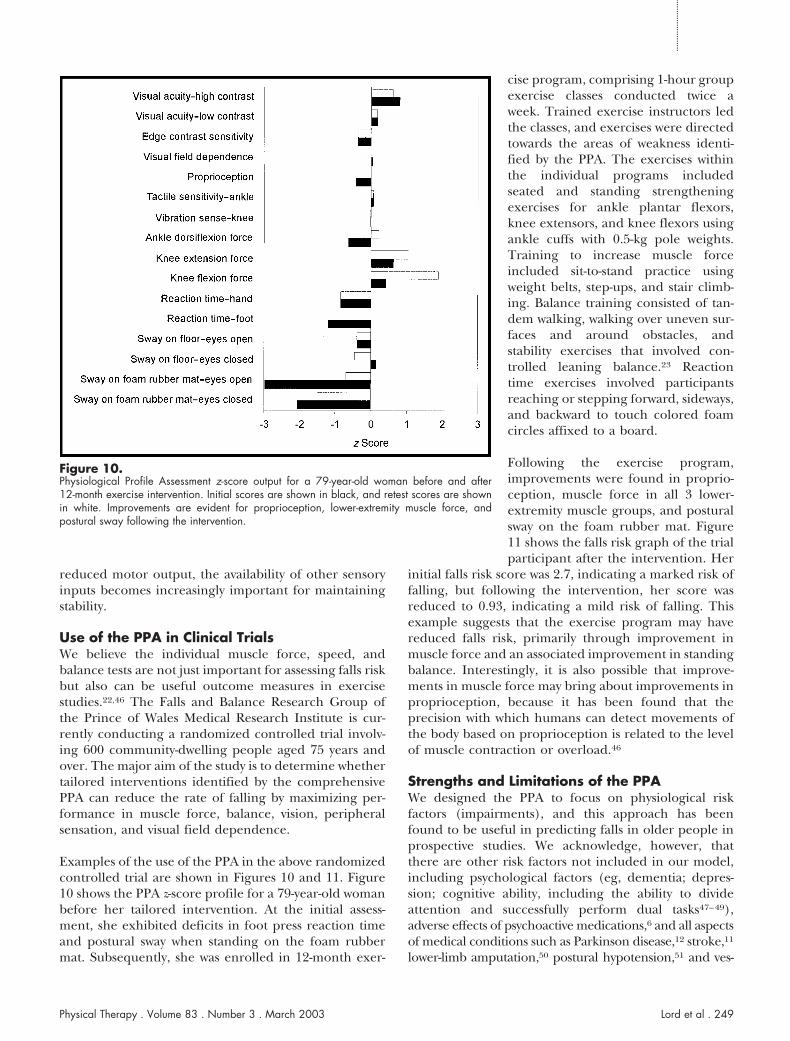
Examples of the use of the PPA in the above randomizedcontrolled trial are shown in Figures 10 and 11. Figure10 shows the PPA z-score profile for a 79-year-old womanbefore her tailored intervention. At the initial assess-ment, she exhibited deficits in foot press reaction timeand postural sway when standing on the foam rubbermat. Subsequently, she was enrolled in 12-month exer-
cise program, comprising 1-hour groupexercise classes conducted twice aweek. Trained exercise instructors ledthe classes, and exercises were directedtowards the areas of weakness identi-fied by the PPA. The exercises withinthe individual programs includedseated and standing strengtheningexercises for ankle plantar flexors,knee extensors, and knee flexors usingankle cuffs with 0.5-kg pole weights.Training to increase muscle forceincluded sit-to-stand practice usingweight belts, step-ups, and stair climb-ing. Balance training consisted of tan-dem walking, walking over uneven sur-faces and around obstacles, andstability exercises that involved con-trolled leaning balance.23 Reactiontime exercises involved participantsreaching or stepping forward, sideways,and backward to touch colored foamcircles affixed to a board.
Following the exercise program,improvements were found in proprio-ception, muscle force in all 3 lower-extremity muscle groups, and posturalsway on the foam rubber mat. Figure11 shows the falls risk graph of the trialparticipant after the intervention. Her
initial falls risk score was 2.7, indicating a marked risk offalling, but following the intervention, her score wasreduced to 0.93, indicating a mild risk of falling. Thisexample suggests that the exercise program may havereduced falls risk, primarily through improvement inmuscle force and an associated improvement in standingbalance. Interestingly, it is also possible that improve-ments in muscle force may bring about improvements inproprioception, because it has been found that theprecision with which humans can detect movements ofthe body based on proprioception is related to the levelof muscle contraction or overload.46
Strengths and Limitations of the PPAWe designed the PPA to focus on physiological riskfactors (impairments), and this approach has beenfound to be useful in predicting falls in older people inprospective studies. We acknowledge, however, thatthere are other risk factors not included in our model,including psychological factors (eg, dementia; depres-sion; cognitive ability, including the ability to divideattention and successfully perform dual tasks47–49),adverse effects of psychoactive medications,6 and all aspectsof medical conditions such as Parkinson disease,12 stroke,11
lower-limb amputation,50 postural hypotension,51 and ves-
Figure 10.Physiological Profile Assessment z-score output for a 79-year-old woman before and after12-month exercise intervention. Initial scores are shown in black, and retest scores are shownin white. Improvements are evident for proprioception, lower-extremity muscle force, andpostural sway following the intervention.
Physical Therapy . Volume 83 . Number 3 . March 2003 Lord et al . 249
������
������
������
������
����

tibular disease.52 Therefore, we believe the PPA needs to beviewed as being complementary to the traditional medicalapproach based on diagnosis of diseases.
We also acknowledge that as the PPA requires special-ized equipment and the data require computer process-ing and that it has cost and time disadvantages overother simple assessment measures not requiring equip-ment or computer analysis. These disadvantages, in ourview, should be balanced with the advantages that thePPA provides in terms of providing is a validated assess-ment of the risk of falling and physiological functioningacross multiple domains.
We have found, like other researchers,24 that the mea-surements obtained with the sensory tests are less reli-able than those obtained with the motor tests. Webelieve, however, that there is acceptable interraterreliability (ie, .70 for proprioception and .81 for tactilesensitivity), and this suggests that the moderate test-retestreliability relates mostly to variable subject performanceand not experimenter measurement error. Despite this,each of the sensation measures appears to be useful indiscriminating significantly between older fallers and non-fallers. Thus, it appears that the tests are useful in thisregard because their variability within subjects is lower thantheir variability between falls outcome groups. Finally, weacknowledge that to refine and enhance the PPA, validatedassessments of depth perception, vestibular function, andleaning balance are desirable.
ConclusionsGillespie et al,53 in a recent systematic review of inter-ventions used to prevent falls in older people, concludedthat protection against falling may be maximized byinterventions that target multiple risk factors in individ-ual patients and that health care providers should con-sider screening of older people who are risk for falls,followed by targeted interventions for deficit areas. Wefeel that the PPA fulfills these criteria by utilizing vali-
dated assessments and normative data from large-scalestudies to identify key physiological risk factors (impair-ments) that can be targeted with interventions.
The PPA has been devised to complement the medicalassessment and management of older people who are atrisk for falling. We believe the major strength of the PPAis that it uses a function-based and quantitative modeland thus provides a powerful tool for falls risk factoridentification and the evaluation of interventions aimedat maximizing physical functioning. We contend that thePPA can provide valuable information for physical ther-apists and other health care professionals in bothresearch and practice. The PPA equipment and com-puter program are commercially available. The currentprice for the comprehensive and screening versions ofthe PPA are US$6,000 and US$3,000 respectively. Fur-ther information can be obtained from Dr Lord [email protected] or www.powmri.unsw.edu.au/FBRG/.
References1 Lord SR, Sherrington C, Menz HB. Falls in Older People: Risk Factorsand Strategies for Prevention. Cambridge, United Kingdom: CambridgeUniversity Press; 2001.
2 Tinetti ME, Speechley M, Ginter SF. Risk factors for falls amongelderly persons living in the community. N Engl J Med.1988;319:1701–1707.
3 Campbell AJ, Borrie MJ, Spears GF. Risk factors for falls in acommunity-based prospective study of people 70 years and older. JGerontol. 1989;44:M112-M117.
4 Lord SR, Ward JA, Williams P, Anstey KJ. An epidemiological study offalls in older community-dwelling women: the Randwick falls andfractures study. Australian Journal of Public Health. 1993;17:240–245.
5 Lipsitz LA, Johnsson PV, Kelley MM, Koestner JS. Causes andcorrelates of recurrent falls in ambulatory frail elderly. J Gerontol.1991;46:M114-M122.
6 Yip YB, Cumming RG. The association between medications and fallsin Australian nursing-home residents. Med J Aust. 1994;160:14–18.
7 Thapa PB, Brockman KG, Gideon P, et al. Injurious falls in nonam-bulatory nursing home residents: a comparative study of circum-stances, incidence, and risk factors J Am Geriatr Soc. 1996;44:273–278.
8 Gibson MJ, Andres RO, Isaacs B, et al. The prevention of falls in laterlife: a report of the Kellogg International Work Group on thePrevention of Falls by the Elderly. Dan Med Bull. 1987;34(suppl4):1–24.
9 Lord SR. Falls in the elderly: admissions, bed use, outcome andprojections. Med J Aust. 1990;153:117–118.
10 Speechley M, Tinetti ME. Falls and injuries in frail and vigorouscommunity elderly persons. J Am Geriatr Soc. 1991;39:46–52.
11 Tinetti ME, Williams TF, Mayewski R. Falls risk index for elderlypatients based on number of chronic disabilities. Am J Med.1986;80:429–434.
12 Smithson F, Morris ME, Iansek R. Performance on clinical tests ofbalance in Parkinson disease. Phys Ther. 1998;78:577–592.
13 Lord SR, Lloyd DG, Li SK. Sensori-motor function, gait patterns andfalls in community-dwelling women. Age Ageing. 1996;25:292–299.
Figure 11.Falls risk graph of a 79-year-old woman before and after 12-monthexercise intervention. The initial falls risk score was 2.7, and the retestfalls risk score was 0.93. Normal range based on data for a randomlyselected sample of 550 community-dwelling women aged 20 to 99 years
250 . Lord et al Physical Therapy . Volume 83 . Number 3 . March 2003

14 Menz HB, Lord SR. The contribution of foot problems to mobilityimpairment and falls in community-dwelling older people. J Am GeriatrSoc. 2001;49:1651–1656.
15 Lord SR, Ward JA. Age-associated differences in sensori-motorfunction and balance in community dwelling women. Age Ageing.1994;23:452–460.
16 Lord SR, Ward JA, Williams P, Anstey K. Physiological factorsassociated with falls in older community-dwelling women. J Am GeriatrSoc. 1994;42:1110–1117.
17 Lord SR, Dayhew J. Visual risk factors for falls in older people. J AmGeriatr Soc. 2001;49:676–677.
18 Lord SR, Clark RD, Webster IW. Physiological factors associatedwith falls in an elderly population. J Am Geriatr Soc. 1991;39:1194–200.
19 Lord SR, Sambrook PN, Gilbert C, et al. Postural stability, falls andfractures in the elderly: results from the Dubbo Osteoporosis Epide-miology Study. Med J Aust. 1994;160:684–685, 688–691.
20 Task Force on Standards for Measurement in Physical Therapy.Standards for tests and measurements in physical therapy practice. PhysTher. 1991;71:589–622.
21 Lord SR, Clark RD, Webster IW. Postural stability and associatedphysiological factors in a population of aged persons. J Gerontol.1991;46:M69-M76.
22 Lord SR, Castell S. Physical activity program for older persons:effect on balance, strength, neuromuscular control, and reaction time.Arch Phys Med Rehabil 1994;75:648–652.
23 Lord SR, Ward JA, Williams P. The effect of exercise on dynamicstability in older women: a randomized controlled trial. Arch Phys MedRehabil. 1996;77:232–236.
24 Fagius J, Wahren LK. Variability of sensory threshold determinationin clinical use. J Neurol Sci. 1981;51:11–27.
25 Verbaken JH, Johnston AW. Population norms for edge contrastsensitivity. American Journal of Optometry and Physiological Optics.1986;63:724–732.
26 Lord SR, Webster IW. Visual field dependence in elderly fallers andnon-fallers. Int J Aging Hum Dev. 1990;31:267–277.
27 Kosoy J. The oto-neurologic examination. Acta Oto-Laryngologica.1977;S343:1–95.
28 Fukuda T. The stepping test: two phases of the labyrinthine reflex.Acta Oto-Laryngologica. 1959;50:95–108.
29 Semmes J, Weinstein S, Ghent L, Teuber H. Somatosensory ChangesAfter Penetrating Brain Wounds in Man. Cambridge, Mass: HarvardUniversity Press; 1960.
30 Howard IP, Templeton WB. Human Spatial Orientation. London,United Kingdom: John Wiley & Sons Ltd; 1966.
31 DeDominico G, McCloskey DI. Accuracy of voluntary movements atthe thumb and elbow joints. Exp Brain Res. 1987;65:471–478.
32 Lord SR, Murray SM, Chapman K, et al. Sit-to-stand performancedepends on sensation, speed, balance, and psychological status inaddition to strength in older people. J Gerontol A Biol Sci Med Sci.2002:57:M539-M543.
33 Whipple RH, Wolfson LI, Amerman PM. The relationship of kneeand ankle weakness to falls in nursing home residents: an isokineticstudy. J Am Geriatr Soc. 1987;35:13–20.
34 Studenski S, Duncan PW, Chandler J. Postural responses andeffector factors in persons with unexplained falls: results and method-ologic issues. J Am Geriatr Soc. 1991;39:229–234.
35 Gandevia SC. Spinal and supraspinal factors in human musclefatigue. Physiol Rev. 2001;81:1725–1789.
36 Sherrington C. The Effects of Exercise on Physical Ability FollowingFall-Related Hip Fracture [PhD thesis]. Sydney, New South Wales,Australia: University of New South Wales; 2000.
37 Nevitt MC, Cummings SR, Kidd S, Black D. Risk factors forrecurrent nonsyncopal falls: a prospective study. J Am Geriatr Soc.1989;261:2663–2668.
38 Ivers RQ, Cumming RG, Mitchell P, et al. Visual impairment andfalls in older adults: the Blue Mountains Eye Study. J Am Geriatr Soc.1998;46:58–64.
39 Lord SR, Caplan GA, Colagiuri R, et al. Sensori-motor function inolder persons with diabetes. Diabet Med. 1993;10:614–618.
40 Lord SR, Allen GM, Williams P, Gandevia SC. Risk of falling:predictors based on reduced strength in persons previously affected bypolio. Arch Phys Med Rehabil. 2001;83:907–911.
41 Lord SR, Menz HB. Visual contributions to postural stability inolder adults. Gerontology. 2000;46:306–310.
42 Richardson J, Ching C, Hurvitz E. The relationship between elec-tromyographically documented peripheral neuropathy and falls. J AmGeriatr Soc. 1992;40:1008–1012.
43 Richardson JK, Hurvitz EA. Peripheral neuropathy: a true risk factorfor falls. J Gerontol. 1995;50:M211-M215.
44 McCloskey DI. Muscle, cutaneous, and joint receptors in kinaesthe-sia. In: Ferrell WR, Proske U, eds. Neural Control of Movement. New York,NY: Plenum Press; 1995.
45 Proske U, Wise A, Gregory J. The role of muscle receptors in thedetection of movements. Prog Neurobiol. 2000;60:85–96.
46 Lord SR, Ward JA, Williams P, Strudwick M. The effect of a12-month exercise program on balance, strength, and falls in olderwomen: a randomized controlled trial. J Am Geriatr Soc.1995;43:1198–1206.
47 Woollacott M, Shumway-Cook A. Attention and the control ofposture and gait: review of an emerging area of research. Gait Posture.2002;16:1–14.
48 Maylor EA, Wing AM. Age differences in postural stability areincreased by additional cognitive demands. J Gerontol B Psychol Sci SocSci. 1996;51:P143-P154.
49 Teasdale N, Simoneau M. Attentional demands for postural control:the effects of aging and sensory reintegration. Gait Posture.2001;14:203–210.
50 Miller WC, Speechley M, Deathe B. The prevalence and risk factorsof falling and fear of falling among lower extremity amputees. ArchPhys Med Rehabil. 2001;82:1031–1037.
51 Heitterachi E, Lord SR, Meyerkort P, et al. Blood pressure changeson upright tilting predict falls in older people. Age Ageing.2002;31:181–186.
52 Brandt T, Dieterich M. Vestibular falls. J Vestib Res. 1993;3:3–14.
53 Gillespie LD, Gillespie WJ, Cumming R, et al. Interventions toreduce the incidence of falling in the elderly (Cochrane Review). TheCochrane Library, issue 3. Oxford, United Kingdom: Update Software. 1999.Available at: http://www.update-software.com/abstracts/titlelist.htm.
Physical Therapy . Volume 83 . Number 3 . March 2003 Lord et al . 251
������
������
������
������
����

Appendix 2.Written Report Summarizing the Physiological Profile AssessmentFindings (the Name “Jane Smith” Is a Pseudonym)a
21st January, 2003Jane Smith1 Australia StSydney, New South Wales 2000
Dear Mrs Smith,
Please find attached the report regarding your falls risk assessment at thePrince of Wales Medical Research Institute on 21st January 2003. Thesetest results indicate that you have an increased risk of falling.
You performed well in the important tests of visual field dependence,proprioception and tactile sensitivity. In some areas, however, you werebelow average for your age group, so the following recommendationsmay be of help to you.
One or more of your vision tests were below average. Reduced visioncan increase the risk of a trip over an unseen object in the environmentsuch as steps, gutters and footpath cracks and raised edges. It isrecommended that you see an eye specialist for an assessment if youhave not done so in the past year. You may also benefit from wearinga single lens pair of glasses, especially when outside. It is recommendedthat you do not wear bifocal or multifocal spectacles, as the lowersections of these spectacles blur items at critical distances on the groundand this can lead to trips. Wearing a hat outside also improves vision byreducing glare substantially.
Your sway scores were high indicating reduced balance control. Thereare certain situations where you should take particular care: whenwalking on soft or uneven surfaces such as thick carpets and soft orrough ground. You may also be at risk of losing balance in dim or unlitareas, so avoid such areas where possible and make sure you turn thelight on before walking in the house at night. Exercises can improvestrength, coordination and balance. It is recommended that youincrease your current level of physical activity, with a program ofplanned walks 3 times a week and a complementary program of groupor home-based exercises. However, you should be assessed by yourgeneral practitioner prior to undertaking any exercise program. Theattached home exercises could benefit you in this area. Finally, it isrecommended that you wear shoes with low heels and firm rubber soles.These are best for balance.
For inquiries regarding this report, please contact the Falls and BalanceResearch Group at the Prince of Wales Medical Research Institute on93822721.
Yours sincerely,
Dr Stephen R. Lorda Report is reproduced verbatim as shown in original report.
Appendix 1.Visual Acuity Conversion Chart
Score (Line Number-Number Correct)
ConvertedScore
60–1 —60–2 —60–3 10.0036–1 9.0036–2 8.0036–3 7.0036–4 6.0030–1 5.8030–2 5.6030–3 5.4030–4 5.2030–5 5.0024–1 4.8024–2 4.6024–3 4.4024–4 4.2024–5 4.0020–1 3.8720–2 3.7320–3 3.6020–4 3.4720–5 3.3315–1 3.1715–2 3.0015–3 2.8315–4 2.6715–5 2.5012–1 2.4012–2 2.3012–3 2.2012–4 2.1012–5 2.009–1 1.909–2 1.809–3 1.709–4 1.609–5 1.507.5–1 1.457.5–2 1.407.5–3 1.357.5–4 1.307.5–5 1.256–1 1.206–2 1.156–3 1.106–4 1.056–5 1.005–1 0.975–2 0.935–3 0.905–4 0.875–5 0.834–1 0.804–2 0.774–3 0.734–4 0.704–5 0.673–1 0.633–2 0.603–3 0.573–4 0.533–5 0.50
252 . Lord et al Physical Therapy . Volume 83 . Number 3 . March 2003


![[Poster] Physiological and Anthropometric Profile of Portuguese Professional Kickboxers, Gil S., Leonardo C., Tatiana P., João B.](https://static.fdocuments.net/doc/165x107/55720e67497959fc0b8c7750/poster-physiological-and-anthropometric-profile-of-portuguese-professional-kickboxers-gil-s-leonardo-c-tatiana-p-joao-b.jpg)