A Physiological Foundation for the Nutrition-based E ... · A Physiological Foundation for the...
25
A Physiological Foundation for the Nutrition-based Efficiency Wage Model Carl-Johan Dalgaard * and Holger Strulik ** Leibniz Universit¨ at Hannover, Discussion Paper No. 396 ISSN 0949-9962 This Version: July 2010 (First Version: April 2008) Abstract. Drawing on recent research on allometric scaling and energy con- sumption, the present paper develops a nutrition-based efficiency wage model from first principles. The biologically micro-founded model allows us to ad- dress empirical criticism of the original nutrition-based efficiency wage model. By extending the model with respect to heterogeneity in worker body size and a physiologically founded impact of body size on productivity, we demonstrate that the nutrition-based efficiency wage model is compatible with the empiri- cal regularity that taller workers simultaneously earn higher wages and are less likely to be unemployed in less developed economies. The theory also provides an answer to the question of why the height-unemployment association may disappear in the process of development. Keywords: Efficiency Wages, Nutrition, Metabolism, Allometric Scaling, Body Size. JEL: O11, O15, J21, J31. * University of Copenhagen, Department of Economics, Studiestraede 6, 1455 Copenhagen K, Denmark; email: [email protected]. ** University of Hannover, Wirtschaftswissenschaftliche Fakult¨ at, K¨ onigsworther Platz 1, 30167 Hannover, Ger- many; email: [email protected].
Transcript of A Physiological Foundation for the Nutrition-based E ... · A Physiological Foundation for the...

A Physiological Foundation for the Nutrition-based Efficiency Wage Model
Carl-Johan Dalgaard∗ and Holger Strulik∗∗
Leibniz Universitat Hannover, Discussion Paper No. 396
ISSN 0949-9962
This Version: July 2010 (First Version: April 2008)
Abstract. Drawing on recent research on allometric scaling and energy con-
sumption, the present paper develops a nutrition-based efficiency wage model
from first principles. The biologically micro-founded model allows us to ad-
dress empirical criticism of the original nutrition-based efficiency wage model.
By extending the model with respect to heterogeneity in worker body size and
a physiologically founded impact of body size on productivity, we demonstrate
that the nutrition-based efficiency wage model is compatible with the empiri-
cal regularity that taller workers simultaneously earn higher wages and are less
likely to be unemployed in less developed economies. The theory also provides
an answer to the question of why the height-unemployment association may
disappear in the process of development.
Keywords: Efficiency Wages, Nutrition, Metabolism, Allometric Scaling,
Body Size.
JEL: O11, O15, J21, J31.
∗University of Copenhagen, Department of Economics, Studiestraede 6, 1455 Copenhagen K, Denmark; email:[email protected].∗∗University of Hannover, Wirtschaftswissenschaftliche Fakultat, Konigsworther Platz 1, 30167 Hannover, Ger-many; email: [email protected].

1. Introduction
One of the most prominent theories of wage formation and unemployment in development
economics is the nutrition based efficiency wage model due to Leibenstein (1956), Mirrlees (1976),
Stiglitz (1976) and Bliss and Stern (1978a,b). The basic theory works as follows. Assume output
is a concave function of labor input; the number of people and their “effort” level. Next, suppose
higher wages allow for a higher nutritional intake of workers, which stimulates effort. Then the
optimal wage, from the perspective of the producer, will be the one which minimizes the wage
bill in efficiency units of labor (i.e., the wage rate divided by the effort level). If one makes
the appropriate assumptions about the nature of the “effort function”, linking effort to wages,
an interior solution exists. Figure 1 provides a geometric illustration; w∗ is thus the wage level
which minimizes labor cost. Given the wage, thus determined, the level of employment is given
by the first order condition from profit maximization: the marginal product of labor equals its
factor price. Insofar as total employment, obtained by summing across firms, falls short of total
labor supply, unemployment arises in equilibrium. Moreover, since the wage is optimal from the
perspective of employers, unemployed laborers cannot undercut.
Figure 1: Determination of the Efficiency Wage
w
e
w∗
e(w)
Albeit highly influential, the nutrition-based efficiency wage theory has been criticized em-
pirically. While in theory the level of wages is essentially given by the curvature of the effort
function, which is unobserved and unspecified by the theory, one may nevertheless attempt a
test of the model by examining whether wages responds to the nutritional intake of workers
(calories per day, say). Such a link should be present in the data, although this test is only a
1

test of the reduced form of the model.1 Some past research has established a positive impact
of calorie intake on wages (Strauss, 1986). Unfortunately, however, this association seems to
disappear once the body size of workers is taken into account (Deolalikar, 1988). Theoretically,
worker body size could matter to wages independently of effort. This would be the case if body
size proxies the health of workers, which in turn affects the marginal product of labor and thus
wages (e.g, Fogel, 1994; Schultz, 2002; Weil, 2007).
As a result, the findings of Deolalikar (1988) are troubling; they suggest the nutrition-wage
link mainly is spurious, possibly reflecting the omission of “health” from the production function,
and that richer (healthier) workers spend more on nutrition. Accordingly, such findings instil
doubt as to whether the nutrition-based theory of wage determination is important in practice.
In this paper we address this critique theoretically by providing a physiological foundation for
the effort function with strong micro-foundations. The theory provides a more precise definition
of (a) the notion of “effort”, and (b) how energy requirements (and therefore wage requirements)
depend on effort. We base these micro-foundations on recent research in the fields of biology
and human nutrition.
On this basis we solve for the partial equilibrium in the labor market, demonstrating the
viability of the unemployment equilibrium. In addition, we derive equilibrium wages, as a
function of worker characteristics, and proceed to show that the micro-founded theory predicts
that there should be no association between wages and nutrition, conditional on body size. This
resolves the apparent tension between available evidence and the efficiency wage hypothesis.
That is, it explains why findings of e.g. Deolalikar, (1988) do not falsify the nutrition-based
efficiency wage model. At the same time, developing micro-foundations for the effort function
provides important clues as to how stronger tests of the model may be devised.
Another benefit of providing micro-foundations for the effort function is that we can calibrate
the model. As a result, we can quantify the implied association between body size of workers
and wages. In addition, we can assess the size of the gap between equilibrium wages, and the
hypothetical wage needed to cover energy expenditures for “subsistence”.2 This allows us to
address a second line of criticism marshalled against the nutrition-based efficiency wage model.
1The test would fail if either nutrition does not raise effort (suitably defined), or if additional effort does not raisewages.2In this paper we follow Dalgaard and Strulik (2010) in defining the level of “subsistence” as the amount of energyrequired to cover basal metabolic needs. Metabolism refers to the biochemical processes by which nutrients aretransformed into energy, which allows the organs of the body (i.e. ultimately the cells of the body) to function.The basal metabolic rate is defined as the amount of energy expended while at rest.
2

Existing empirical work has demonstrated that wages in poor places seem to be (far) above
subsistence. For example, Dasgupta (1997) notes (p. 31) that in India 15-20 % of wages paid
should be enough to cover “personal energy requirements” thus suggesting an 80% “wage pre-
mium”. At first sight, wages way above subsistence seem hard to reconcile with the efficiency
wage model, as one might imagine that workers cannot be energy constrained in this region.
As a result, one may argue that undercutting should arise (see Swamy, 1997). The baseline
model can, however, under reasonable (i.e., biologically supported) assumptions easily account
for an 80% “wage premium”. Hence, wages considerably above subsistence need not instigate
undercutting.
Physical activity is not the only reason why average wages exceed the “subsistence threshold”
by a considerable margin, as made clear in an extension of the basic model. In the baseline model
we employ the notion of a representative worker, of given body size. In practice, of course, people
come in different sizes. We therefore extend the model by allowing for heterogeneity in stature,
so as to examine which workers will be rationed in equilibrium.
In the extended model we specify how body size matters to productivity, for effort given.
Drawing on research in sports physiology and biology, we explain how stature should relate to
physical performance, and thus productivity. This aspect of the model is based on the idea that
many occupations in poor economies are of a manual variety. Much like body size importantly
influences the performance of athletes in various disciplines, we argue the same would be true
for worker performance in firms. The nature of the link between body size and performance,
however, critically depends on the specific task the worker is assumed to perform. Consequently
we can characterize situations where the augmented efficiency wage model would lead us to
expect that larger or smaller workers are rationed.
In the case where large workers are preferred, and we would argue it is the typical outcome
in poor economies, selection will imply that standard calculations of the “wage gap”, mentioned
above, may be misleading. The reason is that “personal energy requirements” typically refer to
that of an average individual in the labor force. But if in equilibrium only larger people tend to
be employed (so that the average person employed is larger than the average in the labor force),
part of what would seem to be a “wage premium” may reflect the positive selection of workers
with larger energy requirements than the average.3
3Strauss and Thomas (1998) provide evidence that smaller individuals, in poor countries, are less likely to beworking.
3

Hence, the augmented model provides a second reason why small and “cheap” workers cannot
undercut wages. While smaller people may be cheaper to sustain, they are not attractive to
firms since they are less productive than larger and more energy costly individuals.4
The model featuring size heterogeneity also allows us to discuss the concept of “task-specific
technological innovations”. Below, we hypothesize that technology usually reduces energy re-
quirements of humans in the production process. This process may manifest itself in changing
the nature of the selection process of workers, as the nature of the work done at the level of
firm’s changes. If, for example, technological change reduces the need for “brawn”, smaller
workers (e.g., women and perhaps children) will become more attractive to employers.5 Finally,
we examine the efficiency wage model in the case where effort is imperfectly observable. In this
case wages may be set sub-optimally low by the employer, based on his or her expectation about
worker effort. Nevertheless undercutting will not take place. A new interesting result from this
extension is that employers are less likely to select in favor of physically large workers when
work is done at a piece-rate basis.
The precursors to the present paper are the theoretical contributions to the literature on
efficiency wages: Mirrlees (1976), Stiglitz (1976), Bliss and Stern (1978a,b), Dasgupta and Ray
(1986) and Bose (1997). Also related is the model of nutrition and productivity by Svedberg
(2000, Ch. 3). Bliss and Stern (1978b) is of particular relevance since the authors discuss the
nutritional basis for the efficiency wage hypothesis.
The present paper has, however, the advantage of being able to draw on more recent research
in biology and from the science of nutrition. As a result our approach differs in a number of
important respects. First, we employ a different conceptualization of effort. Whereas Bliss
and Stern (1978b) conceptualize effort as the number of “tasks” performed (during a day, say),
we associate effort with the physical activity level (PAL) in keeping with research in human
nutrition and physiology. The key advantage of employing PAL in characterizing effort is that
it is an appropriate metric for evaluating the intensity of work in any occupation. In contrast,
a “task” can involve greatly varying degrees of work intensity depending on how it is defined.
Second, more recent research in biology leads us to a different specification of the energy costs
of such effort, compared to what Bliss and Stern explores. Finally, Bliss and Stern (1978b) do
4Yet another reason for lack of undercutting could be that the individual worker may have a family to support,thus preventing undercutting even if wages exceed personal energy expenditure (Dasgupta, 1997).5This idea is related to, but distinct from, the notion that capital accumulation increases the return to “brains”relative to “brawn” (Galor and Weil, 1996).
4

not discuss the physiological influence of body size on labor productivity, and do not consider
heterogeneity with respect to body size in their formal analysis.
The paper is structured as follows. The next section develops the baseline model. Section 3
then augments the model, by allowing physiology to directly influence labor productivity, and
by allowing for heterogeneity in body size. Section 4 investigates how results change if wages
are sub-optimally low due to imperfectly observable effort. A final section concludes.
2. The Basic Model
2.1. A Biological Foundation for the Effort Function
The first step in deriving the effort function is to formalize minimum consumption require-
ments; food requirements while at rest. In this endeavor we invoke Kleiber’s law which states
that the basal metabolic rate of an organism E0, measured by calories per day, scales with the
mass of an organism m as E0 = a ·mb with b = 3/4 (Kleiber, 1932). Intuitively the law says
that bigger organisms are more efficient; they need to consume less energy per unit of mass
(i.e. per cell if the single cell is an mass invariant unit) in order to sustain their life. The 3/4
exponent has been verified by Brody (1945) for almost all terrestrial animals yielding the famous
mouse-to-elephant curve. Although the law has long been known, it is only recently that teams
of biologists and physicists have developed a theory which shows that the 3/4 exponent follows
from nature’s optimization of fluid flows through energy distributing networks like, for example,
blood vessels. Accordingly, the formula E0 = a ·mb can be given rather deep micro-foundations
(West et al. 1997; Banavar et al. 1999).6 Since basal metabolism is defined as energy needs of a
body at rest, it is a useful concept to describe the nutritional needs of a worker who is exerting
no effort at all like, for example, somebody who is lying in the shade all day.
Exerting “effort”, however, requires additional energy intake in order to support the muscular
contractions involved in body postures and movements. Empirically it has been documented that
both the proportionality constant a and the scaling exponent b rise for exercising animals and
humans. Studies by Leonard and Robertson (1997), Darveau et al. (2002), White and Seymour
(2005), Weibel et al. (2004) and Weibel and Hoppeler (2005) find values for the exponent between
0.82 and 0.92, depending on the organism and the task under investigation. Recently, da Silva
6By now the theory has been applied to a multitude of biological problems from “genomes to ecosystems” (Westand Brown, 2005). In Dalgaard and Strulik (2010) we provide a brief introduction to the energy network theoryand a first economic application on the development of human body size and population size over the long-run.
5

et al. (2007) have generalized the theory of energy distributing networks to the case of moving
organisms, suggesting a scaling exponent of 6/7 for maximum metabolism.
The energy needs of an active body admit a biologically founded conceptualization of effort.
Let effort e represent a measure of the extent of physical activity per day, and normalize such
that e falls in a (0, 1) interval. Accordingly, e = 0 means no physical activity during the day,
whereas e = 1 denotes the maximum level of physical activity per day. In contrast to Bliss
and Stern (1976a,b) this notion of “activity” is not to be viewed as a measure of the number of
“tasks” being performed. Instead we show that there is a close correspondence between e and
what nutritionists and physiologists refer to as “the physical activity level” (PAL).7 Indeed, as e
rises, in our notation, PAL will rise as well. As explained below, PAL cannot increase arbitrarily,
but is constrained by physiology. This fact will eventually allow us to calibrate key biological
parameters of the model.
The association between effort and energy requirements is now obtained by observing that
energy intake of an active body can be written as the product of basal metabolism and extra
energy needs for activity, i.e. E ∝ mb ·mc with b = 3/4, and c = (6/7)− (3/4) = 3/28 according
to da Silva et al.’s theory. Thus, for computing energy expenditure of a body exerting effort e
per day and being inactive the remainder of the day the weighted geometric mean constitutes
the appropriate measure. As a result, energy requirements are obtained as E(e) = (amb)1−e ·
(aemb+c)e where ae denotes the proportionality constant when e = 1; at maximum daily activity
level the organism reaches maximum metabolism, aemb+c, whereas complete inactivity implies
basal metabolism in keeping with Kleiber’s law, a · mb. A virtue of this formulation is that
experimental data on humans reveal that total energy expenditure rises with physical activity e
in a manner consistent with the mb+e·c formula (see Westerterp, 2001 and the discussion below).
The assumption that energy needs rise with the degree of physical activity is thus supported
by theory and evidence deriving from biology and by work done by nutritionists. This is the
centerpiece of the biologically founded effort function.
To complete the description of energy needs associated with effort we need some additional
notation. Let η be the ratio of the constants of proportionality with and without effort, η ≡
ae/a ≥ 1. Total energy needed to sustain the metabolism of a worker of mass (weight) m
and effort level e can then by simplified to aηemb+e·c. Let ε denote an “energy exchange rate”
7PAL is defined as total energy expenditure (per unit of time) divided by the Basal Metabolic Rate (per unit oftime). See FAO (2001, p. 16).
6

that converts consumption in units of goods (wage income) into consumption in units of energy
(calories).8 The wage which is sufficient to cover energy needs at effort level e is:
w(e) · ε = aηemb+e·c. (1)
Solving (1) for effort we get
e =log(w)− log(a) + log(ε)− b log(m)
log(η) + c log(m)≡ e(w). (2)
This is the effort function which we will employ below.
Here we consider a static model where we require workers to be compensated fully for their
work effort in accordance with equation (2). Full compensation of effort can also be concep-
tualized as the long-run steady-state solution of a dynamic model. In a dynamic framework,
body weight would be an accumulable state variable and employers could feed up emaciated
job candidates by paying wages above metabolic needs at full effort level. For this to occur
as a matter of transitional dynamics, enforceable long-term contracts are required; this case is
investigated by Bose (1997). Feeding up casual workers would clearly be suboptimal. Given
long-term contracts it is also conceivable that already hired workers receive wages below their
energy needs for a while and nevertheless continue to exert effort. This could arise during a
period of economic hardship, because the employer credibly commits to feed up the worker once
the economy recovers.9 But in a steady-state, which is what we investigate here, effort needs to
be fully compensated in a market economy in keeping with equation (2).
2.2. Analysis
Consider the labor demand and wage compensation problem of a firm facing a homogenous
labor supply and a neoclassical production function
Y = F (e(w) · L) (3)
with F ′ > 0 and F ′′ < 0. Here L is the number of employees and e is the effort of an employee.
Effort depends on the wage paid; e ∈ (0, 1) where 0 denotes no effort and 1 maximum effort.
8This will later serve as a useful tool in analyzing the impact of a change in diet, or agricultural progress, as acomparative static exercise.9Otherwise, without commitment, in a market solution it is impossible that the worker exerts effort given wagesbelow energy needs. He would just quit and stop working rather than losing his life. However, beyond the marketsolution one can imagine a forced labor scenario where the employer is paying wages below energy requirementsyet forces the worker to exert full effort. We do not consider this possibility in the present paper.
7

The first order conditions for maximizing output minus labor costs, Y −wL, with respect to w
and L leads to the familiar Solow (1979) condition
∂e
∂w· we
= 1. (4)
According to the nutrition-based theory of efficiency wages we assume that wage income is
used for consumption of food and that effort at work depends on the individual level of nutrition.
In contrast to the earlier work, however, we anchor the nutrition-effort mechanism in biological
fundamentals, as described above.
Taking the first derivative of equation (2) and employing the Solow condition (4) we obtain
the optimal wage w = exp(1)·(aε)·mb. Substituting the result back into (2) yields the associated
effort level e = 1/[log(η) + c · log(m)] as interior solution. If log(m) < [1 − log(η)]/c, a corner
solution applies where workers exercise full effort (e = 1) and metabolic needs according to (1)
imply wages of (ae/ε) ·mb+c. The complete solution of the efficiency wage problem thus reads
e∗ = min{
1,1
log(η) + c · log(m)
}(5)
w∗ = min{aηε·mb+c, exp(1) · a
ε·mb
}. (6)
In order to check whether the solution is interior we solve for the critical m for which the
corner solution is just binding, mcrit = exp[(1− log η)/c]. If, for example, η = 1.6 and c = 6/7,
the critical weight is 140 kg. Using a calibration of the model we will argue below that for
physiological reasons η is very likely to be below 1.6; mcrit = 140 kg is therefore likely to be a
lower bound. The corner solution is thus the empirically relevant one.
This result is of interest because it refutes the assumption of the standard efficiency wage model
(e.g. Mirrlees, 1976) that profit maximizing employers face a convex-concave effort function and
set wages that support an interior solution, i.e. less than maximum effort. At the same time
our result continues to abide by the main premise of the standard efficiency wage model: better
nutrition leads to higher effort.
Another important implication concerns equilibrium wages; the solution leaves no separate
role for nutrition, conditional on the body mass of the worker. Hence the findings of Deolalikar
(1988), which demonstrate that there is no association between wages and calorie intake once the
stature of the worker is controlled for in the regression, is consistent with the model. Moreover,
8

the estimates reported by Deolalikar (1988) are also quantitatively consistent with the present
model. Using fixed effects Deolalikar (1988, Table 1) estimates a wage elasticity with respect to
weight-for-height of 0.66, evaluated at the mean of his sample. Allowing the point estimate to
move 2 standard deviations to either side, implies a 95 % confidence interval for the elasticity
of (0.13, 1.2), which nests the prediction of the present model (0.82, 0.92).
Because the wage is pinned down by biological fundamentals, it determines employment (where
F ′(L∗) = w∗ since e = 1 in equilibrium) and consequently, as in the standard efficiency wage
model, unemployment arises if the labor force exceeds L∗.
2.3. Quantitative Issues
For the calibration of our model we begin with Kleiber’s original formula for basal metabolism,
i.e. a = 70, b = 0.75, in order to obtain energy needs for workers at rest (e = 0). Kleiber obtained
these parameters for a sample of mammalian species but later it has been confirmed that they
are not significantly different for a more narrow data set of 20 anthropoid species (Leonard and
Robertson, 1992).10 As argued above the scaling exponent increases under activity, i.e. when
workers exert effort. For a discussion of energy needs in activity we refer to a concept used
by nutritionists, the physical activity level (PAL). The PAL has a clear correspondence in our
model since it is defined as the ratio between energy needs in activity to energy needs at rest:
PAL(e) = (aηemb+ec)/(amb) = ηemec.
According to the nutritional literature (FAO, 2001, Westerterp, 2001) humans cannot per-
sistently sustain a PAL above 2.4 for extended periods of time. That is, a PAL of 2.4 can be
considered the maximum maximorum (the unconditional upper bound). Naturally, during peak
activity a much higher PAL can be reached temporarily. For example, activities like “loading
sacks on a truck” and “carrying wood” are associated with PAL values of 6.6 (FAO, 2001)
implying that a worker’s energy needs would be 6.6 times his basal metabolic rate if he were
occupied with these activities for 24 hours. At this level of physical labor, however, fatigue will
set in, forcing the individual to rest. The periods of rest will automatically work so as to lower
the average PAL for the day. For example, if the worker is constrained by a PAL of 2.4, this
implies that he can only manage to exert effort in activities such as “carrying wood” for about
2.4 · 24/6.6 = 8.7 hours per day (if we assume – in line with our model – that he exerts no
10Recently, it has been shown that for a sample of sedentary western humans, Kleiber’s law can only be confirmedwhen one controls for obesity and age (Heymsfield et al. (2007). These characteristics play, however, no substantialrole in our model focusing on workers in developing countries so that we continue with the original formula.
9

effort at all over the rest of the day). Less energy consuming activities are sustainable for longer
hours.
Given the premise that the maximum (daily) sustainable PAL provides the nutritionist’s
equivalent to maximum metabolic effort in our model, we can calibrate the biological parameter
η. In order to do so we proceed in a few simple steps.
To begin, we observe that an upper boundary for PAL at 2.4 implies, in theory, that 2.4 =
ηmcmax, where mmax reflects (an estimate of) maximum human body mass; since PAL inevitably
depends on body size, the upper boundary for metabolic effort should intuitively be associated
with maximum body size. In order to pin down mmax, we observe that the tallest man in
recorded history is Robert Wadlow (born 1918) who stood at 2.72 cm at the time of his death in
1940 (McFarlan and McWhirter, 1991, p. 5). To get an implied body mass we invoke the body
mass index (BMI).11 Assuming a BMI at the midpoint of the normal range (i.e. 21.75) leaves us
with a reasonable guess for maximum (non-obese) body mass: mmax = 2.722 · 21.75 = 160 kg.12
Finally, we take the parameter c from the biological literature; in theory c = 6/7− 3/4 = 3/28.
As a result we obtain η = 2.4/1603/28 = 1.39. This is the calibrated η, which plausibly is
consistent with the physiological upper boundary for PAL.
Before we present our calibrations for energy requirements in activity, we can invoke our
calibrated η to check the viability of the corner solution we derived above. With η at 1.39, we
find that the corner solution applies as long as m < mcrit = 523 kg; individuals lighter than
half a ton, will exert full effort. This shows that the corner solution indeed is the empirically
meaningful solution, under plausible biological parameter values.13
With a fixed calibrated value for η it inevitably follows that our model admits minor variation
in PAL across individuals of different body sizes. To illustrate, the right hand side panel of
Figure 2 show the association between the physical activity level per day (i.e., ”effort”) and
PAL for individuals at 65 kg (solid line), 90 kg (dashed), and 160 kg (dotted).
11The body mass index is defined as the ratio between the weight of an individual in kg relative to the individualsheight squared, in meters.12For obese persons there would be different PALs. As already mentioned we exclude this case by focusing onphysically active workers in developing countries. Mr. Wadlow may have suffered from “gigantism”. Whilebearing no resemblance to an overweight person he nevertheless weighted 199 kg at his death, implying a BMIof 26.9. It is possible that the standard rules of physiology do not apply to this case. Nevertheless, it seemsreasonable to view his ultimately height as a proxy for the maximum height a human can attain. That is, as aproxy for mmax.13Note that this conclusion does not preclude (incidentially) wages that are suboptimally low, see Section 4 for adiscussion of these cases.
10

The first thing to notice from the figure is that, consistent with available evidence, PAL rises
(almost) linearly with the degree of physical activity per day. Second, PAL falls in a 1 to 2.4
range. Both of these aspects are consistent with evidence (Westerterp, 2001; FAO, 2001). Third,
for effort given, the figure shows that PAL is slightly higher for heavier (larger) workers. The
differences are, however, modest. Nevertheless it is worth stressing that similar ”idiosyncratic”
PAL differences across individuals are observed in experimental data (Westerterp, 2001). Hence,
the model is consistent with available evidence in this respect as well.
In comparison to cross-individual variations in PAL the associated variation in energy needs is
much larger, as documented in the left hand side panel of Figure 2. Mechanically this is a result
of the fact that energy requirements vary with body mass in accordance with mb+ec, whereas
PAL varies only with mec. Quantitatively the model suggests that workers weighing 60 and 95
kg (the relevant size interval for practical purposes) require 1510 and 2045 calories per day to
sustain their resting body (basal metabolism, e = 0). At full effort, however, those requirements
rise to 3260 and 4613 calories per day, respectively. Reassuringly, these calibrated requirements
are well in accord with those suggested by FAO (2001) for similar body sizes and activity levels.
Mayer et al. (1956) show, for a sample of ca. 60 kg heavy West Bengali workers that as physical
activity rises from light work (clerks and mechanics) to very heavy worker (e.g., blacksmith,
carriers, and cutters) calorie intake per day rises by roughly the amount indicated by the solid
line in Figure 2. This is consistent with the assumption that workers are being compensated for
their exerted effort.
Based on these considerations we can now calculate the “gap” between equilibrium wages and
the wage required for basal metabolism, or “subsistence”. This ratio is given by w/(εa ·mb) =
ηmc. As a result, the model motivates an upper boundary on the gap between the efficiency
wage and subsistence which is ((2.4 − 1) · 100 = 140%). This is the energy discrepancy at
full working activity if the individual weights 160 kg; our assumed upper boundary for body
mass, associated with maximum PAL. At, for instance, a body weight of 65 kg the comparable
number is (2.2− 1) · 100 = 120% (see Figure 2). Hence, under plausible assumptions the model
can generate wage level, which are consistent with those reported in Swamy (1997) and Dasgupta
(1997). Since lowering the wage below the levels implied by the model would induce workers
to reduce their effort (e < 1), producers would not be inclined to accept offers by unemployed
workers who are willing to work for less than the going rate.
11
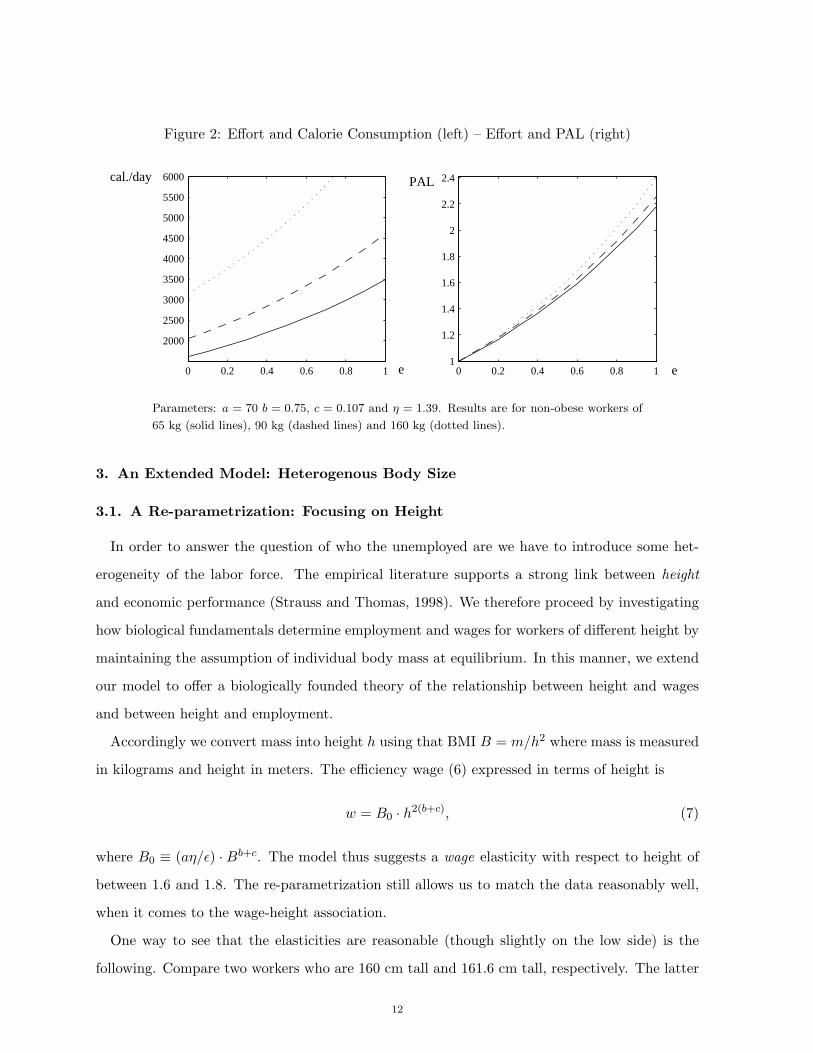
Figure 2: Effort and Calorie Consumption (left) – Effort and PAL (right)
0 0.2 0.4 0.6 0.8 1
2000
2500
3000
3500
4000
4500
5000
5500
6000
0 0.2 0.4 0.6 0.8 11
1.2
1.4
1.6
1.8
2
2.2
2.4
e
cal./day
e
PAL
Parameters: a = 70 b = 0.75, c = 0.107 and η = 1.39. Results are for non-obese workers of
65 kg (solid lines), 90 kg (dashed lines) and 160 kg (dotted lines).
3. An Extended Model: Heterogenous Body Size
3.1. A Re-parametrization: Focusing on Height
In order to answer the question of who the unemployed are we have to introduce some het-
erogeneity of the labor force. The empirical literature supports a strong link between height
and economic performance (Strauss and Thomas, 1998). We therefore proceed by investigating
how biological fundamentals determine employment and wages for workers of different height by
maintaining the assumption of individual body mass at equilibrium. In this manner, we extend
our model to offer a biologically founded theory of the relationship between height and wages
and between height and employment.
Accordingly we convert mass into height h using that BMI B = m/h2 where mass is measured
in kilograms and height in meters. The efficiency wage (6) expressed in terms of height is
w = B0 · h2(b+c), (7)
where B0 ≡ (aη/ε) · Bb+c. The model thus suggests a wage elasticity with respect to height of
between 1.6 and 1.8. The re-parametrization still allows us to match the data reasonably well,
when it comes to the wage-height association.
One way to see that the elasticities are reasonable (though slightly on the low side) is the
following. Compare two workers who are 160 cm tall and 161.6 cm tall, respectively. The latter
12

is 1 percent taller than the former (1.6 cm), implying about 1.7 percent higher wages. According
to the estimates of Schultz (2002) a height difference of 1.6 cm would imply a wage difference
of between 2.24 and 2.72 percent.
Another way of gauging the relevance of the implied height-wage association is by comparison
to the work of Strauss and Thomas (1998). The left hand side panel of Figure 3 shows the
wage for height relationship for the benchmark calibration taken from Figure 2. For comparison
with Strauss and Thomas (1998, Figure 2, which refers to Brazilian workers) we set the energy
exchange rate ε to 1600. This implies for the calibration of c = 3/28 and η = 1.39 that a worker
who is 170 cm tall, at a BMI of 22, gets a wage in log units of 0.75. This number matches Strauss
and Thomas’ regression based estimate, at this height level. The full height-wage association is
shown by the solid line. Dashed lines show wages when c is allowed to increase to the maximum
estimated value, i.e. c = 0.17. If a different value for c is employed, we need to recalibrate η.
Following the same steps as above we obtain η = 1.01. Visually comparing the figure with the
data reported in Strauss and Thomas (1998) reveals that the slope of both curves underestimates
the correlation between height and wage somewhat.14
The panel to the right demonstrates that the model also captures roughly the empirical as-
sociation of BMI and wages as obtained by Strauss and Thomas (1998, Figure 3) for Brazilian
workers. For that purpose we have held height constant at 1.60 m and evaluated (6) for alterna-
tive BMI. The body mass index, however, is mainly a measure of weight in disequilibrium, i.e.
deviation from ideal weight, a problem that we will not address further. We henceforth assume
that all workers display the same BMI (and B0 is thus constant) but are of different height.
3.2. The Influence of Stature on Production
The stature of workers is important for work performance since it is related to another phys-
iological feature that we have not exploited so far: muscle force and human strength. Muscle
power is proportional to muscle cross-section area which is measured in meters2 (Samaras, 2007).
Since height is measured in meters, it follows that muscle force rises (scales) with height as h2.
This implies that if two workers of the same BMI, exerting the same (e.g. full) effort, the taller
one contributes more force to the production process.15 Controlling for this feature and allowing
14Actually, it would be worrisome if the present model could fully account for the causal effect of body size onlabor productivity. In practice, height likely confers other productivity benefits beyond that which relates to“brawn”. See, for example, Case and Paxson (2008).15See Astrand and Rodahl (1970); Bale et al.(1994); Crewther et al. (2009); Peters (1983), and Zoeller et al.(2007).
13

Figure 3: Height and Wages (left) – BMI and wages (right)
1.5 1.6 1.7 1.8 1.90.4
0.5
0.6
0.7
0.8
0.9
1
18 20 22 24 26 28 300.4
0.5
0.6
0.7
0.8
0.9
1
meter
log(w)
BMI
log(w)
Parameters: a = 70, b = 3/4, ε = 1600 (both lines), c = 0.107, η = 1.39 (solid lines) and
c = 0.17, η = 1.01 (dashed lines).
for heterogeneity, the production function (3) should be rewritten as Y = F (∑L
i=1 ei(w) · h2i ),
where ei and hi are effort and height of the i-th worker employed, respectively.
However, not all production processes rely on “brute force” to the same extent. The literature
in sport physiology differentiates between tasks that are mainly built on exertion of force (lifting
weight, pushing, pulling), tasks of moving (running, jumping) and tasks of supporting body
weight (sit-ups, push ups). Theoretical reasoning and empirical estimates suggest that individual
performance in these tasks scales with height as hφ where φ = 2 for exerting force, φ = 0 for
moving and φ = −1/3 for supporting body weight (Markovic and Jaric, 2004).16 These results
are rather intuitive if one recalls and compares the visual appearances of Olympic medal winners
in, say, the disciplines of rowing, running, and gymnastics.17
In wage work we expect tasks to be much more complex than those of the experiments in
sports physiology. Still, there are undoubtedly tasks that rely to a great extent on exerting
force. For example, force-intensive work like plowing and digging probably involves a height
exponent of close to 2. In contrast, working on an assembly line may be expected to be more or
16Se also Bale et al. (1994) and Crewther et al. (2009) for further support that φ = 2 in force intensive tasks.17Examining 800 adult Indian males, Singh and Singh (2007) find that blacksmiths and farmers on average aretaller than tailors and carpenters. This is consistent with occupational selection taking place in accordance withthe above considerations. Similarly, the French army (another force intensive occupation) introduced minimumheight requirements in the 17th century, which later spread to other European armies (Komlos et al. (2003). Ina similar vein, Kirby (1995) documents that coal miners were selected small so that they could fit the narrowcoal seams, and Alter et al. (2004) document considerable height differences across occupations in 19th centuryBelgium; for instance, farmers were considerably taller than factory workers. See Steckel (1995) for a survey.
14

less unrelated to height, while carrying the mail in apartment buildings (lacking elevators) may
put large individuals at a disadvantage. To capture this sort of heterogeneity across work tasks,
we use a general exponent φ ∈ (−0.33, 2), which one may think of as a weighted average of the
three “ideal” exponents, mentioned above.
To formalize these considerations, we assume a Cobb-Douglas production function, and mea-
sure labor as a continuous input factor:
Y = A
(∫ L
0e(i)h(i)φdi
)α. (8)
The parameter A controls for the general level of technology, and the parameter α, 0 < α < 1,
controls for the ordinary productivity of labor with respect to the number of employed (in
efficiency units).
3.3. Efficiency Wages and the Identity of Unemployed
The efficiency wage of the last worker employed is w(i) = B0h(i)2(b+c). The efficiency wage
level is calculated by employing the Solow condition on the relevant effort function. The key
thing to notice is that wages differ across workers with different sizes; bigger individuals are paid
more.
Comparing exponents for productivity and costs of height (i.e., wages) we see that tall workers
have an absolute advantage in being employed if φ > 2(b + c), i.e. φ > 1.7 if b + c = 6/7
as suggested by theory. Thus, if production is sufficiently force-intensive, taller workers are
preferred. In this case we have the dual observation of bigger individuals receiving a higher
wage, and being more likely to be employed. But if φ < 2(b + c) smaller workers have an
absolute advantage.
Accordingly, the model suggests that tall workers are preferred for heavy labor like un-
mechanized agriculture, construction work, and other relatively “brawn-intensive” tasks. In
contrast, small workers, including women and children, are preferred for assembly line produc-
tion and other relatively “fine-motor skill intensive” activities. We discuss each case in turn.
Assume φ > 2(b+c) and a work-force sorted in a descending order by height. Thus h(L) is the
height of the shortest “just” employed worker. Since the worker is paid his or her efficiency wage
and exercises maximum effort the first order condition for maximizing Y −∫ L0 B0h(i)2(b+c)di with
15

respect to employment size L is
αA
[∫ L
0h(i)φdi
]α−1
· h(L)φ −B0h(L)2(b+c) = 0. (9)
Utilizing the substitution h = hφ we get the following representation of the first order condition.∫ L
0h(i)di =
(αA
B0
) 11−α· h(L)
φ−2(b+c)(1−α)φ . (10)
Note that the re-scaling with respect to h leaves the height ordering unaffected. Since h(L) is
monotonically declining in L there exists a unique L∗ fulfilling (10). If the workforce exceeds L∗,
unemployment exists and the shortest people are identified as being unemployed. The solution
is visualized in the left hand side panel of Figure 4 where the falling curve represent the ordered
distribution of height h in the population and the integral below the curve up to L identifies
total employment. Hence, all workers taller than h are employed and individuals below this
threshold are unemployed. Note that this result is consistent with the observation of workers of
different height performing identical tasks. For φ > 2(b+c) our model thus provides a theoretical
foundation for the observation that shorter people do not only earn less but are also less likely
to be working (Strauss and Thomas, 1998).
The two other cases follow immediately. If φ < 2(b + c) larger individuals will be rationed;
in the particular case where φ = 2(b + c) employers will be indifferent as to the height of their
employees.
Observe that there is no incentive on the part of the employer to accept a low-wage offer from
an unemployed. Employed workers are paid according to their metabolic needs, implying that
any individual receiving less than that wage level would not exert full effort. In other words, if
φ > 2(b+ c) there is no incentive for the employer to substitute a tall employee who needs (say)
4000 or more calories per day to perform his force-intensive work at full effort, by a smaller
currently unemployed one that would need far less calories in order to sustain his metabolism
in activity. As a result, “undercutting” does not arise in equilibrium.
3.4. Comparative Statics
As explained above; the link between body size and productivity depends, in this model,
on the nature of the production process. That is, it depends on the nature of the tasks the
individual workers perform. Technological progress, by changing the nature of the production
16

process may therefore importantly affect the selection process, and the link between body size
and employment.
The simplest comparative static exercise concerns a change in “A”, which is neutral in the
sense that it does not change the nature of the selection process. An increase in A raises the
marginal product of labor input (see the right hand side of equation (10)). As a result, if
φ > 2(b + c) , equilibrium height falls in order to re-establish equality. That is, employment
rises, and so does the height of the shortest worker employed. In principle, our model inherits
the shortcoming from the standard efficiency wage model that perpetual technological change
eliminates unemployment.18 The same mechanism applies for an improvement of the diet cap-
tured by an increase of the energy exchange rate ε. This lowers the wage costs per unit of
body cell, B0 decreases, and the multiplier on the right hand side of (10) increases implying an
adjustment of h(L) towards higher employment.
Figure 4: Height and Unemployment
N
h
hmin
h(L)
hmax
•
L L
A↑ ε↑
N
h
N
h
hmin
h(L)
hmax
•
L L
A↑ ε↑
N
h
Left hand side: physiological advantage of tall people and unemployment (of size
L−L) among short people for φ > 2(b+c). Right hand side: physiological advantage
of short people, unemployment among tall people for φ < 2(b+ c).
In contrast to the standard efficiency wage model we can also investigate “task-specific” tech-
nological progress. That is, technological change which influences the pay-off to body size (one
could also label such innovations as “height-biased’).
Industrialization, for example, replaces jobs in heavy agriculture (involving high φ’s) with
assembly line jobs (with low φ’s around zero). At the moment where φ crosses 2(b + c) from
18This shortcoming could, of course, be “repaired” as for the standard model by introducing psychological motives,e.g. the assumption that workers exert little effort when unemployment is low (Summers, 1988).
17

above, firms prefer to employ smaller people because the contribution of an additional cm
height on productivity falls below their marginal (efficiency) wage costs. Accordingly, previously
unemployed small persons, like women and possibly children, increasingly enter employment as
industrialization proceeds.
This case is displayed in the right hand side panel of Figure 4. For that purpose we have
ordered the population by height in ascending order and restated the equilibrium condition (10)
as ∫ L
0h(i)di =
(αAB0
) 11−α
h(L)2(b+c)−φ(1−α)φ
. (11)
The extended model predicts that taller persons are more likely to be unemployed. However,
this tendency vanishes as technology (or the quality of diet) improves. In these cases the multi-
plier on the right hand side of (11) increases and h(L) has to get larger in order to re-establish
equality. The model thus predicts that the association between height and unemployment should
be less visible in technological advanced countries.19
4. Inefficient Wages: Force Intensity at Work and Observable Effort
In the analysis above we assumed that employers set wages in accordance with the Solow
condition, which under plausible (biological) assumptions will induce the employees to exert full
effort. Implicitly, of course, this solution requires employers to be able to observe the effort of
the worker, which seems like a natural benchmark.
In some instances, however, it may be difficult to observe the workers effort fully. As argued by
Foster and Rosenzweig (1994) the ensuing moral hazard problem may lead to wage differences
across occupations where effort can be monitored to varying extent. For instance, whereas
effort may be compensated fully in piece-rate work the same is not necessarily true for wage
work rewarded on a time basis. As a consequence wages may be lower in the latter type of
occupation than the former, reflecting the difference in the extent to which effort is observable
to the employer.
To capture situations where effort is not fully observable in a simple way, suppose wages are
set such that they are consistent with an effort level λ, 0 < λ < 1, that the employer expects
19There is evidence to suggest that height is also associated with improved cognitive abilities (Case and Paxson,2008). If so, industrialization may not work to lower φ insofar as the return to cognitive abilities rises duringeconomic development. The basic mechanism explored above is, however, left unaffected.
18

from the employee. The required wage that would be consistent with effort level λ is
w(λ) =a
εηλmb+λc. (12)
Naturally, this wage level is lower than w∗, the full effort wage. A relevant question is whether
w(λ) can be sustained. That is, does the fact that a currently employed worker exerts less than
maximum effort allows undercutting to take place? The answer is found in the negative.
To see why, denote marginal profits for alternative effort levels, when employment is optimally
adjusted, by P ′(e, L∗). Next consider Figure 5, which depicts the P ′(e, L∗) curve for varying
levels of e. Evidently, undercutting will not take place as the wage, at w(λ) is sub-optimally low.
Indeed, workers receiving less than w(λ) will exert even less effort than λ. As a consequence,
the level of profits would deteriorate even further. Accordingly, the no undercutting result is
robust against sub-optimally low wages associated with less than full effort.
Figure 5: Marginal Profits for Alternative Wage Rates
w(λ)
P ′(e, L∗)
w
P ′(λ, L∗)
w∗
P ′(1, L∗)
In essence, therefore, the results from Section 2 and 3 continue to hold: there is no basis for
undercutting, and, controlling for stature one should not expect an association between wages
and calorie intake. However, there is one important addendum. The absence of a link between
wages and nutrition also requires one to take occupation into account. In particular, our theory
predicts that workers in occupations where effort is more easily observable (e.g., piece-rate work)
19

should obtain higher wages and consume more calories than workers in occupations where the
monitoring problem is more severe. These predictions are borne out in the data (Foster and
Rosenzweig, 1994). Moreover, the selection of workers into unemployment will also importantly
be affected by the monitoring issue, as we show next.
Since equation (12) maintains the structure of the basic model we may proceed to study
unemployment selection as we did in Section 3. First, observe that equation (12) can be restated
in terms of height
w = B0h2(b+λc) (13)
with B0 = a/εηλBb+λc. Next, performing the same manipulations as in Section 3 we arrive at
the conclusion that larger workers will be preferred in the labor market iff
φ > 2(b+ λc). (14)
The interesting new insight is that the condition is more likely to be met if the task at hand
is force intensive and if effort is hard to observe. In other words, tall workers are particularly
preferred in force-intensive work where effort is less easily observable; tree cutting or construction
work, for instance.
This result has a straightforward intuition. Formally, λ < 1 reduces the scaling exponent on
body mass for an exercising organism and therefore makes larger workers, relatively speaking,
even more efficient vis-a-vis smaller ones; with a smaller exponent the ratio of energy require-
ments to body size (mb+λc−1) is declining “faster” in stature. Hence, pound-for-pound larger
individuals are cheaper labor when effort is hard to observe, compared to the case where it can
be observed easily.
This result suggests that micro econometric work on the determination of wages always should
include information on occupation when examining the impact of body size on labor productivity.
Since larger individuals are especially likely to be selected into activities where effort is hard to
observe, a failure to take this selection effect into account may bias the coefficient on body size
towards zero, as occupations where effort is hard to observe tend to carry lower wages.
5. Conclusion
The present paper has revisited the classical nutrition-based efficiency wage model. By pro-
viding physiological foundations for the nutritional requirements of effort, we demonstrate that
20

the equilibrium wage should be considerably above subsistence, understood as energy require-
ments needed for basal metabolism. In addition, according to the model nutrition should not
affect wages, conditional on body mass, in keeping with the evidence. An extension shows how
the efficiency wage model can generate involuntary unemployment as well as provide (a) an
explanation for the regularity that taller individuals tend to face a lower probability of being
unemployed in less developed economies, and, (b) provide an explanation for why taller work-
ers simultaneously earn higher wages. Moreover, “task-specific innovations” may be one reason
why a “size bias” in unemployment may disappear during development. These results hold in
spite of the fact that the biological founded effort function does not exhibit the convex-concave
form postulated in previous contribution to the literature on the nutrition-based efficiency wage
model.
A shortcoming of the analysis above is its partial equilibrium and static nature. Hence, an
interesting topic for future work would be to provide a dynamic analysis, drawing on the basic
framework above, in a general equilibrium setting.
Our conceptualization of effort, as a measure of physical activity may allow for more precise
tests of the nutrition based efficiency wage hypothesis. For example, one might be able to
study the link between nutrition and physical activity levels of workers, and, in turn, physical
activity levels on wages (in sectors where physical activity is key, of course). In this manner
empirical research may move beyond ”reduced form” regressions, when testing the nutrition-
based efficiency wage model.
Acknowledgements
We would like to thank three anonymous referees, Stefan Klonner, Peter Svedberg and partic-
ipants at the annual meeting of the Council for Developing Countries of the German Economic
Association and the Nordic Conference in Development Economics 2008, as well as participants
at several seminars for useful comments.
21

References
Alter, G., M. Neven and M. Oris, 2004. Stature in Transition: A Micro Level study fromNineteenth-Century Belgium. Social Science History 28, 231-47.
Astrand, P.M. and Rodahl, K., 1970, Body dimensions and muscular work, in: Textbook of WorkPhysiology, McGraw-Hill, New York, pp. 321-339.
Banavar, J.R., A. Maritan and A. Rinaldo, 1999. Size and form in efficient transportationnetworks. Nature, 399, p. 130-32,
Bale, P., Colley, E., Mayhew, J.-L., Piper, F.C., and Ware, J.S., 1994, Anthropometric and soma-totype variables related to strength in American football players, Journal of Sports Medicineand Physical Fitness 34, 383-389.
Bliss, C. and N.H. Stern, 1978a, Productivity, wages, and nutrition: Part I: theory.Journal ofDevelopment Economics, 5, 331-62.
Bliss, C. and N.H. Stern, 1978b, Productivity, wages, and nutrition: Part II: some observations.Journal of Development Economics, 5, 363-98.
Bose, G., 1997, Nutritional efficiency wages: a policy framework, Journal of Development Eco-nomics 54, 469-478.
Brody, S., 1945, Bioenergetics and Growth, Van Nostrand-Reinhold, New York.
Case, A. and C. Paxson, 2008, Stature and status: height, ability, and labor market outcomes,Journal of Political Economy 116, 499-532.
Crewther, B.T. and Gill, N. and Weatherby, R.P. and Lowe, T., 2009, A comparison of ratio andallometric scaling methods for normalizing power and strength in elite rugby union players,Journal of Sports Sciences 27, 1575-1580.
da Silva, J.K.L., L.A. Barbosa, and P.R. Silva, 2007, Unified theory of interspecific allometricscaling, Journal of Physics A 40 (forthcoming).
Dalgaard, C.J. and Strulik, H., 2010, The Physiological Foundation of the Wealth of Nations.Discussion Paper 10-05 (University of Copenhagen)
Darveau, C.A., R.K. Suarez, R.D. Andrews, and P.W. Hochachka, 2002, Allometric cascade asa unifying principle of body mass effects on metabolism, Nature 417, 166-170.
Dasgupta, P., Ray, D., 1986. Inequality as a determinant of malnutrition and unemployment:theory. Economic Journal, 96, 1011-1034.
Dasgupta, P., 1997, Nutritional status, the capacity for work, and poverty traps, Journal ofEconometrics 77, 5-37.
Deolalikar, A., 1988, Nutrition and labor productivity in agriculture: estimates for rural southIndia, Review of Economics and Statistics 70, 406-13.
FAO, 2001, Human Energy Requirements, Food and Nutrition Technical Support Series 1, Rome.
Fogel, R.W., 1994, Economic growth, population theory, and physiology: the Bearing of long-term processes on the making of economic policy, American Economic Review 84, 369-395.
Foster, A.D. and M.R. Rosenzweig, A test for moral hazard in the labor market: contractualarrangements, effort, and health, Review of Economics and Statistics 76, 213-227.
Galor, O. and D.N. Weil, 1996, The gender gap, fertility, and growth, American EconomicReview 86, 374-387.
22

Heymsfield, S. et al., 2007, Body size and human energy requirements: reduced mass-specificresting energy expenditure in tall adults, Journal of Applied Physiology 103, 1543-1550.
Kirby, P., 1995. Causes of Short Stature among Coal-Mining Children, 1823-1850. EconomicHistory Review 48, 687-99-
Kleiber, M., 1932, Body size and metabolism, Hilgardia 6, 315-353.
Komlos, J. and Hau, M. and Bourguinat, N., 2003, An anthropometric history of early-modernFrance, 1666-1766, European Review of Economic History 7, 159-89.
Leibenstein, H., 1957, Economic Backwardness and Economic Growth: Studies in the Theory ofEconomic Development, Wiley, New York.
Leonard, W.R. and Robertson, M.L., 1992, Nutritional requirements and human evolution: abioenergetics model, American Journal of Human Biology 4, 179-195.
Markovic, G., and S. Jaric, 2004, Movement performance and body size: the relationship fordifferent group of tests, European Journal of Applied Physiology 92, 139-149.
Mayer, J. P. Roy, and K.P. Mitra, 1956, Relation between caloric intake, body weight, andphysical work, American Journal of Clinical Nutrition 4, 169-175.
McFarlan, D. and McWhirter, N., 1991, The Guinness Book of World Records, Bantam, NewYork.
Mirrlees, J.A., 1976, A pure theory of underdeveloped economies, in: Reynolds, L.G., ed.,Agriculture in Development Theory, Yale University Press, New Haven, CT.
Peters, R.H., 1983, The Ecological Implications of Body Size, Cambridge University Press, Cam-bridge.
Samaras, T.T., 2007, Human Body Size and the Laws of Scaling: Physiological, Performance,Growth, Longevity and Ecological Ramifications, Nova Science Publishers, New York.
Schultz, T.P., 2002. Wage Gains Associated with Height as a Form of Health Human Capital.American Economic Review Papers and Proceedings, 92, 349-53.
Singh, A.P. and S.P. Singh, 2007, Impact of habitual physical activity on the human bodyproportions: a comparative study of some traditional occupational groups, Journal of HumanEcology 22, 271-275.
Solow, R., 1979, Another possible source of wage stickiness, Journal of Macroeconomics 1, 79-82.
Stiglitz, J., 1976. The Efficiency Wage Hypothesis, Surplus Labor and the Distribution of Incomein LDCs, Oxford Economic Papers, 28, 185-207.
Strauss, J. and D. Thomas, 1998, Health, nutrition, and economic development, Journal ofEconomic Literature 36, 766-817.
Strauss, J., 1986, Does better nutrition raise farm productivity? Journal of Political Economy,297-320.
Summers, L.H., 1988, Relative wages, efficiency wages, and relative unemployment, AmericanEconomic Review 78, 383-388.
Swamy, A., 1997, A simple test of the nutrition-based efficiency wage model, Journal of Devel-opment Economics 53, 85-98.
Svedberg, P., 2000, Poverty and Undernutrition, Oxford University Press, Oxford.
Steckel, R., 1995. Stature and the Standard of Living. Journal of Economic Literature 33,1903-40.
23

Weibel, E.R., Bacigalupe, L.D., Schmitt, B., Hoppeler, H., 2004, Allometric scaling of maxi-mal metabolic rate in mammals: muscle aerobic capacity as determinant factor, RespiratoryPhysiology and Neurobiology 140, 115-132.
Weil, D., 2007. Accounting for the Effect of Health on Economic Growth. Quarterly Journal ofEconomics, ,1265-1306
West G.B., J. H. Brown and B.J. Enquist, 1997, A general model of the origin of allometricscaling laws in biology, Nature, 413, 628-31.
West, G.B and J. H. Brown, 2005, The origin of allometric scaling laws in biology from genomesto ecosystems: towards a quantitative unifying theory of biological structure and organization,Journal of Experimental Biology, 208, 1575-92.
Westerterp, K.R., 2001, Pattern and intensity of physical activity, Nature 410, 539.
Zoeller, R.F. and Ryan, E.D. and Gordish-Dressman, H., 2007, Allometric Scaling of BicepsStrength before and after Resistance Training in Men, Medicine & Science in Sports & Exer-cise 39, 1013-1019.
24