A phylotypic stage in vertebrate brain development: GABA cell
18
HAL Id: hal-00018343 https://hal.archives-ouvertes.fr/hal-00018343 Submitted on 14 Jun 2007 HAL is a multi-disciplinary open access archive for the deposit and dissemination of sci- entific research documents, whether they are pub- lished or not. The documents may come from teaching and research institutions in France or abroad, or from public or private research centers. L’archive ouverte pluridisciplinaire HAL, est destinée au dépôt et à la diffusion de documents scientifiques de niveau recherche, publiés ou non, émanant des établissements d’enseignement et de recherche français ou étrangers, des laboratoires publics ou privés. A phylotypic stage in vertebrate brain development: GABA cell patterns in zebrafish compared with mouse. Thomas Mueller, Philippe Vernier, Mario F. Wullimann To cite this version: Thomas Mueller, Philippe Vernier, Mario F. Wullimann. A phylotypic stage in vertebrate brain devel- opment: GABA cell patterns in zebrafish compared with mouse.. Journal of Comparative Neurology, Wiley, 2006, 494 (4), pp.620-634. <10.1002/cne.20824>. <hal-00018343>
Transcript of A phylotypic stage in vertebrate brain development: GABA cell
HAL Id: hal-00018343https://hal.archives-ouvertes.fr/hal-00018343
Submitted on 14 Jun 2007
HAL is a multi-disciplinary open accessarchive for the deposit and dissemination of sci-entific research documents, whether they are pub-lished or not. The documents may come fromteaching and research institutions in France orabroad, or from public or private research centers.
L’archive ouverte pluridisciplinaire HAL, estdestinée au dépôt et à la diffusion de documentsscientifiques de niveau recherche, publiés ou non,émanant des établissements d’enseignement et derecherche français ou étrangers, des laboratoirespublics ou privés.
A phylotypic stage in vertebrate brain development :GABA cell patterns in zebrafish compared with mouse.
Thomas Mueller, Philippe Vernier, Mario F. Wullimann
To cite this version:Thomas Mueller, Philippe Vernier, Mario F. Wullimann. A phylotypic stage in vertebrate brain devel-opment : GABA cell patterns in zebrafish compared with mouse.. Journal of Comparative Neurology,Wiley, 2006, 494 (4), pp.620-634. <10.1002/cne.20824>. <hal-00018343>
This article has been published in The Journal of Comparative Neurology, 2006, 494, pp. 620-634 doi : 10.1002/cne.20824 ; Wiley-Liss, Inc The publication is available online at http://www3.interscience.wiley.com/
A phylotypic stage in vertebrate brain development: GABA cell patterns in zebrafish compared to mouse Thomas Mueller, Philippe Vernier and Mario F. Wullimann* CNRS, Institute of Neurobiology A. Fessard, "Development, Evolution, Plasticity of the Nervous System" – Research Unit 2197, 91198 Gif-sur-Yvette, France * Address of corresponding author CNRS Institute of Neurobiology A. Fessard "Development, Evolution, Plasticity of the Nervous System" - Research Unit 2197 Avenue de la Terrasse Batiment 32-33 F-91198 Gif-sur-Yvette Cedex France Tel: 0033 (1) 69 82 41 42 Fax: 0033 (1) 69 82 34 47 Running head: GABA development in zebrafish Associate Editor: John Rubenstein Key words: cortex, eminentia thalami, Dlx, Mash, PCNA, pallium, proneural genes, subpallium, ventral thalamus, Zash, zona limitans intrathalamica email addresses: [email protected] [email protected] [email protected] (or [email protected]) Acknowledgements This work has been supported by grants from CNRS, Institut Universitaire France (IUF) and Sanofi-Aventis-Pharma. T.M. is supported by a fellowship from Sanofi-Aventis-Pharma.
Abstract A recent comparison of early forebrain gene expression in mouse and zebrafish revealed highly
comparable expression patterns of developmentally relevant genes, for example of proneural (Neurogenin1, NeuroD, Mash1/Zash1a) genes involved in neurogenesis at a particular time window (mouse: embryonic day 12.5/13.5; zebrafish: 3 days). Here, we extend this analysis to the description of GABA cell patterns in the early postembryonic zebrafish brain (i.e., during early secondary neurogenesis). We find again an astonishing degree of correspondences of GABA cell patterns between zebrafish and mouse during this previously established critical time window, for example regarding absence of GABA cells in certain forebrain regions (pallium, dorsal thalamus, eminentia thalami) or with respect to spatiotemporal occurrence of GABA cells (e.g., late cerebellar GABA cells). Furthermore, there is perfect correlation with previously established proneural gene expression patterns (i.e., absence of Mash1/Zash1a gene expression in GABA cell free forebrain regions) between mouse and zebrafish. The available information in additional vertebrate species, especially in Xenopus, is also highly consistent with our analysis here and suggests that a “phylotypic stage” of neurogenesis during vertebrate brain development may be present.
Introduction The anatomical regionalization of the vertebrate forebrain, that is, the demarcation of spatially defined areas in the anterior neural tube (discrete progenitor domains), reflects the action of external signals and intrinsic genetic pathways, promoting subsequent morphogenetic events. This represents a crucial step of neural development when neuroblasts acquire a specific identity that will determine further differentiation and the phenotype of the derived neural cells. A recent comparison of early forebrain gene expression in mouse and zebrafish revealed many detailed topological correspondences despite serious divergences in forebrain morphogenesis and resulting adult neuroanatomy (Wullimann and Mueller, 2004b). These divergences are primarily due to different modes of telencephalic development (evagination in
2
mammals/eversion in teleosts). However, highly comparable subpallial versus pallial (i.e., cortical) expression patterns of neurogenic (Notch, Delta) and proneural genes (Neurogenin, NeuroD, Mash or Zash), as well as of other genes involved in the regional specification and differentiation of the neural tube (Pax6, Dlx1/2, Emx1/2, Tbr1) are evident when one takes into account the topological transformations of the telencephalon in the zebrafish as compared to the mouse, especially of the pallial sheet. The determination of the neural phenotype depends on an ongoing succession of cell-fate restriction in which the expression of neurogenic and proneural genes in spatially defined regions of the neuroepithelium is a key-event (Bertand et al., 2002). The functional consequences of these gene expressions are considerably better understood in the mouse than in the zebrafish. In the murine brain, γ-aminobutyric acid (GABA) -ergic cells are born and determined in the embryonic ventral subpallium (i.e. the medial ganglionic eminence), the determination of which depends on a genetic pathway that includes the regionalized expression of Dlx1/2, Nkx2.1 and Lhx6 and of the proneural Mash1 gene. Then, a large fraction of these ventrally born GABA neurons migrate tangentially into the pallium, i.e., the future cortex (see Wullimann and Mueller, 2004b for a discussion of recent literature) where they become interneurons. Additional subpallial GABA-positive cells which invade predominantly the posterior cortex, including the hippocampus, arise from the (largely Nkx2.1 expression-free) caudal ganglionic eminence (Nery et al., 2002; Xu et al., 2004). Possibly, also the lateral ganglionic eminence may contribute some GABAergic cells to the pallium in a late phase of tangential migration of subpallial cells into pallium (Marìn and Rubenstein, 2001). In contrast, the determination and differentiation of glutamatergic cells of the pallium (cortex) depends on the concerted activity of Neurogenin1 and NeuroD in areas where Pax6, Emx1/2, Tbr1 and Lhx9 are expressed in a regionalized manner (see Wullimann and Mueller, 2004b for a discussion of recent literature). In the mammalian diencephalon, a similar situation regarding differential gene activity and neurochemical phenotype does exist. For example, GABA cells are seen early in the ventral thalamus (prethalamus) and pretectum, while GABA cells are initially absent in the embryonic dorsal thalamus and habenula, where such cells are observed only later (Katarova et al., 2000, Hayes et al. 2003; Jones and Rubenstein, 2004). Interestingly, the mouse ventral thalamus (and pretectum, for that matter) is at the same time characterized by Dlx1/2 (Bulfone et al., 1993a; b; Puelles et al., 1999; 2000) and Mash1 expression (Lo et al., 1991; Ma et al., 1997; Horton et al., 1999; Torii et al., 1999; Fode et al., 2000). Thus, in the ventral thalamus, as in the subpallium, the production of GABA cells may depend on the combinatorial activity of Dlx1/2 and Mash1, although this hypothesis has not been directly investigated. Taken together, these observations suggest that there are strictly defined temporal and spatial requirements for a given neuronal phenotype to be differentiated (e.g., for GABAergic neurons), and this may represent a strong developmental constraint on spatiotemporal gene expression patterns. If so, this must be reflected in the conservation of gene expression patterns in a large taxon, such as vertebrates. While there is good correspondence between the zebrafish and the mouse on the level of brain gene expression patterns, for example regarding transcripts of Dlx1/2 and Zash1a (or Mash1, respectively) in subpallium and ventral thalamus, the distribution of GABA cells is not documented at the relevant stages of zebrafish brain development. In the zebrafish, either only very early, embryonic stages have been looked at (Martin et al., 1998; Doldan et al., 1999) or only the larval hindbrain has been given attention (Higashijima et al., 2004). To establish the zebrafish as a neurogenetic model which allows direct comparisons with the mouse, it is necessary to define fundamental patterns of neurochemical phenotype formation. In the present paper, we document the dynamics of GABA cell patterns in various postembryonic zebrafish brain stages (i.e., during secondary neurogenesis) and relate these neurochemical patterns to the distribution of proliferative (PCNA) cells and to previously reported expression domains of Zash1a and other proneural gene expression. Additional histochemical stainings for Nissl-substance and/or cell nuclei are used here to further illuminate the relationship of GABA-positive cells versus postmitotic and proliferative GABA-negative cells. Extending our recent analysis (Wullimann and Mueller, 2004b), we find an astonishing degree of correspondences of GABA cell patterns between zebrafish and mouse during a previously established critical time window (zebrafish: 2 to 3 days postfertilization, mouse: embryonic day 12.5/13.5). We also noticed similar correspondence regarding neurogenic and proneural gene expression in yet another vertebrate model animal, the African clawed-frog Xenopus lævis at a defined developmental stage (i.e. stage 48; Wullimann et al., in press). We thus propose that there is sort of a “phylotypic stage“ of brain development in vertebrates, as has been suggested for general development (Slack et al. 1993). This may reflect a strong developmental constraint on neural differentiation, which depends on the strict spatiotemporal patterning of specific gene expressions.
3
Material and Methods GABA-Immunohistochemistry
Zebrafish were kept and bred according to Westerfield (1995) in the local zebrafish facility of the Centre Nationale de la Recherche Scientifique (CNRS) of Gif-sur-Yvette. For -aminobutyric acid (GABA) -immunohistochemistry, a total of 106 embryonic and postembryonic zebrafish have been used (34 hpf to 4 dpf, staged after Kimmel et al., 1995). The animals were anesthetized with tricaine methanesulfonate (MS 222, Sigma), fixed in 4% paraformaldehyde plus 0.5% glutaraldehyde in Sörensen phosphate buffer (PB, pH 7.4, 4°C, overnight). After rinsing two times in PB, specimens were dehydrated in a graded series of ethanol and transferred into paraffin. Paraffin sections are 6 to 12 µm in thickness. The section plane employed was chosen as to deliver horizontal sections in the forebrain and transverse sections in the mid- and hindbrain, which is possible because of the ventral bending of the forebrain relative to the anterioposterior axis. This plane is meanwhile used routinely in our studies as it has proven to be of great value in cross-species comparisons. Sections were deparaffined and then rinsed three times for 15 min in phosphate buffered saline (PBS, pH 7.4), preblocked in bovine serum albumine (BSA)-PBS (3% BSA) for 30 min, and then blocked with Normal Goat Serum (NGS, Vectastain, Vector Labs., Burlingame, CA) in BSA-PBS (3 drops NGS/10 ml BSA-PBS) for 30 min. Incubation with the primary antibody (polyclonal rabbit anti-GABA antibody from Sigma-Aldrich, Inc., product number A 2052; the antibody is raised against a GABA-BSA conjugate) diluted betweem 1/2000 and 1/5000 in BSA-PBS containing 0.5% Triton X-100 has been carried out overnight. The detection step with the secondary fluorescence-coupled antibody (Oregon Green, goat anti-rabbit IgG from Molecular Probes, Leiden, Netherlands, catalog number A-11055) for 1 hour followed after three rinses of 15 minutes in PBS. To better distinguish GABA-positive cells from GABA- negative proliferative and postmitotic cells, preparations were counterstained with 4',6-diamidino-2-phenylindole, dihydrochloride (DAPI, Molecular Probes, catalog number D21490) and part of these sections subsequently also with NeuroTrace® 530/615 red fluorescent Nissl stain (Molecular Probes, catalog number N21482). Each incubation step (5 min) included three additional 15 minutes PBS washing steps. Finally, slides were coverslipped with DAKO fluorescence mounting medium after 3 x 15 minutes washes in PBS. Negative controls have been performed by ommiting the primary antiserum.
All procedures in this work were executed on fixed specimens and did not involve animal experiments. Anesthetization and subsequent fixation of embryos and hatchlings followed official French regulations of animal treatment.
Specifity of the anti-GABA antibody
The primary polyclonal Sigma anti-GABA antibody used here has been previously shown to visualize specifically GABAergic cells at larval zebrafish hindbrain and spinal cord levels by Higashijima et al. (2004) and our results are identical at these levels. In addition, we looked at embryonic stages of zebrafish brain and spinal cord development (data not shown) to ensure that GABA cell patterns as detected with the Sigma-antibody are identical to already well established embryonic GABA cell patterns based on the usage of a different antibody (Chemicon, Martin et al., 1998). Moreover, our results concerning GABA cell patterns in the larval zebrafish brain resemble those documented for another teleost, the three-spined stickleback Gasterosteus aculeatus (Ekström and Ohlin, 1995), although our anatomical interpretation differs considerably (see discussion). Since embryonic and larval brain cells may contain high levels of GABA only transiently and do not necessarily represent precursors of later, permanent GABAergic phenotypes, we explicitely refer in this study to GABA-positive cells (or GABA cells).
PCNA-Immunohistochemistry
Photomicrographs of material stained for the proliferating cell nuclear antigen (PCNA) have been taken from data generated during previous studies. Briefly, for detection of the proliferating cell nuclear antigen (PCNA), Bouin’s-fixed (24 h fixation time) and paraffin-embedded material was used. The section plane is as explained above. The thickness of transverse sections amounted to 7-10µm. The standard biotin-avidin system (Vectastain ABC-kit, peroxidase mouse IgG, PK-4002, Vector Labs., Burlingame, CA) was used as detection system. To unmask PCNA in fixed material, slides were put in the microwave oven for 10-20 min in citric acid-citrate buffer (pH 6,0, after Romeis 1989) at 700 W before incubation with the primary antibody. Incubation with blocking serum for 30 minutes was followed by incubation with the primary monoclonal antibody against a linear epitope of PCNA (PC10, DAKO, Glostrup, Denmark; 1:500) diluted in phosphate buffered saline (pH 7.2) containing 3 % bovine serum albumine (BSA) overnight. Diaminobenzidine (DAB) was used as chromogen and the horseradish peroxidase reaction product was intensified according to Adams (1981).
The specificity of the monoclonal PCNA-antibody used here has been described by Waseem and Lane (1990). It is commercially available meanwhile and has been applied to detect consistently PCNA in various vertebrate species, including the zebrafish, Danio rerio (Wullimann and Puelles, 1999; Wullimann and Knipp, 2000). The detection of PCNA with the antibody from DAKO has been already described extensively in the zebrafish brain and the specificity of the antibody and its degree of reliability of PCNA as a marker for proliferation has been discussed there (Wullimann and Puelles, 1999, Mueller and Wullimann, 2003).
4
Terminology
Neuroanatomical designations for the zebrafish brain are taken from the atlas of early zebrafish brain development (Mueller and Wullimann, 2005), which is based on publications by Wullimann and Puelles (1999), Mueller and Wullimann (2002, 2003), Wullimann and Mueller (2004a,b). Designations for the mouse brain (only Fig. 5) have been adopted from Katarova et al. (2000).
Photomicrograph production
Fluorescence detection of GABA, DAPI and NeuroTrace® Nissl staining has been undertaken with a NIKON eclipse E800 fluorescence microscope by using the appropriate filter sets. Photomicrographs have been shot with the NIKON Digital Camera DXM 1200. Digital photoprocessing - including sharpening, color and brightness adjustments as well as merging - has been carried out with Photoshop Elements. Picture arrangements and designation labeling have been done with Corel Draw
Results
Various postembryonic zebrafish stages were studied between 2 to 5 days postfertilization (dpf), but we will focus on the documentation of γ-aminobutyric acid (GABA) cell distribution at the onset of secondary neurogenesis (i.e., at 2 dpf when relatively strong proliferation and weak differentiation is present; Figs. 1; 2A-C,J), and at 3 dpf (with reduced proliferation and stronger differentiation; Figs. 2D-I; 3:4A,C,E,G). The GABA-immunostained sections were also prepared for DAPI nuclear stain (2 dpf), as well as additionally with the fluorescent NeuroTrace® Nissl stain (3 dpf). These double and triple stains allow to distinguish GABA-negative proliferative cells from GABA-negative postmitotic cells because mitotic cells appear brighter blue than postmitotic cells. Furthermore, if fluorescent-stained additionally for the Nissl substance, the postmitotic GABA-negative cells stand out against the mitotic ones with a brighter red stain (see below). In selected cases at 3 dpf, we will additionally relate the distribution of GABA cells to proliferative cells shown with PCNA. GABA cell patterns at 2 days Telencephalon. At the level of the olfactory bulb (Fig. 1A), GABA-positive cells surround the glomeruli while the ventral proliferation zone remains free of label. The olfactory epithelium is GABA-negative at all levels. More caudally, the subpallium emerges (Fig. 1B-C), where again the medial proliferation zones are GABA-free, whereas there are many GABA-positive cells lateral to the mitotic subpallial cells. It appears that an early telencephalic migrated area (i.e., M4, not shown) is GABA-free. The pallium remains free of GABA-positive cells at least at rostral levels (Fig. 1B-C). At caudal levels, GABA cells might be present in postmitotic pallial cells already. Approaching precommissural subpallial levels, strongly stained fibers assemble bilaterally in the subpallium. At the level of the anterior commissure, these fibers continue into the commissure and cross brain sides. However, a central part of the commissure remains free of label (not shown). The subpallial GABA-positive cells continue to be present at supra- and postcommissural levels, but there is a distinct gap formed of GABA-immunonegative cells before the again GABA-positive cells of the preoptic region emerge (see below). Eminentia thalami and preoptic region. At the caudal telencephalic pole, eminentia thalami and preoptic region emerge. Many cells of the preoptic region are GABA-positive (Fig. 1D-F). Some of these cells lie directly caudally to the anterior commissure and are contiguous with the dorsally lying postcommissural GABA cells of the subpallium. Slightly more caudally, however, the subpallial GABA cells fade out, and GABA-negative cells occur before the main population of dorsal preoptic GABA cells comes in more ventrally at this level. The proliferative anterior part and all of the central, periventricular cells of the preoptic region are GABA-immunonegative. In contrast to the preoptic region, the entire eminentia thalami remains free of GABA-positive cells (Fig. 1D-E), including its most laterally migrated part (M3) dorsal (i.e., caudal) to the lateral forebrain bundle. The lateral forebrain bundle serves as a diagnostic landmark at this level, and many of its fibers are GABA-positive. Diencephalon. The diencephalon presents a particularly complex pattern of GABA-positivity. At anterior levels, both dorsal and ventral thalami are GABA-free, consistent with the presence of large proliferative zones there (see Mueller and Wullimann, 2003); the habenula is proliferative at its base, but shows some GABA-positive cells towards the pial periphery (Fig. 1C). Also the epiphysis contains some GABA-positive cells. More posteriorly in the thalamus, GABA-positive cells start to occur at the boundary of dorsal and ventral thalami, these lie either in the most dorsal (i.e., caudal) ventral thalamus towards or within the zona limitans intrathalamica. In contrast, the ventral remainder of the ventral thalamus is highly proliferative at this level and its cells are GABA-free (not shown). However, slightly more posteriorly, many GABA-positive cells suddenly appear in the entire ventral thalamus (prethalamus) with the exception of a conspicuous GABA-negative cell stripe towards the dorsal thalamus (Fig. 1D). This GABA-negative stripe is adjacent to an again GABA-positive stripe of cells extending from ventricle to pia which has been noted above already. GABA cells of the ventral thalamus and those of the above mentioned positive stripe are continuous at the pial periphery. The conspicuous GABA cell stripe is close to or lies within the zona limitans intrathalamica (see discussion). The dorsal thalamus remains free of GABA cells also at this level (Fig. 1D). Towards most posterior thalamic levels, GABA cells are seen in the periphery of the dorsal thalamus which seem to grade into those of the pretectum, which contains many strongly stained GABA-positive cells (Fig. 1E-F). Distinct
5
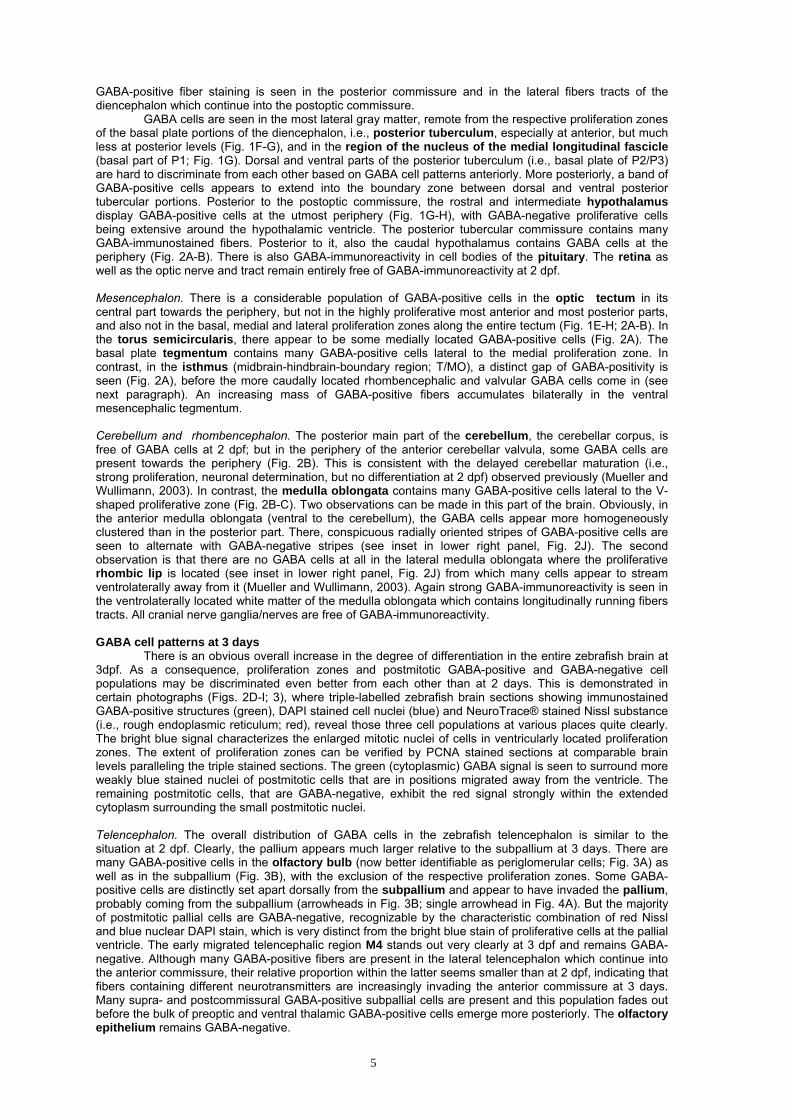
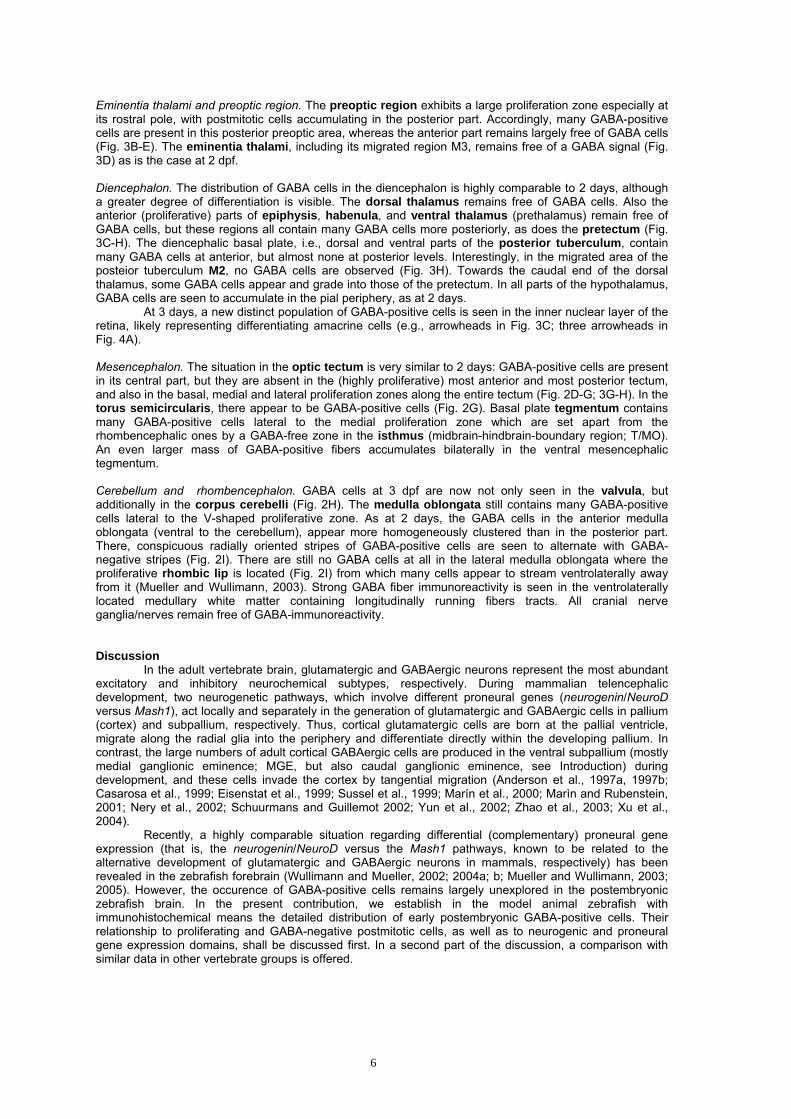
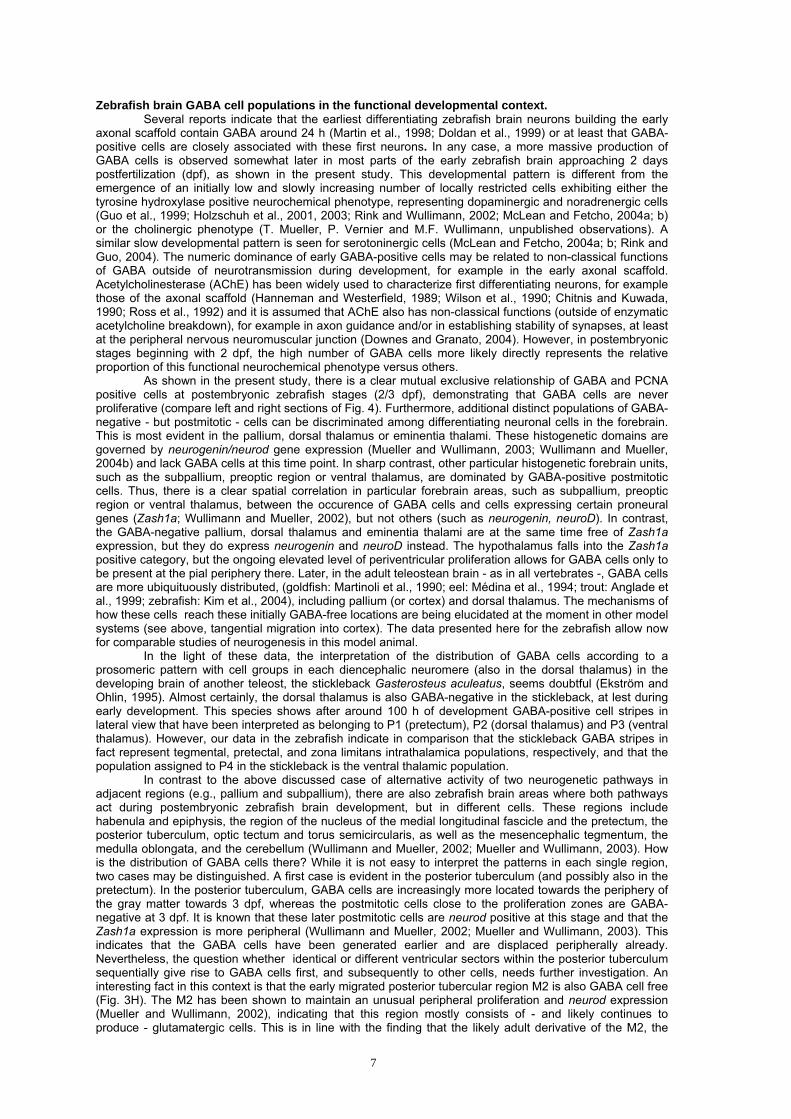
GABA-positive fiber staining is seen in the posterior commissure and in the lateral fibers tracts of the diencephalon which continue into the postoptic commissure. GABA cells are seen in the most lateral gray matter, remote from the respective proliferation zones of the basal plate portions of the diencephalon, i.e., posterior tuberculum, especially at anterior, but much less at posterior levels (Fig. 1F-G), and in the region of the nucleus of the medial longitudinal fascicle (basal part of P1; Fig. 1G). Dorsal and ventral parts of the posterior tuberculum (i.e., basal plate of P2/P3) are hard to discriminate from each other based on GABA cell patterns anteriorly. More posteriorly, a band of GABA-positive cells appears to extend into the boundary zone between dorsal and ventral posterior tubercular portions. Posterior to the postoptic commissure, the rostral and intermediate hypothalamus display GABA-positive cells at the utmost periphery (Fig. 1G-H), with GABA-negative proliferative cells being extensive around the hypothalamic ventricle. The posterior tubercular commissure contains many GABA-immunostained fibers. Posterior to it, also the caudal hypothalamus contains GABA cells at the periphery (Fig. 2A-B). There is also GABA-immunoreactivity in cell bodies of the pituitary. The retina as well as the optic nerve and tract remain entirely free of GABA-immunoreactivity at 2 dpf. Mesencephalon. There is a considerable population of GABA-positive cells in the optic tectum in its central part towards the periphery, but not in the highly proliferative most anterior and most posterior parts, and also not in the basal, medial and lateral proliferation zones along the entire tectum (Fig. 1E-H; 2A-B). In the torus semicircularis, there appear to be some medially located GABA-positive cells (Fig. 2A). The basal plate tegmentum contains many GABA-positive cells lateral to the medial proliferation zone. In contrast, in the isthmus (midbrain-hindbrain-boundary region; T/MO), a distinct gap of GABA-positivity is seen (Fig. 2A), before the more caudally located rhombencephalic and valvular GABA cells come in (see next paragraph). An increasing mass of GABA-positive fibers accumulates bilaterally in the ventral mesencephalic tegmentum. Cerebellum and rhombencephalon. The posterior main part of the cerebellum, the cerebellar corpus, is free of GABA cells at 2 dpf; but in the periphery of the anterior cerebellar valvula, some GABA cells are present towards the periphery (Fig. 2B). This is consistent with the delayed cerebellar maturation (i.e., strong proliferation, neuronal determination, but no differentiation at 2 dpf) observed previously (Mueller and Wullimann, 2003). In contrast, the medulla oblongata contains many GABA-positive cells lateral to the V-shaped proliferative zone (Fig. 2B-C). Two observations can be made in this part of the brain. Obviously, in the anterior medulla oblongata (ventral to the cerebellum), the GABA cells appear more homogeneously clustered than in the posterior part. There, conspicuous radially oriented stripes of GABA-positive cells are seen to alternate with GABA-negative stripes (see inset in lower right panel, Fig. 2J). The second observation is that there are no GABA cells at all in the lateral medulla oblongata where the proliferative rhombic lip is located (see inset in lower right panel, Fig. 2J) from which many cells appear to stream ventrolaterally away from it (Mueller and Wullimann, 2003). Again strong GABA-immunoreactivity is seen in the ventrolaterally located white matter of the medulla oblongata which contains longitudinally running fibers tracts. All cranial nerve ganglia/nerves are free of GABA-immunoreactivity. GABA cell patterns at 3 days There is an obvious overall increase in the degree of differentiation in the entire zebrafish brain at 3dpf. As a consequence, proliferation zones and postmitotic GABA-positive and GABA-negative cell populations may be discriminated even better from each other than at 2 days. This is demonstrated in certain photographs (Figs. 2D-I; 3), where triple-labelled zebrafish brain sections showing immunostained GABA-positive structures (green), DAPI stained cell nuclei (blue) and NeuroTrace® stained Nissl substance (i.e., rough endoplasmic reticulum; red), reveal those three cell populations at various places quite clearly. The bright blue signal characterizes the enlarged mitotic nuclei of cells in ventricularly located proliferation zones. The extent of proliferation zones can be verified by PCNA stained sections at comparable brain levels paralleling the triple stained sections. The green (cytoplasmic) GABA signal is seen to surround more weakly blue stained nuclei of postmitotic cells that are in positions migrated away from the ventricle. The remaining postmitotic cells, that are GABA-negative, exhibit the red signal strongly within the extended cytoplasm surrounding the small postmitotic nuclei. Telencephalon. The overall distribution of GABA cells in the zebrafish telencephalon is similar to the situation at 2 dpf. Clearly, the pallium appears much larger relative to the subpallium at 3 days. There are many GABA-positive cells in the olfactory bulb (now better identifiable as periglomerular cells; Fig. 3A) as well as in the subpallium (Fig. 3B), with the exclusion of the respective proliferation zones. Some GABA-positive cells are distinctly set apart dorsally from the subpallium and appear to have invaded the pallium, probably coming from the subpallium (arrowheads in Fig. 3B; single arrowhead in Fig. 4A). But the majority of postmitotic pallial cells are GABA-negative, recognizable by the characteristic combination of red Nissl and blue nuclear DAPI stain, which is very distinct from the bright blue stain of proliferative cells at the pallial ventricle. The early migrated telencephalic region M4 stands out very clearly at 3 dpf and remains GABA-negative. Although many GABA-positive fibers are present in the lateral telencephalon which continue into the anterior commissure, their relative proportion within the latter seems smaller than at 2 dpf, indicating that fibers containing different neurotransmitters are increasingly invading the anterior commissure at 3 days. Many supra- and postcommissural GABA-positive subpallial cells are present and this population fades out before the bulk of preoptic and ventral thalamic GABA-positive cells emerge more posteriorly. The olfactory epithelium remains GABA-negative.
6
Eminentia thalami and preoptic region. The preoptic region exhibits a large proliferation zone especially at its rostral pole, with postmitotic cells accumulating in the posterior part. Accordingly, many GABA-positive cells are present in this posterior preoptic area, whereas the anterior part remains largely free of GABA cells (Fig. 3B-E). The eminentia thalami, including its migrated region M3, remains free of a GABA signal (Fig. 3D) as is the case at 2 dpf. Diencephalon. The distribution of GABA cells in the diencephalon is highly comparable to 2 days, although a greater degree of differentiation is visible. The dorsal thalamus remains free of GABA cells. Also the anterior (proliferative) parts of epiphysis, habenula, and ventral thalamus (prethalamus) remain free of GABA cells, but these regions all contain many GABA cells more posteriorly, as does the pretectum (Fig. 3C-H). The diencephalic basal plate, i.e., dorsal and ventral parts of the posterior tuberculum, contain many GABA cells at anterior, but almost none at posterior levels. Interestingly, in the migrated area of the posteior tuberculum M2, no GABA cells are observed (Fig. 3H). Towards the caudal end of the dorsal thalamus, some GABA cells appear and grade into those of the pretectum. In all parts of the hypothalamus, GABA cells are seen to accumulate in the pial periphery, as at 2 days. At 3 days, a new distinct population of GABA-positive cells is seen in the inner nuclear layer of the retina, likely representing differentiating amacrine cells (e.g., arrowheads in Fig. 3C; three arrowheads in Fig. 4A). Mesencephalon. The situation in the optic tectum is very similar to 2 days: GABA-positive cells are present in its central part, but they are absent in the (highly proliferative) most anterior and most posterior tectum, and also in the basal, medial and lateral proliferation zones along the entire tectum (Fig. 2D-G; 3G-H). In the torus semicircularis, there appear to be GABA-positive cells (Fig. 2G). Basal plate tegmentum contains many GABA-positive cells lateral to the medial proliferation zone which are set apart from the rhombencephalic ones by a GABA-free zone in the isthmus (midbrain-hindbrain-boundary region; T/MO). An even larger mass of GABA-positive fibers accumulates bilaterally in the ventral mesencephalic tegmentum. Cerebellum and rhombencephalon. GABA cells at 3 dpf are now not only seen in the valvula, but additionally in the corpus cerebelli (Fig. 2H). The medulla oblongata still contains many GABA-positive cells lateral to the V-shaped proliferative zone. As at 2 days, the GABA cells in the anterior medulla oblongata (ventral to the cerebellum), appear more homogeneously clustered than in the posterior part. There, conspicuous radially oriented stripes of GABA-positive cells are seen to alternate with GABA-negative stripes (Fig. 2I). There are still no GABA cells at all in the lateral medulla oblongata where the proliferative rhombic lip is located (Fig. 2I) from which many cells appear to stream ventrolaterally away from it (Mueller and Wullimann, 2003). Strong GABA fiber immunoreactivity is seen in the ventrolaterally located medullary white matter containing longitudinally running fibers tracts. All cranial nerve ganglia/nerves remain free of GABA-immunoreactivity. Discussion In the adult vertebrate brain, glutamatergic and GABAergic neurons represent the most abundant excitatory and inhibitory neurochemical subtypes, respectively. During mammalian telencephalic development, two neurogenetic pathways, which involve different proneural genes (neurogenin/NeuroD versus Mash1), act locally and separately in the generation of glutamatergic and GABAergic cells in pallium (cortex) and subpallium, respectively. Thus, cortical glutamatergic cells are born at the pallial ventricle, migrate along the radial glia into the periphery and differentiate directly within the developing pallium. In contrast, the large numbers of adult cortical GABAergic cells are produced in the ventral subpallium (mostly medial ganglionic eminence; MGE, but also caudal ganglionic eminence, see Introduction) during development, and these cells invade the cortex by tangential migration (Anderson et al., 1997a, 1997b; Casarosa et al., 1999; Eisenstat et al., 1999; Sussel et al., 1999; Marín et al., 2000; Marìn and Rubenstein, 2001; Nery et al., 2002; Schuurmans and Guillemot 2002; Yun et al., 2002; Zhao et al., 2003; Xu et al., 2004). Recently, a highly comparable situation regarding differential (complementary) proneural gene expression (that is, the neurogenin/NeuroD versus the Mash1 pathways, known to be related to the alternative development of glutamatergic and GABAergic neurons in mammals, respectively) has been revealed in the zebrafish forebrain (Wullimann and Mueller, 2002; 2004a; b; Mueller and Wullimann, 2003; 2005). However, the occurence of GABA-positive cells remains largely unexplored in the postembryonic zebrafish brain. In the present contribution, we establish in the model animal zebrafish with immunohistochemical means the detailed distribution of early postembryonic GABA-positive cells. Their relationship to proliferating and GABA-negative postmitotic cells, as well as to neurogenic and proneural gene expression domains, shall be discussed first. In a second part of the discussion, a comparison with similar data in other vertebrate groups is offered.
7
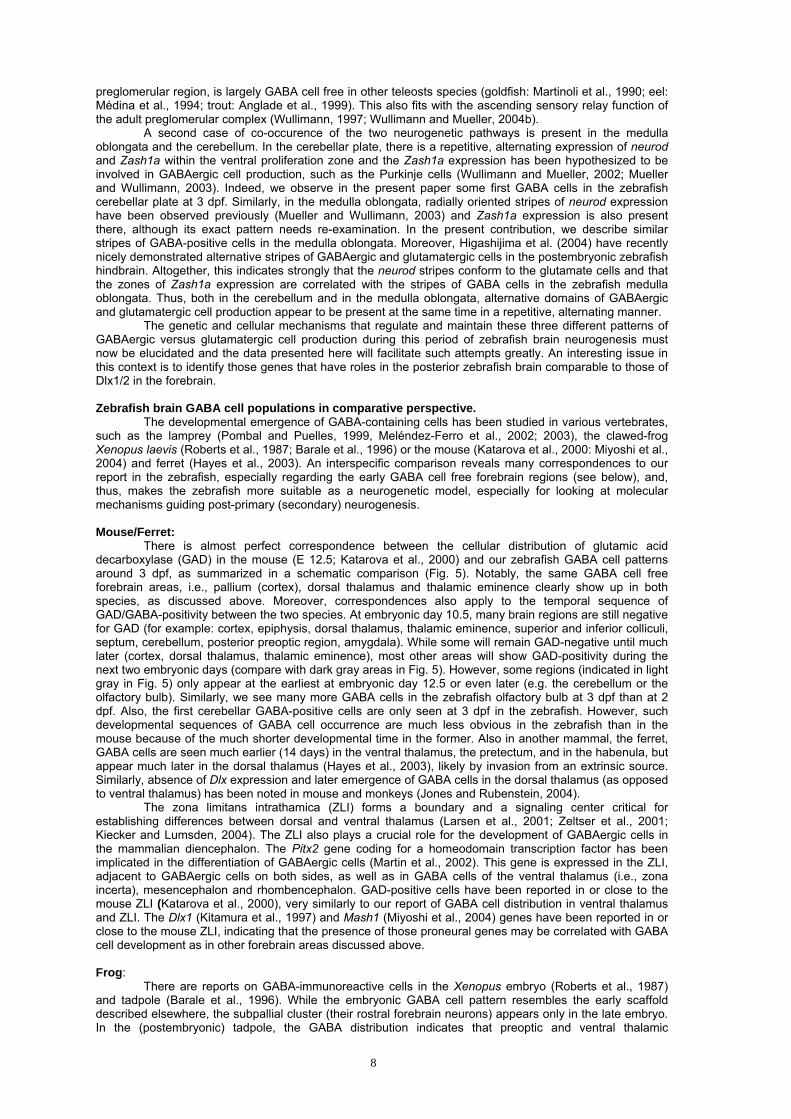
Zebrafish brain GABA cell populations in the functional developmental context. Several reports indicate that the earliest differentiating zebrafish brain neurons building the early axonal scaffold contain GABA around 24 h (Martin et al., 1998; Doldan et al., 1999) or at least that GABA-positive cells are closely associated with these first neurons. In any case, a more massive production of GABA cells is observed somewhat later in most parts of the early zebrafish brain approaching 2 days postfertilization (dpf), as shown in the present study. This developmental pattern is different from the emergence of an initially low and slowly increasing number of locally restricted cells exhibiting either the tyrosine hydroxylase positive neurochemical phenotype, representing dopaminergic and noradrenergic cells (Guo et al., 1999; Holzschuh et al., 2001, 2003; Rink and Wullimann, 2002; McLean and Fetcho, 2004a; b) or the cholinergic phenotype (T. Mueller, P. Vernier and M.F. Wullimann, unpublished observations). A similar slow developmental pattern is seen for serotoninergic cells (McLean and Fetcho, 2004a; b; Rink and Guo, 2004). The numeric dominance of early GABA-positive cells may be related to non-classical functions of GABA outside of neurotransmission during development, for example in the early axonal scaffold. Acetylcholinesterase (AChE) has been widely used to characterize first differentiating neurons, for example those of the axonal scaffold (Hanneman and Westerfield, 1989; Wilson et al., 1990; Chitnis and Kuwada, 1990; Ross et al., 1992) and it is assumed that AChE also has non-classical functions (outside of enzymatic acetylcholine breakdown), for example in axon guidance and/or in establishing stability of synapses, at least at the peripheral nervous neuromuscular junction (Downes and Granato, 2004). However, in postembryonic stages beginning with 2 dpf, the high number of GABA cells more likely directly represents the relative proportion of this functional neurochemical phenotype versus others. As shown in the present study, there is a clear mutual exclusive relationship of GABA and PCNA positive cells at postembryonic zebrafish stages (2/3 dpf), demonstrating that GABA cells are never proliferative (compare left and right sections of Fig. 4). Furthermore, additional distinct populations of GABA-negative - but postmitotic - cells can be discriminated among differentiating neuronal cells in the forebrain. This is most evident in the pallium, dorsal thalamus or eminentia thalami. These histogenetic domains are governed by neurogenin/neurod gene expression (Mueller and Wullimann, 2003; Wullimann and Mueller, 2004b) and lack GABA cells at this time point. In sharp contrast, other particular histogenetic forebrain units, such as the subpallium, preoptic region or ventral thalamus, are dominated by GABA-positive postmitotic cells. Thus, there is a clear spatial correlation in particular forebrain areas, such as subpallium, preoptic region or ventral thalamus, between the occurence of GABA cells and cells expressing certain proneural genes (Zash1a; Wullimann and Mueller, 2002), but not others (such as neurogenin, neuroD). In contrast, the GABA-negative pallium, dorsal thalamus and eminentia thalami are at the same time free of Zash1a expression, but they do express neurogenin and neuroD instead. The hypothalamus falls into the Zash1a positive category, but the ongoing elevated level of periventricular proliferation allows for GABA cells only to be present at the pial periphery there. Later, in the adult teleostean brain - as in all vertebrates -, GABA cells are more ubiquituously distributed, (goldfish: Martinoli et al., 1990; eel: Médina et al., 1994; trout: Anglade et al., 1999; zebrafish: Kim et al., 2004), including pallium (or cortex) and dorsal thalamus. The mechanisms of how these cells reach these initially GABA-free locations are being elucidated at the moment in other model systems (see above, tangential migration into cortex). The data presented here for the zebrafish allow now for comparable studies of neurogenesis in this model animal. In the light of these data, the interpretation of the distribution of GABA cells according to a prosomeric pattern with cell groups in each diencephalic neuromere (also in the dorsal thalamus) in the developing brain of another teleost, the stickleback Gasterosteus aculeatus, seems doubtful (Ekström and Ohlin, 1995). Almost certainly, the dorsal thalamus is also GABA-negative in the stickleback, at lest during early development. This species shows after around 100 h of development GABA-positive cell stripes in lateral view that have been interpreted as belonging to P1 (pretectum), P2 (dorsal thalamus) and P3 (ventral thalamus). However, our data in the zebrafish indicate in comparison that the stickleback GABA stripes in fact represent tegmental, pretectal, and zona limitans intrathalamica populations, respectively, and that the population assigned to P4 in the stickleback is the ventral thalamic population. In contrast to the above discussed case of alternative activity of two neurogenetic pathways in adjacent regions (e.g., pallium and subpallium), there are also zebrafish brain areas where both pathways act during postembryonic zebrafish brain development, but in different cells. These regions include habenula and epiphysis, the region of the nucleus of the medial longitudinal fascicle and the pretectum, the posterior tuberculum, optic tectum and torus semicircularis, as well as the mesencephalic tegmentum, the medulla oblongata, and the cerebellum (Wullimann and Mueller, 2002; Mueller and Wullimann, 2003). How is the distribution of GABA cells there? While it is not easy to interpret the patterns in each single region, two cases may be distinguished. A first case is evident in the posterior tuberculum (and possibly also in the pretectum). In the posterior tuberculum, GABA cells are increasingly more located towards the periphery of the gray matter towards 3 dpf, whereas the postmitotic cells close to the proliferation zones are GABA-negative at 3 dpf. It is known that these later postmitotic cells are neurod positive at this stage and that the Zash1a expression is more peripheral (Wullimann and Mueller, 2002; Mueller and Wullimann, 2003). This indicates that the GABA cells have been generated earlier and are displaced peripherally already. Nevertheless, the question whether identical or different ventricular sectors within the posterior tuberculum sequentially give rise to GABA cells first, and subsequently to other cells, needs further investigation. An interesting fact in this context is that the early migrated posterior tubercular region M2 is also GABA cell free (Fig. 3H). The M2 has been shown to maintain an unusual peripheral proliferation and neurod expression (Mueller and Wullimann, 2002), indicating that this region mostly consists of - and likely continues to produce - glutamatergic cells. This is in line with the finding that the likely adult derivative of the M2, the
8
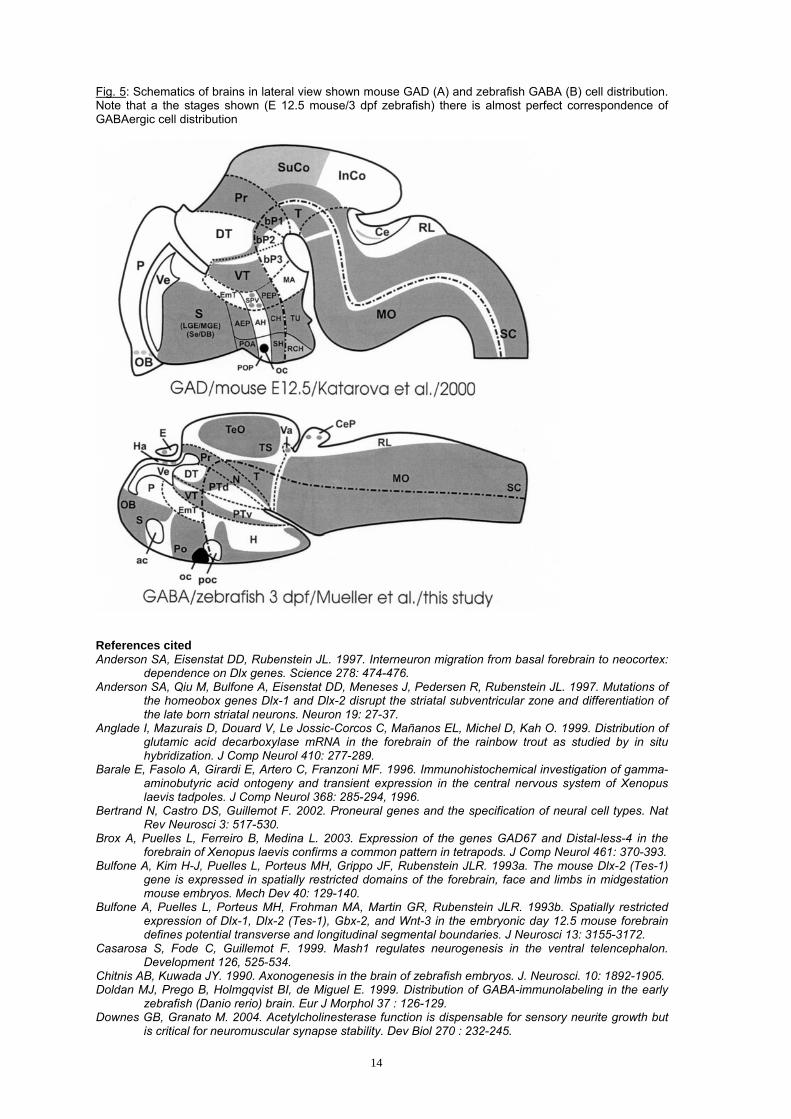
preglomerular region, is largely GABA cell free in other teleosts species (goldfish: Martinoli et al., 1990; eel: Médina et al., 1994; trout: Anglade et al., 1999). This also fits with the ascending sensory relay function of the adult preglomerular complex (Wullimann, 1997; Wullimann and Mueller, 2004b). A second case of co-occurence of the two neurogenetic pathways is present in the medulla oblongata and the cerebellum. In the cerebellar plate, there is a repetitive, alternating expression of neurod and Zash1a within the ventral proliferation zone and the Zash1a expression has been hypothesized to be involved in GABAergic cell production, such as the Purkinje cells (Wullimann and Mueller, 2002; Mueller and Wullimann, 2003). Indeed, we observe in the present paper some first GABA cells in the zebrafish cerebellar plate at 3 dpf. Similarly, in the medulla oblongata, radially oriented stripes of neurod expression have been observed previously (Mueller and Wullimann, 2003) and Zash1a expression is also present there, although its exact pattern needs re-examination. In the present contribution, we describe similar stripes of GABA-positive cells in the medulla oblongata. Moreover, Higashijima et al. (2004) have recently nicely demonstrated alternative stripes of GABAergic and glutamatergic cells in the postembryonic zebrafish hindbrain. Altogether, this indicates strongly that the neurod stripes conform to the glutamate cells and that the zones of Zash1a expression are correlated with the stripes of GABA cells in the zebrafish medulla oblongata. Thus, both in the cerebellum and in the medulla oblongata, alternative domains of GABAergic and glutamatergic cell production appear to be present at the same time in a repetitive, alternating manner. The genetic and cellular mechanisms that regulate and maintain these three different patterns of GABAergic versus glutamatergic cell production during this period of zebrafish brain neurogenesis must now be elucidated and the data presented here will facilitate such attempts greatly. An interesting issue in this context is to identify those genes that have roles in the posterior zebrafish brain comparable to those of Dlx1/2 in the forebrain. Zebrafish brain GABA cell populations in comparative perspective. The developmental emergence of GABA-containing cells has been studied in various vertebrates, such as the lamprey (Pombal and Puelles, 1999, Meléndez-Ferro et al., 2002; 2003), the clawed-frog Xenopus laevis (Roberts et al., 1987; Barale et al., 1996) or the mouse (Katarova et al., 2000: Miyoshi et al., 2004) and ferret (Hayes et al., 2003). An interspecific comparison reveals many correspondences to our report in the zebrafish, especially regarding the early GABA cell free forebrain regions (see below), and, thus, makes the zebrafish more suitable as a neurogenetic model, especially for looking at molecular mechanisms guiding post-primary (secondary) neurogenesis. Mouse/Ferret: There is almost perfect correspondence between the cellular distribution of glutamic acid decarboxylase (GAD) in the mouse (E 12.5; Katarova et al., 2000) and our zebrafish GABA cell patterns around 3 dpf, as summarized in a schematic comparison (Fig. 5). Notably, the same GABA cell free forebrain areas, i.e., pallium (cortex), dorsal thalamus and thalamic eminence clearly show up in both species, as discussed above. Moreover, correspondences also apply to the temporal sequence of GAD/GABA-positivity between the two species. At embryonic day 10.5, many brain regions are still negative for GAD (for example: cortex, epiphysis, dorsal thalamus, thalamic eminence, superior and inferior colliculi, septum, cerebellum, posterior preoptic region, amygdala). While some will remain GAD-negative until much later (cortex, dorsal thalamus, thalamic eminence), most other areas will show GAD-positivity during the next two embryonic days (compare with dark gray areas in Fig. 5). However, some regions (indicated in light gray in Fig. 5) only appear at the earliest at embryonic day 12.5 or even later (e.g. the cerebellum or the olfactory bulb). Similarly, we see many more GABA cells in the zebrafish olfactory bulb at 3 dpf than at 2 dpf. Also, the first cerebellar GABA-positive cells are only seen at 3 dpf in the zebrafish. However, such developmental sequences of GABA cell occurrence are much less obvious in the zebrafish than in the mouse because of the much shorter developmental time in the former. Also in another mammal, the ferret, GABA cells are seen much earlier (14 days) in the ventral thalamus, the pretectum, and in the habenula, but appear much later in the dorsal thalamus (Hayes et al., 2003), likely by invasion from an extrinsic source. Similarly, absence of Dlx expression and later emergence of GABA cells in the dorsal thalamus (as opposed to ventral thalamus) has been noted in mouse and monkeys (Jones and Rubenstein, 2004). The zona limitans intrathamica (ZLI) forms a boundary and a signaling center critical for establishing differences between dorsal and ventral thalamus (Larsen et al., 2001; Zeltser et al., 2001; Kiecker and Lumsden, 2004). The ZLI also plays a crucial role for the development of GABAergic cells in the mammalian diencephalon. The Pitx2 gene coding for a homeodomain transcription factor has been implicated in the differentiation of GABAergic cells (Martin et al., 2002). This gene is expressed in the ZLI, adjacent to GABAergic cells on both sides, as well as in GABA cells of the ventral thalamus (i.e., zona incerta), mesencephalon and rhombencephalon. GAD-positive cells have been reported in or close to the mouse ZLI (Katarova et al., 2000), very similarly to our report of GABA cell distribution in ventral thalamus and ZLI. The Dlx1 (Kitamura et al., 1997) and Mash1 (Miyoshi et al., 2004) genes have been reported in or close to the mouse ZLI, indicating that the presence of those proneural genes may be correlated with GABA cell development as in other forebrain areas discussed above. Frog: There are reports on GABA-immunoreactive cells in the Xenopus embryo (Roberts et al., 1987) and tadpole (Barale et al., 1996). While the embryonic GABA cell pattern resembles the early scaffold described elsewhere, the subpallial cluster (their rostral forebrain neurons) appears only in the late embryo. In the (postembryonic) tadpole, the GABA distribution indicates that preoptic and ventral thalamic
9
populations leave a gap of unstained cells in between possibly representing the eminentia thalami (as described analogously by proneural gene expression, e.g., neuroD; Wullimann et al., in press). Also in the adult Xenopus brain (Brox et al., 2003), the eminentia thalami remains free of GABA (but not the ventral thalamus, the preoptic region, or the subpallium). Lamprey: Studies on the development of GABA-positive cells in the lamprey brain (Meléndez-Ferro et al., 2002; 2003) also largely agree with patterns reported here in the zebrafish, e.g., regarding early presence versus absence of GABA cells in subpallium versus pallium. Furthermore, there are many more GABA cells towards the ventricle in the ventral (their rostral) thalamus compared to the dorsal (their caudal) thalamus. There, GABA cells are seen towards the periphery and some pictures (their figure 3 F) indicate a GABA cell free zone in the dorsal thalamus. Many GABA cells are seen early in the preoptic and hypothalamic region, as in the zebrafish. Also in agreement with our data is the report that the adult lamprey brain shows GABA-negativity in the eminentia thalami (Pombal and Puelles, 1999). In summary, we propose here, that these correspondences concerning GABA cell development in early vertebrate brain stages of different taxa - as exemplified in detail between zebrafish and mouse above - are part of a common basic vertebrate pattern of neuronal phenotype development. The early massive production of GABA-positive cell masses on which we focus in the present paper is only one characteristic of the whole pattern. Comparisons between zebrafish, mouse and Xenopus show that a particular stage may be identified in each model animal when this basic pattern of neurogenesis becomes most apparent. This pattern reflects the expression of a set of given patterning and proneural genes, coordinated by external signaling pathways (such as for example, Shh, BMPs, Wnts, FGFs), the combination of which is required to provide neuroblasts with specific differentiation programs (Bertrand et al., 2002). Thus, this pattern reflects the spatial (and temporal) constraint on gene expression, which in turn, is necessary to determine the fate of neuroblasts born at a defined place. We propose that this pattern corresponds to some sort of phylotypic stage in vertebrate neurogenesis (as suggested for general body development; Slack et al., 1993) useful to identify for cross-species comparisons and for the improvement of each given model system in the investigation of neurogenesis. For example, our study here indicates that there is an early mass production of GABA cells, that may be accompanied by the production of glutamatergic cell masses, followed in subsequent steps by the emergence of less abundant neurochemical neuronal cell types, such as dopaminergic, serotoninergic, and cholinergic cells. After neural determination took place, the derived cells can migrate and express their phenotype at a distance from the place of birth and determination. The concept of a phylotypic stage of neuronal phenotype development as proposed here may help in the integration of such observations in a particular and also in between diverse vertebrate organisms.
10
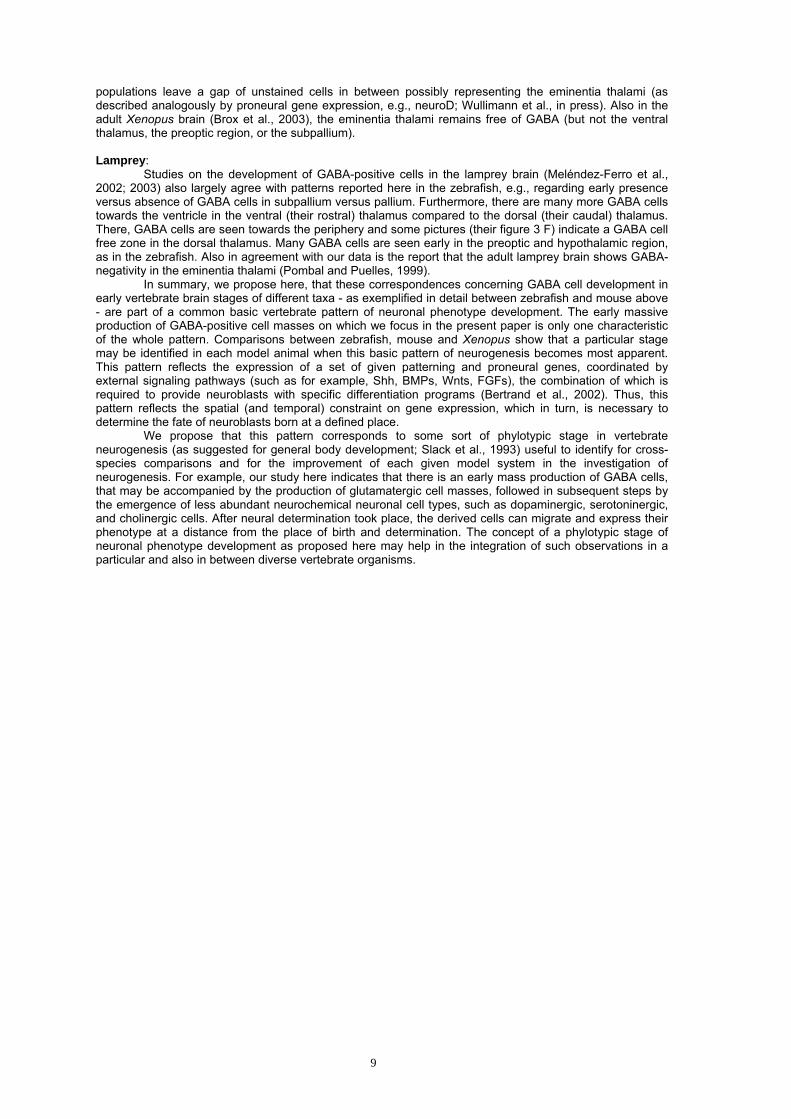
Figure legends Fig. 1: GABA-ir cell bodies and fibers in 2 dpf zebrafish brain from olfactory bulb (A) to mesencephalic (H) levels shown in transverse sections. Brain sections are counterstained with DAPI for cell nuclei. Schema in lower right corner shows levels of all transverse sections at 2 days shown in Figures 1 and 2. Arrowhead in (H) denotes GABA-positive cells at the utmost periphery of the intermediate hypothalamus. Scale bar correponds to 0.1 mm.
11
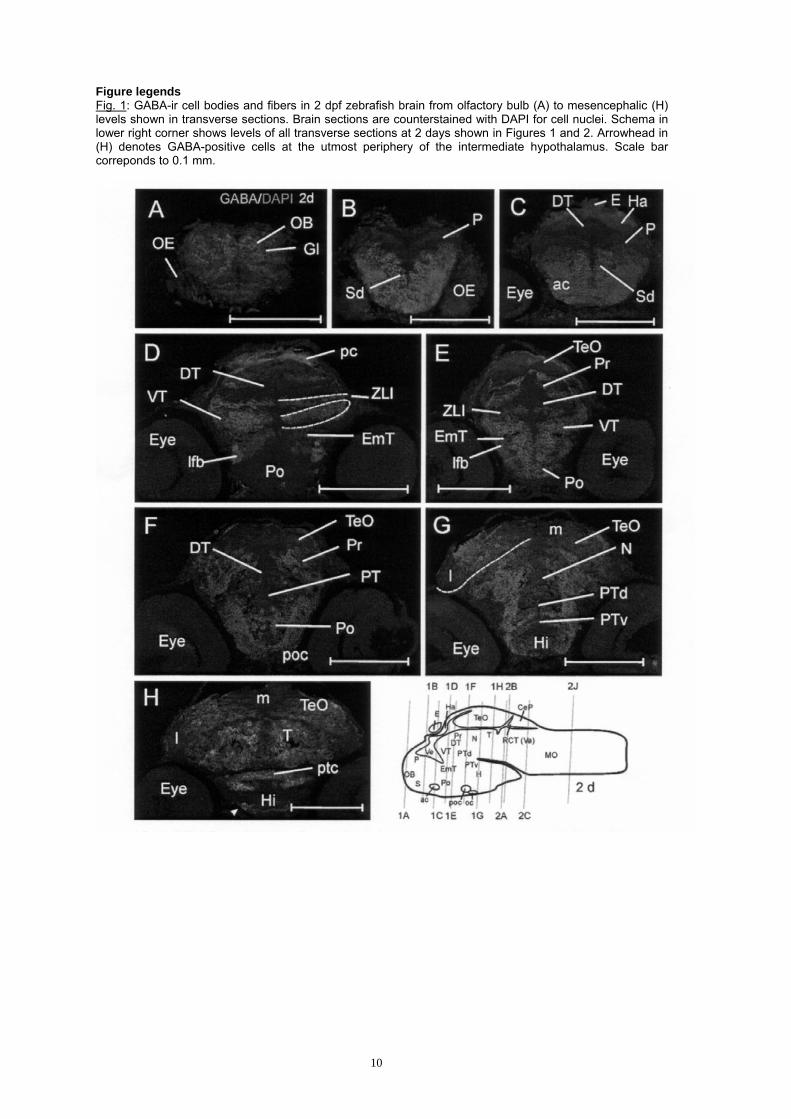
Fig. 2: GABA-ir cell bodies and fibers in 2 dpf (A-C, J) and 3 dpf (D-I) zebrafish brain at rhombencephalic levels. Arrowheads in (B) denote GABA-positive cells at the utmost periphery of the intermediate hypothalamus. Brain sections are counterstained with DAPI for cell nuclei and NeuroTrace® Nissl stain (3 dpf only). Scale bar correponds to 0.1 mm.
12
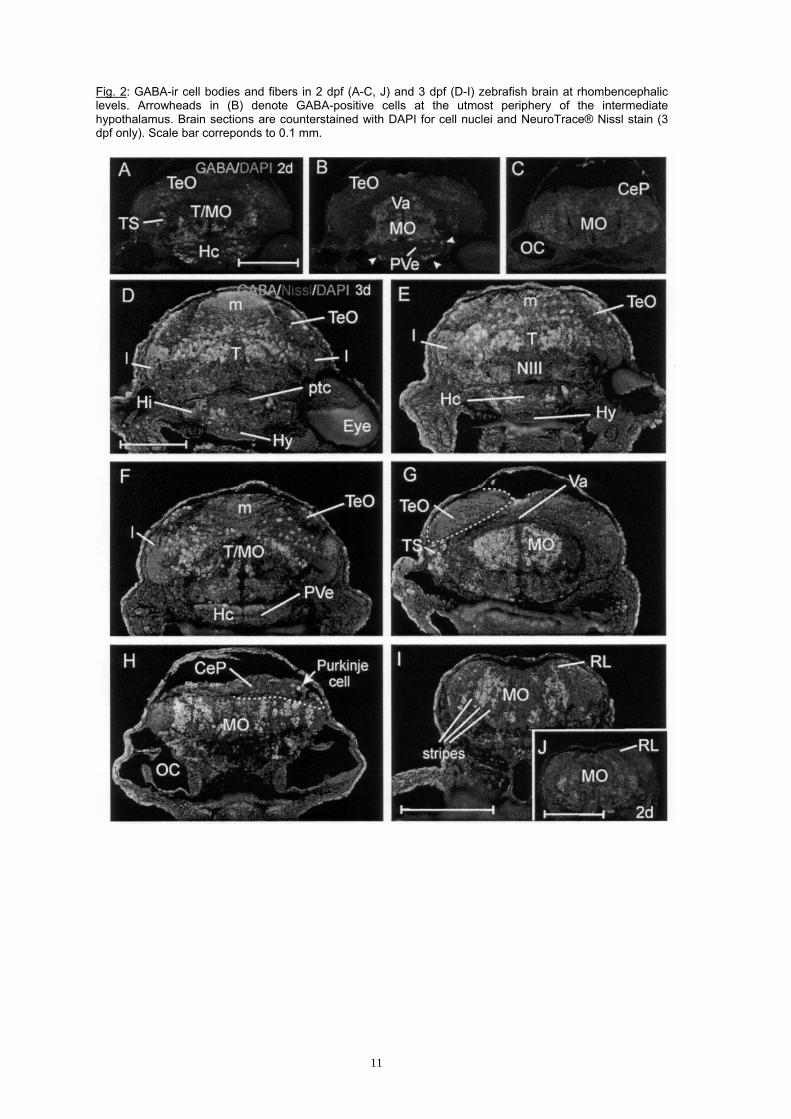
Fig. 3: GABA-ir cell bodies and fibers in 3 dpf zebrafish brain from olfactory bulb (A) to anterior mesencephalic (H) levels. Brain sections are counterstained with DAPI for cell nuclei and NeuroTrace® Nissl stain. Arrowheads in (B) denote GABA-positive cells possibly invading the pallium from the subpallium. Arrowheads in (C) point to retinal GABA-positive (likely future amacrine) cells. Note also GABA-negativity in the eminentia thalami (D). Scale bar correponds to 0.1 mm.
13
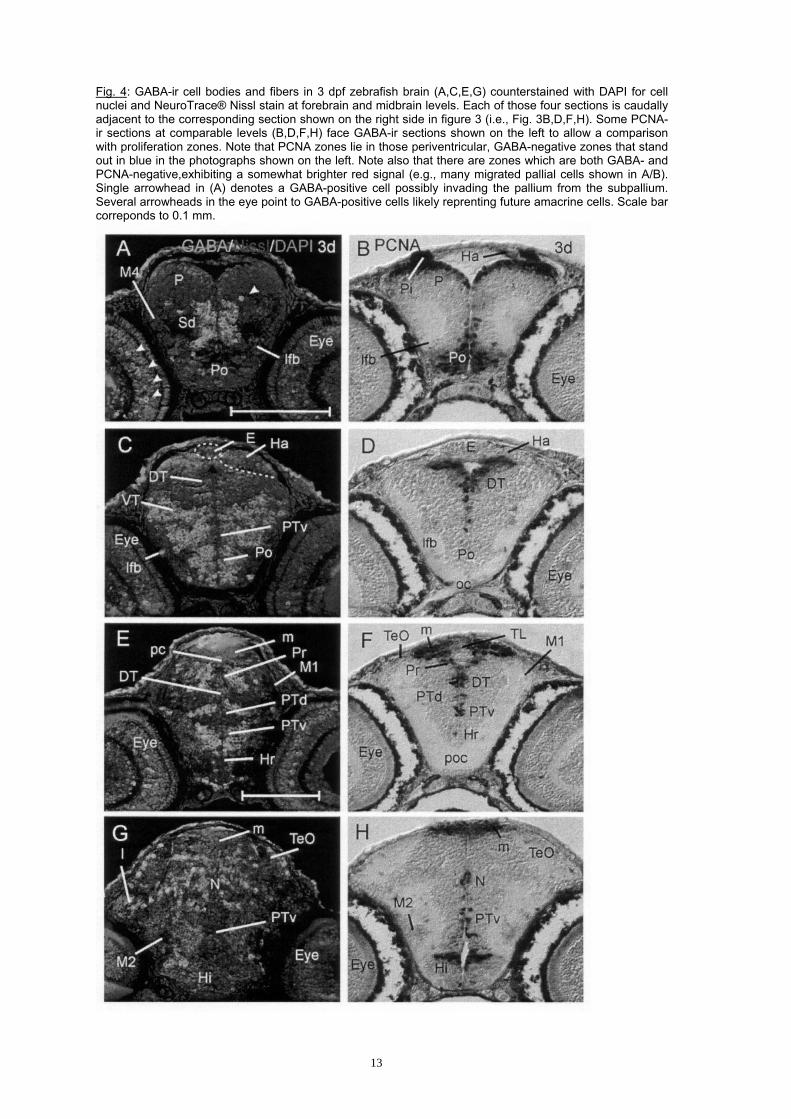
Fig. 4: GABA-ir cell bodies and fibers in 3 dpf zebrafish brain (A,C,E,G) counterstained with DAPI for cell nuclei and NeuroTrace® Nissl stain at forebrain and midbrain levels. Each of those four sections is caudally adjacent to the corresponding section shown on the right side in figure 3 (i.e., Fig. 3B,D,F,H). Some PCNA-ir sections at comparable levels (B,D,F,H) face GABA-ir sections shown on the left to allow a comparison with proliferation zones. Note that PCNA zones lie in those periventricular, GABA-negative zones that stand out in blue in the photographs shown on the left. Note also that there are zones which are both GABA- and PCNA-negative,exhibiting a somewhat brighter red signal (e.g., many migrated pallial cells shown in A/B). Single arrowhead in (A) denotes a GABA-positive cell possibly invading the pallium from the subpallium. Several arrowheads in the eye point to GABA-positive cells likely reprenting future amacrine cells. Scale bar correponds to 0.1 mm.
14
Fig. 5: Schematics of brains in lateral view shown mouse GAD (A) and zebrafish GABA (B) cell distribution. Note that a the stages shown (E 12.5 mouse/3 dpf zebrafish) there is almost perfect correspondence of GABAergic cell distribution
References cited Anderson SA, Eisenstat DD, Rubenstein JL. 1997. Interneuron migration from basal forebrain to neocortex:
dependence on Dlx genes. Science 278: 474-476. Anderson SA, Qiu M, Bulfone A, Eisenstat DD, Meneses J, Pedersen R, Rubenstein JL. 1997. Mutations of
the homeobox genes Dlx-1 and Dlx-2 disrupt the striatal subventricular zone and differentiation of the late born striatal neurons. Neuron 19: 27-37.
Anglade I, Mazurais D, Douard V, Le Jossic-Corcos C, Mañanos EL, Michel D, Kah O. 1999. Distribution of glutamic acid decarboxylase mRNA in the forebrain of the rainbow trout as studied by in situ hybridization. J Comp Neurol 410: 277-289.
Barale E, Fasolo A, Girardi E, Artero C, Franzoni MF. 1996. Immunohistochemical investigation of gamma-aminobutyric acid ontogeny and transient expression in the central nervous system of Xenopus laevis tadpoles. J Comp Neurol 368: 285-294, 1996.
Bertrand N, Castro DS, Guillemot F. 2002. Proneural genes and the specification of neural cell types. Nat Rev Neurosci 3: 517-530.
Brox A, Puelles L, Ferreiro B, Medina L. 2003. Expression of the genes GAD67 and Distal-less-4 in the forebrain of Xenopus laevis confirms a common pattern in tetrapods. J Comp Neurol 461: 370-393.
Bulfone A, Kim H-J, Puelles L, Porteus MH, Grippo JF, Rubenstein JLR. 1993a. The mouse Dlx-2 (Tes-1) gene is expressed in spatially restricted domains of the forebrain, face and limbs in midgestation mouse embryos. Mech Dev 40: 129-140.
Bulfone A, Puelles L, Porteus MH, Frohman MA, Martin GR, Rubenstein JLR. 1993b. Spatially restricted expression of Dlx-1, Dlx-2 (Tes-1), Gbx-2, and Wnt-3 in the embryonic day 12.5 mouse forebrain defines potential transverse and longitudinal segmental boundaries. J Neurosci 13: 3155-3172.
Casarosa S, Fode C, Guillemot F. 1999. Mash1 regulates neurogenesis in the ventral telencephalon. Development 126, 525-534.
Chitnis AB, Kuwada JY. 1990. Axonogenesis in the brain of zebrafish embryos. J. Neurosci. 10: 1892-1905. Doldan MJ, Prego B, Holmgqvist BI, de Miguel E. 1999. Distribution of GABA-immunolabeling in the early
zebrafish (Danio rerio) brain. Eur J Morphol 37 : 126-129. Downes GB, Granato M. 2004. Acetylcholinesterase function is dispensable for sensory neurite growth but
is critical for neuromuscular synapse stability. Dev Biol 270 : 232-245.
15
Eisenstat DD, Liu JK, Mione M, Zhong W, Yu G, Anderson SA, Ghattas I, Puelles P, Rubenstein JLR. 1999. DLX-1, DLX-2, and DLX-5 expression define distinct stages of basal forebrain differentiation. J Comp Neurol 414: 217-237.
Ekström P, Ohlin L-M. 1995. Ontogeny of GABA-immunoreactive neurons in the central nervous system in a teleost, Gasterosteus aculeatus L. J Chem Neuroanatomy 94 : 271-288.
Fode C, Ma Q, Casarosa S, Ang S-L, Anderson DJ, Guillemot F. 2000. A role for neural determination genes in specifying the dorsoventral identity of telencephalic neurons. Genes & Development 14: 67-80.
Guo S, Wilson SW, Cooke S, Chitnis AB, Driever W, Rosenthal A. 1999. Mutations in the zebrafish unmask shared regulatory pathways controlling the development of catecholaminergic neurons, Develop Biol 208: 473-487.
Hanneman E, Westerfield M. 1989. Early expression of acetylcholinesterase activity in functionally distinct neurons of the zebrafish. J Comp Neurol 284: 350-361.
Hayes SG, Murray KD, Jones EG. 2003. Two epochs in the development of γ-aminobutyric acidergic neurons in the ferret thalamus. J Comp Neurol 463 : 45-65.
Higashijima S-J, Mandel G, Fetcho JR. 2004. Distribution of prospective glutamatergic, glycinergic, and GABAergic neurons in embryonic and larval zebrafish. J Comp Neurol 480: 1-18.
Holzschuh, J, Ryu S, Aberger F, Driever W. 2001. Dopamine transporter expression distinguishes dopaminergic neurons from other catecholaminergic neurons in the developing zebrafish embryo. Mech Dev 101: 237-243.
Holzschuh JS, Hauptmann G, Driever W. 2003. Genetic analysis of the roles of Hh, FGF8, and Nodal signaling during catecholaminergic system development in the zebrafish brain. J Neurosci 23: 5507-5519.
Horton S, Meredith A, Richardson JA, Johnson JE. 1999. Correct coordination of neuronal differentiation events in ventral forebrain requires the bHLH factor Mash1. Mol Cell Neurosci 14, 355-369.
Katarova Z., Sekerková G, Prodan S, Mugnaini E, Szabó G. 2000. Domain-restricted expression of two glutamic acid decarboxylase genes in midgestation mouse embryos. J Comp Neurol 424: 607-627.
Kiecker C, Lumsden A. 2004. Hedgehog signaling from the ZLI regulates diencephalic regional identity. Nature Neurosci 7: 1242-1249.
Kim Y-J, Nam R-H, Yoo YM, Lee C-J. 2004. Identification and functional evidence of GABAergic neurons in parts of the brain of adult zebrafish (Danio rerio). Neurosci Letters 355: 29-32.
Kimmel CB, Ballard WW, Kimmel SR, Ullmann B, Schilling TF. 1995. Stages of embryonic development of the zebrafish. Dev Dyn 203: 253-310.
Kitamura K, Miura H, Yanzawa M, Miyashita T Kato K. 1997. Expression patterns of Brx1 (Rieg gene), Sonic hedgehog, Nkx2.2, Dlx1 and Arx during zona limitans intrathalamica and embryonic ventral lateral geniculate nuclear formation. MOD 67: 83-96.
Jones EG, Rubenstein JLR. 2004. Expression of regulatory genes during differentiation of thalamic nuclei in mouse and monkey. J Comp Neurol 477: 55-80.
Larsen CW, Zeltser LM, Lumsden A. 2001. Boundary formation and compartition in the avian diencephalon. J Neurosci 21: 4699-4711
Lo L-C, Johnson JE, Wuenschell CW, Saito T, Anderson DJ. 1991. Mammalian achaete-scute homolog 1 is transiently expressed by spatially restricted subsets of early neuroepithelial and neural crest cells. Genes & Development 5: 1524-1537.
Ma Q, Sommer L, Cserjesi P, Anderson DJ. 1997. Mash1 and neurogenin1 expression patterns define complementary domains of neuroepithelium in the developing CNS and are correlated with regions expressing Notch ligands. J Neurosci 17, 3644-3652.
Marín O, Rubenstein JLR. 2001. A long, remarkable journey: tangential migration in the telencephalon. Nature Rev Neurosci 2: 780-790.
Marín O, Anderson SA Rubenstein JLR. 2000. Origin and molecular specification of striatal interneurons J Neurosci 20: 6063-6076
Martin SC, Heinrich G, Sandell JH (1998) Sequence and expression of glutamic acid decarboxylase isoforms in the developing zebrafish. J Comp Neurol 396: 253-266.
Martin DM, Skidmore JM, Fox SE, Gage PJ, Camper SA. 2002. Pitx2 distinguishes subtypes of terminally differentiated neurons in the developing mouse neuroepithelium. Dev Biol 252: 84-99.
Martinoli M-G, Dubourg P, Geffard M, Calas A, Kah O. 1990. Distribution of GABA-ir neurons in the forebrain of the goldfish, Carassius auratus. Cell Tissue Res 260: 77-84.
McLean D, Fetcho JR. 2004a. Ontogeny and innervation patterns of dopaminergic, noradrenergic, and serotonergic neurons in larval zebrafish. J Comp Neurol 480: 38-56.
McLean D, Fetcho JR. 2004b. Relationship of tyrosine hydroxylase and serotinin immunoreactivity to sensorimotor circuitry in larva zebrafish. J Comp Neurol: 57-71.
Médina M, Repérant J, Dufour S, Ward R, Le Belle N, Miceli D. 1994. The distribution of GABA-ir neurons in the brain of the silver eel. Anat. Embryol. 189: 25-39.
Meléndez-Ferro M, Pérez-Costas, E, Villar-Cheda, B, Abalo XM, Rodríguez-Muñoz R, Rodicio MC, Anadòn R. 2002. Ontogeny of γ-aminobtyric acid-immunoreactive neuronal populations in the forebrain and midbrain of the sea lamprey. J Comp Neurol 446: 360-376.
Meléndez-Ferro M, Pérez-Costas, E, Villar-Cheda B, Abalo XM, Rodríguez-Muñoz R, Anadòn R, Rodicio MC. 2003. Ontogeny of γ-aminobtyric acid-immunoreactive neuronal populations in the rhombencephalon and spinal cord of the sea lamprey. J Comp Neurol 464: 17-35.
16
Miyoshi G, Bessho Y, Yamada S, Kageyama R. 2004. Identfication of a novel basic helix-loop-helix gene, Heslike, and its role in GABaergic neurogenesis. J Neurosci 24: 3672-3682.
Mueller T, Wullimann MF. 2002. BrdU-, neuroD-(nrd) and Hu-studies show unusual non-ventricular neurogenesis in the postembryonic zebrafish forebrain. Mech Dev 117: 123-135.
Mueller T, Wullimann MF. 2003. Anatomy of neurogenesis in the zebrafish brain. Dev Brain Res 140: 135-153.
Mueller T, and Wullimann MF. 2005. Atlas of early zebrafish brain development: a tool for molecular neurogenetics. Elsevier Publishing Company, Amsterdam (in press).
Nery S, Fishell G, Corgin JG. 2002. The caudal ganglionic eminece is a source of distinc cortical and subcorticla cell populations. Nature Neurosci 5: 1279-1287.
Pombal MA, Puelles L. 1999. Prosomeric map of the lamprey forebrain based on calretinin immunocytochemistry, Nissl stain and ancillary markers. J Comp Neurol 414: 39-422.
Puelles L, Kuwana E, Puelles E, Rubenstein JLR. 1999. Comparison of the mammalian and avian telencephalon from the perspective of gene expression data. Europ J Morphol. 37: 139-150.
Puelles L, Kuwana E, Puelles E, Bulfone A, Shimamura K, Keleher J, Smiga S, Rubenstein JLR. 2000. Pallial and subpallial derivatives in the embryonic chick and mouse telencephalon, traced by the expression of the genes Dlx-2, Emx-1, Nkx-2.1, Pax-6, and Tbr-1. J Comp Neurol 424: 409-438.
Rink E, and Guo S. 2004. The too few mutnat selectively affects subgroups of monoaminergic neurons in the zebrafish forebrain. Neuroscience 127 : 147-154.
Rink E, Wullimann MF. 2002. Development of the catecholaminergic system in the early zebrafish brain: an immunohistochemical study. Dev Brain Res 137, 89-100.
Roberts A, Dale N, Ottersen OP, Storm-Mathisen J. 1987. The early development of neurons with GABA immunoreactivity in the CNS of Xenopus laevis embryos. J Comp Neurol 261: 435-449, 1987.
Ross LS, Parrett T, Easter SEJr. 1992. Axonogenesis and morphogenesis in the embryonic zebrafish brain. J Neurosci 12:467-482.
Schuurmans C, Guillemot F. 2002. Molecular mechanisms underlying cell fate specification in the developing telencephalon. Curr Opin Neurobiol 12, 26-34.
Slack JM, Holland PW, Graham CF. 1993. The zootype and the phylotypic stage. Nature 361 : 490-492. Sussel L, Marin O, Kimura S, Rubenstein JLR. 1999. Loss of Nkx2.1 homeobox gene function results in
ventral to dorsal molecular respecification within the basal telencephalon: evidence for a transformation of the pallidum into the striatum. Development 126: 3359-3370
Torii M-a, Matsuzaki F, Osumi N, Kaibuchi K, Nakamura S, Casarosa S, Guillemot F, Nakafuku M. 1999. Transcription factors Mash-1 and Prox-1 delineate early steps in differentation of neural stem cells in the developing central nervous system. Development 126, 443-456.
Westerfield M. 1995. The zebrafish book . University of Oregon Press, Eugene, Oregon. Wilson, S.W., Ross, L.S., Parrett, T., Easter, S.S. Jr. 1990. The development of a simple scaffold of axon
tracts in the brain of the embryonic zebrafish, Brachydanio rerio. Development 108: 121-145. Wullimann MF. 1997. The central nervous system. In: Evans DH (ed) The physiology of fishes. CRC Press,
Boca Raton, pp. 245-282. Wullimann MF, Mueller. 2002. Expression of Zash-1a in the postembryonic zebrafish brain allows
comparison to mouse Mash1 domains. Gene Expression Patterns 1: 187-192. Wullimann MF, Mueller T. 2004a. Identification and morphogenesis of the eminentia thalami in the
zebrafish. J Comp Neurol 471: 37-48. Wullimann, M.F., and Mueller T. 2004b. Teleostean and mammalian forebrains contrasted: evidence from
genes to behavior. J. Comp. Neurol. 475: 143-162. Wullimann MF, Puelles L. 1999. Postembryonic neural proliferation in the zebrafish forebrain and its
relationship to prosomeric domains. Anat Embryol 199: 329-348. Wullimann MF, Rink E, Vernier, P, Schlosser G (in press) Secondary neurogenesis in the brain of the
African clawed frog, Xenopus laevis, as revealed by PCNA, Delta-1, Neurogenin-related-1 and NeuroD expression. J. Comp Neurol (in press)
Xu Q, Cobos I, de la Cruz E, Anderson JL. 2004 Origins of cortical interneuron subtypes. J Neurosci 24: 2612-2622.
Yun K, Fischman S, Johnson J, De Angelis MH, Weinmaster G, Rubenstein JLR. 2002. Modulation of the notch signaling by Mash1 and Dlx1/2 regulates sequential specification and differentiation of progenitor cell types in the subcortical telencephalon. Development 129: 5029-5040
Zeltser, L.M., Larsen, C.W., Lumsden, A. 2001. A new developmental compartment in the forebrain regulated by Lunatic fringe. Nature Neurosci. 4: 683-684.
Zhao Y, Marín O, Hermesz E, Powell A, Flames N, Palkovits M, Rubenstein JLR, Westphal H. 2003. The LIM-homeobox gene Lhx8 is required for the development of many cholinergic neurons in the mouse forebrain. PNAS USA 100: 9005-9010.
Abbreviations ac anterior commissure AEP anterior entopeduncular area (mouse) bP1 basal plate of prosomere 1(mouse) bP2 basal plate of prosomere 2 (mouse) bP3 basal plate of prosomere 3 (mouse) Ce cerebellum
17
CeP cerebellar plate DB diagonal band of Broca (mouse) DT dorsal thalamus (thalamus) E epiphysis EmT eminentia thalami Gl olfactory bulb glomeruli H hypothalamus Ha habenula Hc caudal hypothalamus HC hypothalamic cell cord (mouse) Hi intermediate hypothalamus Hr rostral hypothalamus Hy hypophysis (pituitary) InCo inferior colliculus (mouse) l lateral tectal proliferation lfb lateral forebrain bundle LGE lateral ganglionic eminence (mouse) LVe lateral recess ventricle of H M1 migrated pretectal area M2 migrated posterior tubercular area M3 migrated area of EmT M4 migrated telencephalic area m medial tectal proliferation MA mammillary hypothalamus (mouse) MGE medial ganglionic eminence (mouse) MHB midbrain-hindbrain boundary MO medulla oblongata NIII oculomotor nerve nucleus N region of the nucleus of medial longitudinal fascicle OB olfactory bulb oc optic chiasma OC otic capsule OE olfactory epithelium P pallium pc posterior commissure PEP posterior entopeduncular area (mouse) Pi pigment Po preoptic region POA anterior preoptic area (mouse) poc postoptic commissure POP posterior preoptic area (mouse) Pr pretectum PT posterior tuberculum ptc posterior tubercular commissure PTd dorsal part of posterior tuberculum PTv ventral part of posterior tuberculum PVe posterior recess ventricle of H RCH retrochiasmatic hypothalamus (mouse) RCT rostral cerebellar thickening (valvula) RL rhombic lip S subpallium SC spinal cord Sd dorsal division of S Se septum SH suprachiasmatic area (mouse) SPV supraoptic/paraventricular area (mouse) SuCo superior colliculus (mouse) Sv ventral division of S T midbrain tegmentum TeO tectum opticum TL torus longitudinalis TS torus semicircularis TU tuberal hypothalamus (mouse) Va valvula cerebelli Ve brain ventricle VT ventral thalamus (prethalamus) ZLI zona limitans intrathalamica