
A perspective on the refining industry - Amazon S3€¢ 1/7 of oil demand is taken by non-refinery...
23
Platts European Refining Summit Brussels, 29 September2016 Kristine Petrosyan, International Energy Agency A perspective on the refining industry © OECD/IEA 2016
-
Upload
vuongnguyet -
Category
Documents
-
view
213 -
download
0
Transcript of A perspective on the refining industry - Amazon S3€¢ 1/7 of oil demand is taken by non-refinery...

Platts European Refining Summit Brussels, 29 September2016
Kristine Petrosyan, International Energy Agency
A perspective on the refining industry
© OECD/IEA 2016

© OECD/IEA 2012 © OECD/IEA 2016
European refiners: busy 2015
• First annual average runs increase since 2005.
• Robust 700 kb/d yoy: third of global gains last year.
• Beat China, US, Middle East gains.
• Healthy 85% utilisation rates, after an average of 78% for two previous years.
10.0
10.5
11.0
11.5
12.0
12.5
13.0
13.5
14.0
14.5
2004 2006 2008 2010 2012 2014
mb/d
OECD Europe refinery intake

© OECD/IEA 2012 © OECD/IEA 2016
-8-6-4-202468
101214
Jan 09 Jan 10 Jan 11 Jan 12 Jan 13 Jan 14 Jan 15
$/b
Brent NWE cracking Brent NWE HSK
Grab the margins while they last
• Sustained margin recovery from historical lows of early 2014.
• Even NWE hydroskimming margins were positive most of 2015.
• Same picture worldwide – refiners are earning, while the upstream profits plummet.
NWE margins

© OECD/IEA 2012 © OECD/IEA 2016
Refining saves the day
Upstream vs downstream earnings
-10
20
50
80
110
140
170
2006 2007 2008 2009 2010 2011 2012 2013 2014 2015
$bln Oil company earnings by segment*
upstream downstream*BP, Exxon, Shell, Total, Lukoil, Sinopec
-1.2
-0.7
-0.2
0.3
0.8
1.3
1.8
BP Exxon Shell Total Lukoil Sinopec
mb/d Refinery throughput changes (2006-2015)

© OECD/IEA 2012 © OECD/IEA 2016
Enthusiastic demand response to price
• By end-2014 oil prices had lost 30% vs the previous 3 year avg.
• By end-2015, losses amounted to 60%.
• 2015 saw biggest annual demand growth rate in 10 years (excluding post-recession recovery of 2010).
• OECD demand growth was led by the US, but Europe added some 200 kb/d too.
Oil price vs 2011-2013 average
0.0
0.2
0.4
0.6
0.8
1.0
1.2
1.4
1.6
1.8
2005 2007 2009* 2011 2013 2015
mb/d
*2008-2010 values are normalised for recession
and recovery
Annual global demand growth
-80%
-60%
-40%
-20%
0%
1Q14 3Q14 1Q15 3Q15 1Q16 3Q16
© OECD/IEA 2012 © OECD/IEA 2016
10%
1%
0.3%
3%
86%
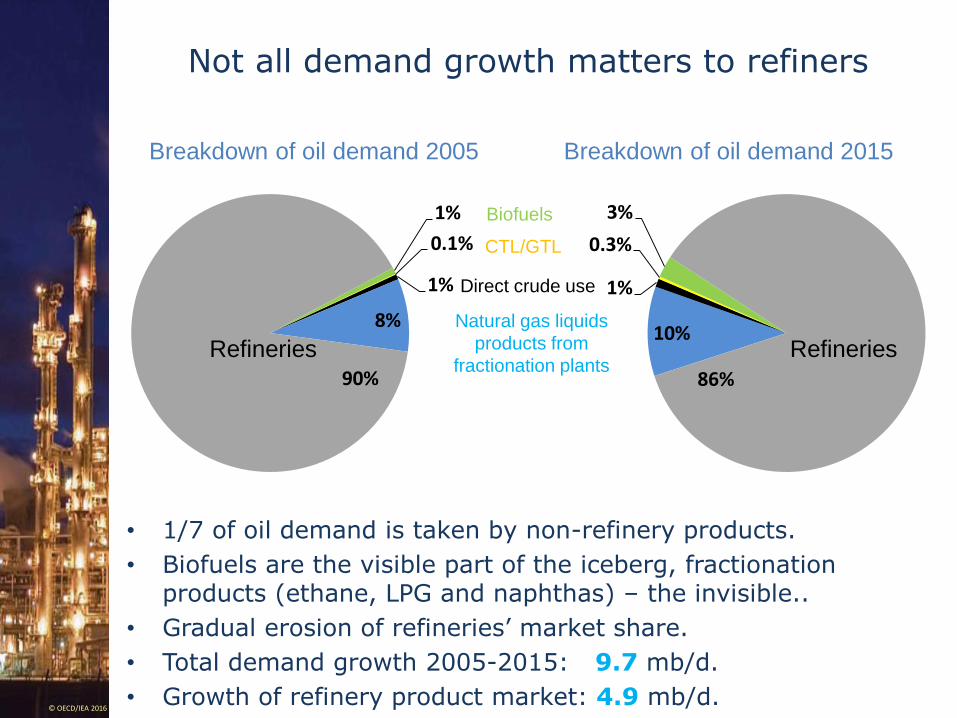
Not all demand growth matters to refiners
• 1/7 of oil demand is taken by non-refinery products.
• Biofuels are the visible part of the iceberg, fractionation products (ethane, LPG and naphthas) – the invisible..
• Gradual erosion of refineries’ market share.
• Total demand growth 2005-2015: 9.7 mb/d.
• Growth of refinery product market: 4.9 mb/d.
Breakdown of oil demand 2005 Breakdown of oil demand 2015
Biofuels
CTL/GTL
Natural gas liquids
products from
fractionation plants
Direct crude use
1%
0.1%
1%
8%
90%
Refineries Refineries

© OECD/IEA 2012 © OECD/IEA 2016
Strongest growth in non-refined category
• Petrochemical feedstocks saw strongest growth. All can be supplied by fractionators.
• Light and middle distillates saw more modest growth rates
• Fuel oil declined
-4%
-3%
-2%
-1%
0%
1%
2%
3%
4%
Oil product demand changes 2010-15Compound annual growth rates

© OECD/IEA 2012 © OECD/IEA 2016
Capacity growth –two steps ahead of demand?
• Total oil demand grew a ‘reasonable’ 10 mb/d in the last 10 years.
Annual growth 2005-15
• Refined product demand only grew by 5 mb/d. It didn’t grow at all during 2008-2010, neither in 2014.
• Refinery capacity grew by 8.7 mb/d (4 mb/d in 2008-2010...)
0.0
0.2
0.4
0.6
0.8
1.0
1.2
1.4
1.6
1.8
2005 2007 2009* 2011 2013 2015
mb/d
Total demand
0.0
0.2
0.4
0.6
0.8
1.0
1.2
1.4
1.6
1.8
2005 2007 2009* 2011 2013 2015
mb/d
Refinery demand
0.0
0.2
0.4
0.6
0.8
1.0
1.2
1.4
1.6
1.8
2005 2007 2009* 2011 2013 2015
mb/d
Refinery demand
Capacity growth
*2008-2010 values are normalised for recession and recovery

© OECD/IEA 2012 © OECD/IEA 2016
Refinery market share next five years: good news and bad news
• The good news: higher total demand growth, higher refined product demand growth (5.9 mb/d vs 3.2 mb/d)
• The bad news: more aggressive capacity expansion: 7.7 vs 3.2.
• Spare capacity to increase by at least 1 mb/d.
Total change, 2015-21
0.0
1.0
2.0
3.0
4.0
5.0
6.0
7.0
8.0
9.0
2009-15 2015-21
mb/d
Total demand
Refinery demand
Capacity

© OECD/IEA 2012 © OECD/IEA 2016
Non-OECD refiners back to the driving seat
• In 2Q16 non-OECD runs are forecast to rise to 42 mb/d, a level never reached by OECD refiners before.
• Despite bright spots – (Korea, US), OECD runs resume declining trend.
-1.0
-0.5
0.0
0.5
1.0
1.5
2.0
2.5
3.0
1Q13 3Q13 1Q14 3Q14 1Q15 3Q15 1Q16 3Q16
mb/d Global Crude ThroughputsAnnual Change
OECD Non-OECD
30
32
34
36
38
40
42
1Q
2004
1Q
2005
1Q
2006
1Q
2007
1Q
2008
1Q
2009
1Q
2010
1Q
2011
1Q
2012
1Q
2013
1Q
2014
1Q
2015
1Q
2016
mb/dOECD vs. Non-OECD Crude Runs
OECD Non-OECD

© OECD/IEA 2012 © OECD/IEA 2016
Europe and the US – worlds apart?
• Both OECD Europe and the US face declining demand, with growing capacity overhang.
• Europe went through more aggressive rationalisation.
• Europe could expand refinery runs to cover remaining imports?
• While the US, if deprived of export markets, would face bigger overcapacity.
Unused CDU capacity
-1.0
0.0
1.0
2.0
3.0
4.0
2012 2014 2016 2018 2020
mb/d
2012 2014 2016 2018 2020
OECD Europe
US
2012 2014 2016 2018 2020
Refined products balance Capacity above local demand
Capacity shutdowns since 2007
OECD Europe: 2 mb/d US: 1.2 mb/d
© OECD/IEA 2012 © OECD/IEA 2016
36%
5%
9%
12%
38%
8%
7%
7%
22%
56%
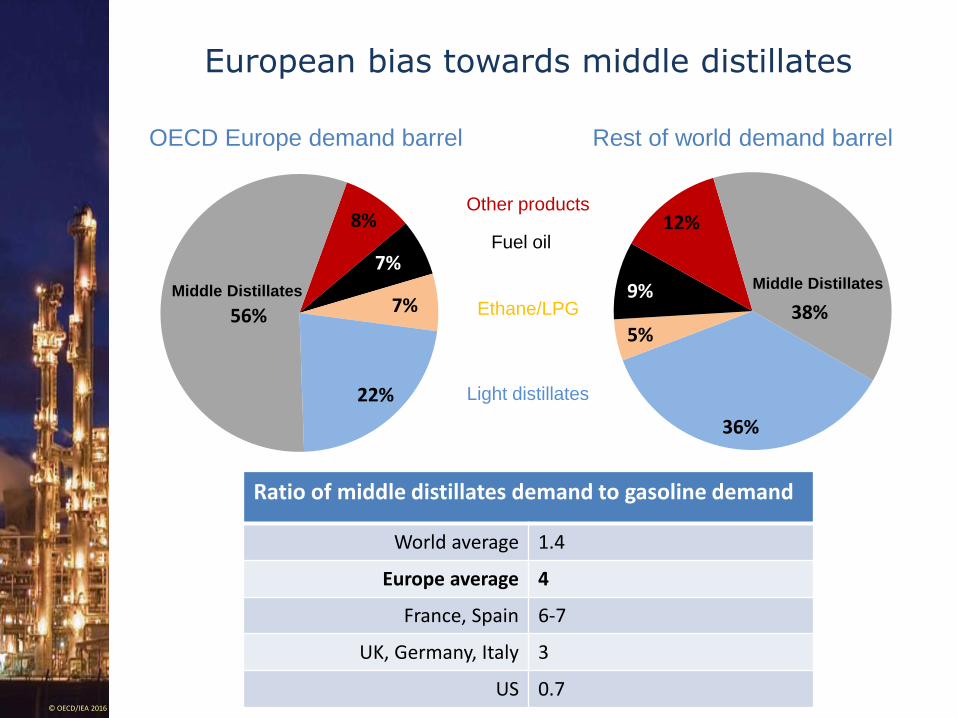
European bias towards middle distillates
OECD Europe demand barrel Rest of world demand barrel
Other products
Fuel oil
Light distillates
Ethane/LPG Middle Distillates Middle Distillates
Ratio of middle distillates demand to gasoline demand
World average 1.4
Europe average 4
France, Spain 6-7
UK, Germany, Italy 3
US 0.7

© OECD/IEA 2012 © OECD/IEA 2016
8%
7%
7%
22%
56%
Refining impasse?
• Euro refiners have some of the highest middle distillates yields.
• But the region still imports almost fifth of middle distillates consumed (1.3 mb/d)
• Exports third of gasoline output (1 mb/d).
• Gasoline export markets are shrinking, US already balanced/exports.
OECD Europe demand barrel OECD Europe refinery yields
Other products
Fuel oil
Light distillates
Ethane/LPG
Middle Distillates
30%
4%
10%
8%
48%
Middle Distillates

© OECD/IEA 2012 © OECD/IEA 2016
Diesel deluge
• For every barrel of European import requirement: 2-3 barrels competing as Europe remains the primary target.
• Russian switch to 10 ppm over last few years – big blow to European cracks.
• New Middle East volumes – full impact not seen yet, more pressure in summer.
Regional diesel balances (2015), kb/d
Middle East values show
export-oriented output
+900
+1200 -900
+300
+200

© OECD/IEA 2012 © OECD/IEA 2016
Echoes of 2009
• High imports, high refinery runs, warm winter = record seasonal stock builds in Europe in Q4.
• Floating storage reported, Asian cargoes taking longer routes.
• ULSD 10 ppm NWE barges cracks at historical lows.
Diesel stocks in OECD Europe ULSD 10 ppm cracks, NWE
200
220
240
260
280
300
320
340
Jan Feb Mar Apr May Jun Jul Aug Sep Oct Nov Dec
Th
ou
san
ds
Range 2005-14 2010 2015 2016
5
10
15
20
25
30
Jan Feb Mar Apr May Jun Jul Aug Sep Oct Nov Dec
2010-2014 range 2014 2015 2016

© OECD/IEA 2012 © OECD/IEA 2016
Diesel has become irrelevant?
• Diesel cracks are so low,
• And gasoline cracks are so high..
• That were diesel to go to parity with crude, complex margins in NWE and USGC would still be positive..
-5.0
-2.5
0.0
2.5
5.0
7.5
10.0
12.5
15.0
17.5
Dec 14 Mar 15 Jun 15 Sep 15 Dec 15 Mar 16
$/bbl Regional cracking margins
Singapore NWE USGC
-5.0
-2.5
0.0
2.5
5.0
7.5
10.0
12.5
15.0
17.5
Dec 14 Mar 15 Jun 15 Sep 15 Dec 15 Mar 16
$/bbl Regional cracking margins with diesel cracks at zero
Singapore NWE USGC

© OECD/IEA 2012 © OECD/IEA 2016
Less reliance on heating oil
• Oil used to account for a quarter of heating demand in Europe
• Oil’s share down to 15-17%. Also, total energy used for heating is down (efficiency measures).
• A loss of 450 kb/d of middle distillates demand.
0%
20%
40%
60%
80%
100%
2003 2004 2005 2006 2007 2008 2009 2010 2011 2012 2013 2014 2015
Fuel mix of heating demand in Europe
Oil Coal Gas Electricity Heat Bioenergy
© OECD/IEA 2012 © OECD/IEA 2016
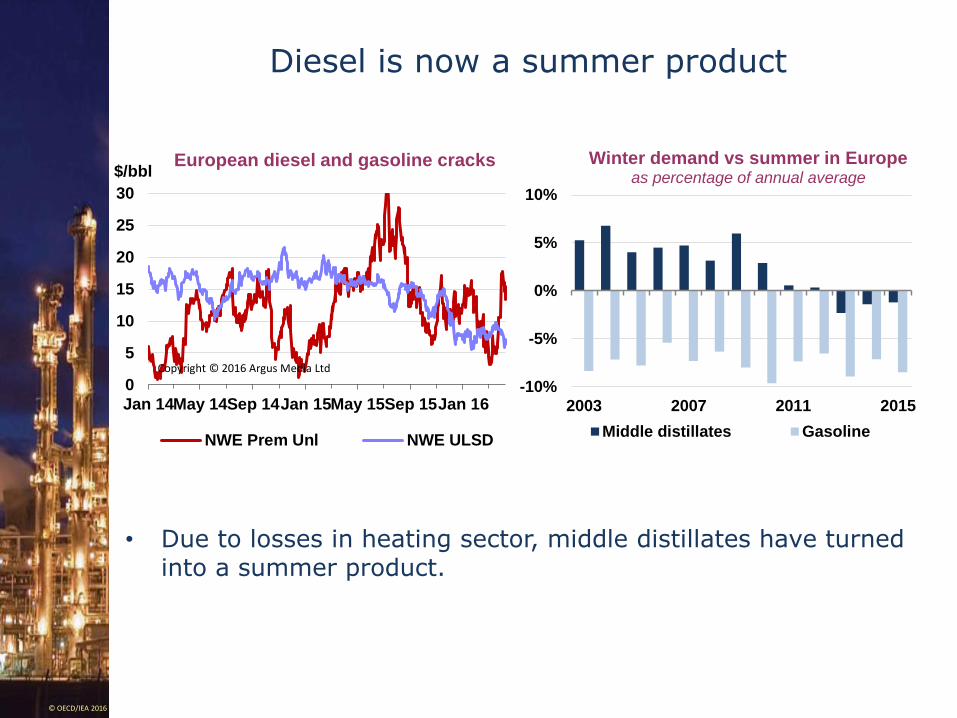
Diesel is now a summer product
• Due to losses in heating sector, middle distillates have turned into a summer product.
-10%
-5%
0%
5%
10%
2003 2007 2011 2015
Winter demand vs summer in Europeas percentage of annual average
Middle distillates Gasoline
0
5
10
15
20
25
30
Jan 14May 14Sep 14Jan 15May 15Sep 15Jan 16
$/bblEuropean diesel and gasoline cracks
NWE Prem Unl NWE ULSD
Copyright © 2016 Argus Media Ltd
SS

© OECD/IEA 2012 © OECD/IEA 2016
Gasoline performance – disappearing act?
• Impressive performance of gasoline cracks last year.
• US net exporter now but East Coast still dependant on Europe.
• Atlantic Basin turned net long gasoline last year, surplus will grow rapidly as demand for refinery gasoline stagnates.
• By 2021, Europe’s net length will be double the net short of Atlantic basin importers.
NWE gasoline cracks Atlantic basin gasoline balance, mb/d
-0.3
-0.2
-0.1
0
0.1
0.2
0.3
0.4
0.5
0.6
0.7
2012 2014 2016 2018 2020
mb/d
0
5
10
15
20
25
30
Apr Jul Oct Jan
$/b
2012-2013 2013-2014 2014-20152015-2016 2016-2017

© OECD/IEA 2012 © OECD/IEA 2016
More rationalisation yet to come
• By 2021, half of Europe’s gasoline length will have no market in the Atlantic basin.
• Middle distillates imports expected to grow by 600 kbd.
• If dieselisation is reversed, and lost gasoline volumes come back – European diesel/gasoline balances will improve.
2015-2021 changes
0
0.1
0.2
0.3
0.4
0.5
0.6
0.7
0.8
Atlantic basine
gasoline length
growth
Europe mid
distillates imports
increase
Europe's lost
gasoline demand
since 2009
mb/d
0
0.1
0.2
0.3
0.4
0.5
0.6
0.7
0.8
Atlantic basine
gasoline length
growth
Europe mid
distillates imports
increase
Europe's lost
gasoline demand
since 2009
Atlantic basin
gasoline growth
adj
Europe mid
distillates imports
increase adj
mb/d

© OECD/IEA 2012 © OECD/IEA 2016
More rationalisation to come
• Since 2008 Europe closed 2 mb/d of capacity.
• In historical terms, this is not much – 7 mb/d was shut in 1970s-80s.
• Oil price recovery will be mostly supply driven (as Non-OPEC output adjusts) - negative implications for margins.
European refining capacity, demand and crude output
5
10
15
20
25
1962 1972 1981 1991 2001 2011 2021
mb
/d
Refinery capacity Total demand Crude oil output
© OECD/IEA 2012 © OECD/IEA 2016
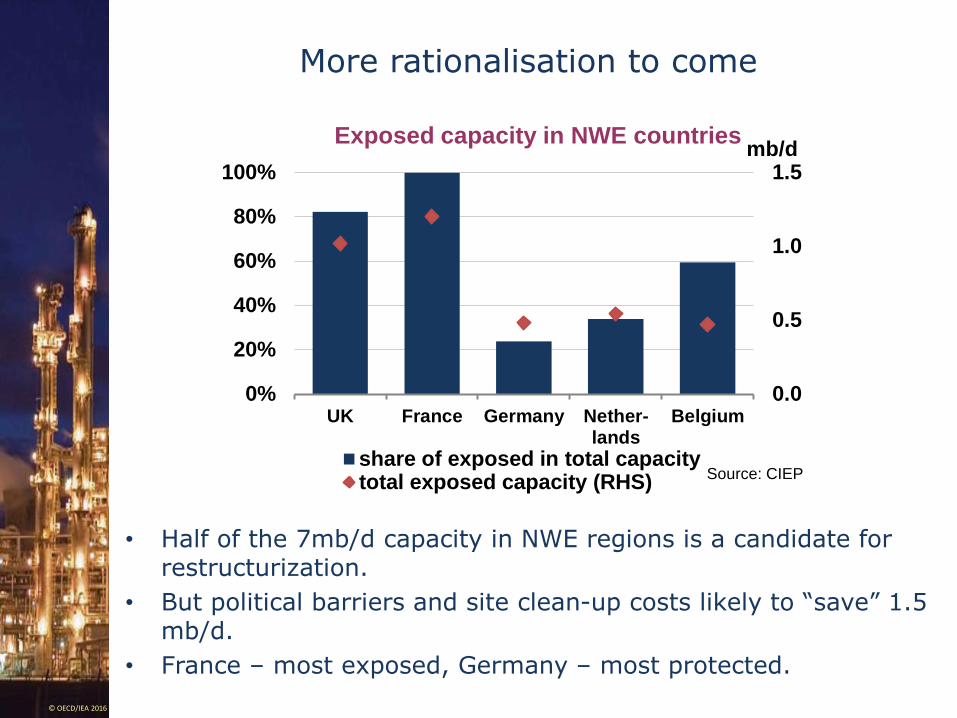
More rationalisation to come
• Half of the 7mb/d capacity in NWE regions is a candidate for restructurization.
• But political barriers and site clean-up costs likely to “save” 1.5 mb/d.
• France – most exposed, Germany – most protected.
0.0
0.5
1.0
1.5
0%
20%
40%
60%
80%
100%
UK France Germany Nether-lands
Belgium
mb/dExposed capacity in NWE countries
share of exposed in total capacitytotal exposed capacity (RHS)
Source: CIEP