A Performance-Based Incentive Program for Asphalt...
36
Draft Draft A Performance-Based Incentive Program for Asphalt Pavement Nebraska Department of Roads Research Project SPR-1 (07) By Satya Sai Ranga, Peruri Graduate Committee Wayne Jensen, Ph.D., P.E. Bruce Fischer, AIA Timothy Wentz, P.E.
Transcript of A Performance-Based Incentive Program for Asphalt...

Draft
Draft
A Performance-Based Incentive Program for Asphalt Pavement
Nebraska Department of Roads Research Project SPR-1 (07)
By
Satya Sai Ranga, Peruri
Graduate Committee
Wayne Jensen, Ph.D., P.E. Bruce Fischer, AIA
Timothy Wentz, P.E.
Draft
Draft i
Table of Contents Chapter One. Introduction..………………………………………………………….1
Chapter Two. Information Search ………………………………………………….2
How Does the NDOR Measure Pavement Quality?.................................3
Current NDOR Construction Incentives/Disincentives…………………….4
The NDOR’s Incentive Program for Superpave Asphaltic
Concrete………………………………………..................................9
Other Agency’s Construction Incentives/Disincentives…..………………11
Management of Long-Term Pavement Performance through
Warranties………..………………..…………………………….……15
Other Initiatives Toward Management of Long-Term Pavement
Performance….……………………................................................19
Chapter Three. Analysis…………………………..……………………..................21
Proposed Pavement Performance Incentive Program……………...…….21
NDOR Suggested Modifications……………………………………...……..23
Analysis of Three Projects Where Materials and Workmanship
Incentives Were Paid………………………….……………….….…25
Chapter Four. Results……………………………………………………….………27
Chapter Five. Conclusions and Recommendations……………………………..29
References…………………………………………………………………………….30

Draft
Draft ii
List of Tables Table 1 The NDOR’s Payment Adjustment Schedule for Asphalt
Pavement Smoothness………………………………………...5
Table 2 The NDOR’s Pay Factors for Asphalt Materials……………...…..….6
Table 3 The NDOR’s Applicable Properties for Asphalt Pavement…………7
Table 4 The NDOR’s Schedule for Acceptance - Density of Compacted
Asphaltic Concrete (First Lot)……………..........…………..…8
Table 5 The NDOR’s Schedule for Acceptance - Density of Compacted
Asphaltic Concrete (Subsequent Lots)………………....…….8
Table 6 The NDOR’s Production Tolerances..………………………..……….9
Table 7 The NDOR’s Schedule for Acceptance - Asphaltic Concrete
Air Voids………………………………………………………...10
Table 8 Kansas Schedule for Adjusted Payments – Flexible
Pavements……………………………………………………...15
Table 9 Indiana DOT Pavement Performance Thresholds for a
Five Year Warranty Specification…………………..………..17
Table 10 Initial Performance- Based Incentives Proposed for
Asphalt Pavement……………………………………...……..22
Table 11 Projects Where Construction Incentives Were Paid
by the NDOR..………………………………………………....26
Table 12 Analysis of Pavement Performance Over Three Years………...…27
Table 13 Proposed NDOR Performance Incentive(s) for
Asphalt Pavement Construction…..………………………....28
Table 14 Application of Performance Incentives to Three Projects…..……..28

Draft
Draft iii
List of Figures
Figure 1 Smoothness of New Pavement Constructed in
Kansas 1990-2002…………………………………………………….14
Figure 2 Use of Pavement Warranties in the United States…………………16

Draft
Draft iv
Acknowledgements
This study was funded by the Nebraska Department of Roads under a
research project titled SPR-1(07) “Performance Incentive Program”. The project
was completed under the direction of Dr. Wayne Jensen, in cooperation with
Bruce Fischer, AIA and Tim Wentz, P.E., all with University of Nebraska-Lincoln.
Satya Sai Ranga Peruri, who is currently completing a Master of Engineering in
Construction Degree, was instrumental in completing this research.
The authors wish to thank Curt Oerter with Werner Construction, Sam
Olson and Robert Rea from Dobson Brothers Construction and Tom Crockett
with Hawkins Construction for their insights and comments concerning the first
draft of pavement performance incentive proposal. David Medinger, with the
NDOR Materials and Research Division, provided the pavement performance
data that was used for the final analysis. Many other individuals from the
NDOR’s Materials and Research Division also made significant contributions to
our efforts.

Draft
Draft 1
Introduction:
The current procurement system for asphalt pavement used by the
Nebraska Department of Roads (NDOR) is competitive sealed proposal with the
contract awarded to the lowest bidder. Cost control continues to play a
fundamental role throughout the pavement construction process. The contractor
purchases materials from a supplier, who is also often the lowest bidder. As
paving materials move through the contractor’s equipment, binder and aggregate
are tested by the contractor, by NDOR personnel and/or by independent quality
control (QC) technicians. Deficiencies in material quality or workmanship result
in monetary penalties against the contractor. The contractor assesses penalties
against the material supplier when material deficiencies are the cause of
penalties.
NDOR currently has in-place a system of incentives to reimburse
contractors for pavement quality based upon indices measured at completion of
construction. For asphalt pavement, problems resulting from materials or
construction techniques used often do not become apparent until one to three
years after construction has been completed. The system currently used by the
NDOR lacks incentives to encourage use of materials or construction techniques
which might significantly improve the long-term performance of asphalt
pavement.
This research project investigated the advantages of creating a system of
incentives to reward contractors for producing asphalt pavement with good long-
term (one to three years) performance characteristics. It evaluated several
pavement performance indices to determine which were most reflective of long-
term asphalt pavement performance and examined the concept of awarding
specific monetary incentives to pavement contractors based upon levels of
performance indices at various points during pavement lifespan.
This research project also analyzed various existing and experimental
incentive programs, with the objective of developing one or more performance-
based incentives which the NDOR could use for asphalt pavement construction

Draft
Draft 2
in the State of Nebraska. Since the NDOR already has an incentive system
keyed to specific indices measured immediately after completion of construction,
the proposed incentive program is based upon indices measured later in
pavement life. Various performance indices (International Roughness Index,
rutting, cracking, etc.) measured annually by the NDOR were evaluated for their
potential to serve as indicators of pavement quality one to three years after
construction.
The performance incentive system proposed allows contractors to receive full
contract payment for pavement built to construction specifications. The system
subsequently provides an additional monetary incentive at a specified interval to
contractors who produce pavement that continues to meet or exceed established
performance standards.
Information Search:
Performance measures consist of assessment data that strongly, directly,
or quantitatively reflect the degree to which specific results meet the needs and
expectations of the customer. These measures are often compared to goals or
benchmarks, so remedial actions can be initiated when benchmarks are not
being met. Performance indicators, on the other hand, are data that suggest
general alignment of results with customer goals. Indicators are typically direct or
surrogate measures for the actual performance characteristics of interest.
Indicators can be useful in identifying trends in overall performance, as well as
for actual comparison to a desired goal. Performance measures can be
aggregated from local to state to regional to national levels. Some performance
measures even allow an agency to be compared with other agencies (e.g., if a
measure based on dollars is used). (Richter 2004)
Draft
Draft 3
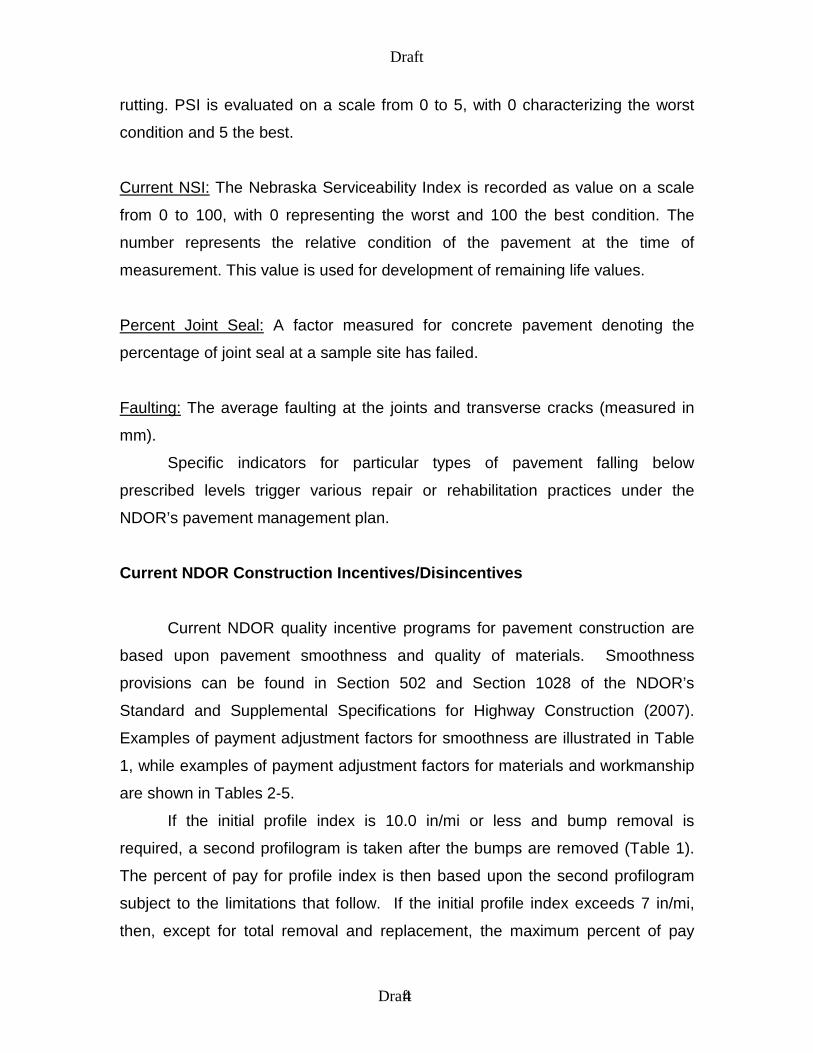
How Does the NDOR Measure Pavement Quality?
The NDOR measures quality of asphalt pavement by the use of materials and
methods specifications, the use of quality assurance specifications and through
NDOR evaluations of quality at the completion of construction. Quality of asphalt
pavement is not measured by NDOR through performance related specifications
or warranties (Office of Program Administration 2006).
The NDOR conducts almost continuous assessment of quality throughout
the lifetime of a pavement. Numerous indicators are measured and recorded
annually for each road segment throughout the network. The NDOR’s
Supplemental and Standard Specifications for Highway Construction (2007) lists
various pavement performance indicators to include:
Roughness, IRI: The roughness or IRI, the International Roughness Index, is a
measure of pavement smoothness. It is measured in mm/m.
Cracking Index: This is a rating value expressed as a percentage, which is used
to quantify the amount of cracking based on the severity and extent noted during
the visual inspection.
Transverse Cracking: The transverse/thermal-cracking index is expressed as an
index on a scale of 0 to 100, with 0 being the best condition and 100 the worst.
The index reflects the severity and extent of transverse cracking on a bituminous
pavement.
Rutting: The average rut depth of both wheel paths measured with Nebraska’s
profiler in mm. Rutting is measured only on bituminous pavements.
PSI: The Present Serviceability Index or PSI. This is a numerical value indicating
the ride quality of the pavement. PSI is a function of roughness IRI, cracking, and
Draft
Draft 4
rutting. PSI is evaluated on a scale from 0 to 5, with 0 characterizing the worst
condition and 5 the best.
Current NSI: The Nebraska Serviceability Index is recorded as value on a scale
from 0 to 100, with 0 representing the worst and 100 the best condition. The
number represents the relative condition of the pavement at the time of
measurement. This value is used for development of remaining life values.
Percent Joint Seal: A factor measured for concrete pavement denoting the
percentage of joint seal at a sample site has failed.
Faulting: The average faulting at the joints and transverse cracks (measured in
mm).
Specific indicators for particular types of pavement falling below
prescribed levels trigger various repair or rehabilitation practices under the
NDOR’s pavement management plan.
Current NDOR Construction Incentives/Disincentives
Current NDOR quality incentive programs for pavement construction are
based upon pavement smoothness and quality of materials. Smoothness
provisions can be found in Section 502 and Section 1028 of the NDOR’s
Standard and Supplemental Specifications for Highway Construction (2007).
Examples of payment adjustment factors for smoothness are illustrated in Table
1, while examples of payment adjustment factors for materials and workmanship
are shown in Tables 2-5.
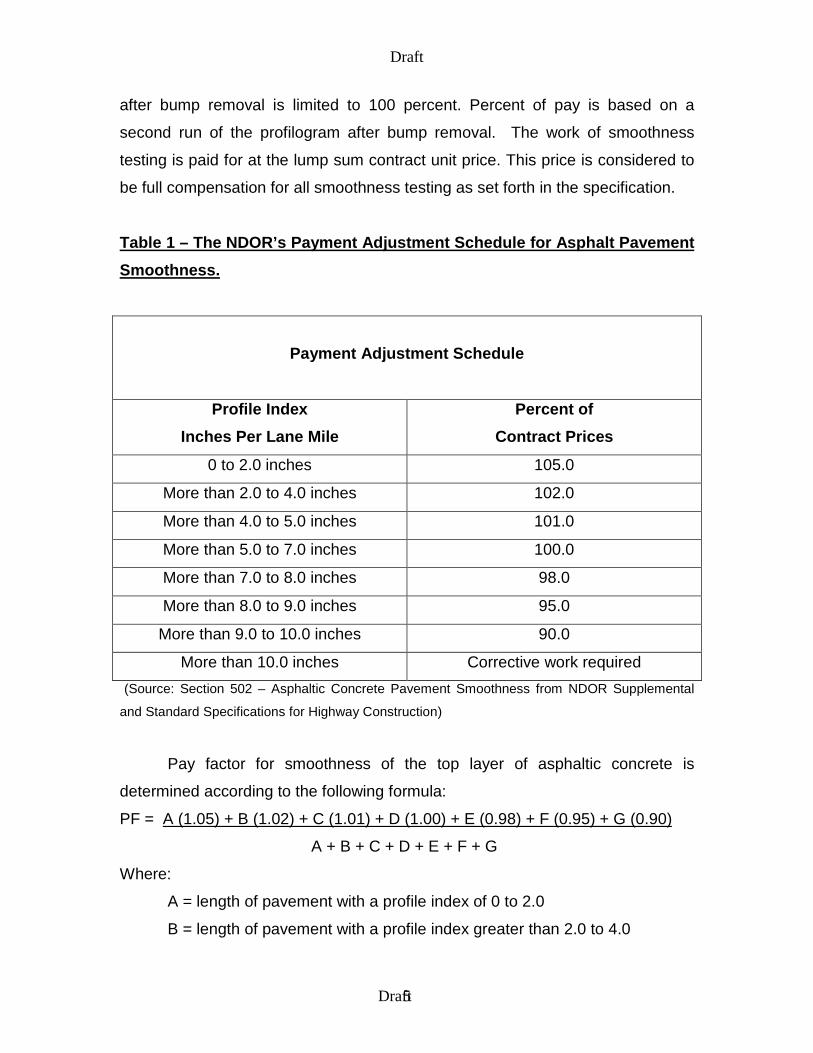
If the initial profile index is 10.0 in/mi or less and bump removal is
required, a second profilogram is taken after the bumps are removed (Table 1).
The percent of pay for profile index is then based upon the second profilogram
subject to the limitations that follow. If the initial profile index exceeds 7 in/mi,
then, except for total removal and replacement, the maximum percent of pay
Draft
Draft 5
after bump removal is limited to 100 percent. Percent of pay is based on a
second run of the profilogram after bump removal. The work of smoothness
testing is paid for at the lump sum contract unit price. This price is considered to
be full compensation for all smoothness testing as set forth in the specification.
Table 1 – The NDOR’s Payment Adjustment Schedule for Asphalt Pavement Smoothness.
Payment Adjustment Schedule
Profile Index Inches Per Lane Mile
Percent of Contract Prices
0 to 2.0 inches 105.0
More than 2.0 to 4.0 inches 102.0
More than 4.0 to 5.0 inches 101.0
More than 5.0 to 7.0 inches 100.0
More than 7.0 to 8.0 inches 98.0
More than 8.0 to 9.0 inches 95.0
More than 9.0 to 10.0 inches 90.0
More than 10.0 inches Corrective work required (Source: Section 502 – Asphaltic Concrete Pavement Smoothness from NDOR Supplemental
and Standard Specifications for Highway Construction)
Pay factor for smoothness of the top layer of asphaltic concrete is
determined according to the following formula:
PF = A (1.05) + B (1.02) + C (1.01) + D (1.00) + E (0.98) + F (0.95) + G (0.90)
A + B + C + D + E + F + G
Where:
A = length of pavement with a profile index of 0 to 2.0
B = length of pavement with a profile index greater than 2.0 to 4.0
Draft
Draft 6
C = length of pavement with a profile index greater than 4.0 to 5.0
D = length of pavement with a profile index greater than 5.0 to 7.0
E = length of pavement with a profile index greater than 7.0 to 8.0
F = length of pavement with a profile index greater than 8.0 to 9.0
G = length of pavement with a profile index greater than 9.0 to 10.0
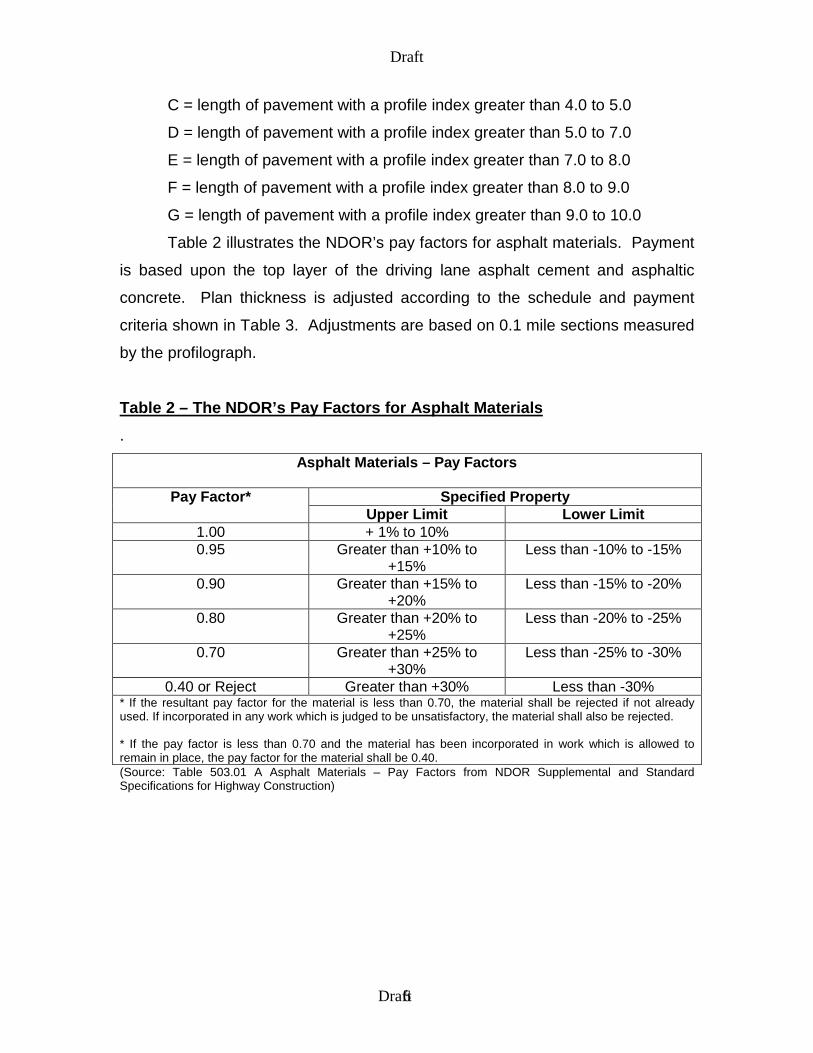
Table 2 illustrates the NDOR’s pay factors for asphalt materials. Payment
is based upon the top layer of the driving lane asphalt cement and asphaltic
concrete. Plan thickness is adjusted according to the schedule and payment
criteria shown in Table 3. Adjustments are based on 0.1 mile sections measured
by the profilograph.
Table 2 – The NDOR’s Pay Factors for Asphalt Materials .
Asphalt Materials – Pay Factors
Pay Factor* Specified Property Upper Limit Lower Limit
1.00 + 1% to 10% 0.95 Greater than +10% to
+15% Less than -10% to -15%
0.90 Greater than +15% to +20%
Less than -15% to -20%
0.80 Greater than +20% to +25%
Less than -20% to -25%
0.70 Greater than +25% to +30%
Less than -25% to -30%
0.40 or Reject Greater than +30% Less than -30% * If the resultant pay factor for the material is less than 0.70, the material shall be rejected if not already used. If incorporated in any work which is judged to be unsatisfactory, the material shall also be rejected. * If the pay factor is less than 0.70 and the material has been incorporated in work which is allowed to remain in place, the pay factor for the material shall be 0.40. (Source: Table 503.01 A Asphalt Materials – Pay Factors from NDOR Supplemental and Standard Specifications for Highway Construction)

Draft
Draft 7
Table 3 – The NDOR’s Applicable Properties for Asphalt Pavement
Applicable Properties
Asphalt Cement
Asphaltic Oil Emulsified Asphalt
Property Viscosity Grade
Penetration Grade
Original Material
Distillation Residue
Original Material
Distillation Residue
Viscosity
X¹ X X³ X
Penetration
X X¹ X X²
Distillation to 435°F
X
Distillation to 500°F
X
Distillation to 600°F
X
Percent Residue
X X
Float Test
X
Absolute Viscosity
X
Softening Point
X
¹ Original material and thin film residue. ² Penalties cannot be based on tests made on Residue by Evaporation. ³ No penalties will be assessed if more than 1 day has elapsed between the sampling and the testing of the material.
(Source: Table 503.01B Applicable Properties from NDOR Supplemental and Standard Specifications for Highway Construction)
Tables 4 and 5 illustrate specific NDOR material pay factors which can serves as
incentives or disincentives. Pay factors based upon density are an attempt to
measure quality of both materials and workmanship.

Draft
Draft 8
Table 4 – The NDOR’s Schedule for Acceptance - Density of Compacted Asphaltic Concrete (First Lot) (Source: Table 1028.21 Acceptance Schedule Density of Compacted Asphaltic Concrete (First Lot) from NDOR Supplemental and Standard Specifications for Highway Construction) Table 5 – The NDOR’s Schedule for Acceptance - Density of Compacted Asphaltic Concrete (Subsequent Lots)
Acceptance Schedule Density of Compacted Asphaltic Concrete (Subsequent Lot)
Average Density (5 Samples, Percent of Voidless Density)
Pay Factor
Greater than 92.4 1.00 Greater than 91.9 to 92.4 0.95 Greater than 91.4 to 91.9 0.90 Greater than 90.9 to 91.4 0.85 Greater than 90.4 to 90.9 0.80 Greater than 89.9 to 90.4 0.70 89.9 or Less 0.40 or Reject
(Source: Table 1028.22 Acceptance Schedule Density of Compacted Asphaltic Concrete (Subsequent Lot) from NDOR Supplemental and Standard Specifications for Highway Construction)
Acceptance Schedule Density of Compacted Asphaltic Concrete (First Lot)
Average Density (5 Samples, Percent of Voidless Density)
Pay Factor
Greater than 90.0 1.00 Greater than 89.5 to 90.0 0.95 Greater than 89.0 to 89.5 0.70 89.0 or Less 0.40 or Reject
Draft
Draft 9
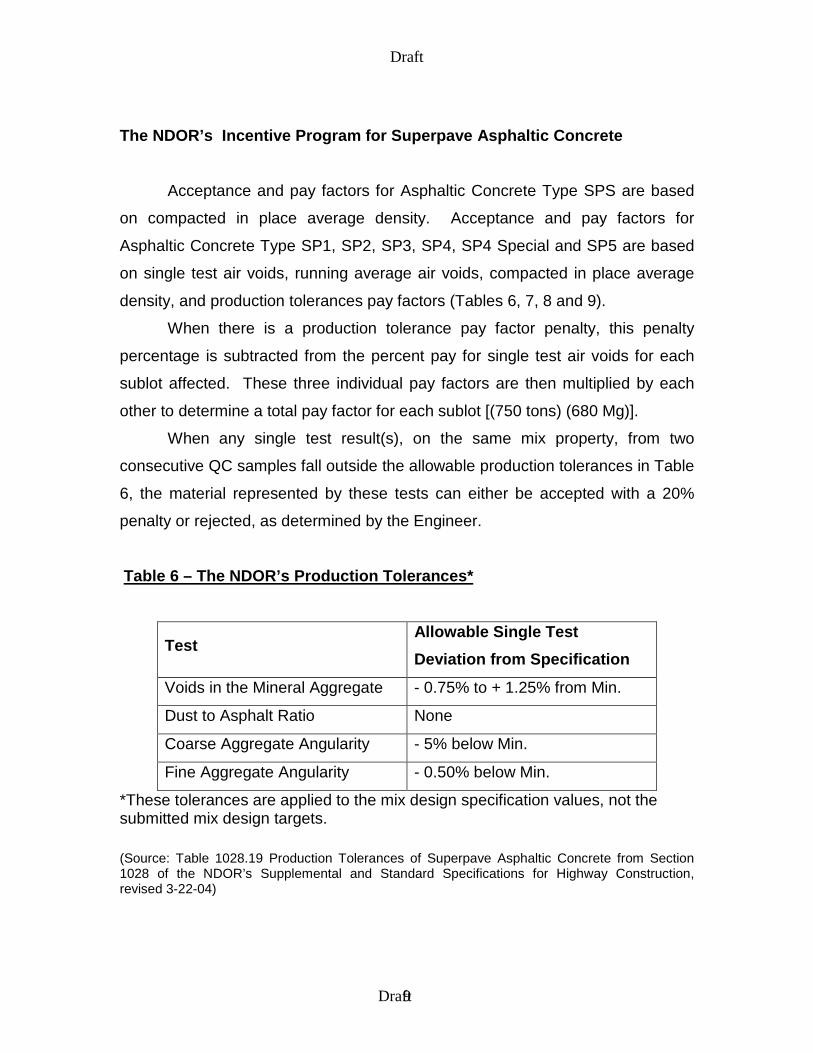
The NDOR’s Incentive Program for Superpave Asphaltic Concrete Acceptance and pay factors for Asphaltic Concrete Type SPS are based
on compacted in place average density. Acceptance and pay factors for
Asphaltic Concrete Type SP1, SP2, SP3, SP4, SP4 Special and SP5 are based
on single test air voids, running average air voids, compacted in place average
density, and production tolerances pay factors (Tables 6, 7, 8 and 9).
When there is a production tolerance pay factor penalty, this penalty
percentage is subtracted from the percent pay for single test air voids for each
sublot affected. These three individual pay factors are then multiplied by each
other to determine a total pay factor for each sublot [(750 tons) (680 Mg)].
When any single test result(s), on the same mix property, from two
consecutive QC samples fall outside the allowable production tolerances in Table
6, the material represented by these tests can either be accepted with a 20%
penalty or rejected, as determined by the Engineer.
Table 6 – The NDOR’s Production Tolerances*
Test Allowable Single Test Deviation from Specification
Voids in the Mineral Aggregate - 0.75% to + 1.25% from Min.
Dust to Asphalt Ratio None
Coarse Aggregate Angularity - 5% below Min.
Fine Aggregate Angularity - 0.50% below Min.
*These tolerances are applied to the mix design specification values, not the submitted mix design targets.
(Source: Table 1028.19 Production Tolerances of Superpave Asphaltic Concrete from Section 1028 of the NDOR’s Supplemental and Standard Specifications for Highway Construction, revised 3-22-04)

Draft
Draft 10
Table 7 – The NDOR’s Schedule for Acceptance - Asphaltic Concrete Air Voids
Acceptance Schedule Air Voids - Ndes
Air voids test results Moving average of
four Single test
Less than 1.5% Reject Reject 1.5% to less than 2.0% Reject 50% 2.0% to less than 2.5% 50% or Reject 95% 2.5% to less than 3.0% 90% 95% 3.0% to less than 3.5% 100% 100% 3.5% to 4.5% 102% 104% Over 4.5% to 5.0% 100% 100% Over 5.0% to 5.5% 95% 95% Over 5.5% to 6.0% 90% 95% Over 6.0% to 6.5% 50% or Reject 90% Over 6.5% to 7.0% Reject 50% Over 7.0% Reject Reject
(Source: Table 1028.20 Acceptance Schedule Air Voids - Ndes of Superpave Asphaltic Concrete from section 1028 of the NDOR’s Supplemental and Standard Specifications for Highway Construction, revised 3-22-04)

Draft
Draft 11
Other Agency’s Construction Incentives/Disincentives
Although many proposed roles for performance standards go well beyond
current highway construction practices, performance standards for highway
construction are nothing new. Because pavement smoothness is widely
recognized as important from a standpoint of both user satisfaction (no one likes
to drive on a rough road) and long-term performance (smooth roads last longer
and are often of higher overall quality than rough roads), performance standards
for pavement smoothness have seen widespread use. Most highway agencies
use smoothness specifications of one form or another. These specifications
establish target values for smoothness measured using standard engineering
test methods that are related to user perceptions. Many agencies include
incentives and/or disincentives to encourage achievement of the high levels of
smoothness that result in reduced operating costs for highway users and
reduced maintenance costs for the owner agencies. Current performance
standards for smoothness and the results obtained from specifying performance
standards are illustrated by examples from Arizona, Virginia, and Kansas
(Richter 2004).
Arizona
For new construction, Arizona has established a target International
Roughness Index (IRI) value of 41, with smoothness expressed in inches per
mile. Incentives are earned for values below 38, and disincentives are assessed
for values in excess of 48. For rehabilitation projects, the target, incentive, and
disincentive values vary as a function of highway type, the nature of the work to
be performed, and (in some cases) the smoothness of the existing pavement.
Target smoothness is 39 to 68, while the thresholds for incentives vary from 37 to
66 (target value minus 2) and the threshold for disincentives varies from 49 to 78
(target value plus 10).
Draft
Draft 12
Removal and replacement (as opposed to other corrective actions) is
required for smoothness values that exceed the target plus 45. In general,
typical pavement smoothness incentives paid by the Arizona DOT average
approximately $7,500 per lane mile or approximately $1.00 per square yard.
Average contractors in Arizona produce IRI smoothness values in the mid
thirties. Some very good contractors consistently achieve IRI smoothness values
in the low thirties, with substantial areas often in the twenties (Richter 2004).
Virginia
Virginia has smoothness provisions for new construction and maintenance
resurfacing, with smoothness expressed as IRI in inches per mile. For new
construction, 100 percent payment is awarded for an IRI between 55 and 70
inches/ mile. Bonus payments are earned for achieving IRI values less than 55
inches/mile, and penalties are incurred for IRI values greater than 70 inches/mile,
to a maximum of zero payment at IRI values greater than 160 inches/mile.
Corrective action is required when the average IRI for a section exceeds 100
inches/mile (Richter 2004).
For maintenance resurfacing, a maximum 10 percent bonus based on the
asphaltic concrete (AC) surface cost is possible for interstate highway sections
with an IRI less than 45 inches/mile and for non-interstate roads with an IRI less
than 55 inches/mile. Additionally, full payment is reserved for interstates with IRI
from 55 to 70 inches/mile, while non-interstates must have an IRI between 65
and 80 inches/mile for full payment (Richter 2004).
Unlike new construction projects, most resurfacing projects are tested
prior to and after paving. These projects can be either a straight overlay or a mill-
and-replace. Before-and-after testing is used to determine the amount of
improvement in ride quality. If the contractor is able to improve the quality by
more than thirty percent, the contractor is guaranteed full payment for
smoothness.
For new construction, the contractor can receive an incentive of up to five
percent based on IRI results. The amount of the incentive is based the total
Draft
Draft 13
quantity of all asphaltic concrete used. Maintenance resurfacing contracts allow
up to a ten percent bonus. This amount is based on the cost of surface layers
only. (Richter 2004)
Virginia has been actively using a ride special provision since the late
1990s. Most of the ride data have been collected on maintenance resurfacing
projects. With more than 150 projects in 2002, the average IRI on interstates was
60 inches/mile. For non-interstate routes, the average was 67 inches/mile on
U.S. routes and 74 inches/mile on State routes. Over the last six years, the
average IRI on the interstates has stabilized while ride quality on non-interstate
routes continues to improve (Richter 2004). Analysis of the 2003 ride quality is
currently being conducted.
In addition to improved ride quality, Virginia has seen other benefits
through use of performance based provisions. During the mix-design process,
contractors have developed mixes that better balance mix production costs and
level of construction effort to achieve good quality field placement. These mixes
result in better ride, better density, less tendency to segregate, less permeability,
and more liquid asphalt for durability. When the ride special provision is applied
on a project, more attention to detail is required throughout the paving process.
Use of a materials transfer vehicle, continuous feed of material, no stopping of
the paver, and proper rolling techniques are examples of techniques employed to
improve ride quality. The use of the ride special provision provides monetary
incentives to the contractor and longer lasting pavements for the taxpayer
(Richter 2004).
Kansas
With smoothness expressed as profile index in millimeters/kilometer
(mm/km), Kansas specifications, in general, require an average profile index of
475 mm/km or less per 0.1 km section as measured with a California-type
profilograph. (Richter 2004). An exception is made for ramps and acceleration
and deceleration lanes. A profile index of 630 mm/km or less is required at these
locations. In addition, PCC pavement areas within each section having high
Draft
Draft 14
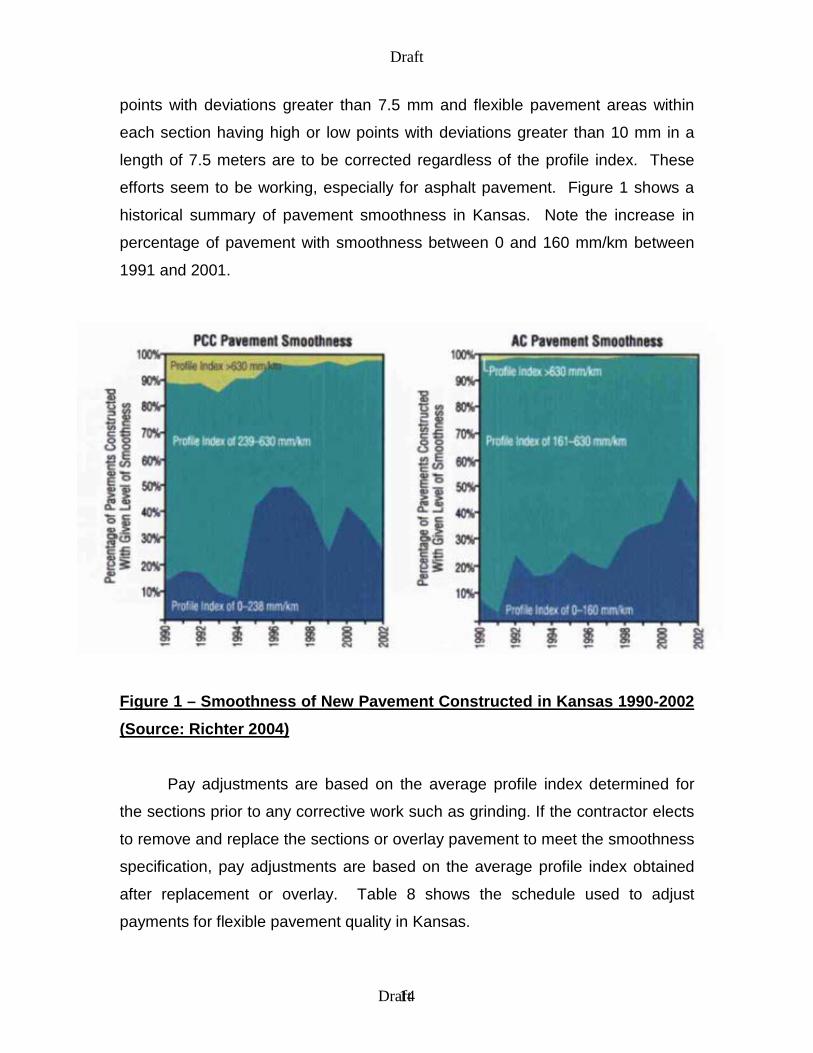
points with deviations greater than 7.5 mm and flexible pavement areas within
each section having high or low points with deviations greater than 10 mm in a
length of 7.5 meters are to be corrected regardless of the profile index. These
efforts seem to be working, especially for asphalt pavement. Figure 1 shows a
historical summary of pavement smoothness in Kansas. Note the increase in
percentage of pavement with smoothness between 0 and 160 mm/km between
1991 and 2001.
Figure 1 – Smoothness of New Pavement Constructed in Kansas 1990-2002 (Source: Richter 2004)
Pay adjustments are based on the average profile index determined for
the sections prior to any corrective work such as grinding. If the contractor elects
to remove and replace the sections or overlay pavement to meet the smoothness
specification, pay adjustments are based on the average profile index obtained
after replacement or overlay. Table 8 shows the schedule used to adjust
payments for flexible pavement quality in Kansas.

Draft
Draft 15
Table 8 – Kansas Schedule for Adjusted Payments – Flexible Pavements
Average Profile Index (mm/km per lane per 0.1 km section)
Contract Price Adjustment (per 0.1 km section per lane)
110 or less +$100.00 111 to 160 +$50.00 161 to 475 0.00* 476 to 630 0.00*
(Source: Richter 2004)
* Correct to 475 mm/km (630 mm/km for ramps, acceleration and deceleration lanes)
Although some fluctuation has occurred from year to year, Kansas has
seen a substantial increase in the percentage of pavements built with high levels
of smoothness (0 to 240 mm/km for PCC pavements and 0 to 160 mm/km for
flexible pavements).
Management of Long-Term Pavement Performance through Warranties
Warranty specifications are one type of performance specification that has
received more attention in recent years. When using warranty specifications, a
transportation agency specifies pavement performance only and the contractor
warrants the performance of pavement over a specific amount of time. This
warranty period normally extends two to seven years for asphalt pavements,
although some warranties have been written for periods up to twenty years for
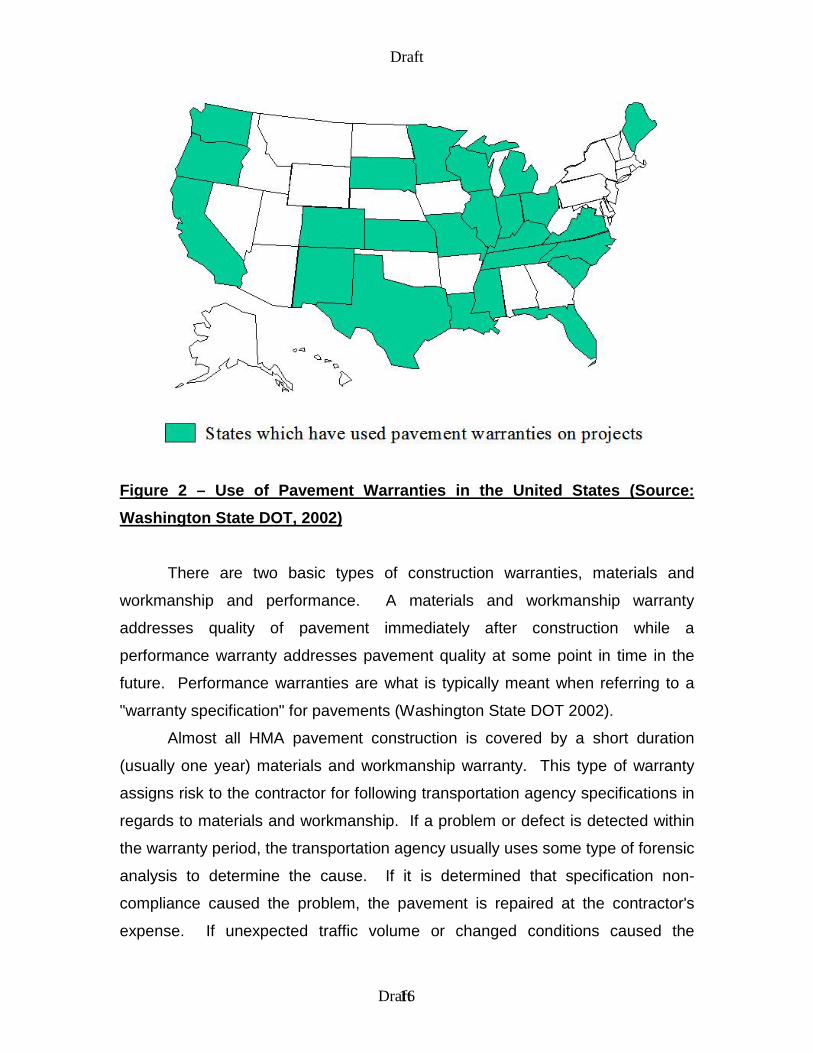
concrete pavement. During the warranty period, any defects attributable to
construction practices or materials are repaired at the contractor’s expense.
States that have used or are currently using pavement warranties are shown in
Figure 2.
Draft
Draft 16
Figure 2 – Use of Pavement Warranties in the United States (Source: Washington State DOT, 2002)
There are two basic types of construction warranties, materials and
workmanship and performance. A materials and workmanship warranty
addresses quality of pavement immediately after construction while a
performance warranty addresses pavement quality at some point in time in the
future. Performance warranties are what is typically meant when referring to a
"warranty specification" for pavements (Washington State DOT 2002).
Almost all HMA pavement construction is covered by a short duration
(usually one year) materials and workmanship warranty. This type of warranty
assigns risk to the contractor for following transportation agency specifications in
regards to materials and workmanship. If a problem or defect is detected within
the warranty period, the transportation agency usually uses some type of forensic
analysis to determine the cause. If it is determined that specification non-
compliance caused the problem, the pavement is repaired at the contractor's
expense. If unexpected traffic volume or changed conditions caused the
Draft
Draft 17
problem, the transportation agency assumes financial responsibility for the repair
costs. This type of warranty is almost universal, rarely collected on, and is
usually covered by sureties at no additional charge to the contractor.
A performance warranty assigns a longer portion of the pavement
performance risk to the contractor. During the warranty period, the transportation
agency continues to monitor pavement performance. Throughout the warranty
period, any performance below defined limits attributable to construction methods
or materials must be remedied at the contractor's expense. Because the
contractor assumes greater risk, he/she is allowed to control many to most
aspects of construction.
For specifying transportation agencies, warranties represent progress over
end-result specifications because warranties enumerate specific standards for
actual pavement performance rather than material characteristics that are only
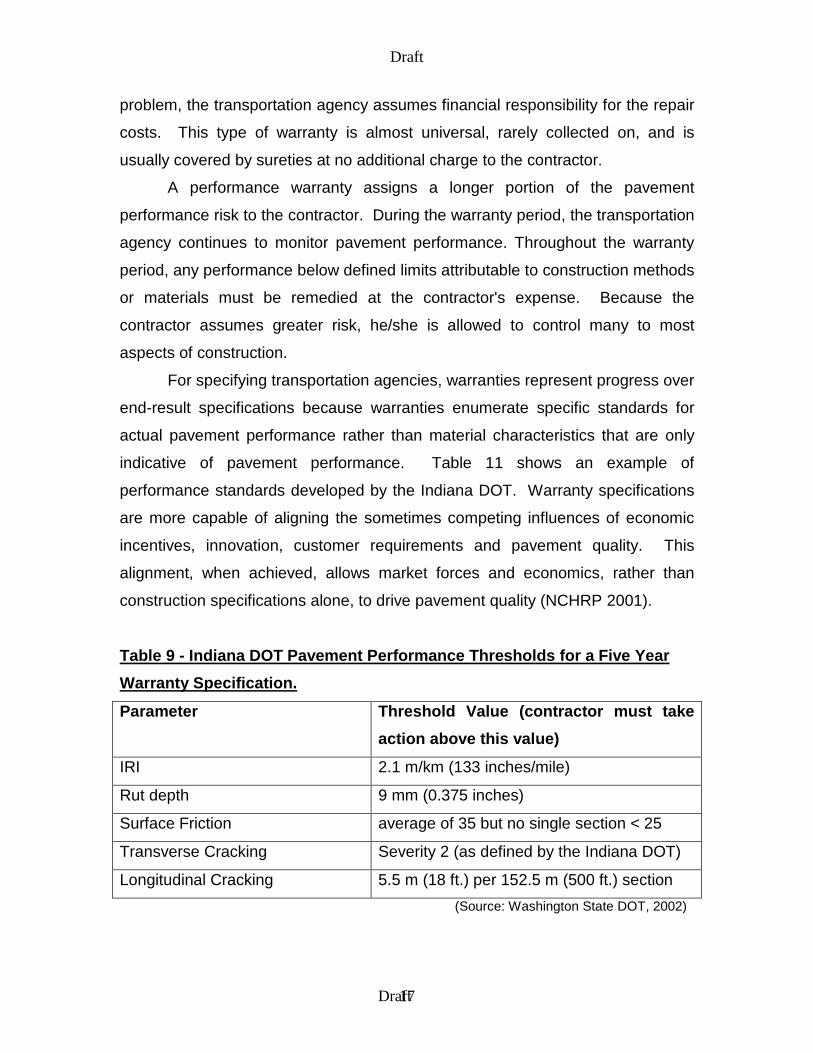
indicative of pavement performance. Table 11 shows an example of
performance standards developed by the Indiana DOT. Warranty specifications
are more capable of aligning the sometimes competing influences of economic
incentives, innovation, customer requirements and pavement quality. This
alignment, when achieved, allows market forces and economics, rather than
construction specifications alone, to drive pavement quality (NCHRP 2001).
Table 9 - Indiana DOT Pavement Performance Thresholds for a Five Year Warranty Specification.
Parameter Threshold Value (contractor must take action above this value)
IRI 2.1 m/km (133 inches/mile)
Rut depth 9 mm (0.375 inches)
Surface Friction average of 35 but no single section < 25
Transverse Cracking Severity 2 (as defined by the Indiana DOT)
Longitudinal Cracking 5.5 m (18 ft.) per 152.5 m (500 ft.) section (Source: Washington State DOT, 2002)
Draft
Draft 18
Although warranty specifications are being used in other countries, most
notably in Western Europe, they are used only sparingly in the United States for
several reasons. First, the U.S. paving industry has been very reluctant to
assume greater risk. Second, the Federal Government places certain legal
restrictions on warranty use. Third, performance testing needs further
development so methods are proven accurate and test results can be used to
legally invoke warranty clauses. Finally, the surety industry may have the largest
say in the extent to which performance based incentives will be adopted in the
United States. Contracting agencies usually limit their risk by requiring a
contractor be bonded. Bonding agencies may or may not be willing to accept
the risk associated with a two to seven year performance warranty. Sureties are
especially wary when contractors have little to no say in pavement design and no
control over post-construction pavement use (Washington State DOT 2002).
A few state highway agencies have used both asphalt concrete and
Portland cement concrete pavement warranties for many years. Under a
pavement-warranty specification, quality is measured by the actual performance
of the pavement as opposed to the properties of the pavement materials and
methods of construction. Pavement warranties require the construction
contractor to guarantee the post-construction performance of the pavement. The
shifting of post-construction performance risk from the state highway agency to
the contractor is perceived to reduce premature pavement failures, reduce costs,
and increase pavement quality. However, for most contractors to feel
comfortable with assuming the increased risk associated with a pavement
warranty, some type of monetary incentive must be provided (TRB 2005a).
Some states that use pavement warranties have reported a reduction in
costs and an improvement in quality, while others have not. For example, the
Wisconsin DOT has reported a significant quality increase and overall cost
reduction through the use of five year performance warranties for asphalt
concrete pavements (TRB 2005a). However, an evaluation of three year
workmanship and materials warranties completed by the Colorado DOT showed
no discernible impact on quality or cost (TRB 2005a).
Draft
Draft 19
Other Initiatives Toward Management of Long-Term Pavement Performance.
The Oregon Department of Transportation (ODOT) currently uses
Incentive/Disincentive (I/D) contracting on a project-by-project basis. Currently,
the selection process is proactive towards the needs of each project rather than a
standard procedure based on a set of established guidelines. ODOT is
attempting to develop a process to assist the selection of I/D contract methods
with associated values and timeframes based on guidelines or standards that
have been developed within the construction industry. With the continued
evolution of using both insourced and outsourced project delivery at ODOT, the
I/D process needs to be flexible, encompassing a wide range of problems and
issues associated with both preliminary engineering and construction
engineering. The implementation of such a process will require substantial
support and documentation. The information will need to be highly organized and
articulate the elements of cost, schedule, quality and public support associated
with a particular I/D clause (TRB 2004).
Washington State Department of Transportation (WSDOT) has used
various incentives in paving contracts for many years but reached no conclusion
as to whether incentives influence the quality or outcomes of a project. An
assessment of performance based contracting is currently examining the bidding
process, impacts on contractors and agency personnel and project outcomes.
This research will assist WSDOT in determining whether to increase or decrease
the use of performance incentives in WSDOT pavement contracts (TRB 2005b).
A research project is currently investigating the effectiveness of using
alternative contracting techniques on Florida Department of Transportation
(FDOT) construction projects. The research is comparing relevant performance
factors for traditional Design-Bid-Build projects with those of the following
alternative contracting techniques: A+B, Incentive/Disincentive, Design-Build, No-
Excuse Bonus, CM at Risk, and Lump Sum. The comparison will include the
overall delivery from concept to completion for each technique. The specific
Draft
Draft 20
performance measures to be considered are comparison of initial estimates,
contractors price proposal, final estimate, original contract time, final contract
time, project quality, overall value, and administrative costs. The desired
outcome of this research is a definitive statement on the applicability of
alternative contracting techniques on FDOT construction projects. Additionally,
the research is evaluating strategies intended to standardize the alternative
contracting techniques including, training opportunities (TRB 2006).
State departments of transportation are under increasing pressure to
reduce the duration and cost of highway construction projects. This pressure
stems from the desire to reduce traffic delays and other inconveniences to the
traveling public. To reduce the duration of construction projects, many state
highway agencies have turned to the use of time-related incentive and
disincentive contract provisions. A better understanding of the use of time-related
incentives and disincentives in highway construction contracts is needed.
Specifically, the following items require further research:
(1) The types of time-related incentive and disincentive contract provisions
used in highway construction contracts and the extent to which they are used.
(2) The success of time-related incentive and disincentive contract
provisions.
(3) Criteria used to determine when time-related incentive and disincentive
contract provisions are appropriate and criteria to select the most appropriate
provisions.
(4) Methods used to determine the dollar amount of the time-related
incentives and disincentives.
(5) The effects of time-related incentives and disincentives on project. The
objective of this research is to develop recommendations for effective use of
time-related incentive and disincentive provisions in highway construction
contracts (TRB 2005c).

Draft
Draft 21
Analysis According to the National Cooperative Highway Research Program, true
"performance-related standards":
• are based on properties of the finished product, not on the processes used
to produce it;
• consider the variability inherent in the finished product and in the testing
processes;
• are based on attributes that have been related to the actual performance
of the product through validated quantitative models;
• incorporate sampling and testing procedures whose combined costs are
consistent with the importance of the quality benefit being sought; and
• make the contractor's payment dependent on how close the product
comes to the level of acceptable quality (Volokh 1996).
Proposed Pavement Performance Incentive Program
Parameters used to measure the quality of long-term pavement performance
must be understood by both construction personnel and the NDOR’s quality
control technicians. Parameters which would be evaluated for inclusion in the
NDOR’s performance-based incentive program were originally scheduled to
include:
• Parameters should be one or more of those performance indicators
currently being measured by the NDOR. The NDOR measures a variety
of performance indicators including various cracking indices, IRI, PSI, NSI,
etc.
• Parameters must correlate to an acceptable level of pavement
performance at the time when the incentive will be assessed.

Draft
Draft 22
The research team originally proposed two sets of parameters, one for
conventional flexible pavement and the other for Superpave, as shown in Table
10. Table 10 was subsequently discussed with representatives from Dobson
Brothers, Hawkins and Werner Construction at the University of Nebraska on
November 17, 2006.
Table 10 – Initial Performance-Based Incentives Proposed for Asphalt Pavement
Comments from the contractor representatives included:
a. Four or five years is too long to wait for payments to contractors.
The long-term performance of asphalt pavement can be reliably
estimated after two or three years.
b. Variance of asphalt binder content is probably not a good measure
of quality of HMA pavement.
c. Performance should be based upon measurements taken from the
driving lane only. Bridges, off/on ramps, etc. should be excluded.
d. Payment should be based upon $/SY of materials placed during
original construction instead of a percentage of the overall contract
Eligibility Criteria
Incentive Parameter Payment - % of Contract
Asphalt (Traditional)
Profile Index ≤ 8 inches/mile Variance of asphalt binder content from design content (%) ≤ 0.25
IRI ≤ 1.00 mm/m @ 2 yrs IRI ≤ 1.2 mm/m @ 4 yrs Rutting ≤ 4 mm @ 2 yrs Rutting ≤ 4 mm @ 4 yrs
2.5 % @ 2 yrs 2.5 % @ 4 yrs 2.5 % @ 2 yrs 2.5 % @ 4 yrs
Asphalt (Superpave)
Dynamic Shear(Original) ≥ 0.89 KPa Dynamic Shear (Residue) ≥ 1.95 KPa Creep Stiffness ≤ 315 MPa Creep Slope ≥ 0.291 Elastic Recovery ≥ 54 %
IRI ≤ 1.00 mm/m @ 2 yrs IRI ≤ 1.2 mm/m @ 4 yrs Rutting ≤ 4 mm @ 2 yrs Rutting ≤ 4 mm @ 4 yrs
2.5 % @ 2 yrs 2.5 % @ 4 yrs 2.5 % @ 2 yrs 2.5 % @ 4 yrs
Draft
Draft 23
or tons of material emplaced. Payment should be proportional to
the cost of emplacing all layers (subgrade, base and pavement).
e. The NDOR contracts for more partial depth rehabilitation/
reclamation projects rather than full depth. Researchers included
full-depth replacement as a subcategory under traditional asphalt
when asked. Proposed standards should be expanded to include
partial depth projects.
f. Contractors would like to see a history of pavement segments
completed, NDOR’s assessment of quality of those segments upon
completion, and hypothetical payments contractors would receive
based upon proposed performance parameters measured two or
three years later.
NDOR Suggested Modifications
Researchers then met with NDOR representatives from Materials and Research
Division and Construction Division on December 1st, 2006. Comments from the
NDOR personnel present at that meeting included:
a. All asphalt pavement contracted by NDOR must now meet
Superpave specifications, so traditional asphalt as a category could
be deleted from the proposal.
b. A discussion was held on the proposed standards of quality,
specifically indicators for measuring pavement performance and
whether IRI is indicative of quality for asphalt pavement. The
consensus was that IRI decreases as asphalt pavement ages, so
IRI is irrelevant for measuring long-term quality.
c. A similar discussion ensued reference cracking of asphalt
pavement. The consensus was that control of cracking is beyond
control of the contractor (at least for certain applications of asphalt
pavement). Cracking may or may not be affected by quality of
Draft
Draft 24
materials used or by “laydown” procedures. It should not be
included as an indicator when measuring long-term pavement
performance.
d. Flushing was subsequently discussed. Consensus was that
flushing is affected by quality and quantity of binder used.
However, flushing is not an indicator normally measured by the
NDOR. The NDOR has no published standards concerning what
levels of flushing are acceptable and what levels are considered
excessive. Flushing in excess of 20% was thought to be excessive,
but how frequently a measurement of flushing should be obtained
for a given section of highway and method of documentation was
unclear. The intent of this incentive program is to provide
incentives only for factors which the contractor can directly control
during the construction process. Flushing may or may not be
under contractor control. Specific pavement segments will have to
be manually evaluated for flushing if flushing is included as a
proposed incentive.
e. Rutting was the only proposed standard judged to be acceptable
under the performance based incentive program. Six millimeters
was considered too high for the limit and two years was considered
insufficient time to measure performance. Consensus was reached
that three years and four millimeters or less of rutting were
acceptable standards of quality for a performance based incentive
program.
f. An extended discussion then took place on whether the NDOR
wished to have eligibility criteria listed or whether the only eligibility
criteria should be “selected by the NDOR”. Consensus was that
the NDOR does not intend to apply these incentive standards to all
or even to a majority of asphalt paving projects. Performance
based incentives will be applied selectively only to specific projects
Draft
Draft 25
where the NDOR has a special interest in contracting for long term
quality pavement.
g. Profilograph Pay Factor (PPF) and Material Pay Factor (MPF) were
thought to represent good composite estimates of initial pavement
quality. Projects with below-average PPF and MPF would not
normally be eligible for performance-based incentives, so these
factors could be used as eligibility criteria.
h. Consensus was that the same incentive(s) should apply to all
asphalt pavement applications, whether new pavement, full or
partial depth reclamation, rehabilitation or overlay.
i. The NDOR requested that performance indicators shown in Table
10 be condensed to reflect only one row of flexible pavement, with
a standard of rutting < 4 mm measured at three years. Flushing
less than 20% was to be included in the final recommendation as
well. PPF and MPF should be listed as eligibility criteria. The
proposed payment be based upon the NDOR’s current practice of
paying for quantity of asphaltic concrete (in tons or Mg) placed as
surface layers, not as dollars per square yard (or per square meter)
as requested by the contractor’s representatives.
Analysis of Projects Where Materials and Workmanship Incentives Were Paid
Researchers then sought to investigate whether projects awarded
incentives immediately after construction showed acceptable or better standards
for long-term performance. The NDOR was asked to provide data for asphaltic
concrete projects in excess of five miles in length, which had been constructed
during the past three years, where quality incentives had been paid for
smoothness and/or materials and workmanship upon completion of construction.
Three years of age provided time for post-construction performance to
accumulate and be measured while length in excess of five miles indicated a

Draft
Draft 26
significant paving project. Rational for the quality incentive specification rested
upon the assumption that a project which failed to earn an incentive for quality of
construction would probably not be an ideal candidate for superior long-term
performance. Table 11 shows cost information concerning three asphalt paving
projects approximately three years old that received materials and workmanship
incentives from the NDOR for pavement quality. Note that all projects were
Superpave asphalt and that three different types of construction incentives were
paid for each project. Table 12 shows rutting measured for these three projects
over the first three years of their lifespan.
Table 11 – Projects Where Construction Incentives Were Paid by the NDOR
Control Number
Smoothness Incentive Pay
Factor
Additional Incentive
Pay Factor
Quantity Incentive Paid
Smoothness Incentive - Performance Graded (PG) Binder 60937 Not Available $5.94 776.92 Mg $4,614.92 31345 104.06% $6.46 522.08 Tons $3,372.64 60893 100.75% $2.04 248.298 Mg $506.03
Smoothness Incentive - Asphalt Cement 60937 Not Available $0.84980 17544.60 $14,912.91 31345 104.06% $750000 12733.75 Tons $9,550.30 60893 100.74% $0.14800 4281 Mg $633.59
Superpave Quality Incentive 60937 Not Available $0.90 51729.62 Mg $46,400.99 31345 103.54% $0.66 25229.950 Tons $16,651.77 60893 Not Available $0.68 25807.04 Mg $17,419.75
Total Construction Quality Incentives Paid 60937 $65,928.82 31345 $29,574.71 60893 $18,559.37

Draft
Draft 27
Table 12 – Analysis of Pavement Performance Over Three Years
HWY
BEG REF
POST NUM
END REF
POST NUM
CNTRL NUM
WRK DESC
DT COMP
LTD
AVG RUT
D 2003
AVG RUT
D 2004
AVG RUT
D 2005
AVG RUTD 2006
IRI 2006
CRKNG IDX
2 258.04 270.32 60937
GR CULV
RESURF S-SHLD
2002 0.75 1.43 1.6 2.4 0.8 1.7
30 114.31 124.31 60893 GR STR RESURF 2003 0.3 3.39 3.58 4.6 0.9 0
275 31.91 39.31 31345 RESURF 2002 3.37 4.87 ND 4.5 1 5.5
Results
Based upon the meeting with contractor representatives, the meeting the
NDOR’s Materials and Research Division and Construction Division personnel,
and analysis of information in Tables 11 and 12, a proposal for a performance-
based incentive program for asphalt pavement is summarized in Table 13.
Researchers initially intended to recommend a 5% incentive based upon total
cost of asphalt paving materials for the project. However, the incentive paid for
construction quality varied on the three project analyzed from 3.7% to 5.7%. A
payment less than the construction quality incentive three years in the future
would appear to be of little interest to a contractor, so a 6% payment was
recommended instead. Six percent is only a recommendation. Five percent is
estimated to be too low to draw significant contractor interest three years in the
futture. The actual percentage paid can be adjusted upward or downward until
the level of interest shown by the contractors is sufficient to satisfy the NDOR’s
needs. Four millimeters of rutting during the first three years of pavement life
remains the recommended standard based upon meetings with both contractor’s
Draft
Draft 28
representatives and the NDOR. Both the standard and/or the time period can be
adjusted upward or downward as conditions change.
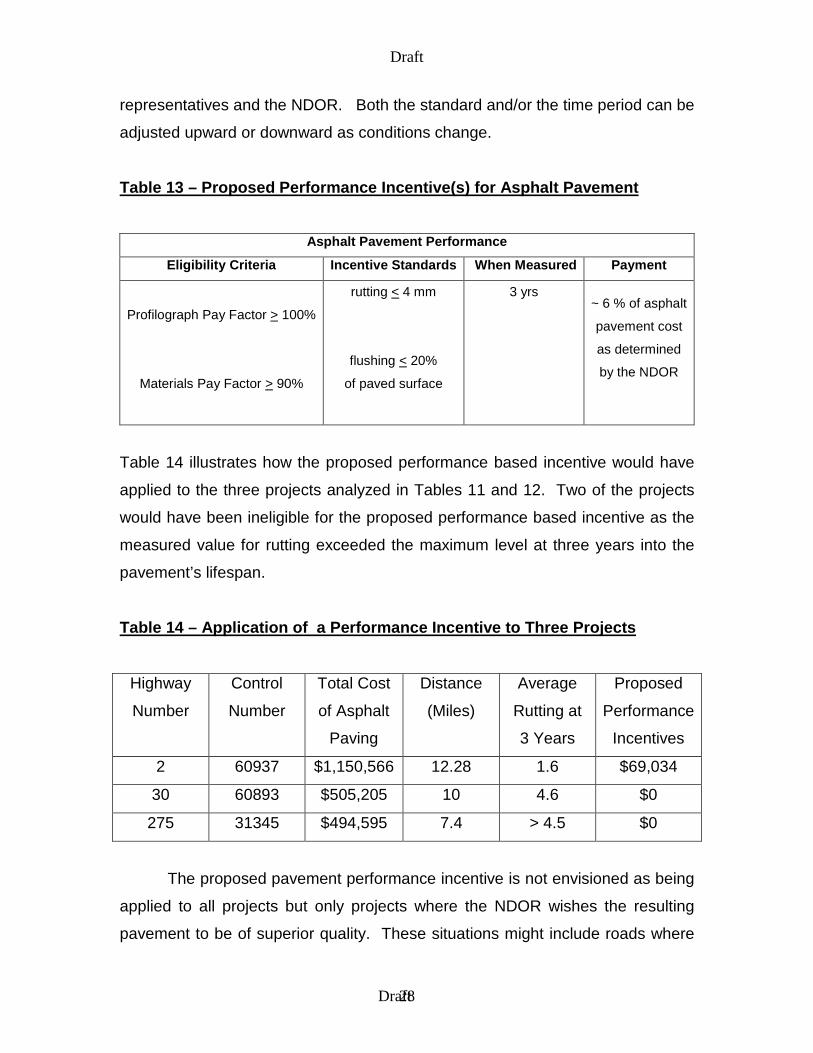
Table 13 – Proposed Performance Incentive(s) for Asphalt Pavement
Asphalt Pavement Performance
Eligibility Criteria Incentive Standards When Measured Payment
Profilograph Pay Factor > 100%
Materials Pay Factor > 90%
rutting < 4 mm
flushing < 20%
of paved surface
3 yrs
~ 6 % of asphalt
pavement cost
as determined
by the NDOR
Table 14 illustrates how the proposed performance based incentive would have
applied to the three projects analyzed in Tables 11 and 12. Two of the projects
would have been ineligible for the proposed performance based incentive as the
measured value for rutting exceeded the maximum level at three years into the
pavement’s lifespan.
Table 14 – Application of a Performance Incentive to Three Projects
Highway
Number
Control
Number
Total Cost
of Asphalt
Paving
Distance
(Miles)
Average
Rutting at
3 Years
Proposed
Performance
Incentives
2 60937 $1,150,566 12.28 1.6 $69,034
30 60893 $505,205 10 4.6 $0
275 31345 $494,595 7.4 > 4.5 $0
The proposed pavement performance incentive is not envisioned as being
applied to all projects but only projects where the NDOR wishes the resulting
pavement to be of superior quality. These situations might include roads where
Draft
Draft 29
the volume of traffic is sufficient to make repair and/or rehabilitation exceedingly
difficult or costly.
Conclusions and Recommendations
Results of this research can be used by NDOR to provide contractors with
incentives to more closely control the quality of materials used in mixes and
procedures for construction of asphalt pavements. Percentages or time periods
associated with a specific incentive can be established by level of performance
desired and adjusted to encourage the desired level of contractor participation in
this process.
The performance incentive system proposed is designed to align the
objectives of paving contractors more closely with the objectives of the NDOR.
Both the NDOR and pavement contractors will be interested in providing
pavement that meets certain specifications upon completion of construction and
performs well enough to continue meeting established standards for a period of
time afterward. This system will highlight to contractors the need for use of
quality materials and methods and provide a positive financial incentive for
contractors who construct quality pavement.
A quality incentive program of this type based upon pavement
performance could become a nation-wide trend. Many state transportation
agencies are experimenting with pavement warranties, best value contracts and
performance based contracting procedures in an attempt to procure higher
quality pavement. A quality incentive program of the type proposed in this
research has the potential to provide most of the benefits of these three
programs at less than cost and certainly with less legal entanglements.
Draft
Draft 30
References
National Coorperative Highway Research Program (2001) Synthesis 300.
Performance Measures for Research, Development, and Technology
Programs. A Synthesis of Highway Practice. Transportation Research Board.
National Research Council.
Nebraska Department of Roads (2004) Superpave Asphaltic Concrete,
Manual S10-7, Section 1028 of the Standard Specification, revised 3-22-
2004, pp. 1-24.
Nebraska Department of Roads (2007). Supplemental and Standard
Specifications Book for Highway Construction. Retrieved on March 12, 2007
from http://www.dor.state.ne.us/ref-man/specbook-2007.pdf.
Office of Program Administration (2006). State DOT Approaches for
Unsatisfactory Contractor Performance – Contract administration –
Construction questionnaire regarding state DOT approaches for dealing with
unsatisfactory contractor performance (time and quality). Retrieved from
http://www.fhwa.dot.gov/programadmin/contracts/perfsht.cfm on November
11, 2006.
Richter, C.A. (2004). The Case for Performance Standards. Public Roads
[Electronic version] Vol. 67, Issue 6, p. 8-17.
Transportation Research Board (2004). Guidelines for Incentive/Disincentive
Contracting. Retrieved from http://rip.trb.org/browse/dproject.asp?n=9783 on
March 12, 2007.
Draft
Draft 31
Transportation Research Board (2005a). Guidelines for the Use of Pavement
Warranties. Retrieved from http://www.trb.org/TRBNet/ProjectDisplay .asp
?ProjectID=288 on March 5, 2007.
Transportation Research Board (2005b). Performance Based Contracting.
Retrieved from http://rip.trb.org/browse/dproject.asp? n=10986 on March 12,
2007.
Transportation Research Board (2005c). Time-Related Incentive and
Disincentive Provisions in Highway Construction Contracts. Retrieved from
http://rip.trb.org/browse/dproject.asp?n=11763 on January 7, 2007.
Transportation Research Board (2006). Evaluation of Alternative Contracting
Techniques on FDOT Construction Projects. Retrieved from
http://rip.trb.org/browse/dproject.asp?n=11633 on December 6, 2006.
Washington State Department of Transportation (2002). Retrieved from
http://training.ce.washington.edu/WSDOT/Modules/08_specifications_qa/08-
3_body.htm on November 14, 2006.
Volokh, A. (1996). Recycling and Deregulation Opportunities for Market
Development. Resource Recycling. Retrieved from http://volokh.com/sasha/
resrec.html on March 12, 2007.