A partnership between and the United Nations Food and ... · and the United Nations Food and...
58
A partnership between the Ministry of Agriculture, Forestry, Cooperatives & Rural Development (GRSS-MAFCRD) and the United Nations Food and Agriculture Organization (FAO) Crop Planting Assessment Mission to Greater Bahr el Ghazal Republic of South Sudan July 2014 Report 2 in preparation for the Crop and Food Security Assessment Mission (CFSAM) Team leader: Dr Ian Robinson, AA International Ltd This report has been produced with the financial support of the EU, under the “Agriculture and Food Information System for Decision Support (AFIS)” Project in South Sudan FAO reference: GCP/SSD/003/EC; EU reference: FED/2012/304-645
-
Upload
nguyenkiet -
Category
Documents
-
view
218 -
download
0
Transcript of A partnership between and the United Nations Food and ... · and the United Nations Food and...
A partnership between the Ministry of Agriculture, Forestry, Cooperatives & Rural Development (GRSS-MAFCRD)
and the United Nations Food and Agriculture Organization (FAO)
Crop Planting Assessment Mission to Greater Bahr el Ghazal
Republic of South Sudan July 2014
Report 2 in preparation for the Crop and Food Security Assessment Mission (CFSAM)
Team leader: Dr Ian Robinson, AA International Ltd
This report has been produced with the financial support of the EU, under the “Agriculture and Food Information System for Decision Support (AFIS)” Project in South
Sudan FAO reference: GCP/SSD/003/EC; EU reference: FED/2012/304-645
1
CONTENTS 1. OVERVIEW 2. BACKGROUND INFORMATION
2.1 Agricultural systems
2.2 Livestock systems 2.3 Livestock population in South Sudan
3. FACTORS AFFECTING PLANTED AREA 2014
3.1 Rainfall
3.2 Access to land and farmer confidence.
3.3 Power sources
3.4 Input supply
3.5 Crop pest s and diseases
3.6 Livestock movement, numbers and performance
3.7 Livestock body condition 4. CONCLUSIONS
4.1 Effect of rainfall 4.2 Effect of access to land and confidence 4.3 Effect of power supply 4.4 Effect of inputs 4.5 Effect of pest and diseases 4.6 Planted area
ANNEX 1 PERSONS MET (EXCLUDING FARMERS/ HERDERS) ANNEX 2 OBSERVATIONAL TRANSECTS ANNEX 3 PLANTING SEASON ASSESSMENT CHECKLIST AND SUMMARY SHEET
2
1. OVERVIEW 1.1 Introduction 1.1.1 An MAFCRD/FAO Planting Assessment Mission visited Greater Bahr el Ghazal from 30th May to 23rd June 2014 to assess the overall land preparation and planting situation in accessible counties in the four constituent states of Western Bahr el Ghazal, Northern Bahr el Ghazal, Warrap and Lakes. The Mission, funded by the EU under the “Agriculture and Food Information System for Decision Support (AFIS)” Project in South Sudan FAO project symbol: GCP/SSD/003/EC, EU reference: FED/2012/304-645, was the second in a series of intermediate missions identified to feed information into an MAFCRD / FAO/ WFP CFSAM to be conducted later in the year from September to October/ November. The Mission is timed in accordance with a Roadmap1 for activities prepared by the AA International Ltd Consultant during a mission earlier this year. 1.1.2 The Planting Assessment Mission was undertaken by a task-force comprising the Consultant and four other members including two members drawn from the cadre of the agricultural ministries MAFCRD and MAFCE, one from NBS and a senior FAO-SS staff member, all of whom i) had been trained in CFSAM protocols and PET use; and ii) had shown a much better than average understanding and aptitude for the demanding nature of the work during their involvement in previous CFSAMs.2 1.1.3 In Juba before departure to the field, the Mission team was briefed separately by FAO Emergency Coordinator, and received written authority to conduct the Mission from the Deputy Minister of MAFCRD. Upon return to Juba, a short debriefing was given to FAO-AFIS staff by the team leader before immediate departure to the UK3 the following day where the Mission Report was drafted. Further debriefing for senior FAO Staff was conducted via Skype on 1st July and with MAFCRD senior staff at the end of the month. 1.2 Actions 1.2.1 Over a 24-day period, travelling by road through the accessible counties of Raja, Jur River, Wau in Western Bahr el Ghazal (3/3 with case studies); Aweil West, Aweil North, Aweil East, Aweil Centre and Aweil South Counties (4/5 with case studies) in Northern Bahr el Ghazal; Twic, Gogrial West and Tonj South Counties (3/6 with case studies) in Warrap State4; the Abyei Administrative Area (with case studies between Agok and Abyei; and in Cueibet, Rumbek East, Rumbek Centre and Rumbek North, Wulu, Yirol West and Yirol East Counties (4/6 with case studies-NB no case studies in Rumbek North and no transects/ visits in Awerial) in Lakes State4, the Mission Team conducted simultaneous observational transects noting frequencies of occurrence of bush-forest savannah, grass-swamps,
1 Prepared under the ToRs of a specific mission from 23
rd March-12
th April in the “Agriculture and Food Security
Information and Analysis” Programme Area. 2 Evans Kenyi (FAO-SS), Thomas Misaka (MAFCE); Angelo Longa (MAFCRD) and Geoffrey Vuni (NBS).
3 AA International Ltd, Aberystwyth, Wales.
4 NB Due to road access and security considerations, the Mission was unable to visit locations closest to the conflict zones
and accommodating IDPs from Unity, Jonglei and Upper Nile States. Locations not covered include a) in Warrap State- Gogrial East, Tonj North, and Tonj East; and, b) in Lakes- Rumbek North, Rumbek Centre and Awerial Counties. Other missions, including the Food Security Monitoring System Surveys, have covered general conditions at planting time in these areas.
3
agricultural activities- clearing and planting, cereal, groundnut and sesame or cassava areas; and PET livestock body condition scores, all based on the protocol and sample sheets provided in Annex 2. 1.2.2 The transects followed both main roads through the counties and access roads to sample locations in each county where case studies were possible from both access and security points of view. In such a way, five observers collected 65 hours of 20-second observations over the 23-day mission period. 1.2.3 At the sample locations, which were selected in consultation with the State Ministry officials and County Directors of Agriculture, a total of one hundred and ninety (190) farming household case-studies, selected on a random–as available basis in what were typical agricultural communities, were conducted using the CFSAM established checklists (Annex 3) and the daily summary sheet protocols, adapted for the planting season. 1.2.4 Information and data collected from transects and case studies were cross-checked against findings from semi-structured, key informant interviews with 12 County Directors of Agriculture and their staff and the SSRRC Director, Raja County. Further location specific information was obtained from key informants through similar semi-structured interviews with State Directors-General of Agriculture (4); State Director General of Livestock (1); State Directors of Animal Health (3) and Animal Production (1); the General Manager of Aweil Rice; the Agricultural Bank Manager for Greater Bahr el Ghazal (Wau-based) and the Ivory Bank Manager, Raja; staff of NGOs currently active in various Mission locations region viz- NPA; ACROSS and Plan International (Lakes); NRC and UMCOR (Northern Bahr el Ghazal); World Vision and World Concern (Warrap); and HARD (Western Bahr el Ghazal (see Annex 1 and Annex 3). 1.2.5 Secondary information was obtained from a review of last year’s CFSAM tables and recent (2014) rainfall estimates and Normalized Difference Vegetation Index (NDVI) data were kindly provided by WFP (Rome) VAM unit and FAO- GIEWS respectively, the latter through the offices of AFIS, FAO-SS. During the analysis, rainfall data were compared with key informant and cases study accounts of rainfall from January to June 2014. 1.2.6 Regarding market analysis, the Mission directly observed spot prices and received current market prices from case study farmers selling their goods in the local markets. 1.3 Findings 1.3.1 The Mission findings, extracted from the transects, case-studies, key informant interviews and secondary data, connect to locations in the visited counties of which none are directly bordering the states involved in the crisis (Upper Nile, Jonglei and Unity). At the time of the Mission to 16 counties in Greater Bahr el Ghazal region, except for concerns expressed by State MoA officials regarding far-field access in the forests between Wau and Mapel, where a number of isolated, Nuer soldiers were said to be camped but presently inactive:
The current crisis in the three states of Greater Upper Nile (Upper Nile, Jonglei, and Unity) and in Juba City as identified by incidents of armed conflict and / or restrictions on movement, or peregrinations of isolated bands of soldiers is having:

4
o No direct discernible effect on timely access to farm land and planting either close to households or in fields further away from the homestead in any of the counties visited by the Mission.
o In a possible indirect effect of the crisis, a total of 2 475 hh in specific villages in Warrap and Lakes are noted to have been recently displaced from their communities. Such displacements are apparently connected to a general breakdown in law and order and use of recently acquired arms in locations in Cueibet, Tonj South, Rumbek Centre, Rumbek North, Rumbek East and Wulu Counties.
1.3.2 Anticipated access problems connecting to conflict between herders and growers were not noted in any states. The Mission looked for possible knock-on effects as movements westward from the conflict areas exerting pressure on local grazing areas but none were found. The present stocking densities were being supported by regular rain without extreme events, allowing domestic herds and flocks to spend longer on the regrowing toic pastures, before moving to jok grazing areas closer to the homes, due to absence of early floods noticed last year.
Unusual migrations reported to the Mission by the Director-Generals of Agriculture and in case studies are few and are noted as follows;
o 4 herds, maybe up to 20 000 head in total, are reported to have moved out of Bor South to Awerial County, Lakes.
o Herds in north Warrap are looking towards southern pastures for post-toic grazing rather than northern pastures after clashes with Messeriya (ex- Sudan) in April.
1.3.3 Regarding factors affecting the current agricultural season’s activities: the rainfall 2014 began early in March-April, stimulating planting, which was supported by a normal rainfall pattern to mid- May, with no early floods or other extreme events. The rainfall from mid-May onwards was more variable and although it sustained vegetation growth above the NDVI long-term, average estimates, reduced rainfall for periods of one to two dekads is noted. These breaks are noticeable in the patterns of the rainfall estimates provided to the Mission by WFP, VAM-Rome. Case–studies suggest that such breaks may have been longer is some locations, but that overall, the rains have been favourable so far. The threat of crop failure due to such breaks or cessation of planting due to delayed onset of rains, may both be reduced by introducing group-based, seedlings nurseries (short –cycle sorghums, millets and maize) prepared either a) at the break or b) pre-rains ready for transplanting immediately rains restart. 1.3.4 Tractor services in the Region are noted to have declined in the past year as the reported numbers of private tractors have not increased; more government tractors have fallen into disrepair and the 24 tractors provided by the Agricultural Bank to the Region for cooperatives have a) not been fully distributed in Western Bahr el Ghazal; b) have been sold to individuals in Warrap for private use; and c) have not been commissioned for sale/ distribution in Lakes as they arrived with no equipment. Only in Northern Bahr el Ghazal have the Agricultural Bank tractors (6) been available for services this year and may have been able to cultivate a further 600 ha during the season, which is already over. Improving spare parts supply chains and training tractor drivers are obvious ways of making a significant impact to the effective use of machinery but they appear to fall outside donor and NGO mandates and are, therefore, ignored-despite their importance.
5
1.3.5 Whereas hand power remains the dominant method of cultivation in Western Bahr el Ghazal, animal traction (oxen) is now noted to be the main means of primary cultivation in Lakes; and is noted to be of increasing importance in the southern counties of Warrap and in Northern Bahr el Ghazal where donkeys, imported from Darfur are noted to be used and considered with increasing interest. 1.3.6 Regarding inputs, the Mission noted no shortages of the local seeds. Farmers generally prefer such seeds to imported exotics. The seeds being used this year are predominantly home-grown, kinship-shared or purchased in the local market at normal grain prices, noted to be between around 3 per kg in April-May. Such seeds include the a) niche early-maturing and late-maturing sorghum landraces, b) local groundnuts, the most common of which are Tongpiny (Lakes); and beribedi (N. Bahr el Ghazal) and c) long-since stabilised releases of maize varieties, local seeds of okra, pumpkin, watermelons and beans used in the backyards; and Darfuri pearl millets often intercropped with sesame. All sesame seed used appears to originate from Sudan and the product that is not used on- farm, tends to go back to Sudan through the chains of local market traders. 1.3.7 Of the crops considered to be minor compared to sorghum, groundnuts are by far the most important with their planting exceeding sorghum planting in all of the Mission’s transects in Lakes. In 2013 FAO planned a large seed recollection programme – which regrettably was totally disrupted by the 15 December events. However, despite the massive crisis, as part of the ongoing Emergency Response Programme FAO has issued Letters of Agreement (LOAs) to 5 NGOs for collection (local purchase) of 434 tonnes of groundnuts seeds. The Mission notes that in each State visited NGOs had been primed by FAO to source local groundnut seeds for local purchase and redistribution. At the time of the Mission, NGOs visited explained that groundnuts sources had been identified and Letters of Agreement between FAO and the NGOs in question were being finalized. 1.3.8 No artificial fertilisers have been used in the Greater Bahr el Ghazal Region this year and manuring practices continue to vary greatly from state to state. Only in N. Bahr el Ghazal and parts of Warrap is the application of animal dung, through highly organised, grazing-over of stover and other crop residues, noticed to be having a significant effect on soil fertility. Elsewhere, crop yields are sustained by shifting the farm site and by the rotation of crop-fallow areas within the larger farms. 1.3.9 At this early stage of the agricultural year, plant pests and diseases were more anticipated than actual but included at sowing-time, forest-inhabiting hazards such as birds, squirrels, rats, termites, porcupines, and caterpillars that were washed away by the rains; and, weevils in the stores. A bigger threat to growing crops in the less forested savannah areas was noted to be local livestock. 1.3.10 No fungal diseases were identified as problems on crops at these early stages of development; and striga (buda), often quoted as the main weed was noticeable by its absence throughout the transects and case-study locations. Grass weeds on the other hand were a far more formidable cause for concern requiring constant attention in all crops in all areas.
6
1.4 Planted Area 1.4.1 Due to uptake of animal traction, improved power sources for land preparation appear to have increased average area cultivated in Lakes and Warrap since cereal areas per household were last estimated. In Northern Bahr el Ghazal area planted is noted to have increased significantly above last year’s flood-affected planting; and animal traction is making some in-roads into the hand cultivated system that prevails. The average size of cereal planting in Western Bahr el Ghazal is not thought to have changed with no noticeable increase in animal traction. Conservative estimates of areas planted to cereals this year suggest that probable sizes are likely to average a) 3 feddans (1.3 ha) in Lakes counties, an increase of 14% above 2013 not including Awerial5; b) 2.4 feddans (1.0 ha) in N. Bahr el Ghazal, a 25% increase above the flood affected area in 2013 and c) 2.6 feddans (1.1 ha) in Warrap, a 13% increase above 2013 estimates. Mission estimates for Western Bahr el Ghazal remain the same as 2013 at 2.3 feddans (0.96 ha)6 1.4.2 Observational transects in Lakes and to a lesser extent in Warrap, point to very large areas of groundnuts already planted this year, that have not been previously captured in CFSAM analyses. These may all be recent additions reflecting the commercial application of animal traction at peasant farm level, or, they may have gone unreported because the groundnut fields are harvested well-before the CFSAMs; and, are not referred to in either the case-studies or in other food security surveys. In any event, the areas exceed cereal areas in transects and have the potential of doubling the supply of a staple substitute or cash crop in all Yirol and Rumbek Counties and in Tonj South. 1.4.3 Quantified changes to cereal planting alone, if sustained until harvest, would connect to an overall potential increase in cereal area of 24,000 ha in Northern Bahr el Ghazal; 21,000 ha in Warrap and 15,000 ha in Lakes (without Awerial). Such increases do not include a) the areas that will be harvested by the emerging farmers (that should be computed separately from lists compiled by County Agricultural Directors under the oversight of FAO), nor b) areas farmed by IDPs, above and beyond the estimates used in CFSAM 2013; nor the re-appraised areas of groundnuts.
5 Not visited by the Mission.
6 The organised introduction of two-wheeled walking tractors offers a solution to the impasse in Western Bahr el Ghazal as
to how to extend cultivated area in the county which arises because, despite official statistics, cattle (oxen) are not raised in any quantity in the area; donkey- based traction has not expanded as hoped two years ago.
7
2. BACKGROUND INFORMATION A general description of agricultural and livestock systems in South Sudan, including cropping calendars and livestock movement patterns has been provided in the companion report for Greater Equatoria7, consequently the following section only summarises key points of the general systems in Greater Bahr el Ghazal. 2.1 Agricultural Systems 2.1.1 The agro-ecology of Greater Bahr el Ghazal Region, dominated by the Ironstone Plateau, provides a shorter growing season than in the Greenbelt varying from 130-150 days per annum in the north to 150-200 days in the southwest.
As elsewhere in South Sudan agricultural production is based on small, hand-cultivated units presently farmed mostly by women-headed households belonging to larger family aggregations, which reflects the polygamous nature of most communities. However,
o Animal traction is emerging as a convincing alternative to hand cultivation in Lakes and Warrap States.
o A few emerging farmers in all four states are creating groundnut and cereal producing enterprises, cultivated using either a) privately owned tractors; b) multiple oxen pairs, or c) contracted hand labour. Such farmers are emulating, albeit on a much smaller scale (i.e. tens and hundreds of feddans rather than thousands of feddans) the mechanised farming schemes of Upper Nile State. The farming system involved is a form of mechanised shifting and investment is minimal, being restricted to clearing, single-pass ploughing, sowing, weeding and harvesting. When the land is exhausted to farmers shift to new areas.
Sorghum is by far the major cereal in the Region, with a wide variety of niche landraces that are highly-appreciated for their adapted efficiency throughout the northern states of South Sudan.
Of the other crops grown, groundnuts make an extremely significant contribution to household food economies, replacing sorghum as the main staple in poorer sorghum-growing years when the rains begin later than usual, and providing a regular staple and cash crop in the higher localities (jok) with sandier soils.
Green grams, cowpeas, beans, sesame, pumpkins and tobacco add to the biodiversity of the northern farming areas.
Cassava, the food safety net of the Greenbelt is grown only in any quantity in Raja County, parts of Wau counties in Western Bahr el Ghazal; and, in limited locations in Lakes State along paths and boundaries.
Inputs to the system, other than local seeds and labour are absent, with the exception of imported seeds (some vegetables) and hand tools from local markets.
The repetitive failures of tractor introductions in the public sector, mentioned in the companion report8 are evident here for similar reasons viz lack of spares, non- maintenance and the absence of a recognised need to train tractor drivers in the skills required.
7 Robinson 1. (2014) op cit
8 Robinson, I. (2014) Planting Assessment Greater Equatoria, Report to FAO-South Sudan, Juba.

8
2.2 Livestock systems 2.2.1 In Greater Bahr el Ghazal, the indigenous livestock keepers follow a transhumant agro-pastoralist production system revolving around two sub-systems; (i) the seasonal movement of herds or flocks in cattle camps between two or more seasonal grazing areas –toic- lowland swamp-grassland areas and -jok- higher, drier, sandier forest areas and (ii) utilisation of crop production by-products and fallow fields within easy reach from the village. The village serves the mobile units as the base-camp and supports changeable sections of the herds and flocks that provide the village with services such as traction, milk and provision of sale or slaughter stock, while also acting as a holding area for animals unable to follow the mobile units, due to their physiological state. 2.2.2 The Region also accommodates seasonal movement of pastoralist livestock originating from Sudan (baggara) and other neighbouring countries (mbororo). In the transitory, pastoralist sub-sector, the herds and flocks are bigger and move in larger aggregations. The distances travelled are greater and involve more locations but are predictable to the extent that they tend to follow the rains. The greater influx from Sudan does not usually reach the central or southern grazing pastures of Greater Bahr el Ghazal Region, while the mbororo, who are truly nomadic, may move from Greater Bahr el Ghazal and beyond Greater Equatoria into neighbouring countries. 2.3 Livestock population in South Sudan 2.3.1 In December 2013, the livestock population was estimated to be a cattle population of 11.77 million head, similar to contemporary population estimates of sheep and goats at around 12 million head each. 2.3.2 A breakdown of estimated domestic cattle numbers by state over the past three years is shown in Table 1. It shows that half of the national domestic herd is held in the Region, but also credits Western Bahr el Ghazal with far more domestic cattle than are probably present given the presence of trypanosomiasis and associated lack of livestock ownership. Table 1 Greater Bahr el Ghazal Cattle numbers in millions.
2011 2012 2013
Lakes 1.313 1.313 1.314
Warrap 1.530 1.531 1.532
N. Bahr el Ghazal 1.581 1.582 1.583
W. Bahr el Ghazal 1.249 1.250 1.251
Total 5.673 5.676 5.680
2.3.3 There is a continuing shortage of information available at State and County level regarding livestock movements, condition and performance. The establishment of indicator (or sentinel) units within herds and flocks would go a long way to improving understanding of these matters. In the meantime, while such a suggestion is given some consideration, the AFIS livestock liaison officer should collate reports of movement, numbers, and where possible, performance from any available sources during the coming year as part of the CFSAM Roadmap Task-force 2 actions.

9
2.4 Methods and Materials 2.4.1 Over a 24-day period, travelling by road through the accessible counties of Raja, Jur River, Wau in Western Bahr el Ghazal (3/3 with case studies); Aweil West, Aweil North, Aweil East, Aweil Centre and Aweil South Counties (4/5 with case studies) in Northern Bahr el Ghazal; Twic, Gogrial West and Tonj South Counties (3/6 with case studies) in Warrap State9; the Abyei Administrative Area (with case studies between Agok and Abyei; and Cueibet, Rumbek East, Rumbek Centre and Rumbek North Wulu, Yirol West and Yirol East Counties (4/6 with case studies) in Lakes State4, 2.4.2 Throughout all journeys, the Mission Team, comprising the team leader (AAI Consultant), and four PET- CFSAM trained members from MAFCRD, MAFCE, FAO-Juba and NBS conducted simultaneous observational transects noting frequencies of occurrence of bush-forest savannah, grass-swamps, agricultural activities viz clearing, cultivating and planting, as well as cereal, groundnut and sesame or cassava areas; and PET livestock body condition scores, all based on the protocol and sample sheets provided in Annex 2. 2.4.3 The transects followed main roads through the counties and access roads to sample locations in each county, where case studies were possible from both access and security points of view. In such a way, sixty-five hours of 20 second observations were collected by five observers over the twenty-three day Mission period. 2.4.4 At the sample locations, which were selected in consultation with the State Ministry officials and County Directors of Agriculture, a total of one hundred and ninety (190) farming household case-studies, selected on a random–as available basis in what were typical agricultural communities, were conducted using the CFSAM established checklists (Annex 3) and the daily summary sheet protocols, adapted for the planting season. 2.4.5 Information and data collected from transects and case studies were cross-checked against findings from semi-structured, key informant interviews with 12 County Directors of Agriculture and their staff and the SSRRC Director, Raja County. 2.4.6 Further location specific information was obtained from key informants through similar semi-structured interviews with State Directors-General of Agriculture (4); State Director General of Livestock (1); State Directors of Animal Health (3) and Animal Production (1); the General Manager of Aweil Rice; the Agricultural Bank Manager for Greater Bahr el Ghazal (Wau-based) and the Ivory Bank Manager, Raja; staff of NGOs currently active in various Mission locations region viz- NPA; ACROSS and Plan International (Lakes); NRC and UMCOR (Northern Bahr el Ghazal); World Vision and World Concern (Warrap); and HARD (Western Bahr el Ghazal (see Annex 1 and Annex 3). 2.4.7 Secondary information was obtained from a review of last year’s CFSAM tables and recent (2014) rainfall estimates and Normalized Difference Vegetation Index (NDVI) data 9 NB Due to road access and security considerations, the Mission was unable to visit locations closest to the conflict zones
and accommodating IDPs from Unity, Jonglei and Upper Nile States. Locations not covered in interviews include a) in Warrap State- Gogrial East, Tonj North, and Tonj East; and, b) in Lakes- Rumbek North, Rumbek Centre and Awerial Counties. Other missions, including the Food Security Monitoring System surveys, have covered general conditions at planting time in these areas.
10
were kindly provided by WFP (Rome) VAM unit and FAO-GIEWS respectively, the latter through the offices of AFIS, FAO-SS. During the analysis, rainfall data were compared with key informant and cases study accounts of rainfall from January to June 2014. Regarding market analysis, the Mission directly observed spot prices and received current market prices from case study farmers selling their goods in the local markets. 2.4.8 A short debriefing was given to FAO-AFIS staff prior to the AAI Consultants departure on June 24th and a fuller debriefing given to all FAO Senior staff via Skype on July 1st.

11
3. FACTORS AFFECTING PLANTED AREA 2014 3.0 Critical factors 3.0.1 The five critical factors affecting planting area in Greater Bahr el Ghazal and in South Sudan, generally termed key constraints, are: 1) the quantity and distribution of rainfall; 2) security-based access to land around the homestead and in the far-fields connected to farmer confidence; 3) power sources; 4) input supply; and 5) pests and diseases. At the time of writing, the Consultant had already completed the Planting Assessment Mission to West and Central Equatoria where all factors have already been reported. This action is the second in a series identified by the Consultant in the CFSAM Roadmap to be undertaken by Task Force 1. It should be noted that
Planting Missions10 to East Equatoria have not yet been undertaken but are planned to be conducted in July.
Similar studies have yet to be agreed for Greater Upper Nile Region.
Taskforce 2 has yet to be clearly identified. 3.1 Rainfall 3.1.1 Vegetation development to June over the whole country is shown in the NDVI summaries for the dekad to June 2nd in 2013 and 2014 in Figure 1. As may be noted in the maps, with the exception of Unity State, east/ south–east East Equatoria and locations south of Abyei, vegetation development has been as good as, or, as is the case throughout Greater Bahr el Ghazal, better than the long term average. Figure 1. NDVI anomalies 2013 and 2014:
3.1.2 More specifically, rainfall estimates for each state in the Greater Bahr el Ghazal Region, are shown in the four graphs in Figure 2 below.
10
As recommended in the Roadmap.
12
3.1.3 Rainfall performance so far this year (to the end of end of the second dekad in June), as noted by the satellite- based rainfall estimates in Figure 2, is more favourable than the long-term average levels. The pattern common to all states shows:-
An earlier start than is normal, which prompted early tillage.
Regular rainfall in April encouraged the planting of long-term sorghum varieties often intercropped with groundnuts.
A break in mid-May lasting from 5-10 days.
A lower than average precipitation in the first dekad of June with concomitantly less flooding than last year in the low-lying areas.
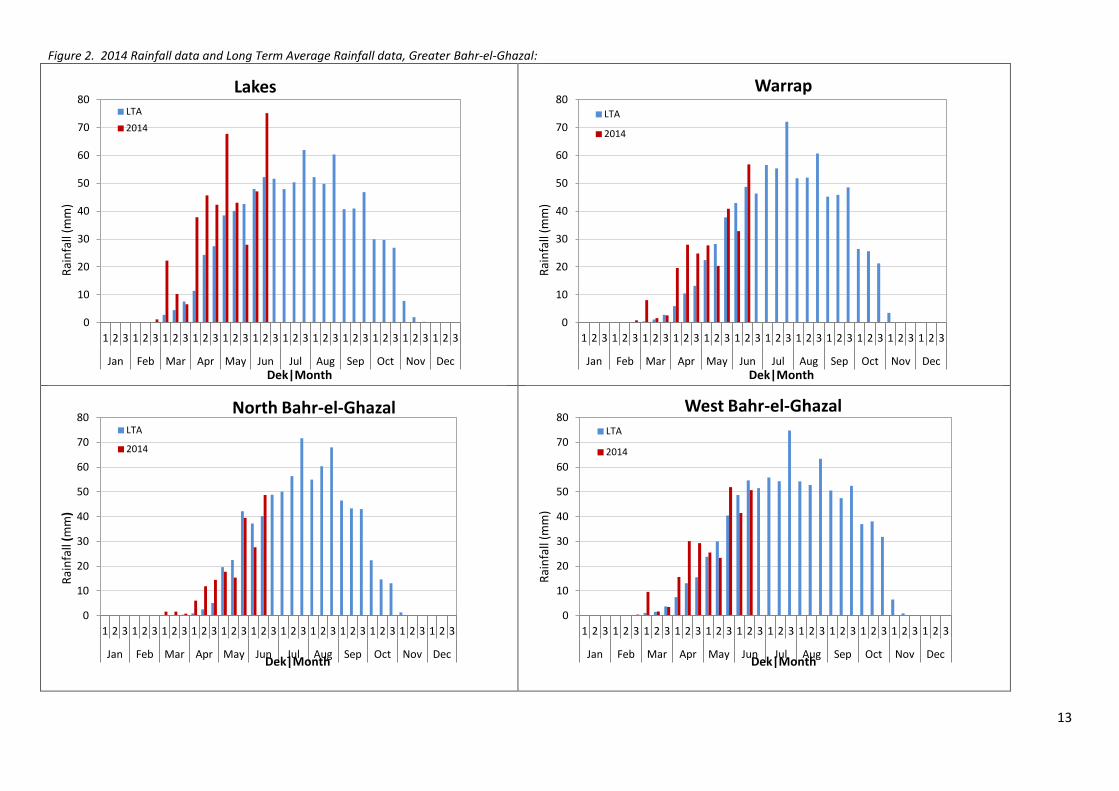
13
Figure 2. 2014 Rainfall data and Long Term Average Rainfall data, Greater Bahr-el-Ghazal:
0
10
20
30
40
50
60
70
80
1 2 3 1 2 3 1 2 3 1 2 3 1 2 3 1 2 3 1 2 3 1 2 3 1 2 3 1 2 3 1 2 3 1 2 3
Jan Feb Mar Apr May Jun Jul Aug Sep Oct Nov Dec
Rai
nfa
ll (m
m)
Dek|Month
Lakes LTA
2014
0
10
20
30
40
50
60
70
80
1 2 3 1 2 3 1 2 3 1 2 3 1 2 3 1 2 3 1 2 3 1 2 3 1 2 3 1 2 3 1 2 3 1 2 3
Jan Feb Mar Apr May Jun Jul Aug Sep Oct Nov Dec
Rai
nfa
ll (m
m)
Dek|Month
Warrap
LTA
2014
0
10
20
30
40
50
60
70
80
1 2 3 1 2 3 1 2 3 1 2 3 1 2 3 1 2 3 1 2 3 1 2 3 1 2 3 1 2 3 1 2 3 1 2 3
Jan Feb Mar Apr May Jun Jul Aug Sep Oct Nov Dec
Rai
nfa
ll (m
m)
Dek|Month
North Bahr-el-Ghazal LTA
2014
0
10
20
30
40
50
60
70
80
1 2 3 1 2 3 1 2 3 1 2 3 1 2 3 1 2 3 1 2 3 1 2 3 1 2 3 1 2 3 1 2 3 1 2 3
Jan Feb Mar Apr May Jun Jul Aug Sep Oct Nov Dec
Rai
nfa
ll (m
m)
Dek|Month
West Bahr-el-Ghazal LTA
2014

14
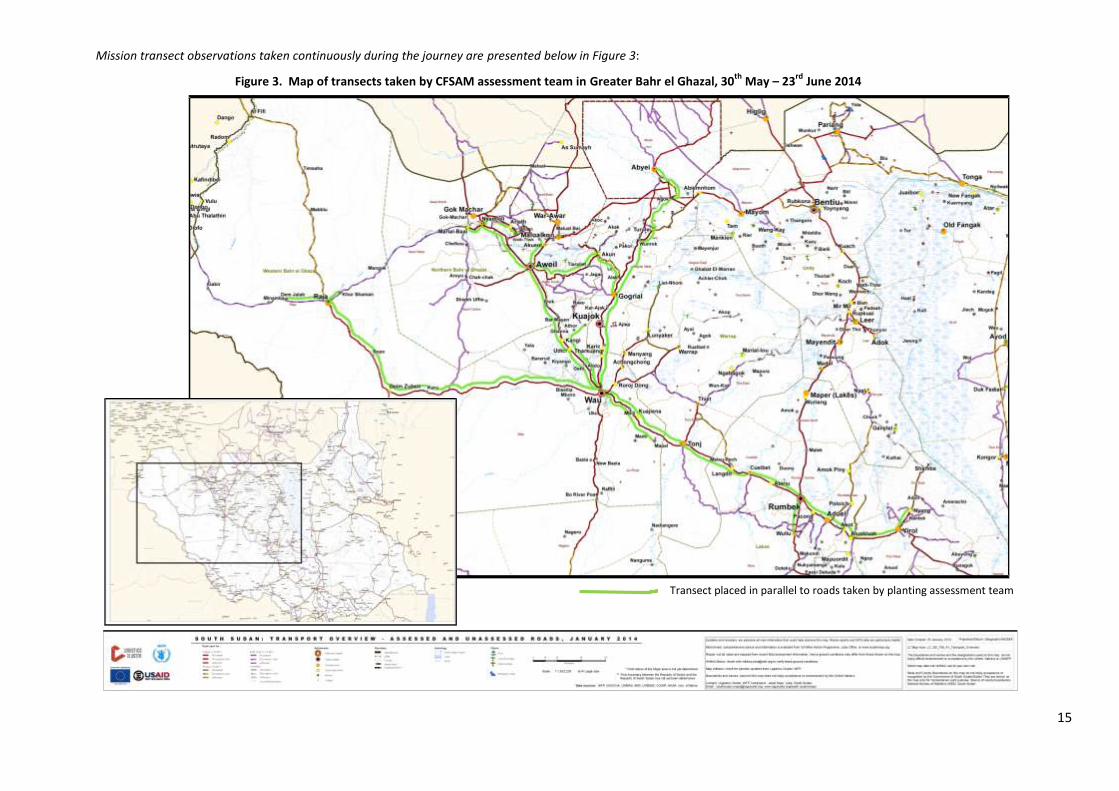
3.1.4 By and large, the indicators match comments from key informants and case-study farmers throughout the Region, who reported that the rains were early, favourable with anticipated breaks at the end of May and early June. The rainfall pattern to date is noted throughout to have been better than the rains that prompted the floods last year. In some locations visited, the breaks in May caused replanting which comprised gap-filling for the most part. The breaks in early to mid-June were becoming prolonged at the time of the Mission in Tonj South and Lakes, causing later planting to be delayed until the rains restarted. These breaks are just noticeable in the patterns of the rainfall estimates provided to the Mission by WFP, VAM-Rome. Case–studies suggest that such breaks may have been longer is some locations, but that overall, the rains have been favourable so far. The threat of crop failure due to such breaks or cessation of planting due to delayed onset of rains may both be reduced by introducing group-based, seedlings nurseries (short –cycle sorghums, millets and maize) prepared either a) at the break or b) pre-rains ready for transplanting immediately rains restart. 3.1.5 As with the findings during the Greater Equatoria mission regarding local rainfall data11, unfortunately, the network of rain gauges established by the WFP-VAM, Rome during the CPA is not functioning as intended. The absence of salaries (2-3 months late) for county-based staff, paper, pencils, notebooks and, the absence of any recurrent expenditure to purchase such items mean that a) many staff at county level are not fulfilling their obligations to collect data from the rain gauges; and b) SMS cards, upon which records retrieval from the more recent introduction of automatic weather stations depend, are not being renewed. Rainfall data, to the end of May, were, however, recovered from county offices in Raja, Aweil North and Rumbek East (3/14 county offices visited). In each case the dekad data confirmed the pattern described above. 3.2 Access to land and agricultural activities. 3.2.1 Access to land determines agricultural activities; therefore, the corollary that agricultural activities reflect access to land is equally apposite. Consequently, the Mission uses transect observations, taken on every journey, to judge the amount of agricultural activity in each location traversed or visited. The analysed transect notes are then used to crosscheck information received from key-informants and from farmer case-studies. 3.2.2 The general transect protocols used in the previous Greater Equatoria Planting Assessment Mission Report12 are presented in Annex 2. In a further development of the transect procedures reported, during the current Mission’s vehicle-based transects, observations were noted in 20 seconds cells13 by two observers, one on each side of the vehicle using standardised (between observers) A4 sheets with thirty-one, 1-minute (three x 20 second–cell aggregates) gridlines for each type of indicator record14. Indicators comprising clearing, cultivation, planting, growing cereals, growing groundnuts, growing cassava or sesame (according to location) were noted simultaneously throughout all journeys. One minute (60 second) values for each indicator were aggregated into half-hour (plus one minute overlaps) clusters. During preliminary analyses at the end of each day, the half–hour values of each recorded indicator were subtracted from the default position, considered to be ubiquitous presence of bush-forest-savannah, and in some transects, grassland-swamp areas as they occur as the ecology changes. The new extended vehicle-based transect procedures are also described further in Annex 2. The main routes taken by the Mission are noted in Figure 3.
11
Comments may be of significance for the new AFIS programme planners. 12
Robinson, I. (2014) op cit. 13
Scores up to 100% per cell (noted as 1) may be made for dominant ecologies such as bush- forest-savannah (the default condition), grassland-swamp or temporary widespread conditions like mass burnt or cleared areas or large scale cultivations, planting or cropping. Scores up to 50% may be made for peasant- based actions or conditions that always incorporate fallow areas, paths, gaps, houses. 14
A copy of the format is provided in Annex 2.
15
Mission transect observations taken continuously during the journey are presented below in Figure 3:
Transect placed in parallel to roads taken by planting assessment team
Figure 3. Map of transects taken by CFSAM assessment team in Greater Bahr el Ghazal, 30
th May – 23
rd June 2014

16
3.2.3 In such a way, continuous 20 second observations were noted and summarised, thereby ranking seasonal agricultural activities in order of their occurrence against the changing background matrix of bush- forest-savannah or grassland-swamp for c. 65 hours of travel at a steady speed15. Herds of cattle and goats and flocks of sheep, as seen during transects, were scored for body condition by mode using photo-indicators from PET Livestock Sudan over the same period. Summary of activities noted from both sides of the vehicle for each transect are presented in the form of pie charts and histograms of half-hour clusters. The pie charts show the dominant situation for the whole journey by percentage, while the histograms show the transitions occurring from 30 minute cluster to 30 minute cluster during the transect from centre to centre. The analysed returns are presented by state in Figure 4a to 4h.
15
Road conditions varied, reducing speeds from the standard 50 km per hour on main roads; but for the sake of the analysis the variations have been assumed to have been unbiased, that is unconnected to any environmental condition, allowing transect clusters to be based on time rather than distance. Two vehicles were used. Analyses have been conducted on the team’s data from the first car. The second car team’s data providing a back-up data set, when needed.
17
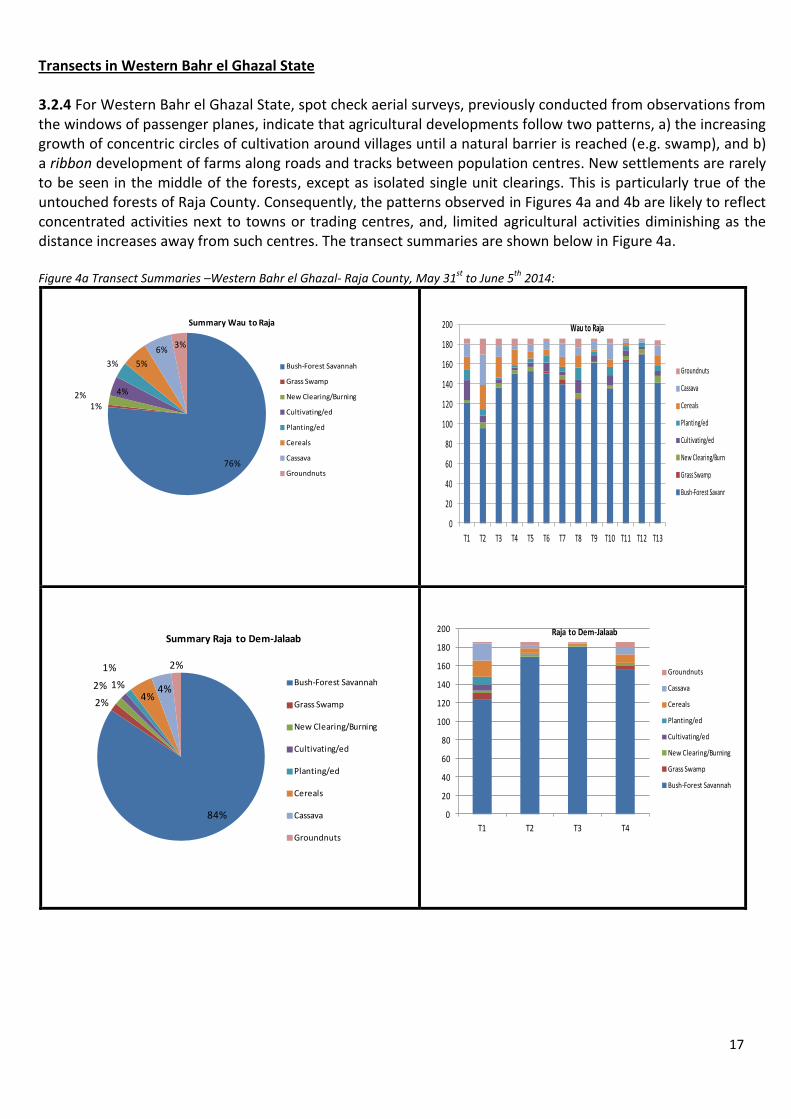
Transects in Western Bahr el Ghazal State 3.2.4 For Western Bahr el Ghazal State, spot check aerial surveys, previously conducted from observations from the windows of passenger planes, indicate that agricultural developments follow two patterns, a) the increasing growth of concentric circles of cultivation around villages until a natural barrier is reached (e.g. swamp), and b) a ribbon development of farms along roads and tracks between population centres. New settlements are rarely to be seen in the middle of the forests, except as isolated single unit clearings. This is particularly true of the untouched forests of Raja County. Consequently, the patterns observed in Figures 4a and 4b are likely to reflect concentrated activities next to towns or trading centres, and, limited agricultural activities diminishing as the distance increases away from such centres. The transect summaries are shown below in Figure 4a. Figure 4a Transect Summaries –Western Bahr el Ghazal- Raja County, May 31
st to June 5
th 2014:
0
20
40
60
80
100
120
140
160
180
200
T1 T2 T3 T4
Raja to Dem-Jalaab
Groundnuts
Cassava
Cereals
Planting/ed
Cultivating/ed
New Clearing/Burning
Grass Swamp
Bush-Forest Savannah
84%
2%
2% 1%
1%
4%4%
2%
Summary Raja to Dem-Jalaab
Bush-Forest Savannah
Grass Swamp
New Clearing/Burning
Cultivating/ed
Planting/ed
Cereals
Cassava
Groundnuts
76%
1%2% 4%
3% 5%
6%3%
Summary Wau to Raja
Bush-Forest Savannah
Grass Swamp
New Clearing/Burning
Cultivating/ed
Planting/ed
Cereals
Cassava
Groundnuts
0
20
40
60
80
100
120
140
160
180
200
T1 T2 T3 T4 T5 T6 T7 T8 T9 T10 T11 T12 T13
Wau to Raja
Groundnuts
Cassava
Cereals
Planting/ed
Cultivating/ed
New Clearing/Burning
Grass Swamp
Bush-Forest Savannah

18
3.2.5 Points from the Raja County transects in Figure 4a:-
Bush-forest-savannah dominates observations, averaging 76% along the six hour transect from Wau to Raja, increasing in dominance with distance away from town and trading centre locations.
Grassland swamp, as noted by standing water and dominant vegetation, is minimal at 1%.
Clearing, cultivating and planting were still on-going at the time of the transect, adding a further 9% of potential cropping to the 14% noted (cassava-6%; cereals-5%; ground-nuts -3%).
Indicators along the major transect (Wau to Raja) and the minor transect Raja to Dem Jalaab follow the expected pattern.
Transect to Khor Shaman suggests a major farming area with a consistent 34% agricultural occupancy.
Cereals and cassava are of similar occupying importance in locations to Dem Jalaab but not in Khor Shamam where a) cereals occupy a larger area than the other crops combined and b) first year cassava planting is matched by groundnut planting (mixed cropping).
Figure 4b Transect Summaries – Western Bahr el Ghazal- Wau County (Buseri and T1, the first 30 minute cluster to Mapel), and Jur River County (Udici and clusters T2 and T3 Mapel), June 4
th to 6
th 2014:
63%
3%
2%
1%
2%
16%
7% 6%
Summary Raja to Khor Shamam
Bush-Forest Savannah
Grass Swamp
New Clearing/Burning Cultivating/ed
Planting/ed
0
20
40
60
80
100
120
140
160
180
200
T1 T2
Raja to Khor Shamam
Groundnuts
Cassava
Cereals
Planting/ed
Cultivating/ed
New Clearing/Burning
Grass Swamp
Bush-Forest Savannah
51%
11%1%
6%
3%
11%
4%
13%
Summary Wau to Buseri
Bush-Forest Savannah
Grass Swamp
New Clearing/Burning
Cultivating/ed
Planting/ed
Cereals
Cassava
Groundnuts
0
50
100
150
200
250
T1
Wau to Buseri
Groundnuts
Cassava
Cereals
Planting/ed
Cultivating/ed
New Clearing/Burning
Grass Swamp
Bush-Forest Savannah
19
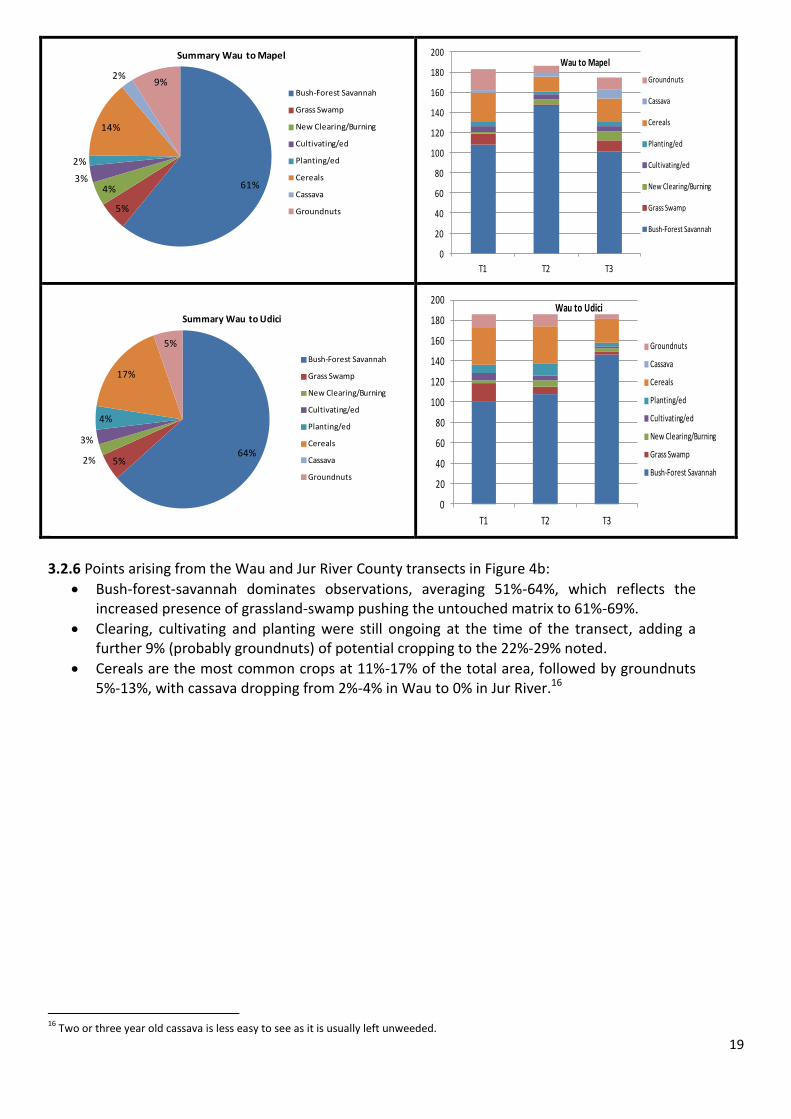
3.2.6 Points arising from the Wau and Jur River County transects in Figure 4b:
Bush-forest-savannah dominates observations, averaging 51%-64%, which reflects the increased presence of grassland-swamp pushing the untouched matrix to 61%-69%.
Clearing, cultivating and planting were still ongoing at the time of the transect, adding a further 9% (probably groundnuts) of potential cropping to the 22%-29% noted.
Cereals are the most common crops at 11%-17% of the total area, followed by groundnuts 5%-13%, with cassava dropping from 2%-4% in Wau to 0% in Jur River.16
16
Two or three year old cassava is less easy to see as it is usually left unweeded.
61%
5%
4%3%
2%
14%
2%9%
Summary Wau to Mapel
Bush-Forest Savannah
Grass Swamp
New Clearing/Burning
Cultivating/ed
Planting/ed
Cereals
Cassava
Groundnuts
0
20
40
60
80
100
120
140
160
180
200
T1 T2 T3
Wau to Mapel
Groundnuts
Cassava
Cereals
Planting/ed
Cultivating/ed
New Clearing/Burning
Grass Swamp
Bush-Forest Savannah
64%5%2%
3%
4%
17%
5%
Summary Wau to Udici
Bush-Forest Savannah
Grass Swamp
New Clearing/Burning
Cultivating/ed
Planting/ed
Cereals
Cassava
Groundnuts
0
20
40
60
80
100
120
140
160
180
200
T1 T2 T3
Wau to Udici
Groundnuts
Cassava
Cereals
Planting/ed
Cultivating/ed
New Clearing/Burning
Grass Swamp
Bush-Forest Savannah
20
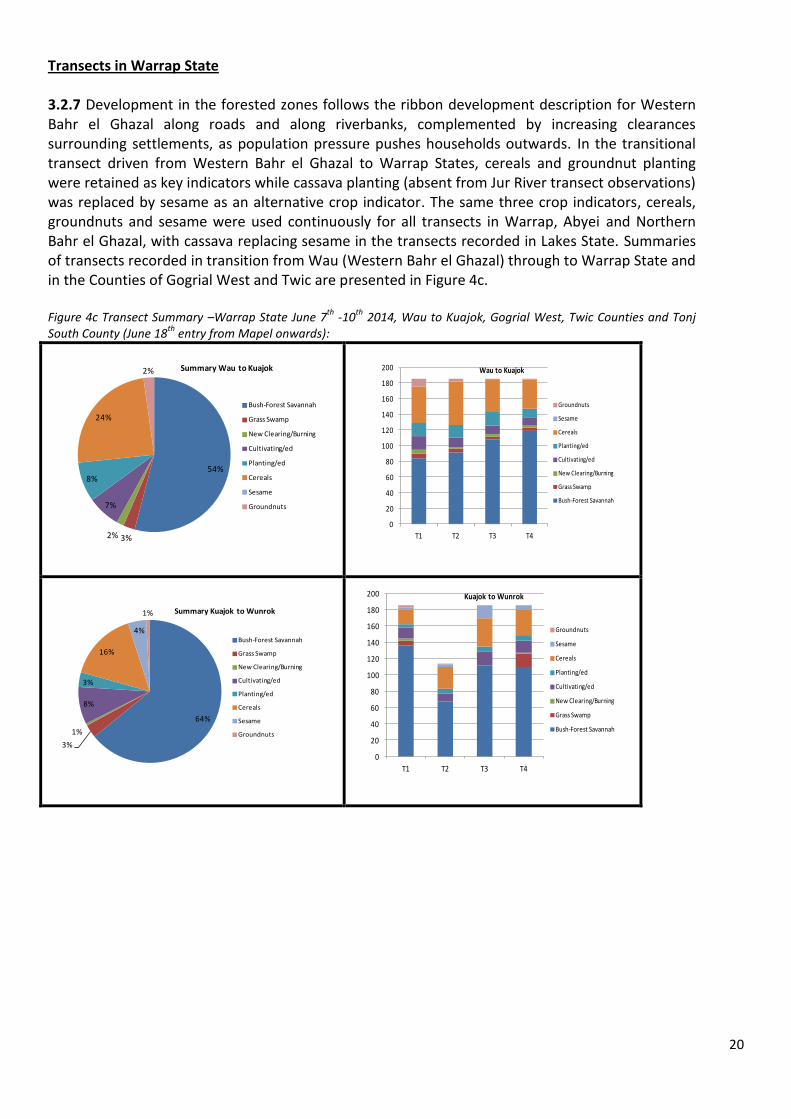
Transects in Warrap State 3.2.7 Development in the forested zones follows the ribbon development description for Western Bahr el Ghazal along roads and along riverbanks, complemented by increasing clearances surrounding settlements, as population pressure pushes households outwards. In the transitional transect driven from Western Bahr el Ghazal to Warrap States, cereals and groundnut planting were retained as key indicators while cassava planting (absent from Jur River transect observations) was replaced by sesame as an alternative crop indicator. The same three crop indicators, cereals, groundnuts and sesame were used continuously for all transects in Warrap, Abyei and Northern Bahr el Ghazal, with cassava replacing sesame in the transects recorded in Lakes State. Summaries of transects recorded in transition from Wau (Western Bahr el Ghazal) through to Warrap State and in the Counties of Gogrial West and Twic are presented in Figure 4c. Figure 4c Transect Summary –Warrap State June 7
th -10
th 2014, Wau to Kuajok, Gogrial West, Twic Counties and Tonj
South County (June 18th
entry from Mapel onwards):
0
20
40
60
80
100
120
140
160
180
200
T1 T2 T3 T4
Kuajok to Wunrok
Groundnuts
Sesame
Cereals
Planting/ed
Cultivating/ed
New Clearing/Burning
Grass Swamp
Bush-Forest Savannah
54%
3%2%
7%
8%
24%
2% Summary Wau to Kuajok
Bush-Forest Savannah
Grass Swamp
New Clearing/Burning
Cultivating/ed
Planting/ed
Cereals
Sesame
Groundnuts
64%
3%
1%
8%
3%
16%
4%
1% Summary Kuajok to Wunrok
Bush-Forest Savannah
Grass Swamp
New Clearing/Burning
Cultivating/ed
Planting/ed
Cereals
Sesame
Groundnuts
0
20
40
60
80
100
120
140
160
180
200
T1 T2 T3 T4
Wau to Kuajok
Groundnuts
Sesame
Cereals
Planting/ed
Cultivating/ed
New Clearing/Burning
Grass Swamp
Bush-Forest Savannah
21
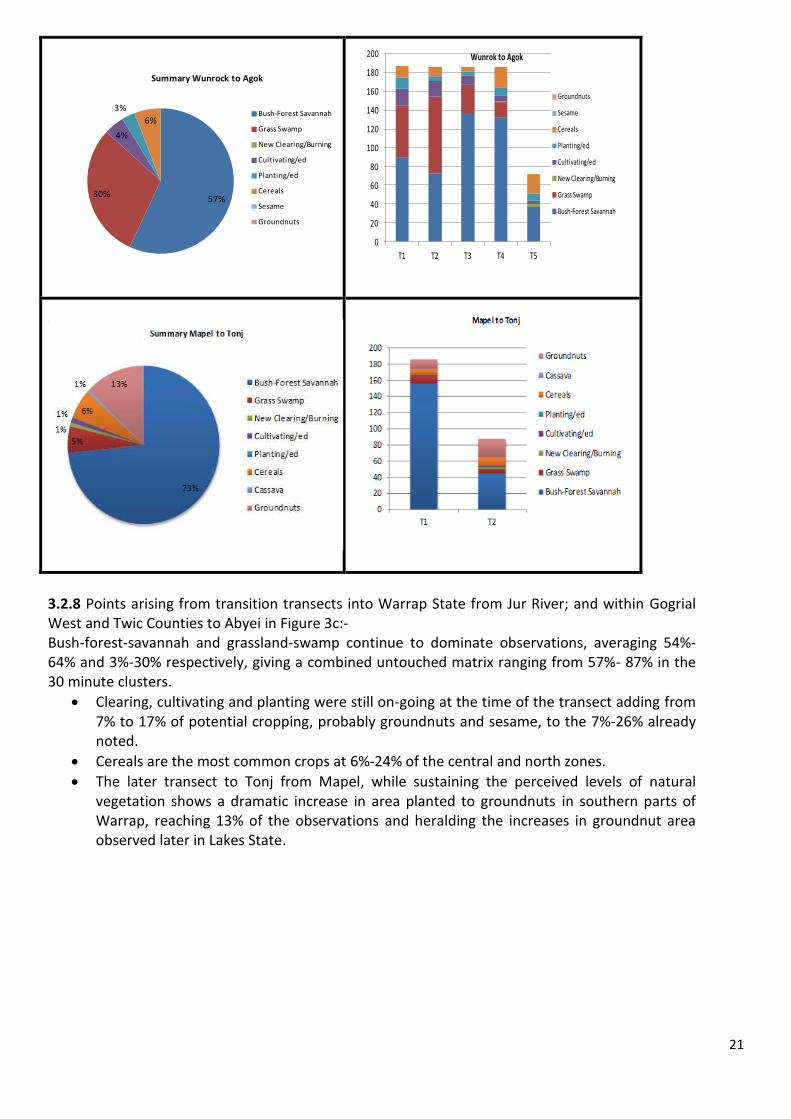
3.2.8 Points arising from transition transects into Warrap State from Jur River; and within Gogrial West and Twic Counties to Abyei in Figure 3c:- Bush-forest-savannah and grassland-swamp continue to dominate observations, averaging 54%-64% and 3%-30% respectively, giving a combined untouched matrix ranging from 57%- 87% in the 30 minute clusters.
Clearing, cultivating and planting were still on-going at the time of the transect adding from 7% to 17% of potential cropping, probably groundnuts and sesame, to the 7%-26% already noted.
Cereals are the most common crops at 6%-24% of the central and north zones.
The later transect to Tonj from Mapel, while sustaining the perceived levels of natural vegetation shows a dramatic increase in area planted to groundnuts in southern parts of Warrap, reaching 13% of the observations and heralding the increases in groundnut area observed later in Lakes State.
0
20
40
60
80
100
120
140
160
180
200
T1 T2 T3 T4 T5
Wunrok to Agok
Groundnuts
Sesame
Cereals
Planting/ed
Cultivating/ed
New Clearing/Burning
Grass Swamp
Bush-Forest Savannah
57%30%
4%
3%
6%
Summary Wunrock to Agok
Bush-Forest Savannah
Grass Swamp
New Clearing/Burning
Cultivating/ed
Planting/ed
Cereals
Sesame
Groundnuts
22
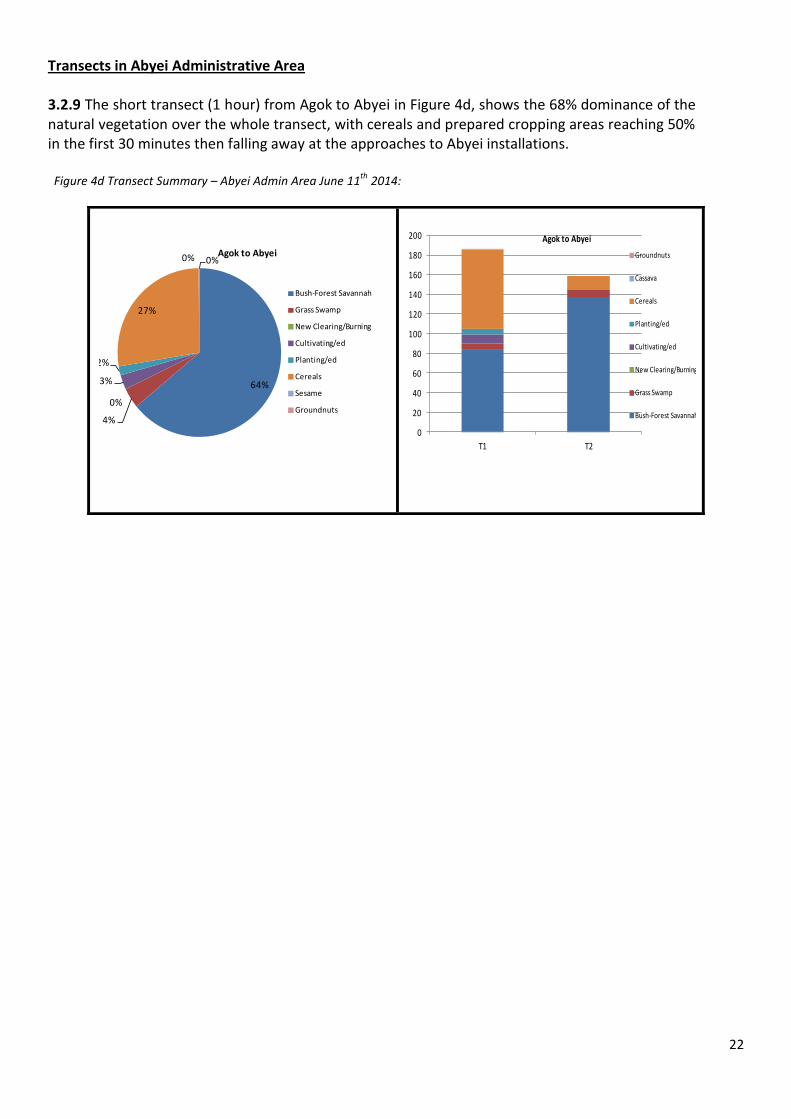
Transects in Abyei Administrative Area 3.2.9 The short transect (1 hour) from Agok to Abyei in Figure 4d, shows the 68% dominance of the natural vegetation over the whole transect, with cereals and prepared cropping areas reaching 50% in the first 30 minutes then falling away at the approaches to Abyei installations. Figure 4d Transect Summary – Abyei Admin Area June 11
th 2014:
0
20
40
60
80
100
120
140
160
180
200
T1 T2
Agok to Abyei
Groundnuts
Cassava
Cereals
Planting/ed
Cultivating/ed
New Clearing/Burning
Grass Swamp
Bush-Forest Savannah
64%
4%
0%
3%
2%
27%
0% 0%Agok to Abyei
Bush-Forest Savannah
Grass Swamp
New Clearing/Burning
Cultivating/ed
Planting/ed
Cereals
Sesame
Groundnuts
23
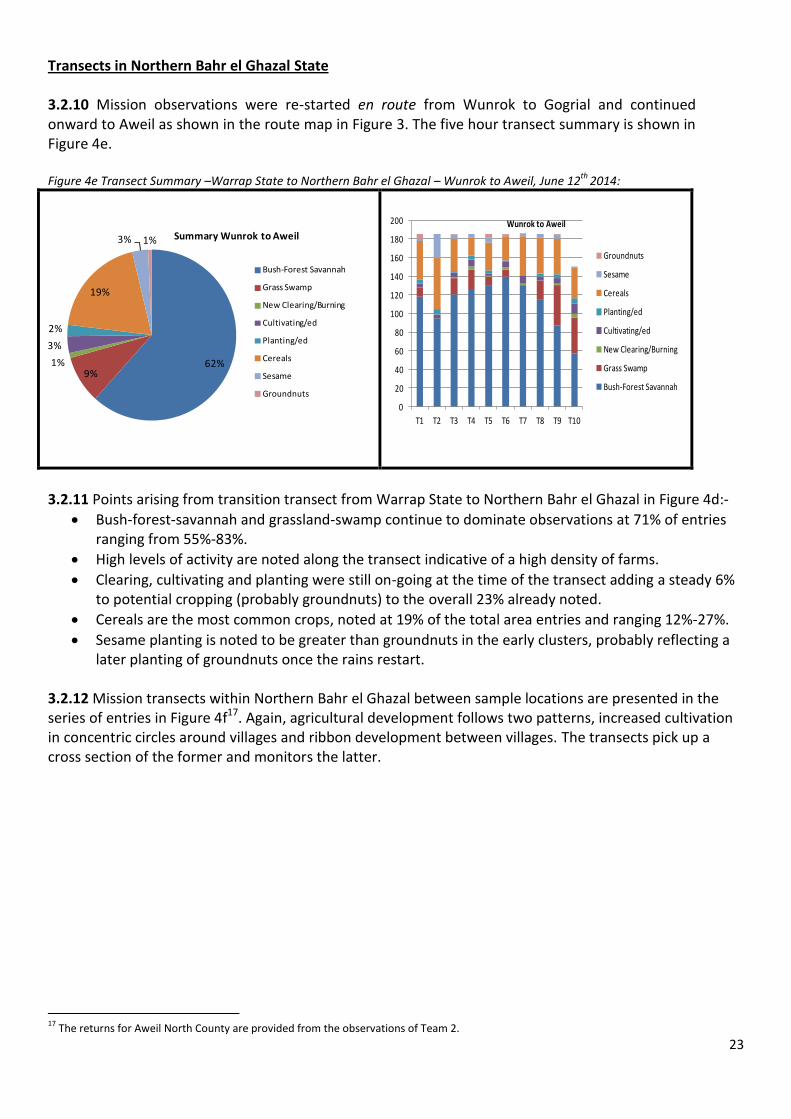
Transects in Northern Bahr el Ghazal State 3.2.10 Mission observations were re-started en route from Wunrok to Gogrial and continued onward to Aweil as shown in the route map in Figure 3. The five hour transect summary is shown in Figure 4e. Figure 4e Transect Summary –Warrap State to Northern Bahr el Ghazal – Wunrok to Aweil, June 12
th 2014:
3.2.11 Points arising from transition transect from Warrap State to Northern Bahr el Ghazal in Figure 4d:-
Bush-forest-savannah and grassland-swamp continue to dominate observations at 71% of entries ranging from 55%-83%.
High levels of activity are noted along the transect indicative of a high density of farms.
Clearing, cultivating and planting were still on-going at the time of the transect adding a steady 6% to potential cropping (probably groundnuts) to the overall 23% already noted.
Cereals are the most common crops, noted at 19% of the total area entries and ranging 12%-27%.
Sesame planting is noted to be greater than groundnuts in the early clusters, probably reflecting a later planting of groundnuts once the rains restart.
3.2.12 Mission transects within Northern Bahr el Ghazal between sample locations are presented in the series of entries in Figure 4f17. Again, agricultural development follows two patterns, increased cultivation in concentric circles around villages and ribbon development between villages. The transects pick up a cross section of the former and monitors the latter.
17
The returns for Aweil North County are provided from the observations of Team 2.
62%9%
1%
3%
2%
19%
3% 1% Summary Wunrok to Aweil
Bush-Forest Savannah
Grass Swamp
New Clearing/Burning
Cultivating/ed
Planting/ed
Cereals
Sesame
Groundnuts
0
20
40
60
80
100
120
140
160
180
200
T1 T2 T3 T4 T5 T6 T7 T8 T9 T10
Wunrok to Aweil
Groundnuts
Sesame
Cereals
Planting/ed
Cultivating/ed
New Clearing/Burning
Grass Swamp
Bush-Forest Savannah
24
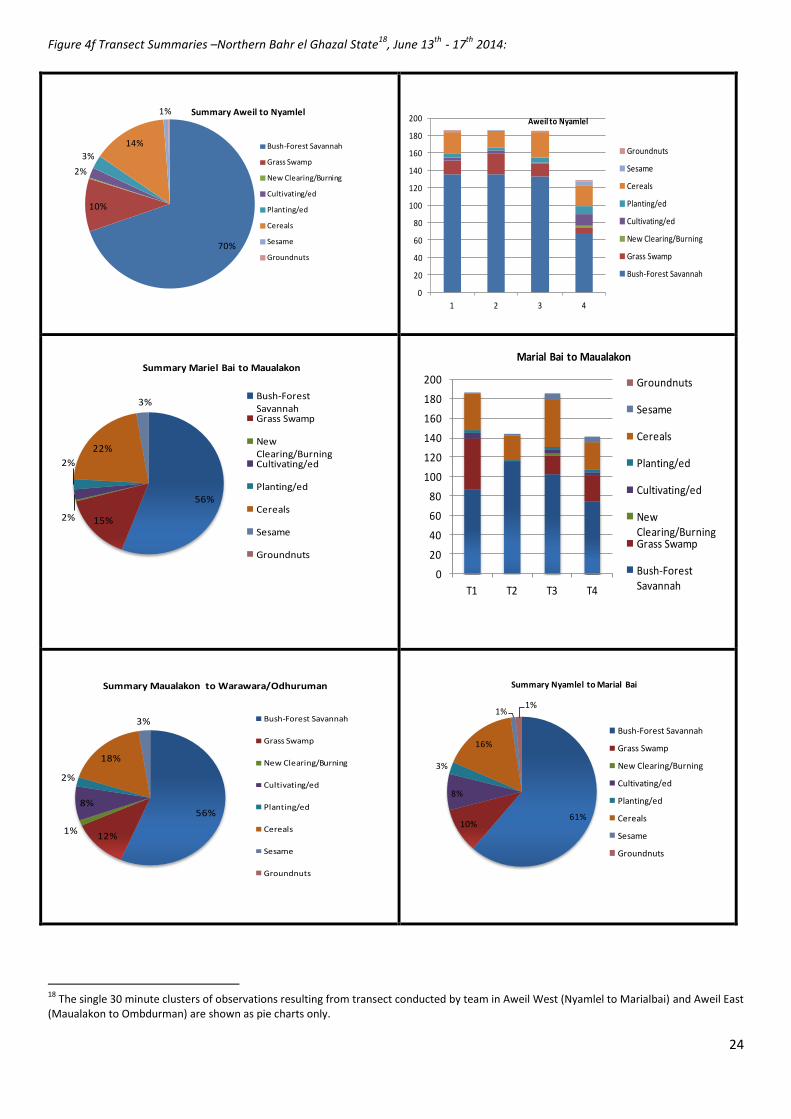
Figure 4f Transect Summaries –Northern Bahr el Ghazal State18
, June 13th
- 17th
2014:
18
The single 30 minute clusters of observations resulting from transect conducted by team in Aweil West (Nyamlel to Marialbai) and Aweil East (Maualakon to Ombdurman) are shown as pie charts only.
0
20
40
60
80
100
120
140
160
180
200
1 2 3 4
Aweil to Nyamlel
Groundnuts
Sesame
Cereals
Planting/ed
Cultivating/ed
New Clearing/Burning
Grass Swamp
Bush-Forest Savannah
56%
12%1%
8%
2%
18%
3%
Summary Maualakon to Warawara/Odhuruman
Bush-Forest Savannah
Grass Swamp
New Clearing/Burning
Cultivating/ed
Planting/ed
Cereals
Sesame
Groundnuts
70%
10%
2%
3%
14%
1% Summary Aweil to Nyamlel
Bush-Forest Savannah
Grass Swamp
New Clearing/Burning
Cultivating/ed
Planting/ed
Cereals
Sesame
Groundnuts
56%
15%2%
2%
22%
3%
Summary Mariel Bai to Maualakon
Bush-Forest SavannahGrass Swamp
New Clearing/BurningCultivating/ed
Planting/ed
Cereals
Sesame
Groundnuts
0
20
40
60
80
100
120
140
160
180
200
T1 T2 T3 T4
Marial Bai to Maualakon
Groundnuts
Sesame
Cereals
Planting/ed
Cultivating/ed
New Clearing/BurningGrass Swamp
Bush-Forest Savannah
61%10%
8%
3%
16%
1%1%
Summary Nyamlel to Marial Bai
Bush-Forest Savannah
Grass Swamp
New Clearing/Burning
Cultivating/ed
Planting/ed
Cereals
Sesame
Groundnuts

25
3.2.13 Points arising from transects within Northern Bahr el Ghazal in Figure 4f:
Bush-forest-savannah and grassland-swamp continue to dominate observations at around 80% of entries ranging from 78%-84%.
60%13%
1%3%
2%
19%
2%
Summary Aweil to Malek Alel
Bush-Forest Savannah
Grass Swamp
New Clearing/Burning
Cultivating/ed
Planting/ed
Cereals
Cassava
Groundnuts0
20
40
60
80
100
120
140
160
180
200
T1 T2 T3
Aweil to Malek Alel
Groundnuts
Sesame
Cereals
Planting/ed
Cultivating/ed
New Clearing/Burning
Grass Swamp
Bush-Forest Savannah
0
20
40
60
80
100
120
140
160
180
200
T1 T2 T3
Summary Aweil North to Maualakon
Groundnuts
simsim
cereals
planting/ed
Cultivating/ed
New Clearing /Burning
Grass/Swamp
Bush-Forest Savannah
84%
15%
1%
Summary Aweil North to Maualakon
Bush-Forest Savannah
Grass/Swamp
New Clearing /Burning
Cultivating/ed
planting/ed
cereals
simsim
Groundnuts
0
20
40
60
80
100
120
140
160
180
200
T1 T2 T4
Summary Nyamel to Aweil North
Groundnuts
simsim
cereals
planting/ed
Cultivating/ed
New Clearing /Burning
Grass/Swamp
Bush-Forest Savannah82%
2%
1%1% 14%
Summary Nyamel to Aweil North
Bush-Forest Savannah
Grass/Swamp
New Clearing /Burning
Cultivating/ed
planting/ed
cereals
simsim
Groundnuts
26
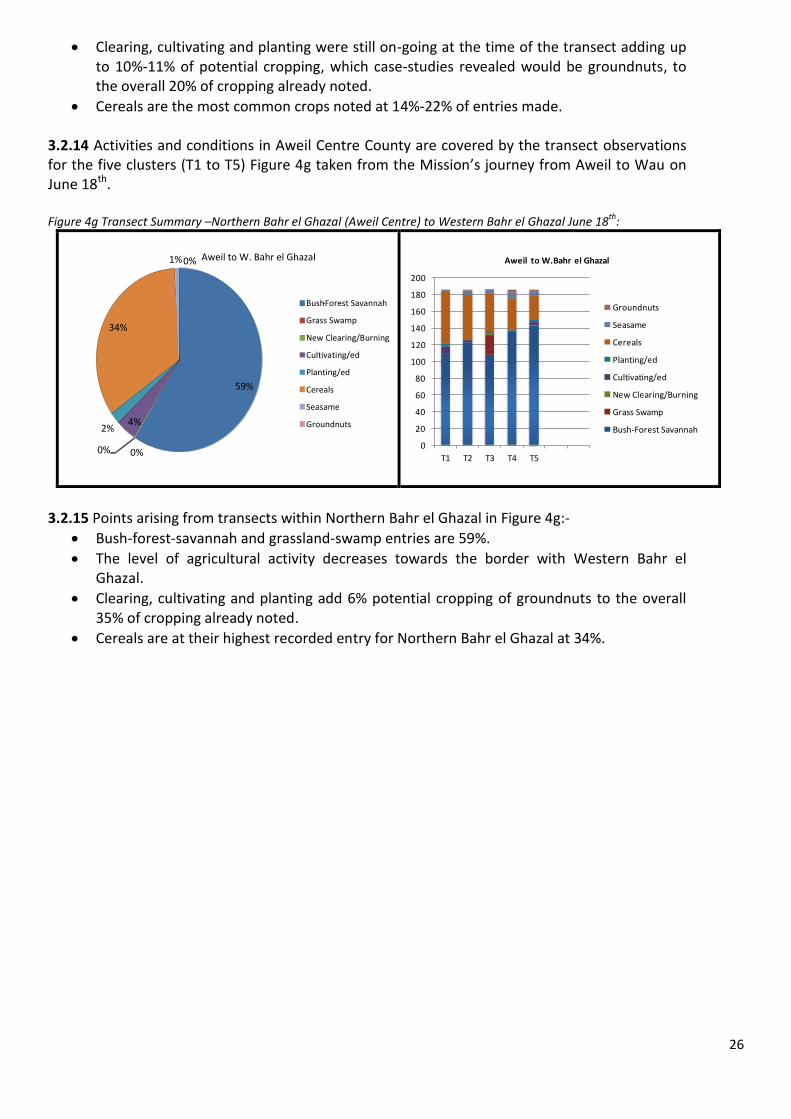
Clearing, cultivating and planting were still on-going at the time of the transect adding up to 10%-11% of potential cropping, which case-studies revealed would be groundnuts, to the overall 20% of cropping already noted.
Cereals are the most common crops noted at 14%-22% of entries made. 3.2.14 Activities and conditions in Aweil Centre County are covered by the transect observations for the five clusters (T1 to T5) Figure 4g taken from the Mission’s journey from Aweil to Wau on June 18th. Figure 4g Transect Summary –Northern Bahr el Ghazal (Aweil Centre) to Western Bahr el Ghazal June 18
th:
3.2.15 Points arising from transects within Northern Bahr el Ghazal in Figure 4g:-
Bush-forest-savannah and grassland-swamp entries are 59%.
The level of agricultural activity decreases towards the border with Western Bahr el Ghazal.
Clearing, cultivating and planting add 6% potential cropping of groundnuts to the overall 35% of cropping already noted.
Cereals are at their highest recorded entry for Northern Bahr el Ghazal at 34%.
0
20
40
60
80
100
120
140
160
180
200
T1 T2 T3 T4 T5
Aweil to W.Bahr el Ghazal
Groundnuts
Seasame
Cereals
Planting/ed
Cultivating/ed
New Clearing/Burning
Grass Swamp
Bush-Forest Savannah
59%
0% 0%
4% 2%
34%
1% 0% Aweil to W. Bahr el Ghazal
Bush - Forest Savannah Grass Swamp New Clearing/Burning Cultivating/ed Planting/ed Cereals Seasame Groundnuts
27
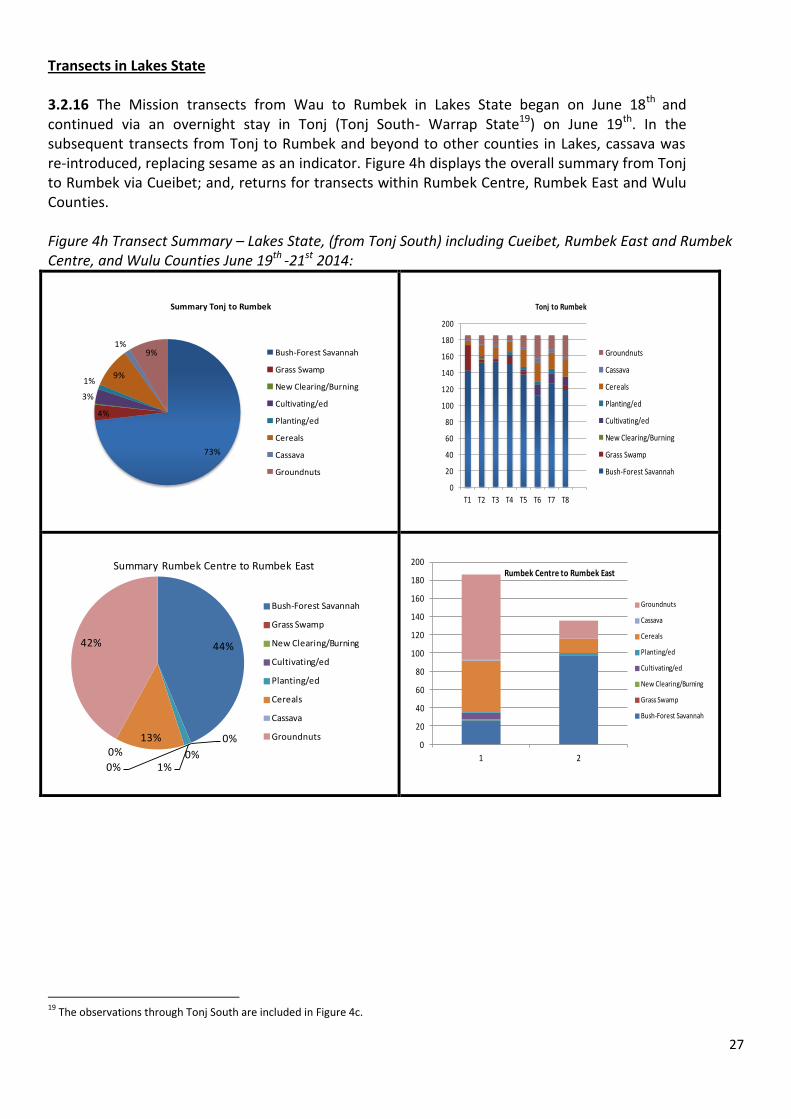
Transects in Lakes State 3.2.16 The Mission transects from Wau to Rumbek in Lakes State began on June 18th and continued via an overnight stay in Tonj (Tonj South- Warrap State19) on June 19th. In the subsequent transects from Tonj to Rumbek and beyond to other counties in Lakes, cassava was re-introduced, replacing sesame as an indicator. Figure 4h displays the overall summary from Tonj to Rumbek via Cueibet; and, returns for transects within Rumbek Centre, Rumbek East and Wulu Counties. Figure 4h Transect Summary – Lakes State, (from Tonj South) including Cueibet, Rumbek East and Rumbek Centre, and Wulu Counties June 19th -21st 2014:
19
The observations through Tonj South are included in Figure 4c.
44%
0%
0%0%
1%
13%0%
42%
Summary Rumbek Centre to Rumbek East
Bush-Forest Savannah
Grass Swamp
New Clearing/Burning
Cultivating/ed
Planting/ed
Cereals
Cassava
Groundnuts0
20
40
60
80
100
120
140
160
180
200
1 2
Rumbek Centre to Rumbek East
Groundnuts
Cassava
Cereals
Planting/ed
Cultivating/ed
New Clearing/Burning
Grass Swamp
Bush-Forest Savannah
73%
4%
3%
1%9%
1%9%
Summary Tonj to Rumbek
Bush-Forest Savannah
Grass Swamp
New Clearing/Burning
Cultivating/ed
Planting/ed
Cereals
Cassava
Groundnuts
0
20
40
60
80
100
120
140
160
180
200
T1 T2 T3 T4 T5 T6 T7 T8
Tonj to Rumbek
Groundnuts
Cassava
Cereals
Planting/ed
Cultivating/ed
New Clearing/Burning
Grass Swamp
Bush-Forest Savannah
28
3.2.17 Points arising from transects within Lakes in Figure 4h:-
Although high in the transition zone from Warrap to Lakes at 73%, bush-forest-savannah falls to its lowest in the transect from Rumbek to Aduel, incorporating Rumbek Centre to Rumbek East.
Cropping in the Rumbek Centre to Rumbek East transect at 56% exceeds the maximum planting in the peasant sub-sector (50%) through the inclusion of mechanised areas noted in case-studies to be the effect of high levels of adoption of animal traction.
Clearing, cultivating and planting add 8% potential cropping in other areas.
Groundnuts20 are the dominant crop in Rumbek East, Rumbek Centre and Wulu Counties at 9%-42% of the total area depending on location.
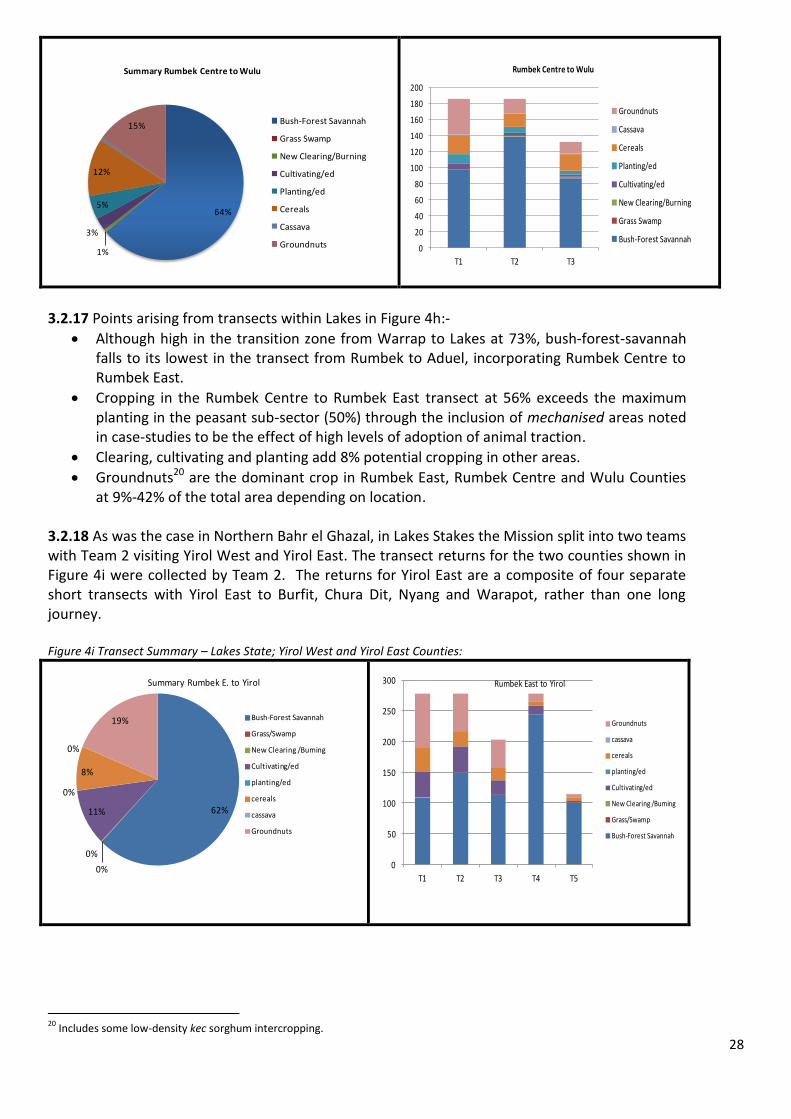
3.2.18 As was the case in Northern Bahr el Ghazal, in Lakes Stakes the Mission split into two teams with Team 2 visiting Yirol West and Yirol East. The transect returns for the two counties shown in Figure 4i were collected by Team 2. The returns for Yirol East are a composite of four separate short transects with Yirol East to Burfit, Chura Dit, Nyang and Warapot, rather than one long journey. Figure 4i Transect Summary – Lakes State; Yirol West and Yirol East Counties:
20
Includes some low-density kec sorghum intercropping.
0
20
40
60
80
100
120
140
160
180
200
T1 T2 T3
Rumbek Centre to Wulu
Groundnuts
Cassava
Cereals
Planting/ed
Cultivating/ed
New Clearing/Burning
Grass Swamp
Bush-Forest Savannah
64%
1%
3%
5%
12%
15%
Summary Rumbek Centre to Wulu
Bush-Forest Savannah
Grass Swamp
New Clearing/Burning
Cultivating/ed
Planting/ed
Cereals
Cassava
Groundnuts
0
50
100
150
200
250
300
T1 T2 T3 T4 T5
Rumbek East to Yirol
Groundnuts
cassava
cereals
planting/ed
Cultivating/ed
New Clearing /Burning
Grass/Swamp
Bush-Forest Savannah
62%
0%
0%
11%
0%
8%
0%
19%
Summary Rumbek E. to Yirol
Bush-Forest Savannah
Grass/Swamp
New Clearing /Burning
Cultivating/ed
planting/ed
cereals
cassava
Groundnuts
29
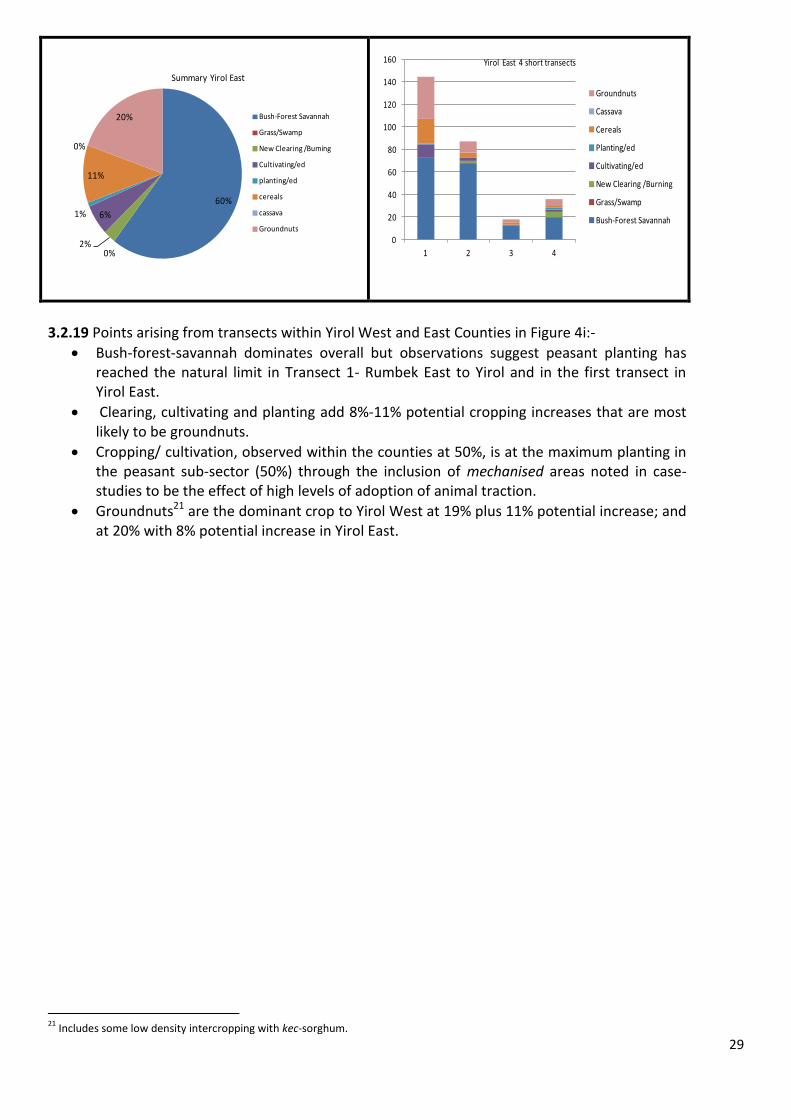
3.2.19 Points arising from transects within Yirol West and East Counties in Figure 4i:-
Bush-forest-savannah dominates overall but observations suggest peasant planting has reached the natural limit in Transect 1- Rumbek East to Yirol and in the first transect in Yirol East.
Clearing, cultivating and planting add 8%-11% potential cropping increases that are most likely to be groundnuts.
Cropping/ cultivation, observed within the counties at 50%, is at the maximum planting in the peasant sub-sector (50%) through the inclusion of mechanised areas noted in case-studies to be the effect of high levels of adoption of animal traction.
Groundnuts21 are the dominant crop to Yirol West at 19% plus 11% potential increase; and at 20% with 8% potential increase in Yirol East.
21
Includes some low density intercropping with kec-sorghum.
0
20
40
60
80
100
120
140
160
1 2 3 4
Yirol East 4 short transects
Groundnuts
Cassava
Cereals
Planting/ed
Cultivating/ed
New Clearing /Burning
Grass/Swamp
Bush-Forest Savannah
60%
0%2%
6%1%
11%
0%
20%
Summary Yirol East
Bush-Forest Savannah
Grass/Swamp
New Clearing /Burning
Cultivating/ed
planting/ed
cereals
cassava
Groundnuts
30
Conclusion re-Transects in Greater Bahr el Ghazal 3.2.20 The transects provide a snap-shot of agricultural activities at planting time along the main roads and in specific locations. The results suggest that planting has proceeded well in the counties visited, suggesting an expansion of areas within farms, between farms and in new areas within the forested zones. This suggests access to land and farmer confidence has not been reduced by crisis-related events in the past 6 months, in the counties visited by the Mission. 3.2.21 Cereal crops, particularly sorghum (as maize has only a backyard role in most areas of Greater Bahr el Ghazal) are ubiquitous, dominating planting in Northern Bahr el Ghazal and north counties of Warrap, where sesame (home use and sale) is noted in monocultures of increasing importance. Cereal’s (sorghum) frequency of appearance is matched and often exceeded by groundnuts in the Lakes counties visited and in Tonj South. Much of the groundnut area was inter-cropped with low densities of cereal planting (kec, a long-cycle sorghum), which are not included in the cereal observation returns but which will contribute to the harvest. 3.2.22 In Western Bahr el Ghazal, the role of cassava as both a main staple and food security safety-net is very apparent from the frequency of growing crops and new plantings in Raja County; but, is less obvious in the returns from Wau County, and is not at all obvious in returns from Jur River County due to a greater presence of cattle22. The returns from the counties traversed in Lakes are also low in cassava observation, possibly for similar reasons as cattle numbers are high and cassava crops in the forest cannot be protected. 3.2.23 Except in the following instances where, reportedly, households have been displaced or have been disturbed during their early season activities, the observation that access to land is normal suggested by transect observations is substantiated by the farmer case-studies and key informant interviews. Exceptions reported:
Warrap State-in Twic County 800 hh displaced due to feuding near Aweng; in Tonj South-500 hh displaced by local issues including feuding, raiding and robbery in some 12 villages.
Lakes State- in Rumbek East and Rumbek Centre some 1000 hh from 20 villages are reportedly affected by internecine feuding/ raiding and robbery; and, Wulu- 175 hh displaced in April due to feuding/ raiding and robbery. Internecine incidents involving arms were also reported in locations in Cueibet (no numbers available).
22
Key informant interviews: “cattle destroy cassava”.

31
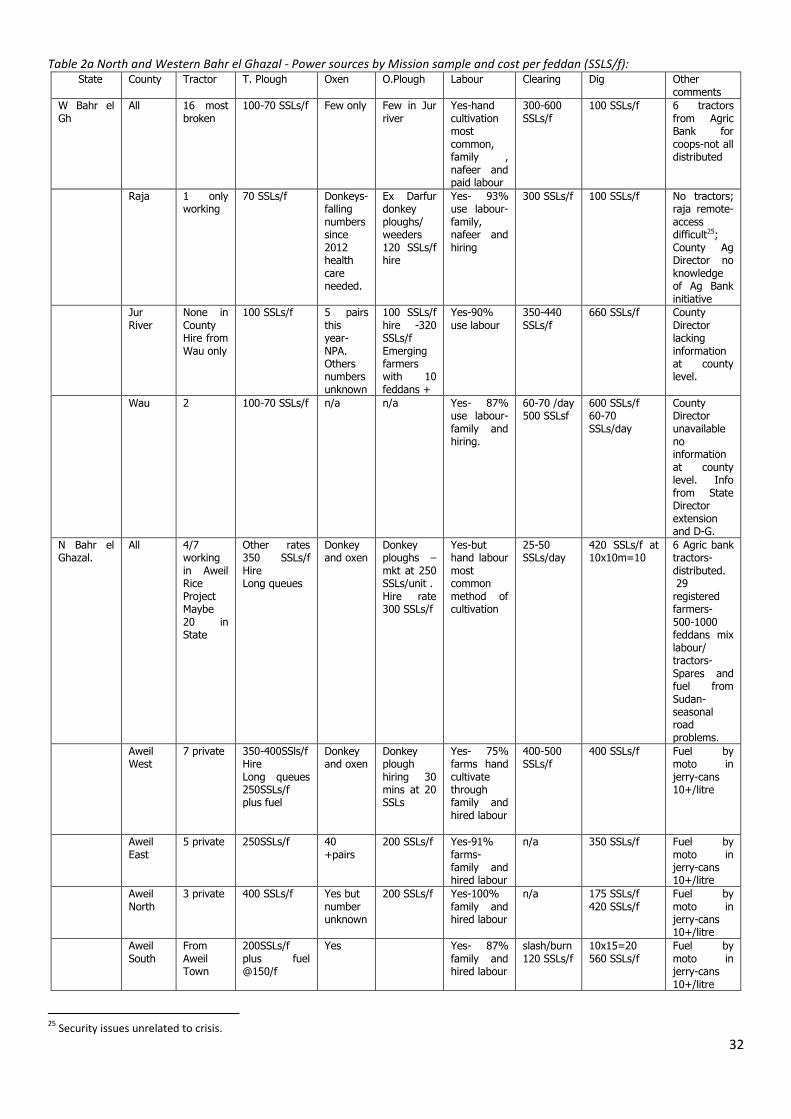
3.3 Power sources 3.3.1 As noted in the introduction, South Sudan’s household-based, agricultural sub-sector is predominantly based on hand-digging families. Public sector tractor services are defined by the tractors that are not working rather than the services they provide; and the private sector services are few and suffer from access to spare parts. As no international tractor agencies are established in the Greater Bahr el Ghazal Region,23 all regularly changeable spares for tractors and farm machinery must be imported through cross-frontier actions by traders from Sudan with associated risks and high prices. The road to the north is open and access to fuel and spares for tractors is better than last year, however, tractor services are not noted to have improved in either State. 3.3.2 Table 2a provides information by county regarding the power sources used and charges levied this year in North and Western Bahr el Ghazal States, obtained from both case-studies and key informant interviews. Six new tractors in each state, provided for purchase by cooperatives on easy terms have yet to have an impact on area ploughed; and, as no spares have been delivered with the tractors and tractor driver training has not improved, it is unlikely that they will have any discernible impact for anything more than a few months. Apart from the tractor cadavers in each MoA compound, if any further example is needed to support this conclusion, consider the fact that the tractors left by GIZ at the hand-over of the rehabilitated Aweil Rice Project 2 years ago, have already succumbed to the predictable problems, with only 4/724 functioning at the end of the first year. Improving spare parts supply chains and training tractor drivers are obvious ways of making a significant impact to the effective use of machinery, but they appear to fall outside donor and NGO mandates and are, therefore, ignored. 3.3.3 At the same time, oxen ploughing, although present in Northern Bahr el Ghazal has not been embraced by farmers in Western Bahr el Ghazal; and, the donkey ploughing noted in 2012, initiated among refugees and returnees from Darfur, has not been adopted with the enthusiasm expected, apparently due to the high cost of donkeys and increased mortality rates. The organised introduction of two-wheeled walking tractors offers a solution to the impasse in Western Bahr el Ghazal as to how to extend cultivated area in the county which arises because, despite official statistics, cattle (oxen) are not raised in any quantity in the area; donkey- based traction has not expanded as hoped two years ago.
23
Juba-Caterpillar with Massey Ferguson a possible exception.
24 Key informant interviews/ case study interviews (2014)
32
Table 2a North and Western Bahr el Ghazal - Power sources by Mission sample and cost per feddan (SSLS/f):
State County Tractor T. Plough Oxen O.Plough Labour Clearing Dig Other comments
W Bahr el Gh
All 16 most broken
100-70 SSLs/f Few only Few in Jur river
Yes-hand cultivation most common, family , nafeer and paid labour
300-600 SSLs/f
100 SSLs/f 6 tractors from Agric Bank for coops-not all distributed
Raja 1 only working
70 SSLs/f Donkeys- falling numbers since 2012 health care needed.
Ex Darfur donkey ploughs/ weeders 120 SSLs/f hire
Yes- 93% use labour- family, nafeer and hiring
300 SSLs/f 100 SSLs/f No tractors; raja remote- access difficult25; County Ag Director no knowledge of Ag Bank initiative
Jur River
None in County Hire from Wau only
100 SSLs/f 5 pairs this year- NPA. Others numbers unknown
100 SSLs/f hire -320 SSLs/f Emerging farmers with 10 feddans +
Yes-90% use labour
350-440 SSLs/f
660 SSLs/f County Director lacking information at county level.
Wau 2 100-70 SSLs/f n/a n/a Yes- 87% use labour- family and hiring.
60-70 /day 500 SSLsf
600 SSLs/f 60-70 SSLs/day
County Director unavailable no information at county level. Info from State Director extension and D-G.
N Bahr el Ghazal.
All 4/7 working in Aweil Rice Project Maybe 20 in State
Other rates 350 SSLs/f Hire Long queues
Donkey and oxen
Donkey ploughs – mkt at 250 SSLs/unit . Hire rate 300 SSLs/f
Yes-but hand labour most common method of cultivation
25-50 SSLs/day
420 SSLs/f at 10x10m=10
6 Agric bank tractors- distributed. 29 registered farmers- 500-1000 feddans mix labour/ tractors- Spares and fuel from Sudan-seasonal road problems.
Aweil West
7 private 350-400SSls/f Hire Long queues 250SSLs/f plus fuel
Donkey and oxen
Donkey plough hiring 30 mins at 20 SSLs
Yes- 75% farms hand cultivate through family and hired labour
400-500 SSLs/f
400 SSLs/f Fuel by moto in jerry-cans 10+/litre
Aweil East
5 private 250SSLs/f 40 +pairs
200 SSLs/f Yes-91% farms- family and hired labour
n/a 350 SSLs/f Fuel by moto in jerry-cans 10+/litre
Aweil North
3 private 400 SSLs/f Yes but number unknown
200 SSLs/f Yes-100% family and hired labour
n/a 175 SSLs/f 420 SSLs/f
Fuel by moto in jerry-cans 10+/litre
Aweil South
From Aweil Town
200SSLs/f plus fuel @150/f
Yes Yes- 87% family and hired labour
slash/burn 120 SSLs/f
10x15=20 560 SSLs/f
Fuel by moto in jerry-cans 10+/litre
25
Security issues unrelated to crisis.
33
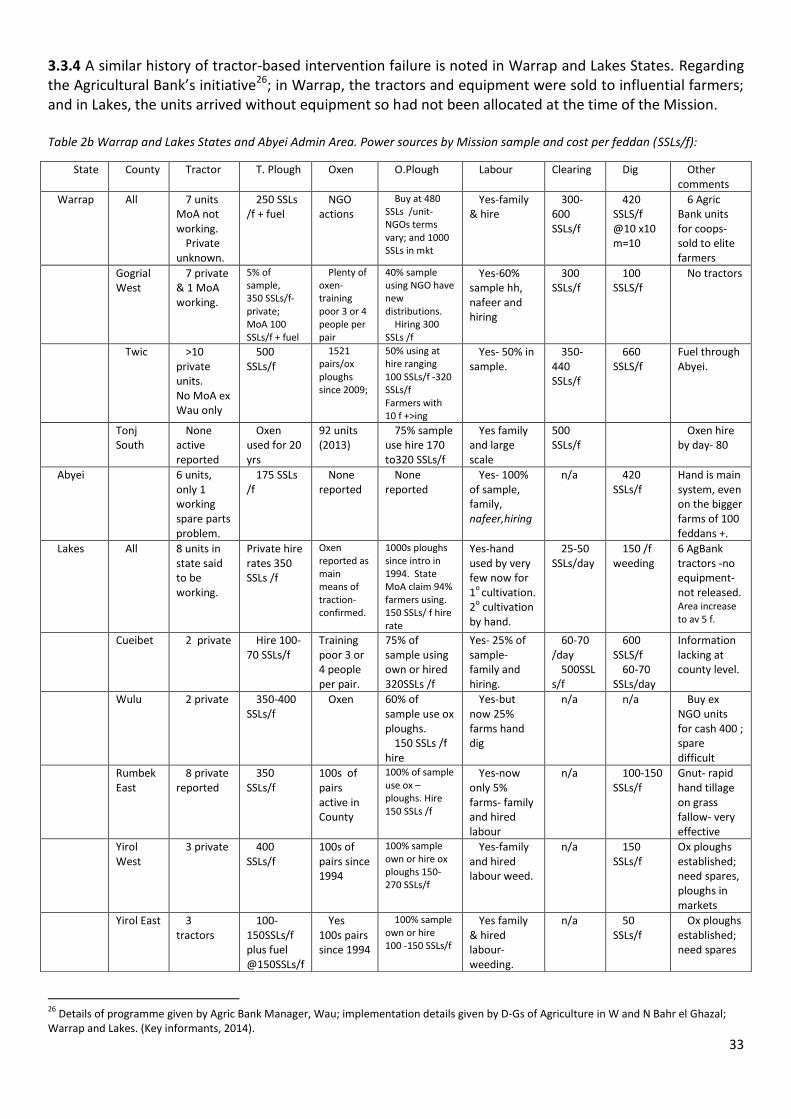
3.3.4 A similar history of tractor-based intervention failure is noted in Warrap and Lakes States. Regarding the Agricultural Bank’s initiative26; in Warrap, the tractors and equipment were sold to influential farmers; and in Lakes, the units arrived without equipment so had not been allocated at the time of the Mission. Table 2b Warrap and Lakes States and Abyei Admin Area. Power sources by Mission sample and cost per feddan (SSLs/f):
26
Details of programme given by Agric Bank Manager, Wau; implementation details given by D-Gs of Agriculture in W and N Bahr el Ghazal; Warrap and Lakes. (Key informants, 2014).
State County Tractor T. Plough Oxen O.Plough Labour Clearing Dig Other comments
Warrap All 7 units MoA not working.
Private unknown.
250 SSLs /f + fuel
NGO actions
Buy at 480 SSLs /unit-NGOs terms vary; and 1000 SSLs in mkt
Yes-family & hire
300-600 SSLs/f
420 SSLS/f @10 x10 m=10
6 Agric Bank units for coops-sold to elite farmers
Gogrial West
7 private & 1 MoA working.
5% of sample, 350 SSLs/f- private; MoA 100 SSLs/f + fuel
Plenty of oxen-training poor 3 or 4 people per pair
40% sample using NGO have new distributions.
Hiring 300 SSLs /f
Yes-60% sample hh, nafeer and hiring
300 SSLs/f
100 SSLS/f
No tractors
Twic >10 private units. No MoA ex Wau only
500 SSLs/f
1521 pairs/ox ploughs since 2009;
50% using at hire ranging 100 SSLs/f -320 SSLs/f Farmers with 10 f +>ing
Yes- 50% in sample.
350-440 SSLs/f
660 SSLS/f
Fuel through Abyei.
Tonj South
None active reported
Oxen used for 20 yrs
92 units (2013)
75% sample use hire 170 to320 SSLs/f
Yes family and large scale
500 SSLs/f
Oxen hire by day- 80
Abyei 6 units, only 1 working spare parts problem.
175 SSLs /f
None reported
None reported
Yes- 100% of sample, family, nafeer,hiring
n/a 420 SSLs/f
Hand is main system, even on the bigger farms of 100 feddans +.
Lakes All 8 units in state said to be working.
Private hire rates 350 SSLs /f
Oxen reported as main means of traction- confirmed.
1000s ploughs since intro in 1994. State MoA claim 94% farmers using. 150 SSLs/ f hire rate
Yes-hand used by very few now for 1
o cultivation.
2o cultivation
by hand.
25-50 SSLs/day
150 /f weeding
6 AgBank tractors -no equipment- not released. Area increase to av 5 f.
Cueibet 2 private Hire 100-70 SSLs/f
Training poor 3 or 4 people per pair.
75% of sample using own or hired 320SSLs /f
Yes- 25% of sample- family and hiring.
60-70 /day
500SSLs/f
600 SSLS/f
60-70 SSLs/day
Information lacking at county level.
Wulu 2 private 350-400 SSLs/f
Oxen 60% of sample use ox ploughs.
150 SSLs /f hire
Yes-but now 25% farms hand dig
n/a n/a Buy ex NGO units for cash 400 ; spare difficult
Rumbek East
8 private reported
350 SSLs/f
100s of pairs active in County
100% of sample use ox –ploughs. Hire 150 SSLs /f
Yes-now only 5% farms- family and hired labour
n/a 100-150 SSLs/f
Gnut- rapid hand tillage on grass fallow- very effective
Yirol West
3 private 400 SSLs/f
100s of pairs since 1994
100% sample own or hire ox ploughs 150-270 SSLs/f
Yes-family and hired labour weed.
n/a 150 SSLs/f
Ox ploughs established; need spares, ploughs in markets
Yirol East 3 tractors
100-150SSLs/f plus fuel @150SSLs/f
Yes 100s pairs since 1994
100% sample own or hire 100 -150 SSLs/f
Yes family & hired labour-weeding.
n/a 50 SSLs/f
Ox ploughs established; need spares

34
3.3.5 Table 2b shows increasing use of animal traction in Warrap from north to south, a pattern that culminates with an almost universal use of ox ploughing on the border with Lakes State from zero in Abyei Administrative Area. The effect of this increase on average farm size is reported, by the D-Gs of Agriculture in both Warrap and Lakes States, to be high. Transect returns summarised in Figures 4h and 4i suggest increased agricultural activity (beyond hand cultivation) in Rumbek and Yirol counties and in places on the transect from Tonj to Lakes has indeed been significant. 3.4 Input Supply 3.4.1 Input use on field crops throughout Greater Bahr el Ghazal, other than labour, seeds and farmyard manure (fym) is non-existent. Even the Aweil Rice Project, known to have used inorganic fertilisers in the recent past is, for economic reasons, no longer using DAP (diammonium phosphate) or urea this year. Farmyard manure is used by farmers in Northern Bahr el Ghazal and parts of Warrap, where a) dung from the hh animals is spread around the homestead; b) village animals are moved in rotation around each others’ farms; and c) transhumant herders are invited to graze over the stover fields, post-harvest in exchange for food and drink. 3.4.2 Throughout the Region, local seeds have been exclusively used this year since planting began in April until the Mission ended27. Seeds used are noted to have come from a) farmer-saved seed carried over from the previous season; b) kinship or c) local market sources. Such planting material comprises local land races that have evolved for niche environments and some open-pollinated releases that have long since become stabilised in the communities. Case–study and key informant data regarding seeds, sources and noted sowing dates this year are summarised in Table 3. Table 3. Seed use by county, June 2014 (*own, kinship or local market;
L= late;
E= early maturing;
M= main crop;
R=ratooning):
State County Sorghum Sowing Dates
Gnuts Sowing dates.
Backyd Maize
Sowing dates.
Sesame28
/ cassava
Sowing dates
Others incl. Beans
W. Bahr el Ghazal
Raja Ndwa(ulel) *
LR
Bende*E
Mabior*
M
04; 04; 05.
Manipndi*
E 04; Local*
planted with Esorghu
m
04-05; Simsim* Cassava (2yr)
04-07 06-07
Pmillet (05); Janjari & lubia (06-08)
Wau Ndwa(ulel) *
LR
Bende*E
Mabior*
M
04; 05; 05
Local* 04; 07
Local* 04-05; Simsim* Cassava (2yr)
04-07 06-07
Pmillet (05); Janjari & lubia (06-08)
Jur river
Ndwa(ulel) *
LR
Nanjang*E
Mabior*
M
05 Local* 04; 07
Local* 05; Simsim*
05 Pmillet (05); Janjari & lubia (06-08)
N.Bahr el Ghazal
Aweil West
Cham/yar*E
Alep cham*
E2
Mabior*M
04 04 05
Local* 06-07 Local* 04; Simsim*
05 Pmillet (05-06)
Aweil East
Cham/Yar*E
Rabdit*
E2
04 04 05
Local* 06-07 Local*
04;05
Simsim*
04 F Pmillet (05); feterita sorghum
27
FAO Emergency seeds were beginning to arrive as the Mission was leaving Lakes. 28
Simsim- own seeds and imported seeds from Sudan sold in markets in N Bel Ghazal and Warrap.

35
(06) e.g. Gadam el hammam
M
Aweil North
Cham*E
Rabdit*
E2
Rapchol*E
Malwal*M
04;08 Local* 04 06-07
Local*
04
Simsim*
04-05 Pmillet (06) ; okra, pumpkin
Aweil South
Cham*E
Nyetin*
E2
Makuac*M
O4 04-05
Beribedi* 04 05
Local*
04
Simsim*
05 Pmillet (06) ; okra, pumpkin ; sweet potato (06)
Warrap Gogrial West
Yar*E
Nyetin*E2
Nyandoc
*M
04 04-05 05
Local* 05-06-07
Local*
04
Simsim*
04
Twic Ruath*E
Nyenchijak*M
Malwal*M
05 05 05
Local* 07 Local*
05
Simsim*
07 Lubia (06)
Tonj South
Kec*L
Makuac*M
04 05
Local* 04 Local*
04
Simsim*
05 Okra, pumpkin (06)
Abyei Ruath* Malwal*
05 05 05
Local* 07 Local*
05
Simsim*
05 Feterita e.g. Gaddam el hamam
M
Lakes Cueibet
Kec*L
Rapjung*E
Nyetin*E2R
Nyandoc*
M
04 05-06 05 05
Tongpiny* 04-07 Local*
05
Simsim*
05-06 Pmillet (05)
Rumbek East
Kec*L
Rapjung*E
Nyetin*E2R
Nyandoc*
M
04 05-06 05 05-04
Tongpiny* 04-07 Local*
05
Simsim* 05 ;06 Serena (ex-MoA)
Wulu Kec*L
Rapjung*E
Nyetin*E2R
Nyandoc*
M
04 05-06 05 05
Tongpiny* 04-07 Local*
05
Simsim* 05 ;06 Cassava backyard (04-06)
Yirol West
Kec*L
Rapjung*E
Nyandoc*M
04 05-06 05 05
Tongpiny* 04-07 Local*
05
Simsim* 05; Cassava (04-06)
Yirol East
Kec*L
Nyanjang*E
04 05-06
Tongpiny* 04-07 Local*
05
Simsim* 05 ;06 Cassava 05
3.4.3 Sowing rates quoted were consistently in keeping with usual practices noted to be from 5 kg per feddan to 8 kg per feddan for maize and for sorghum (c. 12.5 kg to 20 kg /ha). Groundnut sowing rates were more diverse at 24 kg/ha to 69 kg/ha. 3.4.4 Most farmers reported the need to re-plant despite high sowing rates, but in almost all cases this was confined to filling gaps in a) unequally ratooning fields, b) fields near forests challenged by seed-eaters and c) seeds buried because of pre-cultivation sowing practices as well as d) seeds failing to germinate or e) seedlings suffering from the dry-spells in May and June. This threat may be eliminated by introducing
36
group-based, seedlings nurseries (short –cycle sorghums, millets and maize) prepared either a) at the break or b) pre-rains ready for transplanting immediately rains restart29. 3.4.5 Experience of key informants from the NGOs HARD, World Concern and World Vision suggest that timely distribution of seeds may be achieved through locally-organised purchase from locally- available surpluses of both groundnuts and main crop and late maturing sorghums30. By the same token, given the overwhelming preference for niche local landraces, seed improvements to both quality and quantity may be best achieved through farm-based improvement programmes involving selection and multiplication of farmer-saved seed within counties. 3.5 Crop pests and diseases 3.5.1 As the Mission took place early in the season, serious outbreaks of crop pests and diseases had not yet occurred, therefore few incidents were reported or noted except for monkeys, rats, squirrels, termites porcupines and local birds eating seeds. Of those noted, grasshoppers destroyed seedlings on farms in Warrap and Abyei necessitating some replanting; millipedes were noted as a particular pest of groundnuts in Yirol East; early caterpillar infestations were noted in Northern Bahr el Ghazal, but were, apparently, washed out by timely rains. As noted in the companion report for Greater Equatoria, in the livestock-raising counties poorly-controlled cattle, sheep and goats present more problems to arable farmers than the indigenous pests at this time of year. 3.6 Livestock movement, numbers and performance. 3.6.1 Other than to confirm that the livestock situation is similar to the situation described in Section 2.3 above, Mission members were unable to obtain much more information from any State Ministry Directors of Animal Production or Health (North and Western Bahr el Ghazal; Warrap; Abyei; Lakes) or from any of the 14 County Agricultural offices visited. 3.6.2 The general impression gained from meetings was that some herds had moved west from Upper Nile, Unity and Jonglei States and that numbers might be available from OCHA as part of the registry of IDPs.31 More specifically,
Movements of herds from Upper Nile, Jonglei and Unity into locations bordering the three states in Twic, Gogrial East, Tonj North and Tonj East have occurred but could not be quantified by government staff, but were said not to be having any discernible affect on stocking densities in the counties visited.32
No domino effect of movement westward was reported. A greater mingling of herds from inter-marrying factions was not viewed as a dangerous proposition by key informants in Twic, Gogrial West or Tonj South.
Animals were said to have moved with the IDPs from Unity State to Warrap State, but in this regard, the only information available to the Mission was that during a general re-registering of ex-Unity IDPs by WFP-Wunrok, four months after the crisis, the number of persons had reduced by 90%, seemingly due to movements of individuals elsewhere.
29
http://www.aainternational.co.uk/content/view/61/77. 30
Early distribution this year matched sowing dates. Such actions need to be compared with late delivery of FAO imported seeds; and, delayed purchase of groundnuts due to prolonged LoA procedures 31
The CFSAM Roadmap includes the collection of such data as part of the duties of Taskforce 2. 32
NB- all areas were still enjoying plenty of grass in the toic areas due to favourable rainfall patterns sustaining grass growth with no flooding. Present local clashes within payams and between payams in both Lakes and Warrap States appear to be far more toxic suggesting breakdowns in law and order, apparently fuelled by the receipt of weapons by local militias.

37
Four herds (maybe up to 20,000 head) were reported to have moved from Bor South to Awerial.
Support to the livestock sector post-crisis has concentrated on getting vaccines to livestock that may be moving unseasonably or unusually westwards, bringing less well-protected animals into Greater Bahr el Ghazal.
o One unintended consequence of this action, reported to the Mission by State Directors of Animal Health in unaffected areas, was that the regular vaccine supply system from FAO/ MoA had been disrupted in favour of emergency purchases, with local programmes still reportedly on-hold. However, the Mission notes from data in Juba that the following allocations, by 15 387 benefitting households (hh) and by county, have been made to three NGOs namely VSF Belgium, VSF Swiss; and ICRC.
VSF Belgium- Lakes-Rumbek North (3367 hh); Awerial (5154 hh); Tonj North (344 hh), Tonj East (240 hh), Tonj East (257 hh).
VSF Swiss- Northern Bahr el Ghazal- Aweil North (680 hh), Aweil East (1212 hh ), ICRC Northern Bahr el Ghazal- Aweil East (4133 hh).
3.6.3 More generally, data regarding livestock performance/ management indicators do not exist. Therefore, case-study returns regarding livestock production emanating from semi-structured interviews during case-studies cannot be verified by observations of records. From the semi-structured interviews:-s
Local herd and flock management follows (except in Raja County) the dominant agro-pastoralist system involves seasonal transhumance from toic (lowland grassland) to jok (forest grazing areas) with around the homestead grazing a) post-harvest and b) for animals providing hh services- milk, sale, or traction.
Table 4 Summary of Livestock returns: State County Numbers-
cattle Performance PET Scores
(Body Cond.) Disease/ Vaccination
Pasture / water
Migration
Prices
West B. el Gh
State 1.251 million
Normal 2014> 2013 all stock 3-4s
No vaccine prog yet. Waiting for vaccines. Increased donkey deaths- no reasons given,
Raja-Wau sedentary- both- good
Jur River usual movement cattle. Goats sedentary Mbororo arriving from west
Seasonal fall plus. No salaries paid/ + mbororo effect.
North B el Gh
State 1.583 million
Calving <50% Neo natal- weaning losses 10%-40%
2014>2013; PET scores milkers 2 others 3s-4s
VSF started vaccine prg.
Both Good 2014> 2013
Sudan cattle returned. Local stock still on toic- no floods.
Firm to increasing. Border open. Milk income good
Warrap State 1.532 million
Calving 20%-70%. Neo natal- weaning losses 20% 60% (wet year 2013)
2014>2013; PET scores milkers 2 others 3-4
IDPs’ stock VSF Belg & Germany.
2014>2013 Reluctance to move north due to Messeriya incident April; But most still in toic- regrowth w/o flood.
Increasing.- Abyei effect
Abyei Admin Area
(Warrap) Normal Goats 4 Cattle 3-4
None rptd Both very good
None- Bororo presence from CAR -noted as usual
Firm-buyers from Sudan
Lakes State 1.313 million
Calving 30%-60%
Cattle 3- 4 2014>2013
Vacc. started
Both very good
Internecine raiding- deaths; some self-imposed restrictions.
Salaries late no town buyers, prices low.
3.7 Livestock body condition 3.7.1 In the absence of production data, livestock body condition score is a suitable means of indicating the status of any herd or flock, and by inference a) its likely performance in recent months to date; and b) how it should be managed in the coming weeks. Livestock body condition change is an even better indicator. In this respect, the Mission set out to establish existing body condition scores at the end of the dry season as

38
both a one-off indicator of the state of livestock in each county at the end of the dry season; and, to produce the first record in what should become a regular method of assessing livestock condition using a simple, standard operating procedure of recording condition three times a year. 3.7.2 Due to the rapid nature of the Mission, all herds and flocks passed during vehicular transects were rough-scored according to mode. The mode is the most common obvious score in the group under observation. While passing animals in transit, albeit slowly, although there is no time to score animals individually, there is ample time to group-score or to record the “mode”; that is to say, on passing a herd, or watching a herd pass across in front of the vehicle, there is time to note the most common score the group. 3.7.3 In such a way, goats in all locations in all counties were predominantly noted to be positioned in PET scores “3 to 4”; sheep ranged between “2s and 3s”; and the cattle mode noted is PET score “2” for milkers and “3 to 4” for followers meaning bulls, heifers, dry cows and oxen. 3.7.4 The mode scores show that all domestic livestock species in Greater Bahr el Ghazal are in good condition for an assessment conducted at the end of the dry season.

39
4. CONCLUSIONS 4.1 Effect of Rainfall 4.1.1 Planting began early, stimulated by early rainfall and supported by what may be described as normal rainfall in April and early May, with no early floods or other extreme events. The rainfall has, up to mid-June 2014, sustained vegetation growth above the NDVI average long-term estimates but reductions in rainfall periods of one to two dekads are noticeable in the rainfall estimates provided to the Mission by WFP, VAM-Rome. Case–studies suggest that breaks may have been longer is some locations, a threat that may be eliminated by introducing group-based, seedlings nurseries (short –cycle sorghums, millets and maize) prepared either a) at the break or b) pre-rains ready for transplanting immediately rains restart. In any event, so far the rains have been much more favourable in the Region this year. 4.2 Effect of access to land and confidence 4.2.1 Access to land close to the homestead poses no problem to farmers in any of the fourteen counties visited by the Mission with the exception of 2,475 hh in villages in Warrap and Lakes where, reportedly:- households have been displaced or were disturbed during their early season activities viz:- In Warrap State-in Twic County 800 hh displaced due to feuding near Aweng; in Tonj South-500 hh displaced by local issues including feuding, raiding and robbery in some 12 villages. In Lakes State- in Rumbek East and Rumbek Centre some 1000 hh from 20 villages are reportedly affected by internecine feuding/ raiding and robbery; and, Wulu- 175 hh displaced in April due to feuding/ raiding and robbery. Internecine incidents involving arms were also reported in locations in Cueibet (no details available). Access to far-fields is noted to be normal, farmer confidence in production is noted to be higher than previously with large-scale farming increases reported in all states except in locations noted earlier in this paragraph. 4.3 Effect of power supply 4.3.1 Tractor services in the Region are noted to have declined in the past year as the reported numbers of private tractors have not increased; more government tractors have fallen into disrepair and the 24 tractors provided by the Agricultural Bank to the Region for cooperatives have a) not been fully distributed in Western Bahr el Ghazal; b) have been sold to individuals in Warrap for private use; and c) have not been commissioned for sale/ distribution in Lakes as they arrived with no equipment. Only in Northern Bahr el Ghazal have the Agricultural Bank tractors (6) been available for services this year and may have been able to cultivate a further 600 ha during the season, which is now already over. As they have arrived without spares it is likely that they will follow previous imports into states of disuse very quickly. Improving spare- parts supply chains and training tractor drivers are obvious ways of making a significant impact to the effective use of machinery, but they appear to fall outside donor and NGO mandates and are, therefore, ignored, despite their importance. 4.3.2 Whereas handpower remains the dominant method of cultivation in Western Bahr el Ghazal, animal traction (oxen) is now noted to be the main means of primary cultivation in Lakes; and is noted to be of increasing importance in the southern counties of Warrap and uptake is increasing in Northern Bahr el Ghazal, where donkeys, imported from Darfur, are noted to be used and considered with increasing interest. Similar enthusiasm for donkeys was noted in Raja (West. B.el Gh.) three years ago, but seems to have disappeared due to early deaths and high prices of donkeys now available remaining. The organised introduction of two-wheeled walking tractors offers a solution to the impasse in Western Bahr el Ghazal as to how to extend cultivated area in the county, which arises because, despite official statistics, cattle (oxen) are not raised in any quantity in the area and donkey- based traction has not expanded as hoped.
40
4.4 Effect of inputs 4.4.1 Regarding inputs, in the continued absence of external inputs in the farming systems at all levels, the Mission noted no shortages of the local seeds that are generally preferred by farmers to any imported exotics. Seeds being used this year are predominantly home-grown, kinship-shared or purchased in the local market at normal grain prices noted to be between around 3 per kg. Such seeds include the a) niche early-maturing and late-maturing sorghum landraces, b) local groundnuts, the most common of which are Tongpiny (Lakes); and, beribedi (N. Bahr el Ghazal); c) long-since stabilised releases of maize, and “local” seeds of okra, pumpkin, watermelons and beans used in the backyards, and d) Darfuri pearl millets intercropped with sesame. All sesame seed used appears to originate from Sudan and the product that is not used on- farm, tends to go back to Sudan through the chains of local market traders. 4.4.2 Given the overwhelming preference for niche local landraces, seed improvements to both quality and quantity may be best achieved through farm-based improvement programmes involving selection and multiplication of farmer-saved seed within counties. 4.4.3 Of the crops considered to be minor compared to sorghum, groundnuts are by far the most important with groundnut planting exceeding sorghum planting in all of the Mission’s transects in Lakes. In 2013 FAO had planned for a large seed local purchase for distribution programme, which, regrettably was totally disrupted by the 15 December events. Despite the massive crisis, as part of the ongoing Emergency Response Programme FAO has issued Letters of Agreement (LOAs) to the following 5 NGOs for recollection of seeds: ACROSS- 138 tonnes of groundnuts from Rumbek; SSMDP- 97 tonnes of groundnuts from Warrap; AAO- 80 tonnes of groundnuts from Morobo area; Rural Concern- 39 tonnes sesame from Yei and CE; Purenita- 80 tonnes of groundnuts from Morobo area, all totaling 434t. The Mission notes that in each State, NGOs had been primed by FAO to source local seeds for local purchase. At the time of the Mission visits to the NGOs, although groundnuts sources had been identified, none had actually been purchased as Letters of Agreement between FAO and the NGOs in question were still pending. In addition, 5 LOAs have been signed in Northern Bahr el Ghazal for the organization of Inputs and Trade Fairs (ITFs) to meet the targets in these areas. The targeted quantity of seeds to be collected is noted as 255 tonnes. At the time of writing, two NGOs, KUCDA and ICROFSADO, had reported to FAO, Juba that they had completed the seed fairs33. 4.4.4 No artificial fertilisers have been used in the Greater Bahr el Ghazal Region this year. 4.4.5 Manuring practices continue to vary from state to state. Only in N. Bahr el Ghazal and parts of Warrap is the application of animal dung, through highly organised grazing-over of stover and other crop residues, noticed to be having a significant effect on soil fertility. Elsewhere, crop yields are sustained by shifting and rotation of crop-fallow areas within the larger farms. 4.5 Effect of Pests and Diseases 4.5.1 At this early stage of the agricultural year, plant pests and diseases were more anticipated than actual but included at sowing-time. Nevertheless, pests worthy of note included i) forest-inhabiting hazards particularly birds, squirrels, porcupines, warthogs; ii) elsewhere pests noted were rats, millipedes and termites, iii) caterpillars that were washed away by the rains; and iv) weevils in the stores. A bigger
33
For the entire FAO Emergency Response Programme, the total volume procured internationally was 1,778 tonnes including 689 tonnes procured locally. Therefore, the local seeds cover about 28% of the total crop seeds acquired.

41
threat to crops in savannah areas was noted to be local livestock. No fungal diseases were identified as problems on crops at these early stages of development. Striga, often quoted as the main weed pest was noticeable by its absence throughout the transects and case studies. Grass weeds were a far more formidable cause for concern requiring constant attention in all areas. 4.6 Planted Area 4.6.1 Due to uptake of animal traction, improved power sources for land preparation appear to have increased average area cultivated in Lakes and Warrap since cereal areas per household were last estimated. In Northern Bahr el Ghazal area planted is noted to have increased significantly above last year’s flood affected planting The average size of cereal planting in Western Bahr el Ghazal is not thought to have changed, so the Mission estimate remains at 2.3 feddans (0.96 ha). Conservative estimates of areas planted to cereals this year suggest that probable sizes are likely to average 3 feddans (1.3 ha) in Lakes counties, + 14% above 2013 not including Awerial34; 2.4 feddans (1.0 ha) in N. Bahr el Ghazal, + 25% above the flood affected area in 2013 and 2.6 feddans (1.1 ha) in Warrap, + 13% above 2013 estimates. 4.6.2 Observational transects in Lakes and to a lesser extent in Warrap, point to very large areas of groundnuts already planted this year, that have not been previously captured in CFSAM analyses. These may be all be recent additions reflecting the commercial application of animal traction at peasant farm level, or, they may have gone unreported because the groundnut fields are harvested well-before the CFSAMs; and, are not referred to in case-studies or in other food security surveys. In any event, the areas exceed cereal areas in transects and have the potential of doubling the supply of a staple substitute or cash crop in all Yirol and Rumbek Counties and in Tonj South. 4.6.3 The area increases, if sustained until harvest, would connect to an overall potential increase in cereal area of 24,000 ha in Northern Bahr el Ghazal; 21,000 ha in Warrap and 15,000 ha in Lakes (without Awerial). Such increases do not include a) the areas that will be harvested by the emerging farmers, probably mostly groundnuts, that should be computed separately from lists compiled by County Agricultural Directors under the oversight of FAO, nor b) areas farmed by IDPs, above and beyond the estimates used in CFSAM 2013. 4.6.4 In 2013, the estimated national cereal area harvested increased by 2.84% above 2012’s revised Mission estimates to 1.1 million hectares. The equivalent data (rounded) for Greater Bahr el Ghazal States are an increase 455 000 ha and 442 000 ha (increased by 2.9%) comprising Lakes 107,000 ha and 99,000 ha; Warrap 167,000 ha and 168,000 ha; Northern Bahr el Ghazal 119,000 ha and 115,000 ha; and Western Bahr el Ghazal 62,000 ha and 60,000 ha. 4.6.5 The information already acquired by this Mission suggests that in Greater Bahr el Ghazal the potential cereal area estimate in 2014 is 515 000 ha signalling an increase of 13% (60 000 ha on 455 000 ha) without considering the additional groundnuts noted above (connected to the emerging farmers) or other adjustments relating to activities in the IDP locations and counties (Awerial, Tonj North, Tonj East and Gogrial East) not visited by the Mission.
34
Not visited by the Mission.
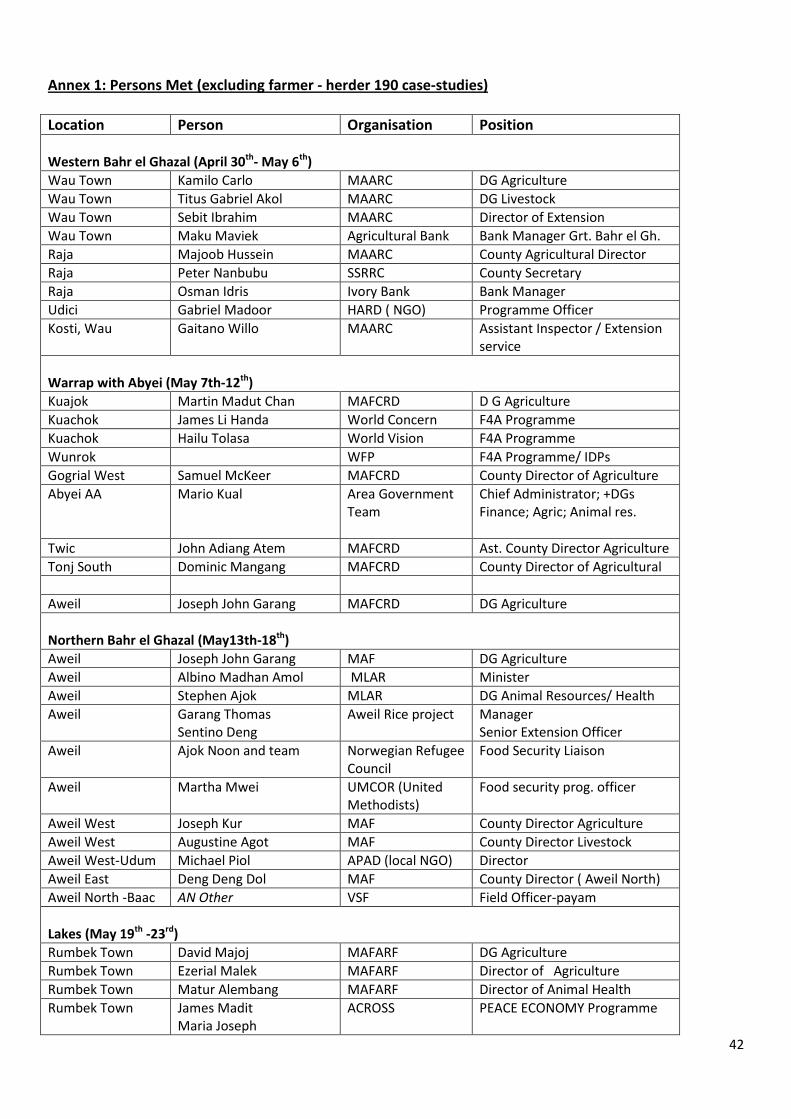
42
Annex 1: Persons Met (excluding farmer - herder 190 case-studies)
Location Person Organisation Position Western Bahr el Ghazal (April 30th- May 6th)
Wau Town Kamilo Carlo MAARC DG Agriculture
Wau Town Titus Gabriel Akol MAARC DG Livestock
Wau Town Sebit Ibrahim MAARC Director of Extension
Wau Town Maku Maviek Agricultural Bank Bank Manager Grt. Bahr el Gh.
Raja Majoob Hussein MAARC County Agricultural Director
Raja Peter Nanbubu SSRRC County Secretary
Raja Osman Idris Ivory Bank Bank Manager
Udici Gabriel Madoor HARD ( NGO) Programme Officer
Kosti, Wau Gaitano Willo MAARC Assistant Inspector / Extension service
Warrap with Abyei (May 7th-12th)
Kuajok Martin Madut Chan MAFCRD D G Agriculture
Kuachok James Li Handa World Concern F4A Programme
Kuachok Hailu Tolasa World Vision F4A Programme
Wunrok WFP F4A Programme/ IDPs
Gogrial West Samuel McKeer MAFCRD County Director of Agriculture
Abyei AA Mario Kual Area Government Team
Chief Administrator; +DGs Finance; Agric; Animal res.
Twic John Adiang Atem MAFCRD Ast. County Director Agriculture
Tonj South Dominic Mangang MAFCRD County Director of Agricultural
Aweil Joseph John Garang MAFCRD DG Agriculture
Northern Bahr el Ghazal (May13th-18th)
Aweil Joseph John Garang MAF DG Agriculture
Aweil Albino Madhan Amol MLAR Minister
Aweil Stephen Ajok MLAR DG Animal Resources/ Health
Aweil Garang Thomas Sentino Deng
Aweil Rice project Manager Senior Extension Officer
Aweil Ajok Noon and team Norwegian Refugee Council
Food Security Liaison
Aweil Martha Mwei UMCOR (United Methodists)
Food security prog. officer
Aweil West Joseph Kur MAF County Director Agriculture
Aweil West Augustine Agot MAF County Director Livestock
Aweil West-Udum Michael Piol APAD (local NGO) Director
Aweil East Deng Deng Dol MAF County Director ( Aweil North)
Aweil North -Baac AN Other VSF Field Officer-payam
Lakes (May 19th -23rd)
Rumbek Town David Majoj MAFARF DG Agriculture
Rumbek Town Ezerial Malek MAFARF Director of Agriculture
Rumbek Town Matur Alembang MAFARF Director of Animal Health
Rumbek Town James Madit Maria Joseph
ACROSS PEACE ECONOMY Programme

43
Gabriel Meen Philip Thon
Rumbek Town Sammuel Deng Emmnauel Lejukole Maker Buong
NPA Programme Coordinator with Animal traction and Livestock officers.
Rumbek Town Celestino Duma Taban Moses
Plan International Field Coordinator Agric officer
Rumbek East Joseph Makor MAFARF Act.County Director Agriculture
Wulu County Daniel Mangar MAFARF County Director Agriculture
Aduel County Joseph Makor MAFARF Senior Inspector
Aduel County Isaac Mapur MAFARF Senior Inspector
Yirol East Daniel Padak Ater MAFARF County Director Agriculture
Yirol West Daniel Mayor MAFARF County Director Agriculture
Yirol West Rose Nyandit Panliet Women’s Cooperative
Chairlady
Cueibet Gabriel Nyicinhom MAFRDC County Director Agriculture

44
Annex 2 Observational Transects
A transect is “a path along which observations are made and records are taken at regular intervals, for future analyses.”
Transects have been useful tools in the study of natural, physical and man-made phenomena for centuries. They can be walked, driven, flown or studied virtually.
The usefulness of any transect depends on the relevance of the indicators selected, the rigour with which the indicators are observed and the diligence with which the observations are recorded.
In the context of Crop and Livestock Assessments, every journey should be considered to be a “transect” in which observations are recorded in a formal, rigorous manner. This approach enables the Team to gain;
• air travel: an overview of land occupied within existing settlements, any new settlements, farms being extended (“far-fields”), areas cultivated/ planted within farms, dominant crops, and later in the season, areas already harvested. PLUS location, size and proportional mix of herds and flocks; and three broad-based levels of forage availability ability (completely grazed, grazing on-going, untouched).
• road travel: a detailed record of agricultural activities regarding crops and animals including signs of access to land, frequencies of appearance of clearings, burning, cultivating, land forming (bunds- dykes-mounds), planting, stage of growth/development, state of harvest, PET yield range, general impressions of quality of performance from all localities traversed within and between zones. PLUS forage available and “mode” condition of livestock herds and flocks passed on or by the side of the road.
• walking: very detailed descriptions of crops grown, forage available and animals present. PET close –up scores at harvest time for crops; and all through the year for livestock condition scoring techniques. Use PET forages residual biomass scores in dry season
Having decided to “make each journey a “transect”, the team leader must decide on an approach (and team members follow it). The following suggestions may help.
Air transects (standard single-engine or twin-engine aircraft)-suggested protocol.
When organizing flights to or between entry points, accept the predetermined (usually the shortest) routes as the sample transects but:
• If the aircraft are chartered, have low-flying (500m-1000m) included in the terms of the contract.
• If the flights are regular UN flights, ask to fly low for the whole journey: request this through WFP when the routes are presented to flight operations; confirm the request with the pilot on each trip.
• Arrange for the key assessor/recorder to have pole position next to the window and behind the pilot with a view of the dials/meters for direction, altitude and speed.
For a charter flight, arrange this directly with the pilot.
For a regular UN flight, request to reserve the seat on each flight when making the flight booking.
Teams should be flexible, however: low flying increases fuel use and therefore costs; in areas of permanently low cloud cover, observation may require pilots to fly lower than the 500m but, in conflict areas, they may have to fly higher than 500m for security reasons.
During flights: From take-off to landing, the key assessor should continuously record, from one side of the plane, the phenomena under study observed at an angle of 60˚. This gives information from a strip of land 860m to 1720m wide depending on height above the ground. Other team members should be requested to try to do the same thing on the other side of the plane so doubling the size of the strip. Always look slightly forward not back.
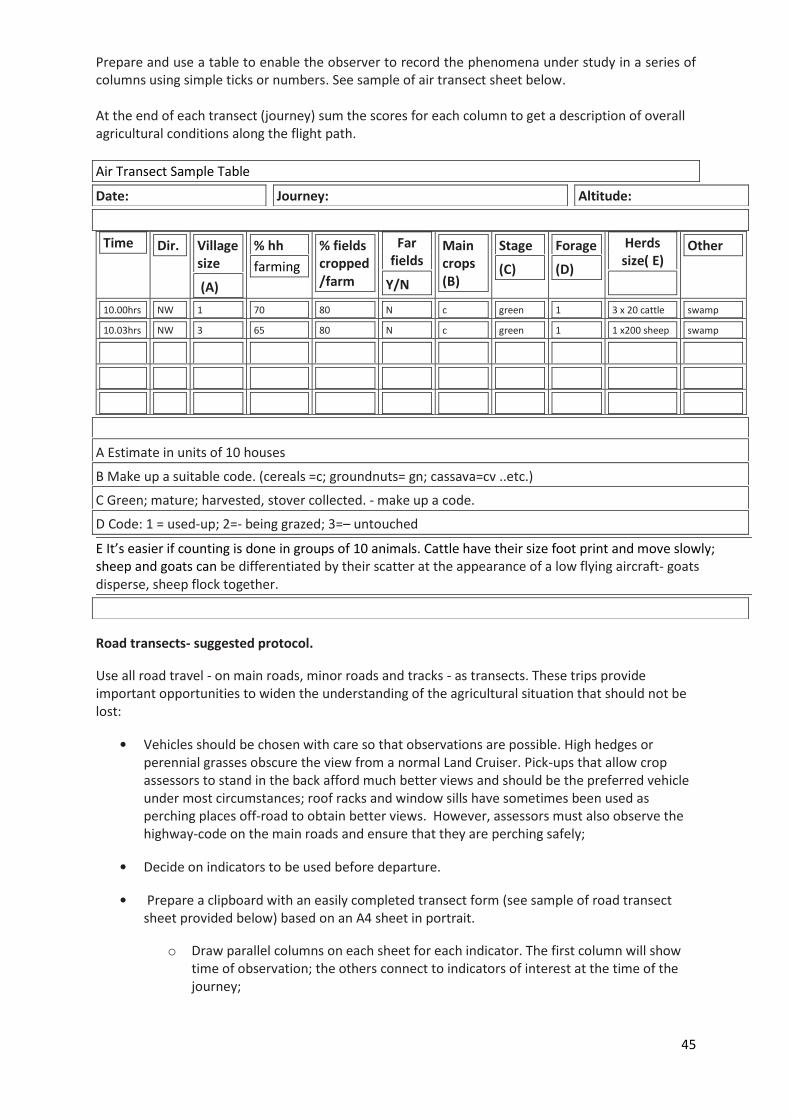
45
Prepare and use a table to enable the observer to record the phenomena under study in a series of columns using simple ticks or numbers. See sample of air transect sheet below. At the end of each transect (journey) sum the scores for each column to get a description of overall agricultural conditions along the flight path.
Air Transect Sample Table
Date: Journey: Altitude:
Time Dir. Village size
(A)
% hh
farming
% fields cropped/farm
Far fields
Y/N
Main crops (B)
Stage
(C)
Forage
(D)
Herds size( E)
Other
10.00hrs NW 1 70 80 N c green 1 3 x 20 cattle swamp
10.03hrs NW 3 65 80 N c green 1 1 x200 sheep swamp
A Estimate in units of 10 houses
B Make up a suitable code. (cereals =c; groundnuts= gn; cassava=cv ..etc.)
C Green; mature; harvested, stover collected. - make up a code.
D Code: 1 = used-up; 2=- being grazed; 3=– untouched
E It’s easier if counting is done in groups of 10 animals. Cattle have their size foot print and move slowly; sheep and goats can be differentiated by their scatter at the appearance of a low flying aircraft- goats disperse, sheep flock together.
Road transects- suggested protocol.
Use all road travel - on main roads, minor roads and tracks - as transects. These trips provide important opportunities to widen the understanding of the agricultural situation that should not be lost:
• Vehicles should be chosen with care so that observations are possible. High hedges or perennial grasses obscure the view from a normal Land Cruiser. Pick-ups that allow crop assessors to stand in the back afford much better views and should be the preferred vehicle under most circumstances; roof racks and window sills have sometimes been used as perching places off-road to obtain better views. However, assessors must also observe the highway-code on the main roads and ensure that they are perching safely;
• Decide on indicators to be used before departure.
• Prepare a clipboard with an easily completed transect form (see sample of road transect sheet provided below) based on an A4 sheet in portrait.
o Draw parallel columns on each sheet for each indicator. The first column will show time of observation; the others connect to indicators of interest at the time of the journey;

46
o Standardise the recording procedures for all teams i.e. decide on a symbol for each indicator/ or either absence/ presence, positive/ negative for general pieces of information;
Pre-planting;-
1. Existing vegetation (forest, bush, savannah, last year’s stover, last year’s fallow, new clearing (forest), new slashing-new burn, old burn, pre-season cultivation, new hand digging-by labour gang or household, new ploughing –oxen/donkey; new ploughing by tractor; land-forming ( bunds, mounds; drains). 2. Sowing-planting (if possible–note crop); 3. Manuring/fertiliser distribution; 4. Germination –note crop; vegetative stages (height or leaf number) 5. Other actions (possible weeding; spraying; irrigating; harvesting irrigated crops).
o At harvest time use PET colour clusters / PET scores when appropriate to record approximate yields.
o Use PET Livestock Sudan condition scores for livestock body condition and PET forages scores for residual forages in the dry season.
Drivers should travel at speeds that allow continuous observation, i.e. about 40-60 km/hour on main roads and < 20 km/hour on tracks;
o Note date, route, time of departure on first page of the log for the journey.
o From departure score 2x every minute; driving at a steady speed; each A 4 page will
cover 20-30 minutes offering a 10 -20 km cluster of information.
o Calculate means for each cluster that will provide data for overall mean for the
journey.
• Livestock passed should be noted by species, condition scored by mode (most frequently occurring score in group).
Forage condition should be noted and residual biomass scored using PET Sudan forage cluster notations.
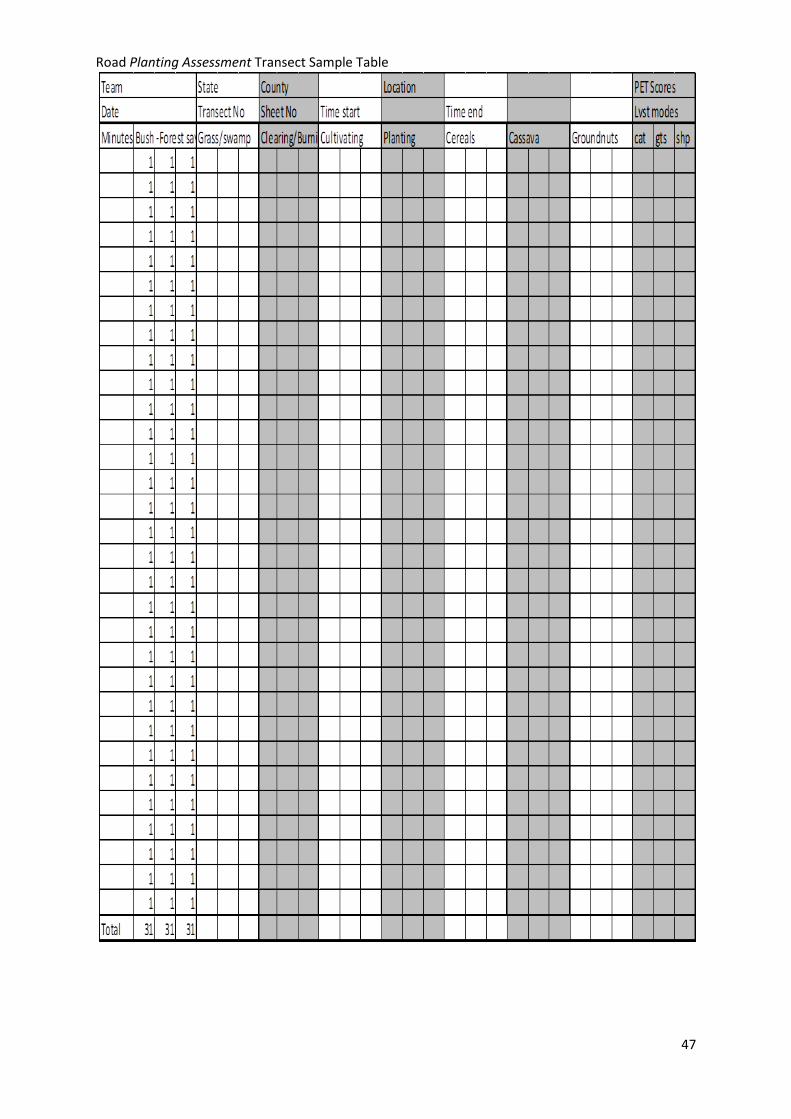
47
Road Planting Assessment Transect Sample Table

48
Walking transect- suggested protocol. On arrival at a designated area, or, an area of specific interest as determined by the results of the initial observations, or at predefined regular intervals:-
Observers leave the vehicle and switch to walking transects;
Each walking transect should encompass a significant numbers, which will depend on the location e.g. a 5 km walking transect in an irrigation scheme may encompass 100 farms; in a rain-fed area a transect of a similar distance may only pass through 20 areas of farm land given fallowing and movement.
Walking transects enables the assessors to look in detail at the fields, stage of crop growth, pests and disease levels; and, at harvest time using the PET Crops photo-indicators, score every field by using a yield estimate.
After suitable intervals case-studies with available farmers should be conducted using the CFSAM checklist. Such case-studies will take at least 1 hr. or longer if interpreters are needed.
Depending on the confidence of the assessor, the case-study occasions offer the opportunity to take a proper crop sample of at least 1 square metre (depending on field size and variation), thresh and weigh the product to a) obtain an objective measurement of the yield of the field under study; and b) to check the assessors use of the PET.
Similarly, o all livestock may be scored individually, and recorded according to class (i.e. dry
females, milking females, slaughter stock, store stock, heifers/ gimmers; draught animals);
o residual forage (stover, perennial grasses and annual grasses) may also be scored using PET Livestock (forages) photo indicators, with occasional cut sample cross–checks against the use of the photographs. The frequency of scoring will depend on the size of the pasture- but the intervals should be a) regular, b) involve 4 observations made though a 360◦ circle at each stop.
o All scores may be transcribed into dry matter weights per hectare. NB. As the transects progress, dominant crops will change. Each new crop will require a PET “close-up” inspection and PET cross-check (during a case-study) to confirm the assessor is using the photo indicators correctly. Such inspections may be done at the administrative centre farms with associated crop cutting, threshing and weighing of sampled crops as shown below. Choose a straight forward, homogenous field to check yourself. The transect approach requires stamina and perseverance to be successful: • Crop assessors need to get a feeling for conditions as they change from place-to-place. They must be ready to withstand the dust, heat and wind associated with open top vehicles or windows being open. Other team members travelling with crop assessors must be ready to accept these conditions. • Drivers must be prepared to work extended hours and accept that their vehicles are going to get dirty both inside and out. The vehicle, on a continuing mission of several days, becomes at the same time, the office, the communications centre (radio link), the store for samples, the workshop and the field laboratory. Immediate advantages accrue if the job is done properly. On many occasions, teams have arrived at an entry point office to be met with claims of crop failure or animal starvation from officials who have rarely left their desks. Having just driven across at least part of the area, well-taken transect records enable the team to be able to enquire further on the solid basis of empirical information, often gained over hundreds of kilometres. When all sub-teams do the same thing, the accumulated knowledge of the season places the CFSAM team in a strong position to explain its findings and justify its conclusions in debriefing sessions, challenging opinions founded on rumour or vested interest, whenever it is necessary. Longer-term advantages arise at the report writing stage, when the conditions by zone are described in more detail.

49
Annex 3 Planting Season Assessment Check List Summary sheet and supplementary notes
UN FAO/WFP/ MoA Crop and Food Supply Assessment Mission to South Sudan – 2014
Pre-planting / planting data and information to be collected from official sources, NGOs and farmers.
CHECKLIST To be used In conjunction with vehicle-and-walking based transects and PET manuals.
1. Location State / County Informant’s name
Parish/locality Position and number of years in place (farmers) or job.
Organization Domain (area of direct involvement: this may range from a farm to a district). Ownership type
New villages, or hhs, farms, or fields- (nos. and area) Abandoned villages, hhs or farms, or fields (nos. and areas)
2. Type of crop production (tick box and give area of farmland in ha);
Rain-fed□ Irrigated only □ Supplementary ( rain and irrigation)□
3. Growing Conditions so far a. Rains (if rainfall data available copy over sheet- by dekad (10 day total)
Start this year Dry spells so far Rainfall amount
Date
Early□
Normal□
Late□
Date No days
Below average □
Average□
Above average□
Extreme event□
b. Irrigation this year 2014- Yes or No
Type General observations regarding irrigation status; which crops? When?
If different from last year- why? ( Access, parts , fuel, labour)
Pump□
bucket□
Other□
Better□
Same□
Lower□
If
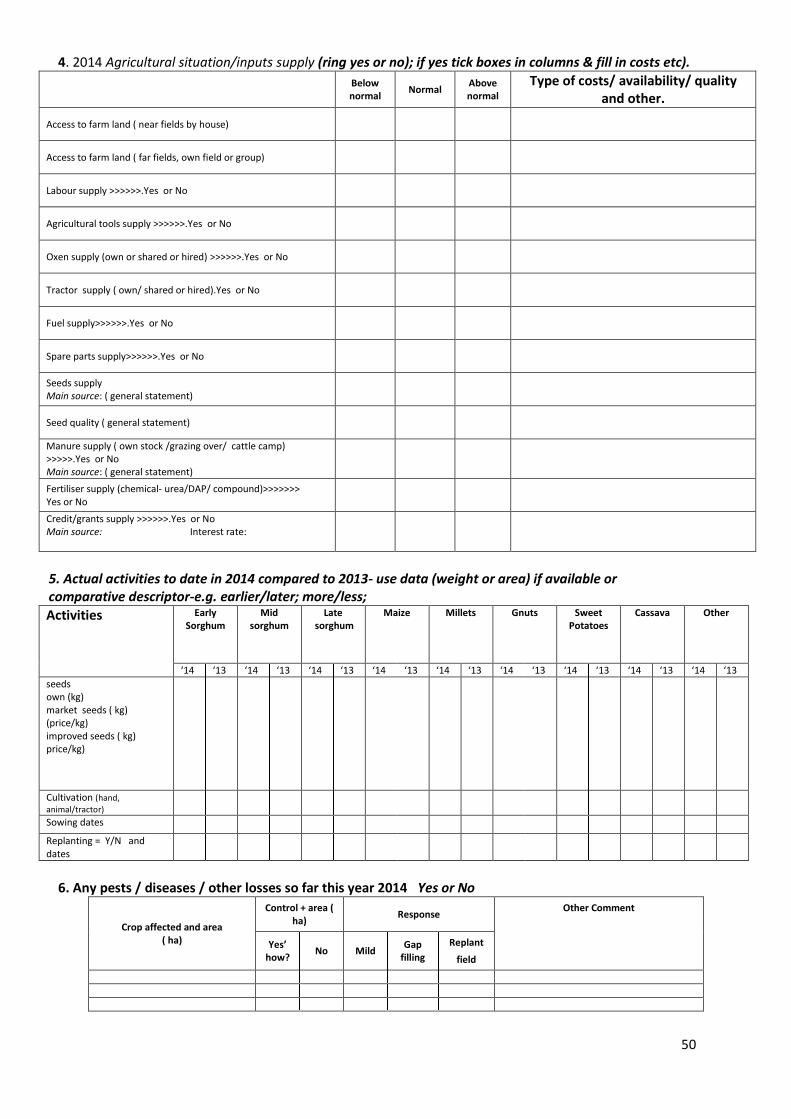
50
4. 2014 Agricultural situation/inputs supply (ring yes or no); if yes tick boxes in columns & fill in costs etc).
Below normal
Normal Above normal
Type of costs/ availability/ quality and other.
Access to farm land ( near fields by house)
Access to farm land ( far fields, own field or group)
Labour supply >>>>>>.Yes or No
Agricultural tools supply >>>>>>.Yes or No
Oxen supply (own or shared or hired) >>>>>>.Yes or No
Tractor supply ( own/ shared or hired).Yes or No
Fuel supply>>>>>>.Yes or No
Spare parts supply>>>>>>.Yes or No
Seeds supply Main source: ( general statement)
Seed quality ( general statement)
Manure supply ( own stock /grazing over/ cattle camp) >>>>>.Yes or No Main source: ( general statement)
Fertiliser supply (chemical- urea/DAP/ compound)>>>>>>> Yes or No
Credit/grants supply >>>>>>.Yes or No Main source: Interest rate:
5. Actual activities to date in 2014 compared to 2013- use data (weight or area) if available or comparative descriptor-e.g. earlier/later; more/less;
Activities Early Sorghum
Mid sorghum
Late sorghum
Maize Millets Gnuts Sweet Potatoes
Cassava Other
‘14 ‘13 ‘14 ‘13 ‘14 ‘13 ‘14 ‘13 ‘14 ‘13 ‘14 ‘13 ‘14 ‘13 ‘14 ‘13 ‘14 ‘13
seeds own (kg) market seeds ( kg) (price/kg) improved seeds ( kg) price/kg)
Cultivation (hand,
animal/tractor)
Sowing dates Replanting = Y/N and dates
6. Any pests / diseases / other losses so far this year 2014 Yes or No
Crop affected and area ( ha)
Control + area ( ha)
Response Other Comment
Yes’ how?
No Mild Gap
filling
Replant
field
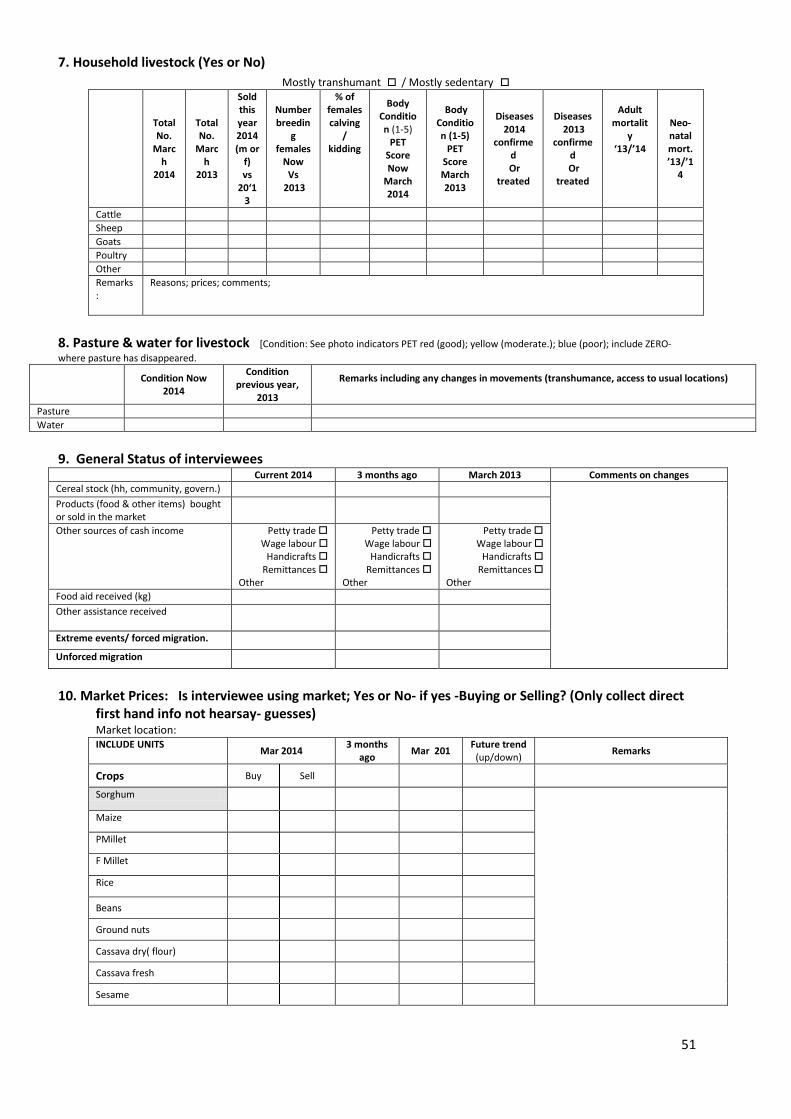
51
7. Household livestock (Yes or No)
Mostly transhumant / Mostly sedentary
Total No.
March
2014
Total No.
March
2013
Sold this year 2014 (m or
f) vs
20‘13
Number breedin
g females
Now Vs
2013
% of females calving
/ kidding
Body Condition (1-5)
PET Score Now
March 2014
Body Condition (1-5)
PET Score March 2013
Diseases 2014
confirmed
Or treated
Diseases 2013
confirmed
Or treated
Adult
mortality
‘13/’14
Neo- natal mort. ’13/’1
4
Cattle
Sheep
Goats
Poultry
Other
Remarks:
Reasons; prices; comments;
8. Pasture & water for livestock [Condition: See photo indicators PET red (good); yellow (moderate.); blue (poor); include ZERO-
where pasture has disappeared.
Condition Now
2014
Condition previous year,
2013
Remarks including any changes in movements (transhumance, access to usual locations)
Pasture
Water
9. General Status of interviewees
Current 2014 3 months ago March 2013 Comments on changes
Cereal stock (hh, community, govern.) Products (food & other items) bought or sold in the market
Other sources of cash income
Petty trade Wage labour
Handicrafts Remittances
Other
Petty trade Wage labour
Handicrafts Remittances
Other
Petty trade Wage labour
Handicrafts Remittances
Other Food aid received (kg) Other assistance received
Extreme events/ forced migration.
Unforced migration
10. Market Prices: Is interviewee using market; Yes or No- if yes -Buying or Selling? (Only collect direct
first hand info not hearsay- guesses) Market location: INCLUDE UNITS
Mar 2014 3 months
ago Mar 201
Future trend (up/down)
Remarks
Crops Buy Sell
Sorghum
Maize
PMillet
F Millet
Rice
Beans
Ground nuts
Cassava dry( flour)
Cassava fresh
Sesame

52
Other (fruit, vegetables)
Livestock
Cattle: Heifer
Breeding cow
Cull cow
Steer
Breeding Goat
Male Goat
Breeding ewe
Ram
Cull ewe/goat
Other
Terms of trade
kgs of main cereal for 1 goat
11. Market conditions: Location Distance
CONFIDENCE in Current situation- stocks/ sales Changes compared with previous
year
Links & trade with main wholesale markets
Range & quantities of food items available
Range & quantities of inputs and other items available
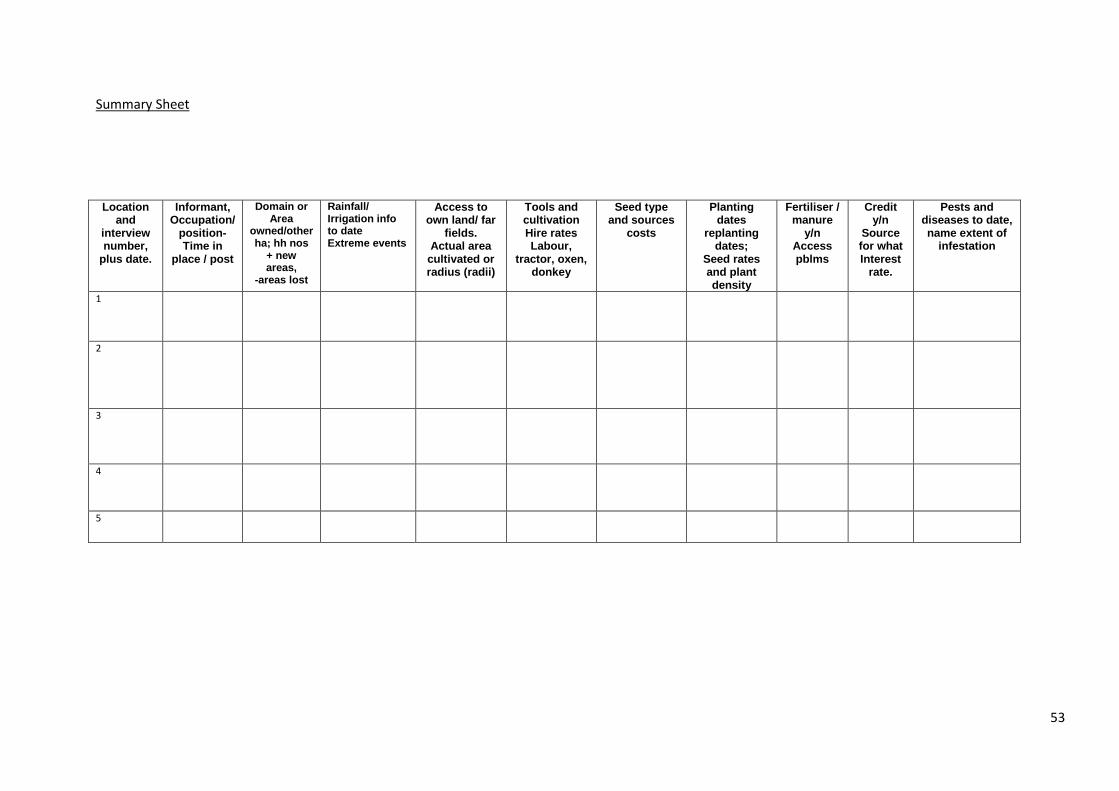
53
Summary Sheet
Location and
interview number,
plus date.
Informant, Occupation/
position- Time in
place / post
Domain or Area
owned/other ha; hh nos
+ new areas,
-areas lost
Rainfall/ Irrigation info to date Extreme events
Access to own land/ far
fields. Actual area
cultivated or radius (radii)
Tools and cultivation Hire rates Labour,
tractor, oxen, donkey
Seed type and sources
costs
Planting dates
replanting dates;
Seed rates and plant density
Fertiliser / manure
y/n Access pblms
Credit y/n
Source for what Interest
rate.
Pests and diseases to date, name extent of
infestation
1
2
3
4
5
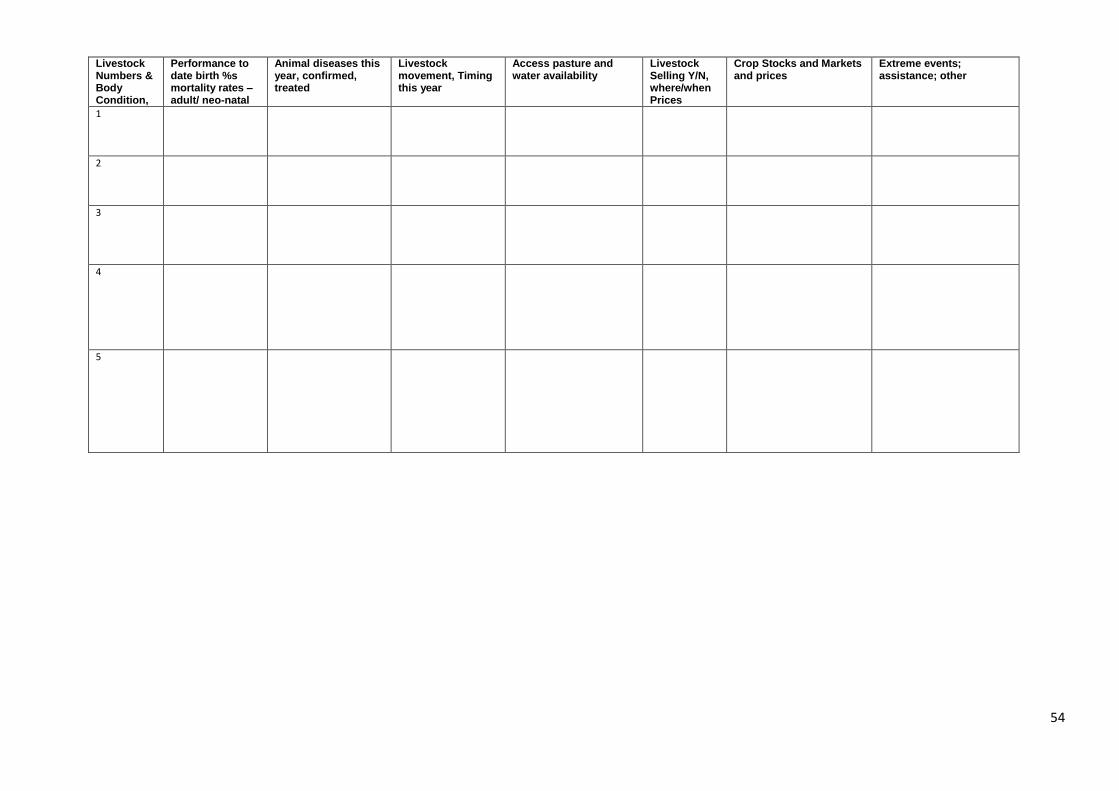
54
Livestock Numbers & Body Condition,
Performance to date birth %s mortality rates –adult/ neo-natal
Animal diseases this year, confirmed, treated
Livestock movement, Timing this year
Access pasture and water availability
Livestock Selling Y/N, where/when Prices
Crop Stocks and Markets and prices
Extreme events; assistance; other
1
2
3
4
5
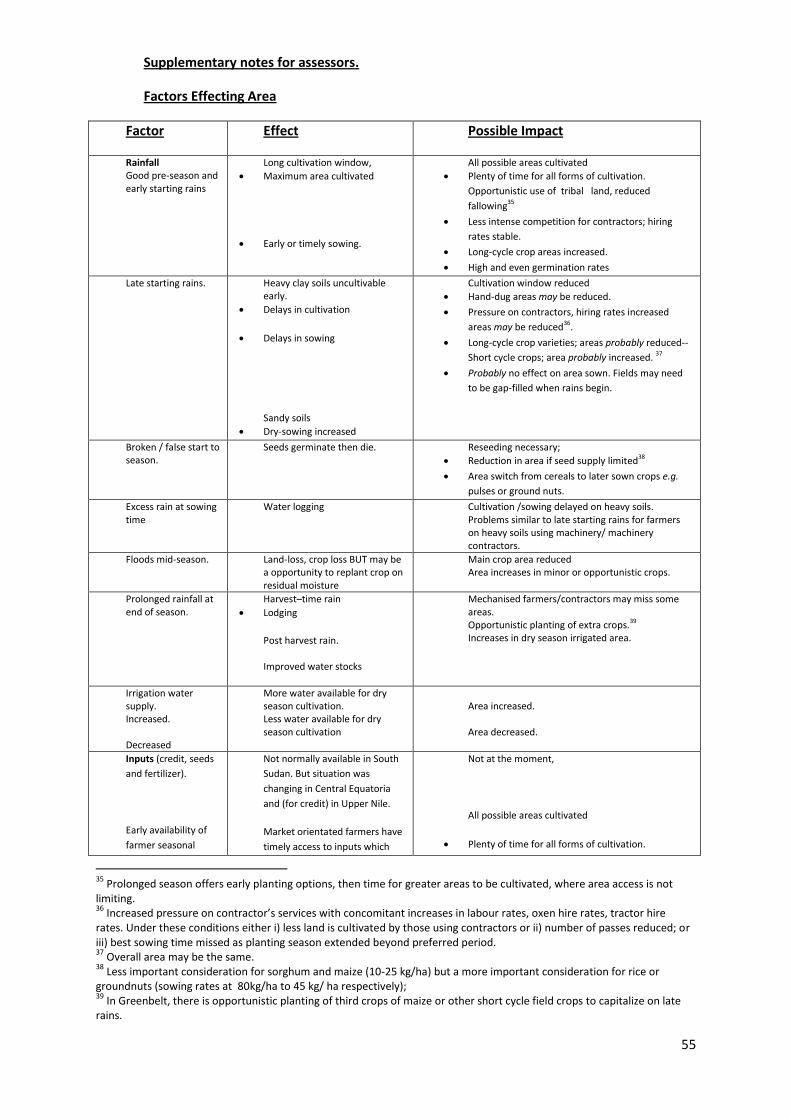
55
Supplementary notes for assessors.
Factors Effecting Area
Factor Effect Possible Impact
Rainfall Good pre-season and early starting rains
Long cultivation window,
Maximum area cultivated
Early or timely sowing.
All possible areas cultivated
Plenty of time for all forms of cultivation.
Opportunistic use of tribal land, reduced
fallowing35
Less intense competition for contractors; hiring
rates stable.
Long-cycle crop areas increased.
High and even germination rates
Late starting rains. Heavy clay soils uncultivable early.
Delays in cultivation
Delays in sowing
Sandy soils
Dry-sowing increased
Cultivation window reduced
Hand-dug areas may be reduced.
Pressure on contractors, hiring rates increased
areas may be reduced36.
Long-cycle crop varieties; areas probably reduced--
Short cycle crops; area probably increased. 37
Probably no effect on area sown. Fields may need
to be gap-filled when rains begin.
Broken / false start to season.
Seeds germinate then die. Reseeding necessary;
Reduction in area if seed supply limited38
Area switch from cereals to later sown crops e.g.
pulses or ground nuts.
Excess rain at sowing time
Water logging Cultivation /sowing delayed on heavy soils. Problems similar to late starting rains for farmers on heavy soils using machinery/ machinery contractors.
Floods mid-season. Land-loss, crop loss BUT may be a opportunity to replant crop on residual moisture
Main crop area reduced Area increases in minor or opportunistic crops.
Prolonged rainfall at end of season.
Harvest–time rain
Lodging
Post harvest rain. Improved water stocks
Mechanised farmers/contractors may miss some areas. Opportunistic planting of extra crops.39 Increases in dry season irrigated area.
Irrigation water supply. Increased. Decreased
More water available for dry season cultivation. Less water available for dry season cultivation
Area increased. Area decreased.
Inputs (credit, seeds
and fertilizer).
Early availability of
farmer seasonal
Not normally available in South
Sudan. But situation was
changing in Central Equatoria
and (for credit) in Upper Nile.
Market orientated farmers have
timely access to inputs which
Not at the moment,
All possible areas cultivated
Plenty of time for all forms of cultivation.
35
Prolonged season offers early planting options, then time for greater areas to be cultivated, where area access is not limiting. 36
Increased pressure on contractor’s services with concomitant increases in labour rates, oxen hire rates, tractor hire rates. Under these conditions either i) less land is cultivated by those using contractors or ii) number of passes reduced; or iii) best sowing time missed as planting season extended beyond preferred period. 37
Overall area may be the same. 38
Less important consideration for sorghum and maize (10-25 kg/ha) but a more important consideration for rice or groundnuts (sowing rates at 80kg/ha to 45 kg/ ha respectively); 39
In Greenbelt, there is opportunistic planting of third crops of maize or other short cycle field crops to capitalize on late rains.

56
credit, improved
seeds and basal
dressing fertilizer.
boosts farmer investment
Maximum area cultivated
Early or timely sowing.
Opportunistic use of common land, reduced
fallowing
Less intense competition for contractors; hiring
rates stable.
Long-cycle crop areas increased.
High and even germination rates
Late arrival of inputs Market orientated farmers have
reduced time for investment.40
Credit supply low or not
available
Credit demand high.
Delays in sowing
Black market thrives
Optimum sowing time missed.
HRV41 areas reduced
Area of long-cycle crop varieties probably reduced.
Area of short cycle crops probably increased. 42
Input prices increase
Increased prices of
inputs.
Market orientated farmers have
increased outlay.43
Decline in sales possible
May get increase in share-
cropping
Small farmers don’t buy inputs
HRVs;
Reduction in area.
Traditional varieties.
Area switch to low-input cereals
Areas stay same but ownership changes.
Labour
Crisis displacement
with labour shortage
early in season.
Crisis displacement
with labour shortage
late in season.
Long term migration.
Abandon village fields- early
season. New clearings unlikely.
Abandon village fields late
season.
Farming population reduction.
Cultivation stopped.
Area reduced
Area switch to late-sown crops
No expansion of cultivated area
Harvest missed.
Area lost
Fewer farming households.
Possible area reduction44
Possible land redistribution/share cropping45
40
Subsistence farmers less effected, use their own seeds and may not use fertiliser 41
HRV- high response varieties 42
Overall area may be the same. 43
Response depends on expected crop prices; guarantees or no guarantees, stocks from previous years. 44
Areas deserted by customary farmers, left unfarmed by others. 45
Land farmed by others in their absence (tribal agreements); squatting on abandoned government land

57
Power sources
Draught animals-
viral diseases
(epidemic e.g.
rinderpest);
Draught animals-
stole during conflict
or
distress selling (most
households)46
Dramatic loss, oxen sharing
cannot keep- up with demand.
Dramatic loss, oxen sharing
cannot keep- up with demand.
Fewer animals to cultivate.
Area reduction.
Fewer animals to cultivate.
Area reduction.
Tractor availability
disturbed.
Tractors removed,
stolen or broken.
Spare parts stolen or
supply chain cut.
Fuel /oil supply cut-
off or delayed.
Credit late or
withdrawn
Hire prices
dramatically
increased
Contractors raise prices Black-
market flourishes.
Investors reduce area unless
price forecasts good.
Owner- farmers struggle to find
fuel.
Owner- farmers struggle to find
fuel.
Hiring farmers cannot afford
tractor hire.
Long queues for few tractors
.
Area probably sustained, quality falls.
Area reduced or redistributed to very wealthy.
Area reduced or redistributed to very wealthy.
Area reduced or one pass only-reduces quality.
Area reduced or one pass only-reduces quality.
Farmer Confidence
Falling confidence
Local
conflict/insecurity-
confidence draining.
National war threat-
uncertainty.
Stocks held on farm.
Increased prices of all
commodities.
Growing confidence
Stable prices of
outputs/commodities
Increased prices of
some commodities.
All farmers- No far fields.
Boosted self sufficiency
programme. Maximum planting
unless near frontier.
Subsistence farmers with plenty
of on-farm stocks
Planning possible. Sustained
practices.
New investors
Market orientated farmers and
mechanized farming increases.
Crops switched by large scale
farmers47
All farmers.
Area reduced increased fallow area.
Area of staples increased
Crop area ratios change; total area may remain
similar.
Area expansion sustained at a predictable level.
Rapid and widespread area expansion.
46
Rapid turnover of draught animals is valid strategy in trypanosomiasis areas. (Buy pre-season-sell post season; avoid feeding expenses/risk in dry season ) 47
North Sudan (2000/1-2002/3) massive changes in rainfed sorghum areas –switch to sesame.