
A PARTIAL ACQUISITION TECHNIQUE OF SAR SYSTEM...
11
A Partial Acquisition Technique f SAR System System Using International Journal of Remote Sensing and Earth Sciences oVol. 14 No. 1 June 2017: 9 – 18..... A PARTIAL ACQUISITION TECHNIQUE OF SAR SYSTEM USING COMPRESSIVE SAMPLING METHOD Rahmat Arief 1 Remote Sensing Technology and Data Center, National Institute of Aeronautics and Space of Indonesia Jl. Kalisari No.8 Kelurahan Pekayon Kecamatan Pasar Rebo Jakarta Timur, Indonesia 1 e-mail: [email protected] Received: 10 May 2017; Revised: 15 June 2017; Approved: 17 June 2017 Abstract. In line with the development of Synthetic Aperture Radar (SAR) technology, there is a serious problem when the SAR signal is acquired using high rate analog digital converter (ADC), that require large volumes data storage. The other problem on compressive sensing method, which frequently occurs, is a large measurement matrix that may cause intensive calculation. In this paper, a new approach was proposed, particularly on the partial acquisition technique of SAR system using compressive sampling method in both the azimuth and range direction. The main objectives of the study are to reduce the radar raw data by decreasing the sampling rate of ADC and to reduce the computational load by decreasing the dimension of the measurement matrix. The simulation results found that the reconstruction of SAR image using partial acquisition model has better resolution compared to the conventional method (Range Doppler Algorithm/RDA). On a target of a ship, that represents a low-level sparsity, a good reconstruction image could be achieved from a fewer number measurement. The study concludes that the method may speed up the computation time by a factor 4.49 times faster than with a full acquisition matrix. Keywords: partial acquisition technique, synthetic aperture radar, compressive sampling
Transcript of A PARTIAL ACQUISITION TECHNIQUE OF SAR SYSTEM...
A Partial Acquisition Technique f SAR System System Using
International Journal of Remote Sensing and Earth Sciences oVol. 14 No. 1 June 2017: 9 – 18.....
A PARTIAL ACQUISITION TECHNIQUE OF SAR SYSTEM
USING
COMPRESSIVE SAMPLING METHOD
Rahmat Arief1
Remote Sensing Technology and Data Center,
National Institute of Aeronautics and Space of Indonesia
Jl. Kalisari No.8 Kelurahan Pekayon Kecamatan Pasar Rebo Jakarta Timur, Indonesia 1e-mail: [email protected]
Received: 10 May 2017; Revised: 15 June 2017; Approved: 17 June 2017
Abstract. In line with the development of Synthetic Aperture Radar (SAR) technology, there is a
serious problem when the SAR signal is acquired using high rate analog digital converter (ADC), that
require large volumes data storage. The other problem on compressive sensing method, which
frequently occurs, is a large measurement matrix that may cause intensive calculation. In this paper,
a new approach was proposed, particularly on the partial acquisition technique of SAR system using
compressive sampling method in both the azimuth and range direction. The main objectives of the
study are to reduce the radar raw data by decreasing the sampling rate of ADC and to reduce the
computational load by decreasing the dimension of the measurement matrix. The simulation results
found that the reconstruction of SAR image using partial acquisition model has better resolution
compared to the conventional method (Range Doppler Algorithm/RDA). On a target of a ship, that
represents a low-level sparsity, a good reconstruction image could be achieved from a fewer number
measurement. The study concludes that the method may speed up the computation time by a factor
4.49 times faster than with a full acquisition matrix.
Keywords: partial acquisition technique, synthetic aperture radar, compressive sampling
Rahmat Arief
10 International Journal of Remote Sensing and Earth Science Vol. 14 No. 1 June 2017
1 INTRODUCTION
Synthetic aperture radar (SAR) is a
active remote sensing technology that
produce high resolution images of earth
surface from a moving platform during
day night and all weather (Curlander and
McDonough 1991; Skolnik 2008). One of
main challenges to obtain highresolution
images is, that a backscatter signal is
sampled at least 2 times the highest
frequency of the radar signal as a theory
Shannon/Nyquist thus requiring a high
rate of Analog Digital Converter (ADC)
(Cumming and Wong 2005). This causes
the volume of SAR raw data is getting
bigger and also requires a great power.
This conventional approach is not only
complicated and expensive, but also the
work of onboard components of a SAR
sensor system becomes heavy on
the limited onboard memory capacity
and downlink transmission. To solve this
problem, many techniques have been
proposed to compress SAR data. One of
most used compression techniques is
block adaptive quantization (BAQ). BAQ
technique (Kwok and Johnson 1989)
aims to estimate the input signal
statistics and match quantizer adaptively
according to the statistics of input signal
and adopt on onboard satellite such as
SIR-C (Kwok and Johnson 1989). The
BAQ technique, used also for other SAR
satellite like TerraSAR-X and
COSMOSkyMed. Other techniques are
used such as Down-Sampling BAQ
(DSBAQ) on
ALOS2 PALSAR 2 (Kankaku et al. 2011),
Flexible Dinamic BAQ (FDBAQ) on
Sentinel-1 (Attema et al. 2010).
International Journal of Remo@National Institute of Aeronautics and Space of Indonesia (LAPAN)e Sensing
and Earth Science Vol. 14 No. 1 June 2017 99
Unlike conventional compression
methods above, the theory of compressive
sensing (CS) (Candes and Tao 2006;
Donoho 2006; Candes and Wakin 2008)
proposed a new approach, where CS can
recover certain signals from the
measurement/sampling much less than
the Nyquist sampling rate theory.
Scheme of CS for radar imaging system
was introduced from reseachers
(Baraniuk and Steeghs 2007; Patel et al.
2010) and which states that the radar
system with CS can reduce the sampling
rate of the ADC on the receiver and
eliminate the need of match filter on the
radar receiver. The use of random
sampling on the radar transmitter was
proposed by (Liu and Boufounos 2011)
without any changes to the system
hardware. All the above research requires
the radar signal is sparse and
compressible.
Sparse representation model of SAR
signals stated that the raw data can be
represented as a sparse signal in a
certain basis. Herman (Herman and
Strohmer 2009) proposed a sparse
representation model in the form of a
linear equation with All top sequence.
Wei (Wei et al. 2010) described the SAR
signal by separating the sparse target
and the acquisition matrix of SAR signal.
Another approach is the establishment of
the linear model of the SAR raw data
based on the Born Approximation
(Cheney and Borden 2009; Sun et al.
2014).
This paper emphasizes the partial
acquisition technique of the SAR system
that was not done in the previous paper.
The main objectives of the study are to
reduce the data storage volume by
decreasing the sampling rate of ADC and
to reduce the computational load using
A Partial Acquisition Technique of SAR System System Using .....
11
the partial acquisition technique. The
partial acquisition technique was carried
out by dividing the dimension of the full
acquisition matrix of SAR signal in
smaller blocks. This technique can
emphasize on the reduction of the
number of calculations from the matrix
equations. Therefore, the acceleration of
the processing time can be obtained. The
dimension reduction of the measurement
matrix is limited by determination of
acceptable the quality of reconstruction.
2 MATERIALS AND METHODOLOGY
2.1 Linear Model of Received SAR
Signal
Pulse radar systems using stop-go
approach [16] where the radar antenna
transmits chirp signal at time t and the
position of the antenna x repeatedly on
repetition interval. When the transmitted
signal hits an object, it will induce
currents hence the object emits the
scattered field which is the same signal,
but weaker and time delayed. The
scattered field ℰsc(t, x) is formed from the
interaction between the target and the
incident field. Thus its value is the
response target which depends on the
geometry and material properties of the
target and the shape. The equation of
baseband modulated scattered field
signal can be written as follows:
.
16π R (2-1)
a(t).e(−iωoτ+iπα(t−τ)2)dz
where Ga is the amplitude of the
transmitter signal and a(t) = rect((𝑡 −
𝑇𝑝⁄2)⁄𝑇𝑝) is a rectangular gate function
with 𝑇𝑝 as the pulse duration time
(Cheney and Borden 2009).
Furthermore, the ωo = 2𝜋𝑓𝑐 is the carrief
frequency and LFM pulse chirp rate.
Meanwhile, R(z) = |x − z| is the distance
between the antenna and the target and τ
= 2R(z)/c is the time delay, which is the
travel time of chirp signal from the
antenna to the target and back to the
antenna.
In continuum model, radar antenna
is usually pointed toward the earth on
the moving platform and simultaneously
emits radar signals. The antenna path is
denoted by index ηi, which represents
antenna position movement path with ηi
= 1, … , N. The time scale on this model is
defined into 2 scales, which the time
scale on the antenna movement is much
slower (slow time) than the time scale on
the EM wave of a radar signal (fast time).
The received radar signal can be defined
as follows:
ηi 2 (2-2)
a(t). e(−iωoτηik+iπα(t−τηik) ) dz
where τηik = 2. Rηik⁄c is the delay time of
SAR echo at index ηi dan Rηik is the
distance (range) between the radar
antenna at the position ηi and each target
at the position z (xk,yk).
For radar imaging, the scattered
field can be measured at the antenna and
the reflectivity V(z) is a function that
must be resolved. We assume the value
of the coefficient 𝑉𝑘 ∈ ℂNx1(N = Na x Nr) is
the coefficient value of the backscattered
signal from sparse targets, where k is an
index of sparse targets and Na and Nr are
the sampling number of slow time and
fast time signal. The linear equation of
the SAR signal is formed by separating
the components reflectivity 𝑉𝑘 and
acquisition matrix Ψ SAR signal in the
form of discrete (Arief et al. 2016) written
as follows:
(2-3)
or S = Ψ . Vk
A measured SAR echo S is obtained by
using high rate ADC as required by the
Nyquist theorem. The goal of
reconstruction is to determine the target
reflectivity Vk = [v1, v2, ⋯ , vN]T from the
measured SAR echo S and the model of
SAR signal acquisitionΨ.
Rahmat Arief
12 International Journal of Remote Sensing and Earth Science Vol. 14 No. 1 June 2017
From eq. (2-2) the SAR signal
acquisisiton model ψk(tn, ηi) is derived as
follows:
ψk(tn,ηi) = Ak . e−jφ(tn,ηi) (2-4) ψk(tn,ηi)
=
[Ake−jφ1(1,1), … , Ake−jφ1(1,Nr),
Ak e−jφ1(2,1), … , Ake−jφ1(Na,Nr)]T
where
The new mathematical model of general
Ψ is interpreted as basis vector at the
fast-time tn and slow-time ηi and can be
written as:
Ψ = [ψ1(tn, ηi), ψ2(tn, ηi), … , ψN(tn, ηi)] (2-5)
Where the time scale of fast time and
slow time signal is indexed by tn = 1, … , Nr
and ηi = 1, … , Na. Nr and Na are the amount
of sampling number of fast time and slow
time signal.
2.2 Partial Acquisition Model of SAR
Signal
In this section a new method is
proposed to reduce the dimension of the
matrix Ψ in formula (2-5) by dividing the
matrix per block in order to reduce
computational load. The matrix Ψ as
shown in Figure 1(a) has a large size of
(NaNr × Ntarget), where Na and Nr are the
maximum number of sampling of slow
time and fast time signal. This causes the
inverse solution of target reflectivity Vk =
inverse(𝑓(𝑆, 𝛹)) becomes complex.
One important step in the algorithm CS
is randomly low sampling on recieved
radar signal sRT (3) is required. A low
sampling model in form of fewer random
measurement is needed to reduce the
SAR raw data. It represents as
incomplete matrix. The number of
measurements m must be at least
smaller than the signal/image dimension
M ≪ 𝑁. The new incomplete radar signal
is formulated as follows:
(2=6)
where is a randomly low sampling
measurement matrix with size of M × N,
and is noise matrix. The noise can be
stochastic or deterministic. The number
of measurements M must have at least
greater than the number of K non-zero
value but can be significantly smaller
than the dimensions of the scene N
. The fewer the number of M
measurements are taken, then the lower
sampling rate. The matrix contains here
only M of the total entries are known,
which means undersampling ratio
.
The sampling technique on the raw
data SAR can be conducted by low
sampling of both slow time and fast time
signal simultaneously (Arief et al. 2015,
2016). The low sampling of slow time
(azimuth) signal is obtained by random
arrangements of transmitted radar
pulses (Liu and Boufounos 2011; Yang
et al. 2014) and the low sampling of fast
time (range) signal is obtained by using
lower rate ADC than received signal
(Arief et al. 2013; Sun et al. 2014).
To find the sparse target reflectivity
in general required a number of
equations as much . Especially in the
case of a sparse target that the target
number less then dimensions of
the matrix Ψ. So Ψ can be reduced. With
this assumption, the computational load
in solving inverse problems can be
reduced as well.
The new matrix is formed by
dividing the original into several blocks
International Journal of Remote Sensing and Earth Science Vol. 14 No. 1 June 2017
A Partial Acquisition Technique of SAR System System Using .....
13
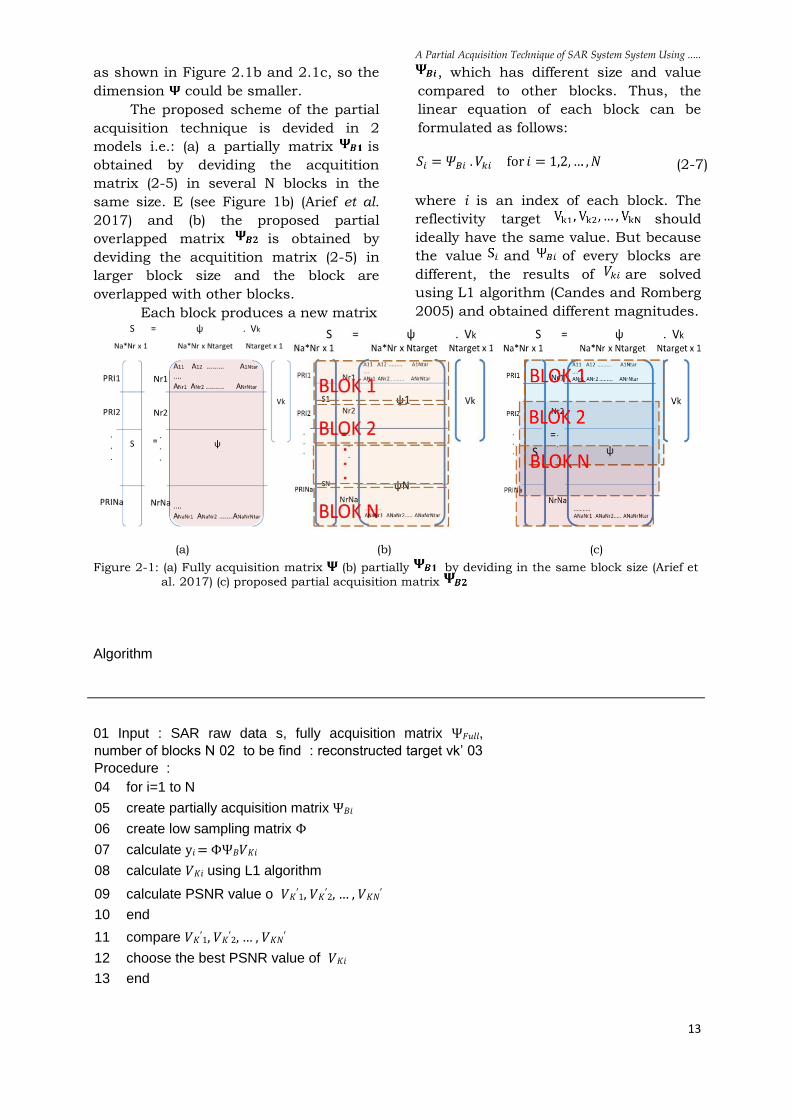
as shown in Figure 2.1b and 2.1c, so the
dimension could be smaller.
The proposed scheme of the partial
acquisition technique is devided in 2
models i.e.: (a) a partially matrix is
obtained by deviding the acquitition
matrix (2-5) in several N blocks in the
same size. E (see Figure 1b) (Arief et al.
2017) and (b) the proposed partial
overlapped matrix is obtained by
deviding the acquitition matrix (2-5) in
larger block size and the block are
overlapped with other blocks.
Each block produces a new matrix
, which has different size and value
compared to other blocks. Thus, the
linear equation of each block can be
formulated as follows:
(2-7)
where i is an index of each block. The
reflectivity target should
ideally have the same value. But because
the value and of every blocks are
different, the results of are solved
using L1 algorithm (Candes and Romberg
2005) and obtained different magnitudes.
(a) (b) (c)
Figure 2-1: (a) Fully acquisition matrix (b) partially by deviding in the same block size (Arief et
al. 2017) (c) proposed partial acquisition matrix
Algorithm
01 Input : SAR raw data s, fully acquisition matrix Ψ𝐹𝑢𝑙𝑙,
number of blocks N 02 to be find : reconstructed target vk’ 03
Procedure :
04 for i=1 to N
05 create partially acquisition matrix Ψ𝐵𝑖
06 create low sampling matrix Φ
07 calculate y𝑖 = ΦΨ𝐵𝑉𝐾𝑖
08 calculate 𝑉𝐾𝑖 using L1 algorithm
09 calculate PSNR value o 𝑉𝐾′1, 𝑉𝐾
′2, … , 𝑉𝐾𝑁
′
10 end
11 compare 𝑉𝐾′1, 𝑉𝐾
′2, … , 𝑉𝐾𝑁
′
12 choose the best PSNR value of 𝑉𝐾𝑖
13 end
Rahmat Arief
14 International Journal of Remote Sensing and Earth Science Vol. 14 No. 1 June 2017
Figure 2-2: Reconstruction algorithm for partially SAR acquisition
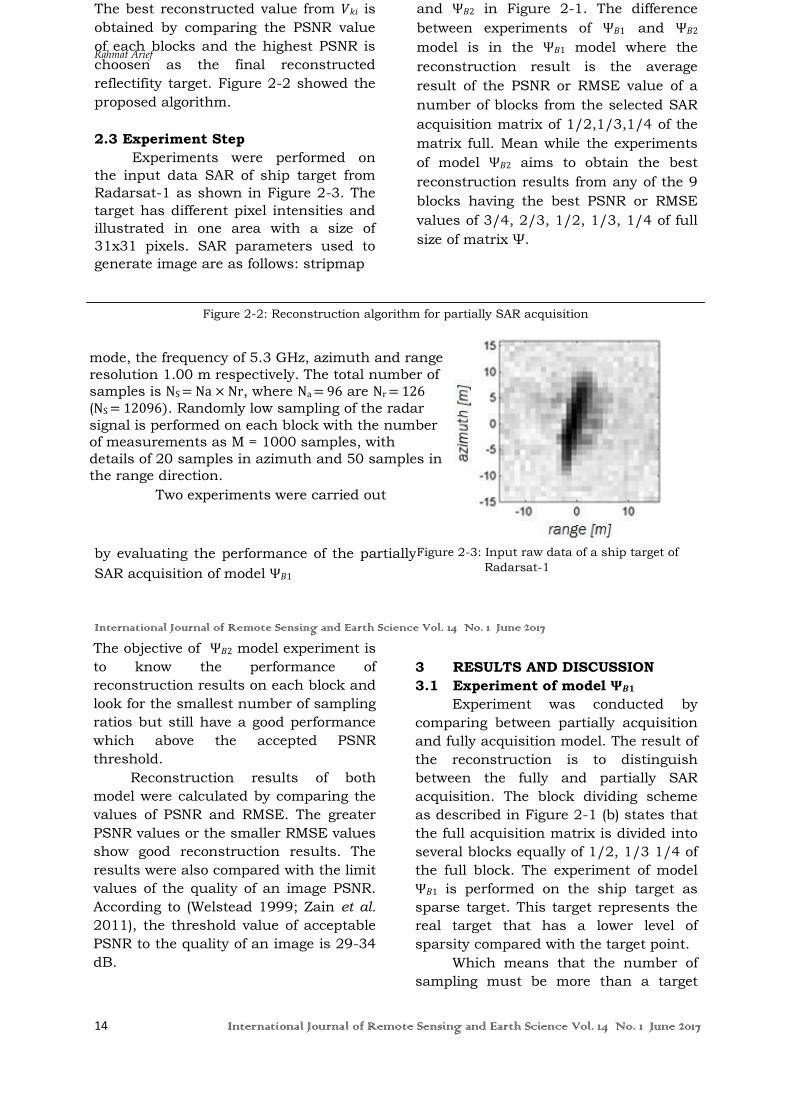
mode, the frequency of 5.3 GHz, azimuth and range
resolution 1.00 m respectively. The total number of
samples is NS = Na × Nr, where Na = 96 are Nr = 126
(NS = 12096). Randomly low sampling of the radar
signal is performed on each block with the number
of measurements as M = 1000 samples, with
details of 20 samples in azimuth and 50 samples in
the range direction.
Two experiments were carried out
by evaluating the performance of the partially
SAR acquisition of model Ψ𝐵1
Figure 2-3: Input raw data of a ship target of Radarsat-1
International Journal of Remote Sensing and Earth Science Vol. 14 No. 1 June 2017
The objective of Ψ𝐵2 model experiment is
to know the performance of
reconstruction results on each block and
look for the smallest number of sampling
ratios but still have a good performance
which above the accepted PSNR
threshold.
Reconstruction results of both
model were calculated by comparing the
values of PSNR and RMSE. The greater
PSNR values or the smaller RMSE values
show good reconstruction results. The
results were also compared with the limit
values of the quality of an image PSNR.
According to (Welstead 1999; Zain et al.
2011), the threshold value of acceptable
PSNR to the quality of an image is 29-34
dB.
3 RESULTS AND DISCUSSION
3.1 Experiment of model 𝚿𝑩𝟏
Experiment was conducted by
comparing between partially acquisition
and fully acquisition model. The result of
the reconstruction is to distinguish
between the fully and partially SAR
acquisition. The block dividing scheme
as described in Figure 2-1 (b) states that
the full acquisition matrix is divided into
several blocks equally of 1/2, 1/3 1/4 of
the full block. The experiment of model
Ψ𝐵1 is performed on the ship target as
sparse target. This target represents the
real target that has a lower level of
sparsity compared with the target point.
Which means that the number of
sampling must be more than a target
The best reconstructed value from 𝑉𝑘𝑖 is
obtained by comparing the PSNR value
of each blocks and the highest PSNR is
choosen as the final reconstructed
reflectifity target. Figure 2-2 showed the
proposed algorithm.
2.3 Experiment Step
Experiments were performed on
the input data SAR of ship target from
Radarsat-1 as shown in Figure 2-3. The
target has different pixel intensities and
illustrated in one area with a size of
31x31 pixels. SAR parameters used to
generate image are as follows: stripmap
and Ψ𝐵2 in Figure 2-1. The difference
between experiments of Ψ𝐵1 and Ψ𝐵2
model is in the Ψ𝐵1 model where the
reconstruction result is the average
result of the PSNR or RMSE value of a
number of blocks from the selected SAR
acquisition matrix of 1/2,1/3,1/4 of the
matrix full. Mean while the experiments
of model Ψ𝐵2 aims to obtain the best
reconstruction results from any of the 9
blocks having the best PSNR or RMSE
values of 3/4, 2/3, 1/2, 1/3, 1/4 of full
size of matrix Ψ.
A Partial Acquisition Technique of SAR System System Using .....
15
point on the same block size to get good
reconstruction results.
Figure 3-1 shows the
reconstruction results with partial
acquisition matrix of model 𝚿𝑩𝟏
compared to full acquisition matrix. In
the experiment, the reconstruction result
was obtained by using CS method in
evaluating the linear model of full SAR
acquisition Ψ𝐹𝑢𝑙𝑙.
The performance of the
reconstruction is influenced by the low
number of M samples at random. The
more sampling numbers are used, the
more accurate the reconstruction results
of the target reflectivity are seen from the
values of
PSNR and RMSE. The number of M
divided by the total number of sampling
in the azimuth direction and range
signifies the data compression ratio (𝑟 =
𝑀⁄𝑁𝑎 × 𝑁𝑟). The number of under
sampling of M is chosen according to the
RIP requirements to ensure good
reconstruction and it depends on the
sparsity of an object (Candes and Recht
2009).
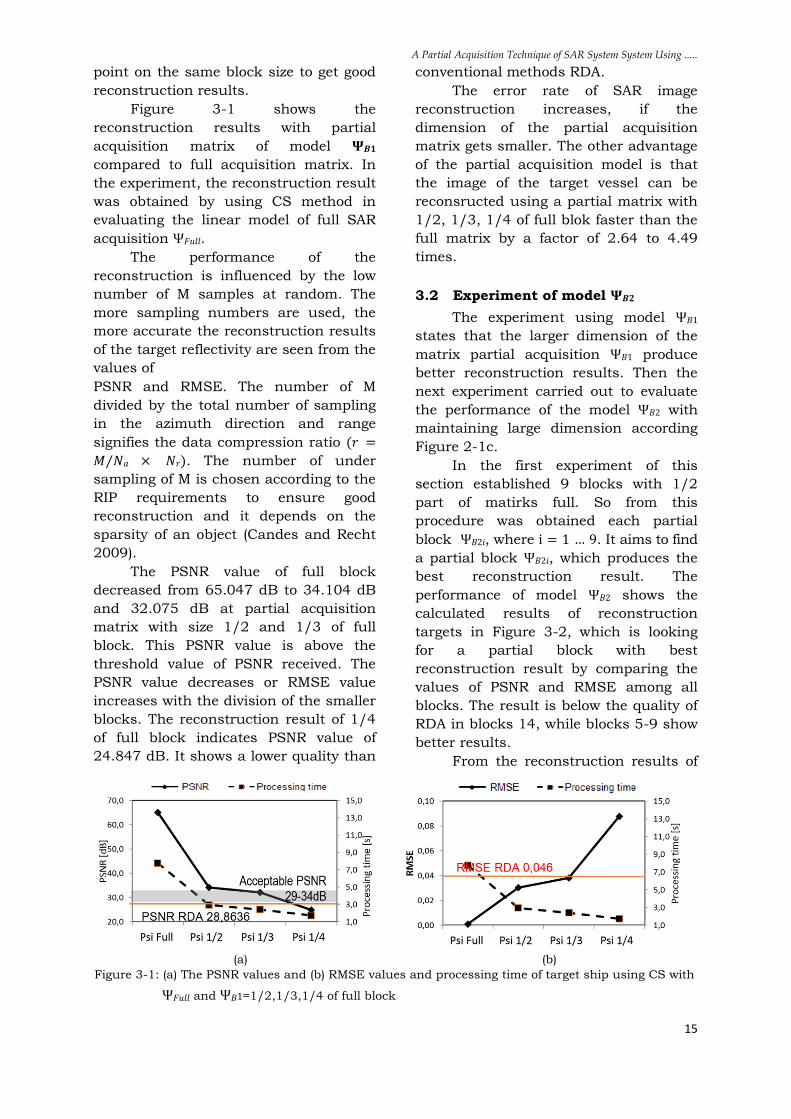
The PSNR value of full block
decreased from 65.047 dB to 34.104 dB
and 32.075 dB at partial acquisition
matrix with size 1/2 and 1/3 of full
block. This PSNR value is above the
threshold value of PSNR received. The
PSNR value decreases or RMSE value
increases with the division of the smaller
blocks. The reconstruction result of 1/4
of full block indicates PSNR value of
24.847 dB. It shows a lower quality than
conventional methods RDA.
The error rate of SAR image
reconstruction increases, if the
dimension of the partial acquisition
matrix gets smaller. The other advantage
of the partial acquisition model is that
the image of the target vessel can be
reconsructed using a partial matrix with
1/2, 1/3, 1/4 of full blok faster than the
full matrix by a factor of 2.64 to 4.49
times.
3.2 Experiment of model 𝚿𝑩𝟐
The experiment using model Ψ𝐵1
states that the larger dimension of the
matrix partial acquisition Ψ𝐵1 produce
better reconstruction results. Then the
next experiment carried out to evaluate
the performance of the model Ψ𝐵2 with
maintaining large dimension according
Figure 2-1c.
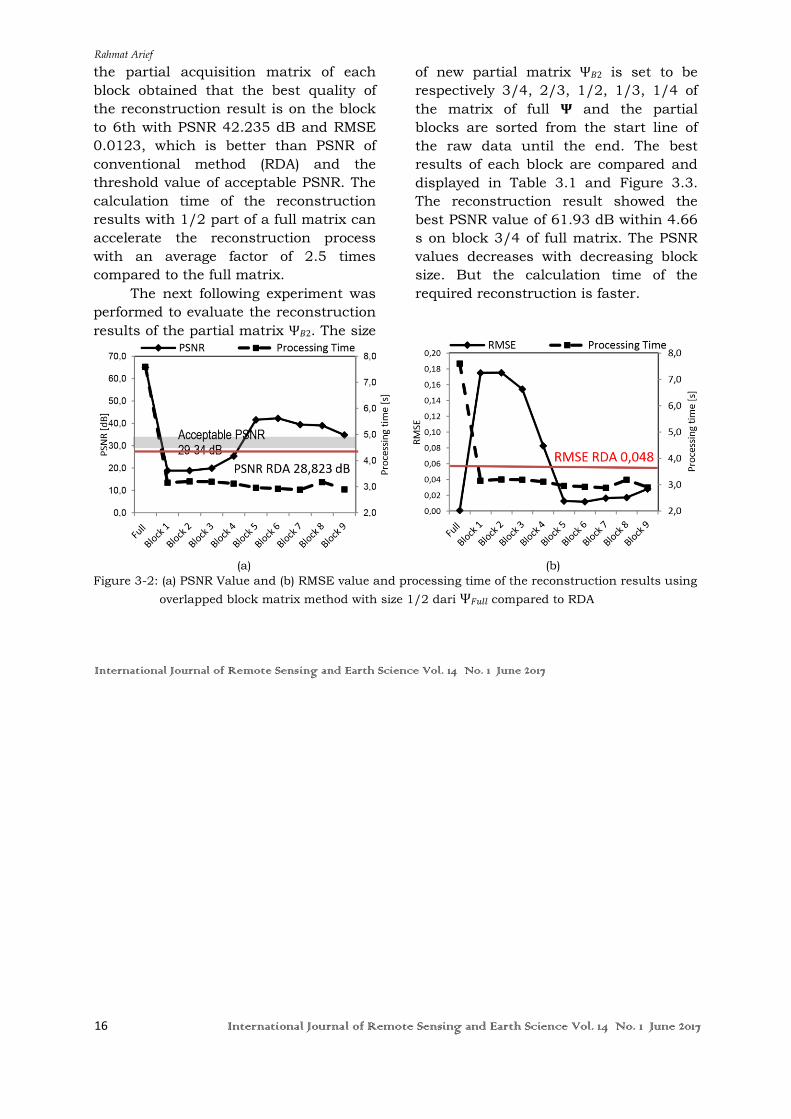
In the first experiment of this
section established 9 blocks with 1/2
part of matirks full. So from this
procedure was obtained each partial
block Ψ𝐵2𝑖, where i = 1 … 9. It aims to find
a partial block Ψ𝐵2𝑖, which produces the
best reconstruction result. The
performance of model Ψ𝐵2 shows the
calculated results of reconstruction
targets in Figure 3-2, which is looking
for a partial block with best
reconstruction result by comparing the
values of PSNR and RMSE among all
blocks. The result is below the quality of
RDA in blocks 14, while blocks 5-9 show
better results.
From the reconstruction results of
(a) (b) Figure 3-1: (a) The PSNR values and (b) RMSE values and processing time of target ship using CS with
Ψ𝐹𝑢𝑙𝑙 and Ψ𝐵1=1/2,1/3,1/4 of full block
Rahmat Arief
16 International Journal of Remote Sensing and Earth Science Vol. 14 No. 1 June 2017
the partial acquisition matrix of each
block obtained that the best quality of
the reconstruction result is on the block
to 6th with PSNR 42.235 dB and RMSE
0.0123, which is better than PSNR of
conventional method (RDA) and the
threshold value of acceptable PSNR. The
calculation time of the reconstruction
results with 1/2 part of a full matrix can
accelerate the reconstruction process
with an average factor of 2.5 times
compared to the full matrix.
The next following experiment was
performed to evaluate the reconstruction
results of the partial matrix Ψ𝐵2. The size
of new partial matrix Ψ𝐵2 is set to be
respectively 3/4, 2/3, 1/2, 1/3, 1/4 of
the matrix of full 𝚿 and the partial
blocks are sorted from the start line of
the raw data until the end. The best
results of each block are compared and
displayed in Table 3.1 and Figure 3.3.
The reconstruction result showed the
best PSNR value of 61.93 dB within 4.66
s on block 3/4 of full matrix. The PSNR
values decreases with decreasing block
size. But the calculation time of the
required reconstruction is faster.
(a) (b) Figure 3-2: (a) PSNR Value and (b) RMSE value and processing time of the reconstruction results using
overlapped block matrix method with size 1/2 dari Ψ𝐹𝑢𝑙𝑙 compared to RDA
International Journal of Remote Sensing and Earth Science Vol. 14 No. 1 June 2017
Rahmat Arief A Partial Acquisition Technique of SAR System System Using .....
4 No. 1 June 201
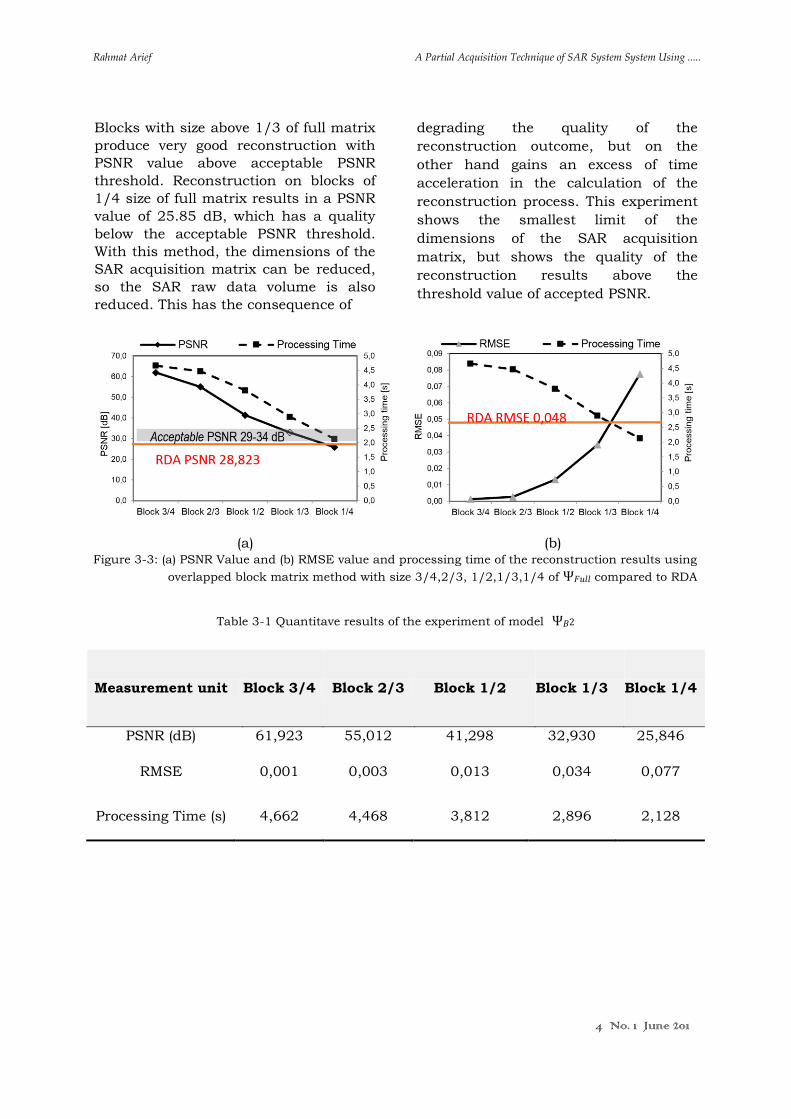
Blocks with size above 1/3 of full matrix
produce very good reconstruction with
PSNR value above acceptable PSNR
threshold. Reconstruction on blocks of
1/4 size of full matrix results in a PSNR
value of 25.85 dB, which has a quality
below the acceptable PSNR threshold.
With this method, the dimensions of the
SAR acquisition matrix can be reduced,
so the SAR raw data volume is also
reduced. This has the consequence of
degrading the quality of the
reconstruction outcome, but on the
other hand gains an excess of time
acceleration in the calculation of the
reconstruction process. This experiment
shows the smallest limit of the
dimensions of the SAR acquisition
matrix, but shows the quality of the
reconstruction results above the
threshold value of accepted PSNR.
(a) (b) Figure 3-3: (a) PSNR Value and (b) RMSE value and processing time of the reconstruction results using
overlapped block matrix method with size 3/4,2/3, 1/2,1/3,1/4 of Ψ𝐹𝑢𝑙𝑙 compared to RDA
Table 3-1 Quantitave results of the experiment of model Ψ𝐵2
Measurement unit Block 3/4 Block 2/3 Block 1/2 Block 1/3 Block 1/4
PSNR (dB) 61,923 55,012 41,298 32,930 25,846
RMSE 0,001 0,003 0,013 0,034 0,077
Processing Time (s) 4,662 4,468 3,812 2,896 2,128
Rahmat Arief
4 No. 1 June 201
4 CONCLUSION
The new method of
partial acquisition techniques have
been proposed and analyzed. The
proposed partial acquisition technique of SAR
system using compressive sampling method
consist of 2 reduction steps of
raw data including to reduce the
sampling rate of ADC of received radar
signals and to reduce the dimension of
the measurement.
This study concludes that the
performance of the proposed technique
could suppress the side lobe and
16International Journal of Remote Sensing and Earth Science Vol. 1 International Journal of Remote Sensing and Earth Science Vol. 14 No. 1 June 2017 167
improve the quality of SAR images better
than those obtained using conventional
method (RDA). The proposed technique
provides with acceptable PSNR with
fewer numbers of measurement of SAR
signals and could speed up the
computation time by a factor of 2.64 to
4.49 times, faster than using a full
acquisition matrix.
ACKNOWLEDGEMENTS
This research was facilitated by the
Remote Sensing Technology and Data
Center. The authors would like to thank
sincerely Prof. Dr.-Ing Kalamullah Ramli,
Mahdi Kartasasmita PhD and
anonymous reviewers for many valuable
comments and suggestions which
significantly improved this paper.
REFERENCES Arief R., Sudiana D., Ramli K., (2016),
Compressed Synthetic Aperture Radar
Imaging Based on Maxwell Equation. J
Teknol 78:15–22. doi: 10.11113/
jt.v78.8922.
Arief R., Sudiana D., Ramli K., (2015), A
Framework of Synthetic Aperture Radar
Imaging Based on Iterative Reweighted
Compressed Sensing. Int J Simul Syst Sci
Technol 16:15.1-15.7.
Arief R., Sudiana D., Ramli K., (2013), Noise
effects on compressed SAR raw data. In:
Proceedings of the 34th Asian Conference
on Remote Sensing (ACRS), 20 – 24
October 2013. Bali, Indonesia, SC02.
1053-1060.
Arief R., Sudiana D., Ramli K., (2017), A study
of the partial acquisition technique to
reduce the amount of SAR data. In: IOP
Conference Series: Earth and
Environmental Science, The 3rd
International Symposium on LAPAN-IPB
Satellite For Food Security and
Environmental Monitoring 2016, 25–26
October 2016, Bogor, Indonesia. Bogor,
Indonesia, 12100.
Attema E., Cafforio C., Gottwald M., et al,
(2010), Flexible Dynamic Block Adaptive
Quantization for Sentinel-1 SAR
Missions. IEEE Geosci Remote Sens Lett
7:766–770.
Baraniuk R., Steeghs P., (2007), Compressive
Radar Imaging. In: Proc. IEEE Radar
Conf. pp 128–133.
Candes EJ, Recht B., (2009), Exact Matrix
Completion via Convex Optimization.
Found Comput Math 9:717. doi: 10.
1007/s10208-009-9045-5.
Candes EJ, Romberg J., (2005), L1-magic:
Recovery of Sparse Signals via Convex
Programming.
Candes EJ, Tao T., (2006), Near-optimal signal
recovery from random projections:
Universal encoding strategies? IEEE
Trans Inf Theory 52:5406–5425.
Candes EJ, Wakin MB, (2008), An Introduction
To Compressive Sampling. IEEE Signal
Process Mag 25:21–30.
Cheney M., Borden B., (2009), Problems in
synthetic-aperture radar imaging. Inverse
Probl 25:123005.
Cumming IG, Wong FH, (2005), Digital
Processing of Synthetic Aperture Radar
Data: Algorithms and Implementation.
Artech House.
Curlander JC, McDonough RN,
(1991), Synthetic Aperture Radar:
Systems and Signal Processing. Wiley.
Donoho DL, (2006), Compressed sensing. IEEE
Trans Inf Theory 52:1289–1306.
A Partial Acquisition Technique of SAR System System Using .....
19
Herman MA, Strohmer T., (2009),
HighResolution Radar via Compressed
Sensing. IEEE Trans Signal Process 57,
n:2275–2284.
Kankaku Y., Osawa Y., Suzuki S., (2011), The
Current Status and Brief Results of
Engineering Model for PALSAR-2 onboard
ALOS-2. In: Proceedings of the 28th ISTS
(International Symposium on Space
Technology and Science), Okinawa,
Japan, June 5-12, 2011. Okinawa,
2011NaN-18.
Kwok R., Johnson W., (1989),Block adaptive
quantization of Magellan SAR data. IEEE
Trans Geosci Remote Sens 27:
Liu D., Boufounos PT, (2011), High Resolution
SAR Imaging Using Random Pulse
Timing. In: Proc. IEEE Int. Geoscience
and Remote Sensing Symp. (IGARSS).
4091–4094.
Patel VM, Easley GR, Healy Jr DM, Chellappa R.,
(2010), Compressed Synthetic
Aperture Radar. IEEE J Sel Top Signal
Process 4:244–254.
Skolnik M., (2008), Radar Handbook, Third
Edition. McGraw-Hill Education.
Sun B., Cao Y., Chen J., et al, (2014),
Compressive sensing imaging for general
synthetic aperture radar echo model
based on Maxwell’s equations.
Wei S-J, Zhang X-L, Shi J., Xiang G., (2010),
Sparse Reconstruction for SAR Imaging
Based on Compressed Sensing. Prog
Electromagn Res 109:63–81.
Welstead ST, (1999), Fractal and Wavelet Image
Compression Techniques. SPIE Optical
Engineering Press.
Yang D., Liao G., Zhu S., et al, (2014), SAR
Imaging with Undersampled Data via
Matrix Completion. IEEE Geosci Remote
Sens Lett 11:1539–1543.
Zain JM, Mohd WMW, El-Qawasmeh E., (2011),
Software Engineering and Computer
Systems, Part I: Springer Berlin
Heidelberg.
18 International Journal of Remote Sensing and Earth Science Vol. 1 7
International Journal of Remote Sensing and Earth Science Vol. 14 No. 1 June 2017