A Panel Data Analysis of Electricity Demand in Pakistan ... · PDF fileAnnual Conference of...
34
The Lahore Journal of Economics, 15: Special Edition: Papers and Proceedings of the Sixth Annual Conference of the Lahore School of Economics, April, 2010 A Panel Data Analysis of Electricity Demand in Pakistan Azam Amjad Chaudhry ∗ Introduction In a period in Pakistan’s economic history when the amount of electricity generated has fallen far short of the economy-wide demand, an analysis of electricity demand is critical for both understanding why the country has reached this point and for determining future policy measures to tackle this shortage. Though the topic of electricity demand in Pakistan is vast in nature, this paper looks at both economy wide demand for electricity and also focuses on industrial level demand. The questions that this paper attempts to answer are questions which both the average Pakistani, the Pakistani business community and the Pakistani policy makers are attempting to answer: What will be the economy-wide demand for electricity in the coming years? What impact will higher electricity prices have on industrial demand for electricity? How does electricity affect industrial level output? Each question is a topic on which one can do vast amounts of research, but this paper looks at each one of them using two unique datasets. Most analyses that try to determine the future electricity demand in Pakistan focus on time series data for Pakistan. This paper takes a different approach: Instead of just focusing on Pakistan, why not use historical data to see how electricity demand has grown over time in other countries? Using a unique panel dataset for 66 countries over ten years taken from the International Energy Agency (IEA) and the Penn World Tables, the relationship between income per capita and electricity consumption per capita is estimated. This is then used to predict the growth in electricity demand in Pakistan over the next 5-10 years. The second set of analyses using data taken from the World Bank Enterprise Surveys for Pakistan to construct a panel dataset for 402 firms over 4 years. This dataset is used to determine the elasticity of electricity ∗ Associate Professor and Dean, Department of Economics, Lahore School of Economics. The research assistance of Rabia Ikram, Rabia Arif and Ayesha Khanum is gratefully acknowledged. Please note: This paper is a preliminary draft and is not for quotation.
Transcript of A Panel Data Analysis of Electricity Demand in Pakistan ... · PDF fileAnnual Conference of...

The Lahore Journal of Economics, 15: Special Edition: Papers and Proceedings of the Sixth Annual Conference of the Lahore School of Economics, April, 2010
A Panel Data Analysis of Electricity Demand in Pakistan
Azam Amjad Chaudhry∗
Introduction
In a period in Pakistan’s economic history when the amount of electricity generated has fallen far short of the economy-wide demand, an analysis of electricity demand is critical for both understanding why the country has reached this point and for determining future policy measures to tackle this shortage. Though the topic of electricity demand in Pakistan is vast in nature, this paper looks at both economy wide demand for electricity and also focuses on industrial level demand.
The questions that this paper attempts to answer are questions which both the average Pakistani, the Pakistani business community and the Pakistani policy makers are attempting to answer: What will be the economy-wide demand for electricity in the coming years? What impact will higher electricity prices have on industrial demand for electricity? How does electricity affect industrial level output? Each question is a topic on which one can do vast amounts of research, but this paper looks at each one of them using two unique datasets.
Most analyses that try to determine the future electricity demand in Pakistan focus on time series data for Pakistan. This paper takes a different approach: Instead of just focusing on Pakistan, why not use historical data to see how electricity demand has grown over time in other countries? Using a unique panel dataset for 66 countries over ten years taken from the International Energy Agency (IEA) and the Penn World Tables, the relationship between income per capita and electricity consumption per capita is estimated. This is then used to predict the growth in electricity demand in Pakistan over the next 5-10 years.
The second set of analyses using data taken from the World Bank Enterprise Surveys for Pakistan to construct a panel dataset for 402 firms over 4 years. This dataset is used to determine the elasticity of electricity
∗ Associate Professor and Dean, Department of Economics, Lahore School of Economics. The research assistance of Rabia Ikram, Rabia Arif and Ayesha Khanum is gratefully acknowledged.
Please note: This paper is a preliminary draft and is not for quotation.

Azam Amjad Chaudhry 2
demand with respect to the price of electricity across firms in Pakistan. This can be used to see the impact of industrial electricity price increases on the demand for electricity in the Pakistani industrial sector. This dataset is also used to estimate the production function for Pakistani firms; this estimation uses a production function that not only has the usual factors of production, labor and capital, but also includes electricity. With these results, one can estimate the impact of reductions in electricity supplies on industrial output.
The setup of the paper is as follows: Section II will provide a brief background on electricity production and prices in Pakistan, and compare it with other countries. Section III will use the IEA dataset to estimate the elasticity of electricity consumption per capita with respect to real income per capita. Section IV will use the World Bank Enterprise Survey dataset to estimate the demand for electricity in the Pakistani manufacturing sector. Section V will use the World Bank Enterprise Survey dataset to estimate a firm level production function with electricity. Section VI will contain conclusions.
II Background
In 1947, Pakistan inherited 60 MW of power generating capacity for a population of 31.5 million people and this was expanded to 119 MW by 1959, just as the country was entering a phase of development that required reliable infrastructure. In the interim, the government acquired a majority shareholding of the Karachi Electric Supply Company (KESC) in 1952 and created the Water and Power Development Authority (WAPDA) in 1958, the purpose of which was to coordinate the development of schemes in water and power.
After its first five years of operation, WAPDA expanded the electricity generation capacity to 636 MW and the increased the number of electrified villages from 609 villages to 1882 villages. This expansion picked up speed in the 1970’s and 1980’s with the generating capacity rising to 1331 MW in 1970, followed by further growth to 3000 MW by 1980 and 7000 MW in 1990-/91.
However rapid urbanization, industrialization and rural electrification initiatives led to a significant growth in the demand for electricity (of a rate of 9-10% per annum) which meant that peak electricity demand fell short of supply by the early 1990’s, requiring approximately 1500 – 2000 MW of load shedding. This shortfall was dealt with by the government with the ‘Policy Framework of Package of Incentives for Private

A Panel Data Analysis of Electricity Demand in Pakistan 3
Sector Power Generation Projects’ in 1994, leading to private sector initiatives in power development and an expansion of the supply to the point at which there was surplus power. But it should be noted that the policy led to the dramatic expansion of thermal projects and resulted in the reversal of the hydel/thermal power generation mix. In 2000, the restructuring of WAPDA started, which eventually resulted in WAPDA being broken down into fourteen separate units: Four thermal generating companies, nine distribution companies and a transmission and distribution company. The main electric power producers in Pakistan are WAPDA, KESC, the Pakistan Atomic Energy Commission and a number of independent power producers (IPPs) established since 1994.
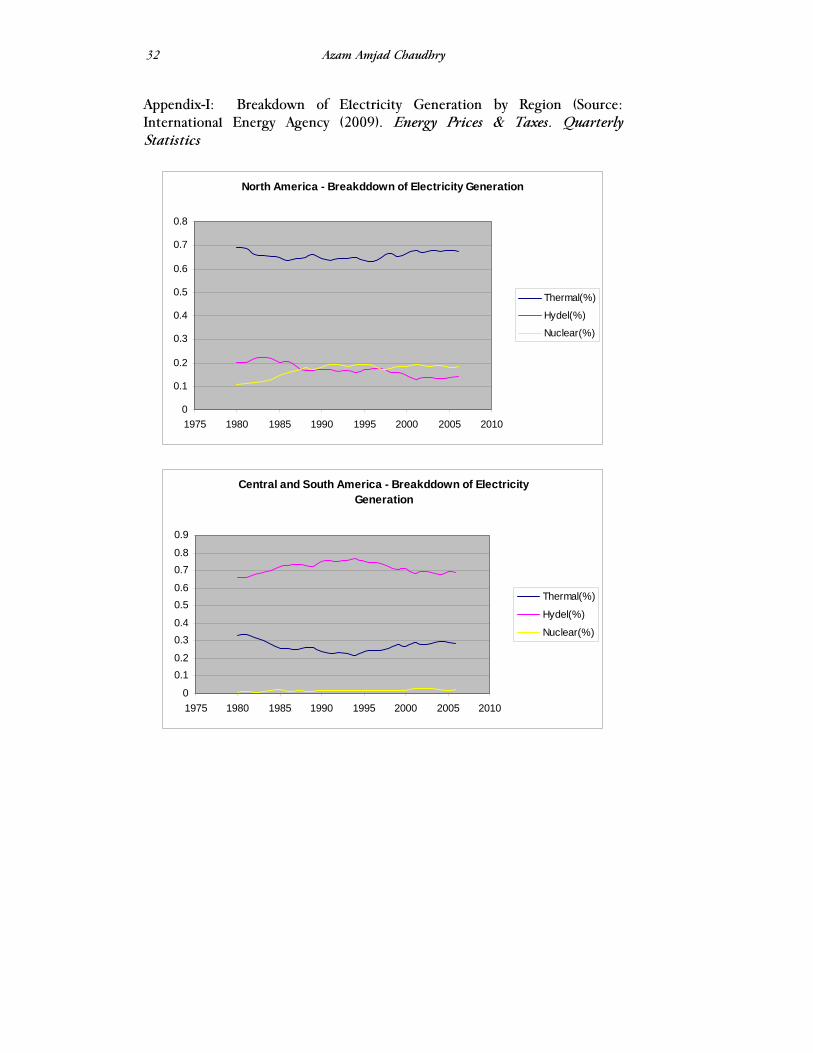
Table-1 shows the current situation in the electricity sector, with an estimated shortfall of 4000 MW in 2008/9 and an estimated shortfall of 5500 MW in 2009/2010. Table-2 and Figure 1 show the breakdown of electricity supply in Pakistan and also illustrate the reversal of the hydel/thermal power generation mix after the 1994 package. Figures 2 and 3 show the breakdown of electricity supplies in India and China in order to provide a comparison (the Appendix shows the breakdown of electricity supplies by region).
Table-1: Projection for demand and supply
S.No. Year Firm Supply (MW)
Peak Demand (MW)
Surplus/(Deficit) (MW)
1 2008-2009 15,055 19,080 (4,025)
2 2009-2010 15,055 20,584 (5,529

Azam Amjad Chaudhry 4
Table-2: Commercial Energy Supplies
Electricity Hydroelectric
(Hydel) Thermal Nuclear
Fiscal Year
Installed Capacity (MW) a
Generation (Gwh) b
Installed Capacity (MW) a
Generation (Gwh) b
Installed Capacity (MW) a
Generation (Gwh) b
Imported (Gwh)
1990-91 2,898 18,343 5,741 22,354 137 385
1991-92 3,330 18,647 5,902 26,375 137 418
1992-93 4,626 21,112 5,823 27,075 137 582
1993-94 4,726 19,436 6,456 30,707 137 497
1994-95 4,826 22,858 7,137 30,176 137 511
1995-96 4,826 23,206 8,006 33,257 137 483
1996-97 4,826 20,858 9,855 37,921 137 346
1997-98 4,826 22,060 10,696 39,669 137 375
1998-99 4,826 22,449 10,700 42,669 137 284
1999-00 4,826 19,288 12,436 46,064 137 399
2000-01 4,857 17,194 12,169 48,926 462 1,997
2001-02 5,041 18,941 12,286 51,174 462 2,291
2002-03 5,041 22,351 12,285 51,591 462 1,740 0
2003-04 6,491 26,944 12,299 52,122 462 1,760 73
2004-05 6,494 25,671 12,423 57,162 462 2,795 109
2005-06 6,499 30,862 12,489 60,283 462 2,484 146
2006-07 6,479 31,953 12,478 63,972 462 2,288 171
2007-08 6,480 28,707 12,478 63,877 462 3,077 199
Jul-March
2007-08 6,482 21,640 12,412 49,825 462 2,319 202
2008-09 6,481 20,526 12,632 p 39154 p 462 918 195
Source: Hydrocarbon Development Institute of Pakistan (HDIP).

A Panel Data Analysis of Electricity Demand in Pakistan 5
Figure 1:
Pakis tan‐E lec tric ity Generation
0
0.2
0.4
0.6
0.8
1975 1980 1985 1990 1995 2000 2005 2010
Year
Proportion of Total
Electricity G
enerated
Thermal(% )
Hydel(% )
Nuc lear(% )
Source: International Energy Agency (2009). Figure 2:
India‐E lec tric ity Generation
0.00
0.20
0.40
0.60
0.80
1.00
1975 1980 1985 1990 1995 2000 2005 2010
Year
Proportion of Total
Electricity G
enerated
Thermal(% )
Hydel(% )
Nuc lear(% )
Source: International Energy Agency (2009).

Azam Amjad Chaudhry 6
Figure 3:
C hina‐E lec tric ity Generation
‐0.20
0.00
0.20
0.40
0.60
0.80
1.00
1975 1980 1985 1990 1995 2000 2005 2010
Year
Pro
portion of Total
Electricity G
enerated
Thermal(% )
Hydel(% )
Nuc lear(% )
Source: International Energy Agency (2009). Figure 4:
-
10,000
20,000
30,000
40,000
50,000
60,000
70,000
80,000
1990 1995 2000 2005 2010
Ener
gy C
onsu
mpt
ion
(Gw
h)
Year
Energy Consumption in Pakistan
HouseholdCommercialIndustrialAgriculturalTotal
Source: Economic Survey of Pakistan (Various Years).
Figure 4 shows the history of energy consumption in Pakistan and shows the higher rate of growth in the demand for household electricity as compared to the demand for electricity in the other sectors. The rate of growth of demand for electricity in the industrial sector (despite a dip in 2005) increased after 2000 and is higher than the growth in demand in the agricultural and commercial sectors.

A Panel Data Analysis of Electricity Demand in Pakistan 7
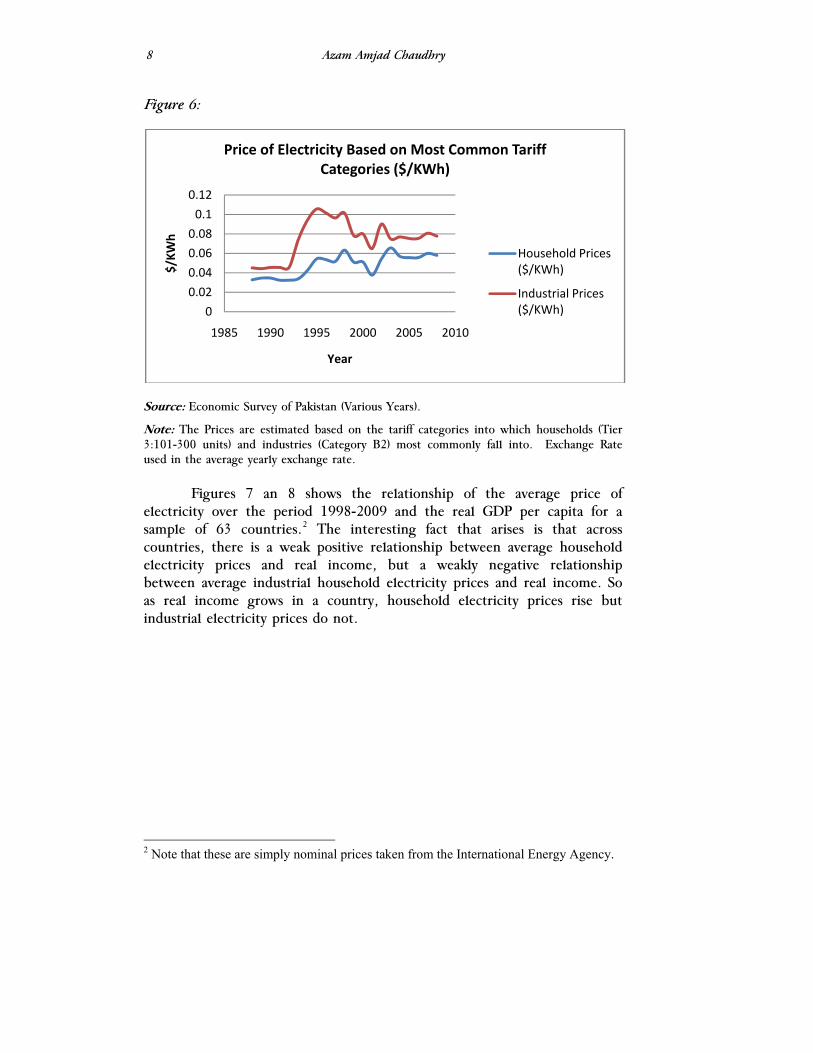
Figures 5 and 6 show the price of electricity in the household and
industrial sectors of Pakistan, based on the most common tariff categories.1 Note that in Rupee terms, the price of electricity has been increasing over time, while in U.S. dollar terms the prices have stabilized. As a point of comparison, the price of electricity in India for households falls roughly into the range of $ 0.065-0.075 and the price of electricity in India for industries falls roughly into the range of $ 0.085-0.092 (Government of India, 2009). Figure 5:
0
1
2
3
4
5
6
1985 1990 1995 2000 2005 2010
Rs/KWh
Year
Price of Electricity Based on Most Common Tariff Categories (Rs/KWh)
Household Prices (Rs/KWh)
Industrial Prices (Rs/KWh)
Source: Economic Survey of Pakistan (Various Years).
Note: The Prices are estimated based on the tariff categories into which households (Tier 3:101-300 units) and industries (Category B2) most commonly fall into.
1 Note that this is not the average price across all tariff categories, but rather the average price of electricity in each sector based on the tariff categories into which most household and industrial consumers fall into.
Azam Amjad Chaudhry 8
Figure 6:
0
0.02
0.04
0.06
0.08
0.1
0.12
1985 1990 1995 2000 2005 2010
$/KW
h
Year
Price of Electricity Based on Most Common Tariff Categories ($/KWh)
Household Prices ($/KWh)
Industrial Prices ($/KWh)
Source: Economic Survey of Pakistan (Various Years).
Note: The Prices are estimated based on the tariff categories into which households (Tier 3:101-300 units) and industries (Category B2) most commonly fall into. Exchange Rate used in the average yearly exchange rate.
Figures 7 an 8 shows the relationship of the average price of electricity over the period 1998-2009 and the real GDP per capita for a sample of 63 countries.2 The interesting fact that arises is that across countries, there is a weak positive relationship between average household electricity prices and real income, but a weakly negative relationship between average industrial household electricity prices and real income. So as real income grows in a country, household electricity prices rise but industrial electricity prices do not.
2 Note that these are simply nominal prices taken from the International Energy Agency.

A Panel Data Analysis of Electricity Demand in Pakistan 9
Figure 7:
Average Price of Electricity for Households Across Countries (Using Averages from 1998-2008)
y = 9E-07x + 0.1074R2 = 0.0521
0
0.05
0.1
0.15
0.2
0.25
0.3
0 10000 20000 30000 40000 50000 60000 70000
GDP Per Capita ($)
Ave
rage
Pric
e of
Ele
ctric
ity fo
r H
ouse
hold
s ($
/KW
H)
HPRICE
Linear (HPRICE)
Source: International Energy Agency (2009) and Heston, Summers and Aten (2009).
Figure 8:
Average Price of Electricity for Industries Across Countries (Using Averages from 1998-2008)
y = -8E-07x + 0.0994R2 = 0.0423
0
0.05
0.1
0.15
0.2
0.25
0 20000 40000 60000 80000
GDP Per Capita ($/KWH)
Ave
rage
Pric
e of
Ele
ctric
ity fo
r In
dust
ries
($/K
WH
)
INDPRICE
Linear (INDPRICE)
Source: International Energy Agency (2009) and Heston, Summers and Aten (2009).

Azam Amjad Chaudhry 10
III Cross Country Analysis of Demand for Electricity
Economists and policymakers are not only concerned with the impact of electricity shortages on consumers and industries, but are also concerned with determining the potential gap between electricity supply and electricity demand in the future. While policy makers struggle with fulfilling the current level of demand, it would be a critical mistake to try and aim towards the target of energy consumption today. Rather, they should be formulating a strategy to meet the potential energy demand in the next four to five years.
The purpose of this section is to look at cross-country evidence to determine what happens to the total demand for electricity as per capita GDP increases. Using a unique panel dataset with 66 countries, the elasticity of electricity consumption with respect to per capita income is calculated.
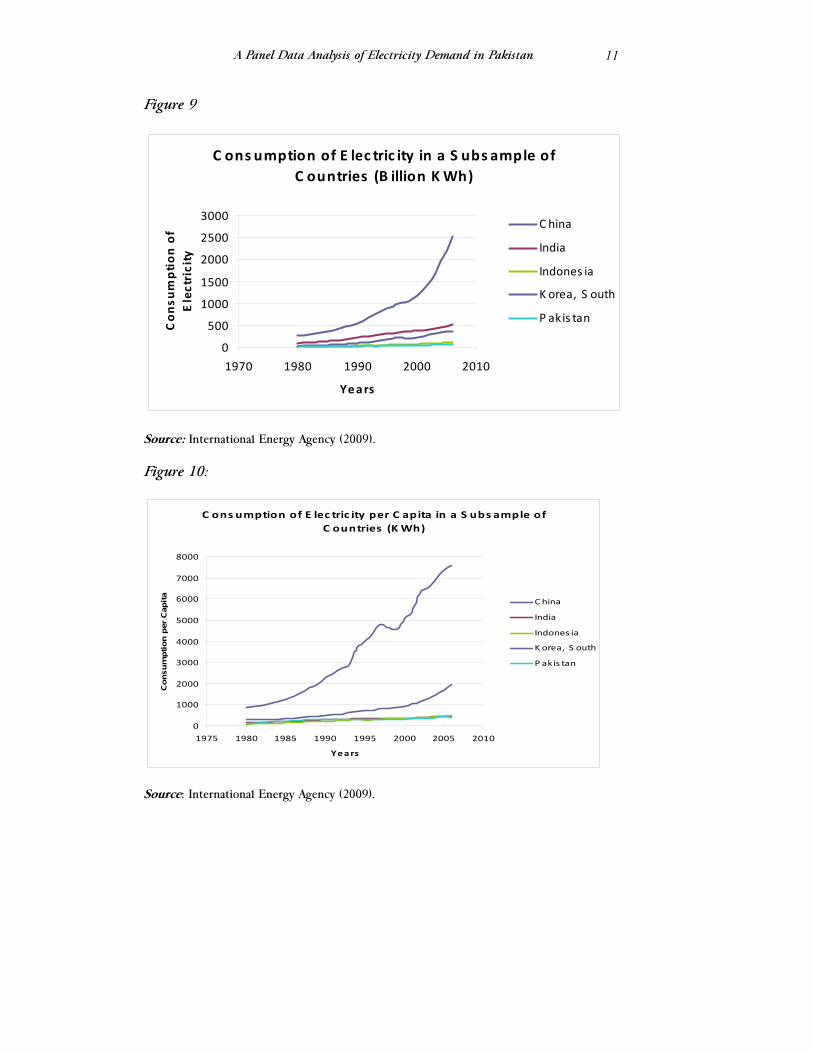
Figure 9 and Figure 10 show Total electricity consumption and electricity consumption per capita in five countries (China, Indonesia, India, South Korea and Pakistan). As can be seen, there has been a dramatic increase in total electricity consumption in China, while the increases in energy consumption in the four other countries has been at a constant rate. Per capita consumption of electricity is far more revealing: China and South Korea have had dramatic increases in their per capita consumption (primarily due to increases in industrial output and demand), while per capita consumption in Pakistan, India and Indonesia have grown at about the same rate.
A Panel Data Analysis of Electricity Demand in Pakistan 11
Figure 9
C ons umption of E lec tric ity in a S ubs ample of C ountries (B illion KWh)
0
500
1000
1500
2000
2500
3000
1970 1980 1990 2000 2010
Years
Consu
mption of
Electricity
C hina
India
Indones ia
K orea, S outh
P akis tan
Source: International Energy Agency (2009).
Figure 10:
C ons umption of E lec tric ity per C apita in a S ubs ample of C ountries (K Wh)
0
1000
2000
3000
4000
5000
6000
7000
8000
1975 1980 1985 1990 1995 2000 2005 2010
Years
Consumption per Capita
China
India
Indones ia
K orea, S outh
P akis tan
Source: International Energy Agency (2009).

Azam Amjad Chaudhry 12
Figure 3 shows average per capita consumption of electricity for a group of countries. In it, one can see that for the period 1998-2008, countries with higher real per capita GDP had higher levels of electricity consumption per capita. The fact that one has data for 66 countries across a period of 10 years3 means that one can use a simple fixed effects model to estimate the elasticity of electricity consumption per capita with respect to per capita income. Figure 11:
Consumption Per Capita of Electricity Across Countries (Average 1998-2008)
0
5000
10000
15000
20000
25000
30000
0 10000 20000 30000 40000 50000 60000 70000
Real GDP Per Capita ($)
Elec
trici
ty C
onsu
mpt
ion
per C
apita
(KW
H)
CONSCAP
Source: International Energy Agency (2009) and Heston, Summers and Aten (2009).
Econometric Model
The basic formulation used to look at the relationship between per capita consumption of electricity, real per capita income and electricity prices is as follows:
electit = β1pcincomeit + β2prelectit + ηi + εit
3 It should be noted at this stage that the data from the International Energy Agency did not contain consumption and price data for all years for each country and thus the panel is unbalanced.

A Panel Data Analysis of Electricity Demand in Pakistan 13
Where:
electit is the per capita consumption of electricity in country i at time t
pcincomeit is the real per capita income of country i in time t
prelectit is the average price of electricity in country i in time t
ηi is the time invariant country specific effect that may be interpreted as the state of technology in country i or level of natural resources.
εit is the idiosyncratic error term that is uncorrelated with the explanatory variables
The fixed effects (or within groups) estimator is based on the transformed equation in which the country specific effect is eliminated:
(electrit-electribar)=β1(pcincomeit-pcincomei
bar) + β2(prelectit-prelectibar) + (εit-
εibar)
Under the assumption of exogeneity of explanatory variables, the fixed effects estimators give unbiased estimates of the elasticity of electricity consumption per capita with respect to real per capita income and electricity prices.
Description of the Data
The data used is in this analysis is taken from the International Energy Agency’s (IEA) Energy Prices and Taxes, Quarterly Statistics (3rd Quarter, 2009). The IEA report contains data on economy wide electricity consumption and average household and industrial electricity prices for 66 countries for the period 1998-2008. Data on population and real per capita GDP is taken from the Penn World Tables (Heston, Summers and Aten, 2009). Excluding missing data, a panel with 63 countries over a 10 year period is formed.
Empirical Results
The results of the fixed effects estimation are shown in Table-1. Basically, the results show that the elasticity of per capita demand for electricity with respect to per capita income is approximately 0.69. This means that a 5% increase in per capital income in Pakistan will be accompanied by a 3.5% increase in the demand for electricity per capita in

Azam Amjad Chaudhry 14
Pakistan. As a simple, back of the envelope calculation, if real GDP growth is approximately 5% per year for five years and population growth is approximately 2% per year, then electricity demand will increase by approximately 9%. So if policy makers are looking at projects to meet the current energy shortfall and these projects come on line in about 5 years, they should be looking to meet both current electricity demand plus another 9%.
Table-1: Estimates of Per Capita Demand for Electricity for All Countries
Model Pooled Cross-Section Fixed Effects
Log(GDP Per Capita) 1.282** (.026)
0.687** (.104)
Log(Price) -0.325** (.037)
.012 (.025)
Constant -5.042** (.297)
1.59 (1.04)
Number of Countries 63 63
R2 0.875 0.843 R2 within 0.616 Parameters 2 2
Observations 344 344
*Significant at 10% level. **Significant at 1% level.
Before one moves on, one may want to consider the possibility that low and middle income countries may have a greater elasticity of electricity consumption than higher income countries, because low and middle income countries may be in the process of rapid industrialization which could have a significant impact on their consumption per capita. The analysis above was also performed for low and middle income countries (based on the World Bank definition of low and middle income countries) and the results are shown below. As can be seen, the elasticity of electricity consumption with respect to income per capita is not significantly different from the estimates for the entire sample.

A Panel Data Analysis of Electricity Demand in Pakistan 15
Table-2: Estimates of Per Capita Demand for Electricity for Low and Middle Income Countries
Model Pooled Cross-Section Fixed Effects
Log(GDP Per Capita) 1.62** (0 .083)
0.65** (0.113)
Log(Price) -.212** (0.057)
0.036 (0.033)
Constant -7.60** (0. .73)
1.52 (0.993)
Number of Countries 28 28
R2 0.784 0.732
R2 within 0.695
Parameters 2 2
Observations 117 117
*Significant at 10% level. **Significant at 1% level.
IV Micro Level Analysis of Demand for Electricity in the Industrial Sector of Pakistan
Over the last decade, policy makers, economists and the businessman have increasingly concerned with the demand by the household and manufacturing sectors for electricity. As the price of electricity facing both households and firms has increased, the question of the impact of higher electricity prices on standards of living and on manufacturing output has become critical from both a welfare perspective and an economic growth perspective. The purpose of this section of the paper is to use firm level data to determine the elasticity of manufacturing output with respect to the price of industrial electricity.
Most of the analyses with regards to the demand for electricity use time series data and macroeconometric tools to look at the response of economy-wide demand for electricity (or the demand for electricity by a particular sector, such as the household or manufacturing sector) to changes in the price of electricity. Over the last decade, the availability of better quality disaggregated data has enabled researchers to begin to focus on micro level analyses of the demand for electricity, with an emphasis on either household demand for electricity or firm level demand for electricity.

Azam Amjad Chaudhry 16
At the firm level, a few studies such as Woodland (1993) and Bjorner et al (2001) use panel data on firms to see the impact of changes in the prices of electricity on firm level output. The main benefit of a panel data set is that it allows one to relax the strict assumptions about the uniformity of the estimated parameters. The analysis in this section uses a relatively new panel data set containing data on 402 firms over 4 different years to determine the impact of changes in the price of industrial electricity on the demand for electricity by Pakistani manufacturing firms. Using this data, a fixed effects model is estimated for all the 402 firms to find the aggregate elasticity of electricity demand with respect to price. This is followed by a disaggregated analysis in which the firms are divided according to sub-sector to determine each sub-sector’s specific price elasticity of demand. The sub-sectors analyzed are the textile sector, the food sector, the chemical sector, the leather sector and a final sector that combines the electronics and other manufacturing sectors.
Microeconomic Foundations of Estimated Model
For firms, electricity is used as an input in their production functions. If one makes the assumption that firms consider the price of electricity and other factors of production to be exogenous and that each firm minimizes its cost function, the demand function can be simply expressed as a function of the factors of production and the level of production (Bjorner, 2001). Thus the firms short term problem of minimizing production costs can be expressed as:
C(p,y) = Min (p1x1 + …pnxn)
s.t.
f(x1,…, xn) ≥ y and (x1,…, xn) ≥ 0
where (p1 + …pn) are given factor prices for the n inputs, (x1,…, xn) are the quantities of of the n inputs used, y is the level of output and f(x1,…, xn) is the production function indicating the feasible output.
Shephard’s Lemma yields the factor demand functions Xi(p,y):
Xi(p,y) = ∂C(p,y)/∂pi i= 1,..,n
So the demand for electricity can be expressed as:
E = f(pe,pother,y)

A Panel Data Analysis of Electricity Demand in Pakistan 17
Where E is electricity demand, pe is the price of electricity, pother is the prices of the other factors of production and y is the level of output.
If one makes the assumption that electricity is separable from other inputs so that the relationship between electricity with other inputs is neutral in terms of price, it is possible to exclude the price of other inputs from the model.
Econometric Model
When deciding the function form, one finds that there is very little consensus about the ‘correct’ functional form, though most studies used either a linear or a logarithmic form. In this paper, a simple log linear form is adopted, similar to Bjorner et al (2001):
LEit = αi + β1LFYit + β2LPEit + λt + νit
νit ~ i.i.d N(0,σν2I)
where LEit is the log of electricity consumption in time t for the ith firm measured in KWH, LFYit is the log of yearly output in rupees in time t of firm i adjusted by a price deflator for output, LPEit is the average price of electricity faced by firm i in time t, also adjusted by a price deflator. The parameter β1 measures the elasticity of electricity demand with respect to output and the parameter β2 measures the elasticity of electricity demand with respect to electricity price.
In the model above, it is assumed that all the parameters are equal across firms, except for αi, which captures all unobservable heterogeneous company level variables that affect electricity demand, such as management ability, sector of production, etc. The parameter λt captures the effect of changes in unobserved variables that influence companies equally, such as technological changes, temperature, government policies, etc.
Similar to the estimators from the last section, the fixed effects estimators are derived as follows:
(LEit -LEibar) = β1(LFYit -LFYi
bar) + β2(LPEit- LPEi
bar) + (νit- νibar)
Where the subscript, bar, represents the average variable for country i across time.

Azam Amjad Chaudhry 18
It should be noted that the simple model above assumes that the parameters measuring elasticities of electricity demand with respect to output and prices is assumed to be the same across all firms. In all actuality, it is much more likely that the elasticities will vary across industries because different types of companies respond in different ways to changes in output and changes in electricity prices. For this reason, the model above is also estimated for the following industrial sub-sectors: the textile sector, the food sector, the chemical sector, the leather sector and a final sector that combines the electronics and other manufacturing sectors.
Description of the Data
The data is taken primarily from two sources: Firm level data on annual output, and annual electricity expenditures are taken from the World Bank’s Enterprise Surveys, 2002 and 2006/07 while data on industrial electricity tariff structures is taken from the Economic Survey of Pakistan.
The World Bank Enterprise Survey (conducted as a part of the World Bank’s Investment Climate Assessment for Pakistan) was administered twice in Pakistan, in 2002 and 2006/2007. The firm level surveys were conducted for a representative sample of firms in the private sector, focused on the manufacturing sector, and was answered by business owners and top managers. The Enterprise Survey conducted in Pakistan gathered information on firm level characteristics, annual sales of firms, costs of inputs and labor, and indicators of business environment. There were a total of 402 firms for which data was collected in both surveys.
For the purposes of the analysis in this section, firm level data was taken for the value of annual output and annual expenditures on electricity. A extremely useful fact of the survey was that it not only collected data for the year of the surveys (2002 and 2006/07), but also collected some (though not all) data on the ‘previous year’. So one could gather firm level data on firm level characteristics, annual sales and expenditures on electricity for 4 years (2001, 2002, 2005/6 and 2006/7). Thus, one was able to construct a panel dataset for 402 firms for a period of 4 years.
The economic survey of Pakistan was used to calculate the average price of electricity faced by each firm. Since the firm level surveys only had data on annual expenditures on electricity, the following procedure was adopted to calculate an ‘average price of electricity’ facing each firm: For each of the years of the survey, the tariff structure for industrial electricity was taken from the Economic Survey of Pakistan. Then for each category of industrial electricity consumers (B2, B3 and B4) a range was created in
A Panel Data Analysis of Electricity Demand in Pakistan 19
which the annual expenditure on electricity would fit into. Based, on these ranges, each of the 402 firms was placed in a tariff category. After this, the tariff structure was again used to calculate an average price of electricity in (Rs/KWH) for each tariff category, based on average annual usage of electricity. This average price was then used in conjunction with the firm level data on annual expenditures on electricity to calculate the consumption of electricity for each firm (in KWH).
From these two sources, one obtained data on annual electricity consumption Eit (in KWH), annual output FYit (in Rupees) and annual average price of electricity PEit (in Rs/KWH) for each of the 402 firms for 4 years. In order to estimate the log-linear form of the electricity demand function (described above), natural logs were taken of the variables to obtain LEit, LFYit and LPEit.
Empirical Results
The results for the sample of all firms is given in Table-3, which show both the pooled OLS estimates and the fixed effects estimates. As the results show, the price elasticity of electricity demand across the sample of firms is -0.57 and the output elasticity of the demand for electricity is 0.194. The results imply that a 10% increase in the price of industrial electricity will lead to a 5.7% decrease in the demand for electricity, making the demand for elasticity relatively inelastic with respect to price. Also, a 10% increase in firm level output will lead to a 1.9% increase in the demand for electricity.
The results for the estimation of the model for the sub-samples according to sector is given in Table-4. As the results show, the textile sector has the highest price elasticity of demand for electricity (-0.81) which is significantly higher than the mean price elasticity discussed. Also, the demand for electricity in the food sector is more elastic with respect to price (-0.67) than the average firm. The only other significant result is that the price elasticity of demand for electricity in the electronics and other manufacturing sector is equal to -0.31, while the other price elasticities (for the chemical and leather sub-sectors) are insignificant.
Though the price elasticities are all less than one, they are higher than estimates obtained from similar studies in other countries. Bjorner et al (2001) found price elasticies in the range of -0.4-0.06 across Danish industrial sub-sectors. Woodland (1993) found price elasticities greater than one for a sample of Australian firms, though he chose firms that used coal,

Azam Amjad Chaudhry 20
oil, gas and electricity which would allow firms to switch away for electricity as an input when faced with higher prices.
The results could imply two things: First, if the textile and food sectors are the ones with the most private electricity generating capacity (generators), then they would be able to reduce their demand for external electricity the most easily, though switching the own-generated electricity may substantially increase their costs.4 Second, if the firms in these sectors are not all generating their own electricity, then their overall electricity usage (and overall output) are most susceptible to increases in electricity prices. It is important to understand the implications of higher industrial electricity prices in both cases.
Table-3: Estimates of Electricity Demand Function for All Firms
Model Pooled Cross-Section Fixed Effects
Log(Output) 0.297** (0.007)
0.194** (0.017)
Log( Price) -0.552** (0.086)
-0.574** (0.107)
Constant 0.942** (0.17)
2.69** (0.332)
Number of Firms 399 399
R2 0.5624 0.5583
R2 within 0.27
Parameters 2 2
Observations 1467 1467
*Significant at 10% level. **Significant at 1% level.
4 The question would be far easier to answer if the question on electricity expenditures in the Enterprise Survey had separated out expenditures on outside electricity and expenditures on own-generated electricity. Unfortunately, this distinction was not made clear in the survey.

A Panel Data Analysis of Electricity Demand in Pakistan 21
Table-4: Estimates of Demand Function for Electricity by Industrial Subsector
Industrial Sub-Sector Model Pooled Cross-Section
Fixed Effects
Textiles Log(Output) 0.327**
(0.011) 0.215** (0.026)
Log( Price) -0.808** (0.132)
-0.807** (0.167)
Constant 0.912** (0.263)
2.788** (0.492)
Number of Firms 176 176 R2 0.615 0.609 R2 within 0.310 Parameters 2 2 Observations 643 643 Food Log(Output) 0.220**
(0.018) 0.196** (0.048)
Log( Price) -0.609** (0.207)
-0.671* (0.358)
Constant 2.44** (0.46)
2.932* (1.177)
Number of Firms 62 62 R2 0.457 0.456 R2 within 0.350 Parameters 2 2 Observations 230 230 Chemicals Log(Output) 0.280**
(0.021) 0.15* (0.063)
Log( Price) -0.030 (0.248)
0.084 (0.334)
Constant 0.383 (0.519)
2.478* (1.17)
Number of Firms 45 45 R2 0.522 0.524

Azam Amjad Chaudhry 22
R2 within 0.1313 Parameters 2 2 Observations 159 159 Leather Log(Output) 0.272**
(0.026) 0.122* (0.048)
Log( Price) 0.038 (0.283)
-0.271 (0.273)
Constant 0.289 (0.567)
3.12** (0.862)
Number of Firms 25 25 R2 0.546 0.187 R2 within 0.187 Parameters 2 2 Observations 94 94 Electronics, Machinery and other Manufacturing
Log(Output) 0.243** (0.014)
0.141** (0.039)
Log( Price) -0.366* (0.162)
-0.31* (0.182)
Constant 1.394** (0.300)
2.95** (0.660)
Number of Firms 83 83 R2 0.489 0.487 R2 within 0.12 Parameters 2 2 Observations 311 311
*Significant at 10% level. **Significant at 1% level.
V Micro Level Analysis of the Production Functions of Pakistani Firms
Analyses of production functions dates back to the 1920’s, when macro level data was used to estimate an economy-wide production function in order to test marginal productivity theory and labor market competitiveness. In the 1960’s the emphasis shifted from macroeconomic analyses to microeconomic analyses, especially in the area of agriculture.
A Panel Data Analysis of Electricity Demand in Pakistan 23
Usual estimations of the production function focus on two factors of production, typically labor and capital. In more recent times, other factors of production have been included in the estimation process, ranging from land to human capital. The analysis in this section extends the normal firm level production function to include electricity.
The reason for doing this because of the realities facing the Pakistani manufacturing sector. Unlike the other economies for which firm level production functions (and price elasticities of electricity demand) are estimated, Pakistan faces a severe shortage of electricity which is set to continue into the indefinite future. For this reason, the estimation of a firm level production function with electricity as an input can give us an estimate of the elasticity of output with respect to electricity, which in turn can provide us with estimates of the impact of decreases in the amount of available electricity on manufacturing sector output.
As in the analysis in the previous section, this analysis employs the panel data set from the World Bank’s enterprise survey to estimate a fixed effects model of a firm level production function. Also like the previous section, the analysis is performed for all firms in the sample, and also for firms in particular sub-sectors. Again, the sub-sectors analyzed are the textile sector, the food sector, the chemical sector, the leather sector and a final sector that combines the electronics and other manufacturing sectors.
Econometric Model
As discussed in Aguirregabiria (2009), there are numerous ways to estimate firm-level production functions, ranging from simple OLS to GMM estimation for dynamic panel data. This paper adopts a within-firms estimator for a Cobb-Douglas production function originally based on the work of Mundlak (1961) and Mundlach and Hoch (1965):
yit = αLlit + αKkit + αEeit +ωit + εit
where:
yit is the log of output of firm i in time t
lit is the log of labor employed in firm i in time t
kit is the log of capital used by firm i in time t
eit is the log of electricity usage of firm i in time t

Azam Amjad Chaudhry 24
ωit = ηi + δt + ωit*, where ηi is a time invariant firm specific effect such as the quality of a fixed input such as managerial ability, or land quality, δt is an aggregate shock affecting all firms and ωit* is a firm level idiosyncratic shock.
εit an idiosyncratic error term
Based on the assumptions that (1) idiosyncratic shocks, ωit*, are realized after the firm decides on its level of inputs, (2) idiosyncratic shocks, ωit*, are not serially correlated, and that the amount of inputs depends on some other exogenous time varying variables, we can derive the fixed effects estimator of the production function which removes the fixed affect ηi:
(yit-yibar) = αL(lit- li
bar) + αK(kit-kibar) + αE(eit- ei
bar) + (ωit-ωibar)+ (εit- εi
bar)
Description of the Data
The firm level dataset from the Enterprise Survey for Pakistan (and described in the last section) was used to gather firm level data on annual output, annual amount of labor employed, annual capital stocks and annual electricity consumption. But unlike the dataset used in the last section, some of the data on the variables used in the estimation of the production function (labor employed and capital stocks) was not available for the year before the survey year. Thus for this analysis, the firm level data for 402 firms for 2 years (2002 and 2006/7) was used. After the model is estimated for all the firms, the model is also estimated for the textile sector, the food sector, the chemical sector, the leather sector and a final sector that combines the electronics and other manufacturing sectors.
Empirical Results
The estimation results for the entire sample of firms is given in Table-5. The results show that the coefficient of (log) electricity in the production function is 0.502 implying that a 10% decrease in electricity inputs can lead to a 5% decrease in industrial output. Though these results are significant, they need to be viewed with caution with regards to policy making. Since we are unsure of the external/own-generated breakup of the firms electricity inputs, one cannot simply say that if external electricity supplies fall by 10%, then output falls by 5%, because a 10% fall in external electricity supplies may be partially (or fully) offset by private electricity generation. So, though electricity is a critical factor of production across firms, it is difficult to predict exactly what happens to output, though one

A Panel Data Analysis of Electricity Demand in Pakistan 25
can be sure of the fact that shortages in external electricity supplies and increased dependence of own-generated electricity.
The estimations for different manufacturing sub-sectors is given in Table-6. Note that the elasticities of output with respect to electricity inputs is found to be insignificant across most industries, with the exception of the food sub-sector (which seems to be unrealistically high). This could be due to smaller sample sizes in each analysis (because of the smaller panel used in the analysis).
Analyzing the full sample results again, show that electricity is a critical input in the production function across firms and the elasticity of output with respect to electricity inputs is as high as that of labor, and significantly higher than the elasticity of output with respect to capital. In terms of policy-making, one has to realize that with its present levels of technology, the Pakistani manufacturing sector is heavily reliant on labor and electricity and far less on capital. Electricity shortages will either force smaller firms without own-electricity generating capacity to significantly decrease their output, or will face firms with their own electricity generating capacity to face significantly higher input prices.
Table-5: Estimates of Production Function for All Firms
Model Pooled Cross-Section Fixed Effects
Log(Capital) 0.195** (0.035)
0.170** (0.075)
Log( Labour) 0.597** (0.057)
0.508** (0.108)
Log(Electricity) 0.914** (0.089)
0.502** (0.166)
Constant 6.799** (0.475)
9.614** (1.29)
Number of Firms 386 386
R2 0.64 0.636
R2 within 0.257
Parameters 3 3
*Significant at 10% level. **Significant at 1% level.

Azam Amjad Chaudhry 26
Table-6: Estimates of Production Function for Firms According to Sub-Sector
Industrial Sub-Sector Model Pooled Cross-Section
Fixed Effects
Textiles Log(Capital) 0.217**
(0.055) 0.159* (0.091)
Log( Labour) 0.518**(0.082)
0.523** (0.150)
Log(Electricity) 0.849**(0.125)
0.299(0.237)
Constant 6.86**(0.725)
10.63** (1.63)
Number of Firms 169 169 R2 0.678 0.660 R2 within 0.283 Parameters 3 3 Observations 248 248Food Log(Capital) 0.399*
(0.082) 0.42** (0.15)
Log( Labour) 0.408**(0.155)
0.093(0.243)
Log(Electricity) 1.183**(0.205)
0.934** (1.152)
Constant 2.91*(1.31)
5.031(3.18)
Number of Firms 62 62 R2 0.572 0.554 R2 within 0.473 Parameters 3 3 Observations 106 106Chemicals Log(Capital) 0.324**
(0.109) 0.278* (0.160)
Log( Labour) 0.649**(0.157)
0.502* (0.248)
Log(Electricity) 0.613**(0.261)
0.03(0.428)

A Panel Data Analysis of Electricity Demand in Pakistan 27
Constant 6.19**(1.42)
10.61** (2.01)
Number of Firms 43 43 R2 0.693 0.685 R2 within 0.284 Parameters 3 3 Observations 70 70Leather Log(Capital) 0.024
(0.291) 0.035(0.102)
Log( Labour) 0.330(0.291)
0.712** (0.259)
Log(Electricity) 2.12**(0.533)
-0.128 (0.915)
Constant 4.58*(2.19)
13.98** (3.64)
Number of Firms 22 22 R2 0.661 0.445 R2 within 0.259 Parameters 3 3 Observations 35 35Electronics, Machinery and other Manufacturing
Log(Capital) 0.020(0.076)
-0.121 (0.105)
Log( Labour) 1.095**(0.135)
1.101** (0.316)
Log(Electricity) 0.866**(0.223)
-0.151 (0.442)
Constant 8.25**(1.10)
15.16** (1.68)
Number of Firms 82 82 R2 0.618 0.500 R2 within 0.272 Parameters 3 3 Observations 138 138
*Significant at 10% level. **Significant at 1% level.
Azam Amjad Chaudhry 28
VI Conclusions
The analyses in this paper were an initial attempt in understanding the long term relationship between income per capita in Pakistan and the expected growth in electricity consumption per capita. In addition to this, the paper looks at the impact of electricity prices and electricity inputs on manufacturing demand for electricity and manufacturing output. The important conclusions that arise from the paper are:
First, as income per capita in Pakistan, increases, consumption of electricity per capita will increase (at a rate of 0.65% increase in per capita consumption of electricity for every 1% increase in per capita income) at a relatively uniform rate, both because of significant increases in household consumption (which has already begun) and eventually higher industrial consumption, as the industrial base of Pakistan expands.
Second, as the pressure to increase electricity prices mounts, there will be strong household level consequences (in terms of impacts on standards of living and on poverty) and, as this paper shows, significant impact on industrial demand for electricity and industrial output. The price elasticity of demand for electricity is approximately -0.6 in the manufacturing sector, though it is higher in the textile sector (-0.8) and in the food sector (-0.7). This means that higher electricity prices will significantly reduce the demand for electricity in the manufacturing sector.
Third, the production function estimates show that output in the manufacturing sector is highly dependent on electricity inputs. Severe electricity shortages in small and medium scale industries, which do not have their own electricity generation capacity, will significantly reduce output. In the medium and high scale industries with their own electricity generation capacity, the switch to own power generation can have a significant impact on their cost of production.
So, continued electricity shortages will have a significant impact on manufacturing output. Also, any policies that lead to significance short term increases in industrial electricity prices will also have to take into account the impact on manufacturing sector output.

A Panel Data Analysis of Electricity Demand in Pakistan 29
References
Aguirregabiria, V. (2009). Econometric Issues and Methods in the Estimation of Production Functions, Working Paper Number 15973, Munich Personal RePEc Archive.
Bental, B., and Ravid, S.A. (1982). A Simple Method for Evaluating the Marginal Cost of Unsupplied Electricity. The Bell Journal of Economics, 13(1 ) : pp. 249-253.
Bhattacharyya, S.C., and Timilsina, G.R. (2009).Energy Demand Models for Policy Formulation: A Comparative Study of Energy Demand Models. Policy Research Working Paper No. 4866, The World Bank, Development Research Group.
Bjørner, T.B., and Jensen, H.H. (2000). Industrial Energy Demand and the Effect of Taxes, Agreements and Subsidies. AKF Forlaget, Copenhagen.
Bjørner, T.B., Togeby, M., and Jensen, H.H. (2001). Industrial Companies’ Demand for Electricity: Evidence from a Micropanel. Energy Economics, 23 : pp. 595-617.
Dimitropoulos, J., Hunt, L.C., and Judge, G. (2004).Estimating Underlying Energy Demand Trends using UK Annual Data. Surrey Energy Economics Discussion Paper 108, University of Surrey.
Fraser, J.M. (2005). Lessons from the Independent Private Power Experience in Pakistan. Energy and Mining Section Board Discussion Paper, 14. The World Bank Group: Washington, DC.
Government of India (2009). Economic Survey 2008-2009.Ministry of Finance, Government of India.
Government of Pakistan (Various Versions, 1992-2006). Economic Survey of Pakistan, Federal Bureau of Statistics.
Government of Pakistan (Various Versions, 2003-2006). Census of Electricity Establishments. Federal Bureau of Statistics, Energy & Mining Statistics Section: Islamabad.
Griffin, J.M. (1993). Methodological Advances in Energy Modelling: 1970-1990. Energy Journal, 14(1) : pp. 111-14.

Azam Amjad Chaudhry 30
Hathaway, R.M., Muchhala, B., and Kugelman, M. (eds) (2007). Fueling the Future: Meeting Pakistan’s Energy Needs In The 21st Century. Woodrow Wilson International Center for Scholars: Washington, DC.
Heston, A., Summers. R., and Aten, B. (2009). Penn World Table Version 6.3, Center for International Comparisons of Production, Income and Prices at the University of Pennsylvania.
International Energy Agency (2009). Energy Prices & Taxes. Quarterly Statistics, 3, International Energy Agency Publications (IEA) : Paris.
Ishiguro, M., and Akiyama, T. (1995). Electricity Demand in Asia and the Effects on Energy Supply and the Investment Environment. Policy Research Working Paper No. 1557, The World Bank, International Economics Department, Commodity Policy and Analysis Unit.
Jones, C.T. (1996). A Pooled Dynamic Analysis of Interfuel Substitution in Industrial Energy Demand by the G-7 Countries. Journal of Applied Economics, 28 : pp. 815-821.
Jyoti, R., Ozbafli, A., and Jenkins, G. (2006). The Opportunity Cost of Electricity Outages and Privatization of Substations in Nepal. Queen’s Economics Department Working Paper No. 1066, Queen’s University, Canada.
Khan, A., Usman, M., and Usman, A. (2009). Energy Demand in Pakistan: A Disaggregate Analysis. Munich Personal RePEc Archive (MPRA) Paper No. 15056.
Kleijweg, A., Huigen, R., Leeuwen, G.van., and Zeelenberg, K. (1990). Firm Size and the Demand for Energy in Dutch Manufacturing, 1978-1986. Small Business Economics, 2 : pp. 171-181.
Kumbhakar, S.C., and Heshmati, A. (1995). Efficiency Measurement in Swedish Dairy Farms: An Application of Rotating Panel Data, 1976-88. American Journal of Agricultural Economics, 77 : pp. 660-674.
LaCommare, K.H., and Eto, J.H. (2004).Understanding the Cost of Power Interruptions to U.S. Electricity Consumers. University of California, Ernest Orlando Lawrence Berkeley National Laboratory: Berkeley, California 94720.
A Panel Data Analysis of Electricity Demand in Pakistan 31
Lall, S.V., and Mengistae, T. (The Impact of Business Environment and Economic Geography on Plant Level Productivity: An Analysis of Indian Industry. Policy Research Working Paper No. 3664, The World Bank, Development Research Group.
Layton, D.F., and Moeltner, K. (2004). The Cost of Power Outages to Heterogeneous Households – An Application of the Mixed Gamma-Lognormal Distribution. Forthcoming in Alberini, A., and Scarpa, R. (eds) Applications of Simulation Methods in Environmental and Resource Economics. Kluwer Academic Press.
Moeltner, K., and Layton, D.F. (2002). A Censored Random Coefficients Model for Pooled Survey Data with Application to the Estimation of Power Outage Costs. The Review of Economics and Statistics, 84(3): pp. 552-561.
Mundlak, Y. (1961). Empirical Production Function Free of Management Bias. Journal of Farm Economics, 43, 44-56.
Mundlak, Y., and I. Hoch (1965). Consequences of Alternative Specifications in Estimation of Cobb-Douglas Production Functions. Econometrica, 33, 814-828.
Pervez, A. (Compilation) (2009). Pakistan Power Sector. Consulate General of Switzerland Pakistan: Karachi.
Urga, G., and Walters, C. (2003). Dynamic Translog and Linear Logit Models: A Factor Demand Analysis of Interfuel Substitution in US Industrial Energy Demand. Energy Economics, 25 : pp. 1-21.
Woodland, A. (1993). A Micro-Econometric Analysis of the Industrial Demand for Energy in NSW. The Energy Journal, 14(2) : pp. 57-89
World Bank (2002). Pakistan Enterprise Survey, World Bank Enterprise Analysis Unit, World Bank Group, Washington D.C.
World Bank (2007). Pakistan Enterprise Survey, World Bank Enterprise Analysis Unit, World Bank Group, Washington D.C.
Azam Amjad Chaudhry 32
Appendix-I: Breakdown of Electricity Generation by Region (Source: International Energy Agency (2009). Energy Prices & Taxes. Quarterly Statistics
North America - Breakddown of Electricity Generation
0
0.1
0.2
0.3
0.4
0.5
0.6
0.7
0.8
1975 1980 1985 1990 1995 2000 2005 2010
Thermal(%)
Hydel(%)
Nuclear(%)
Central and South America - Breakddown of Electricity Generation
0
0.10.2
0.30.4
0.50.6
0.70.8
0.9
1975 1980 1985 1990 1995 2000 2005 2010
Thermal(%)
Hydel(%)
Nuclear(%)

A Panel Data Analysis of Electricity Demand in Pakistan 33
Europe - Breakddown of Electricity Generation
0
0.1
0.2
0.3
0.4
0.5
0.6
0.7
0.8
1975 1980 1985 1990 1995 2000 2005 2010
Thermal(%)
Hydel(%)
Nuclear(%)
Eurasia - Breakddown of Electricity Generation
0
0.1
0.2
0.3
0.4
0.5
0.6
0.7
0.8
0.9
1975 1980 1985 1990 1995 2000 2005 2010
Thermal(%)
Hydel(%)
Nuclear(%)

Azam Amjad Chaudhry 34
Middle East - Breakddown of Electricity Generation
0
0.2
0.4
0.6
0.8
1
1.2
1975 1980 1985 1990 1995 2000 2005 2010
Thermal(%)
Hydel(%)
Nuclear(%)
Africa - Breakddown of Electricity Generation
0
0.1
0.2
0.3
0.4
0.5
0.6
0.7
0.8
0.9
1975 1980 1985 1990 1995 2000 2005 2010
Thermal(%)
Hydel(%)
Nuclear(%)