A ood geodatabase and its climatological applications… · ood geodatabase and its climatological...
12
A flood geodatabase and its climatological applications: the case of Catalonia for the last century M. Barnolas, M. C. Llasat To cite this version: M. Barnolas, M. C. Llasat. A flood geodatabase and its climatological applications: the case of Catalonia for the last century. Natural Hazards and Earth System Science, Copernicus Publications on behalf of the European Geosciences Union, 2007, 7 (2), pp.271-281. <hal- 00299425> HAL Id: hal-00299425 https://hal.archives-ouvertes.fr/hal-00299425 Submitted on 5 Apr 2007 HAL is a multi-disciplinary open access archive for the deposit and dissemination of sci- entific research documents, whether they are pub- lished or not. The documents may come from teaching and research institutions in France or abroad, or from public or private research centers. L’archive ouverte pluridisciplinaire HAL, est destin´ ee au d´ epˆ ot et ` a la diffusion de documents scientifiques de niveau recherche, publi´ es ou non, ´ emanant des ´ etablissements d’enseignement et de recherche fran¸cais ou ´ etrangers, des laboratoires publics ou priv´ es.
Transcript of A ood geodatabase and its climatological applications… · ood geodatabase and its climatological...

A flood geodatabase and its climatological applications:
the case of Catalonia for the last century
M. Barnolas, M. C. Llasat
To cite this version:
M. Barnolas, M. C. Llasat. A flood geodatabase and its climatological applications: the caseof Catalonia for the last century. Natural Hazards and Earth System Science, CopernicusPublications on behalf of the European Geosciences Union, 2007, 7 (2), pp.271-281. <hal-00299425>
HAL Id: hal-00299425
https://hal.archives-ouvertes.fr/hal-00299425
Submitted on 5 Apr 2007
HAL is a multi-disciplinary open accessarchive for the deposit and dissemination of sci-entific research documents, whether they are pub-lished or not. The documents may come fromteaching and research institutions in France orabroad, or from public or private research centers.
L’archive ouverte pluridisciplinaire HAL, estdestinee au depot et a la diffusion de documentsscientifiques de niveau recherche, publies ou non,emanant des etablissements d’enseignement et derecherche francais ou etrangers, des laboratoirespublics ou prives.

Nat. Hazards Earth Syst. Sci., 7, 271–281, 2007www.nat-hazards-earth-syst-sci.net/7/271/2007/© Author(s) 2007. This work is licensedunder a Creative Commons License.
Natural Hazardsand Earth
System Sciences
A flood geodatabase and its climatological applications: the case ofCatalonia for the last century
M. Barnolas and M. C. Llasat
Meteorological Hazards Analysis Team (GAMA), Department of Astronomy & Meteorology, Faculty of Physics. Universityof Barcelona, Av. Diagonal 647, 08028 Barcelona, Spain
Received: 22 December 2006 – Revised: 29 March 2007 – Accepted: 29 March 2007 – Published: 5 April 2007
Abstract. Floods are the natural hazards that produce thehighest number of casualties and material damage in theWestern Mediterranean. An improvement in flood risk as-sessment and study of a possible increase in flooding oc-currence are therefore needed. To carry out these tasks itis important to have at our disposal extensive knowledgeon historical floods and to find an efficient way to managethis geographical data. In this paper we present a completeflood database spanning the 20th century for the whole ofCatalonia (NE Spain), which includes documentary informa-tion (affected areas and damage) and instrumental informa-tion (meteorological and hydrological records). This geo-database, named Inungama, has been implemented on a GIS(Geographical Information System) in order to display all theinformation within a given geographical scenario, as well asto carry out an analysis thereof using queries, overlays andcalculus. Following a description of the type and amount ofinformation stored in the database and the structure of theinformation system, the first applications of Inungama arepresented. The geographical distribution of floods shows thelocalities which are more likely to be flooded, confirming thatthe most affected municipalities are the most densely popu-lated ones in coastal areas. Regarding the existence of an in-crease in flooding occurrence, a temporal analysis has beencarried out, showing a steady increase over the last 30 years.
1 Introduction
Floods are the major cause of loss of human lives and prop-erty damage in Catalonia (Llasat, 2004). Between 1950 and1990, there were a total of 1400 deaths in Catalonia andmaterial damage amounting to overC301 000 000 per year(Dolz, 1993; Berga, 1995). One of the last catastrophic
Correspondence to: M. Barnolas([email protected])
events was the 10 June 2000 Montserrat event. That episodecaused material damage estimated overC65 000 000 and fivecasualties (Llasat et al., 2003). The geographical characteris-tics of Catalonia, its precipitation regime and the populationdistribution (concentrated in coastal and plain areas) con-tribute to make floods the most important natural hazard inthis region.
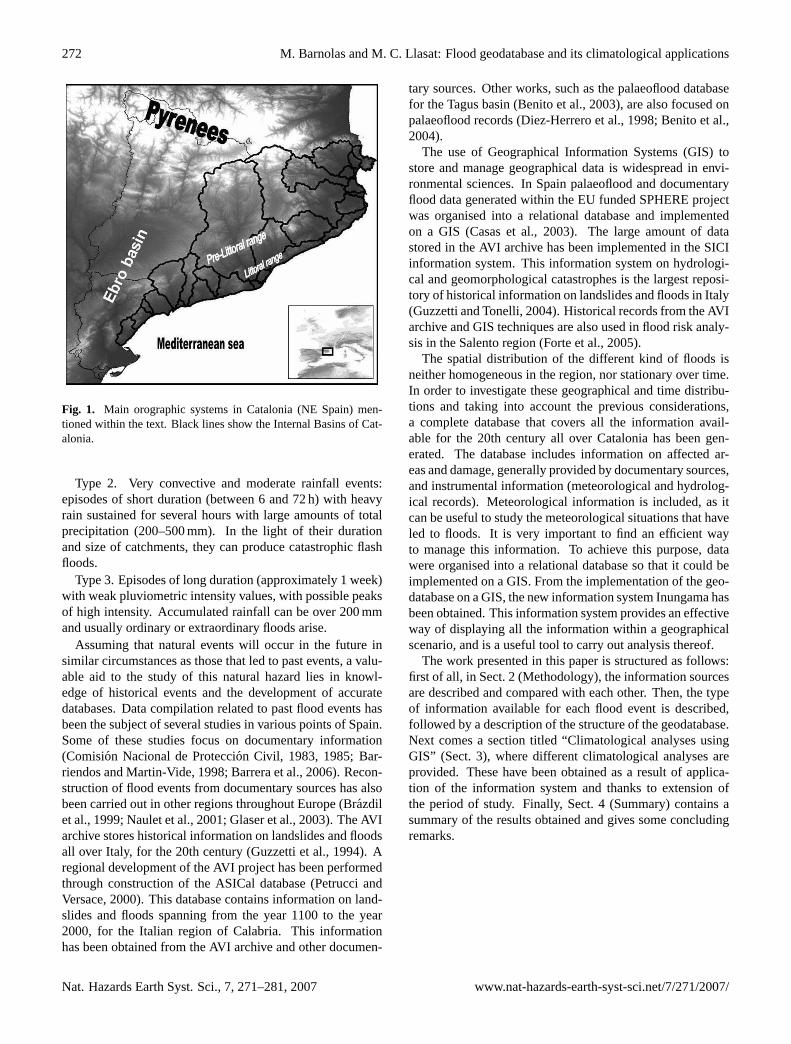
Catalonia has a surface area of 31 930 km2 and it is locatedin the Northeast part of the Iberian Peninsula. To the East itborders on the Mediterranean Sea, to the North, on the Pyre-nees, and to the West, on the Ebro river valley (Fig. 1). Themost relevant topographic features are the Pyrenees, whichrise to over 3000 m, the Littoral range and the Pre-littoral sys-tem, both located parallel to the coast, reaching higher than700 m and 1700 m respectively. The hydrographical networkcovers the tributary waters of the Ebro basin and the InternalBasins of Catalonia (IBC), which include rivers that rise inCatalonia and flow into the Mediterranean Sea. The proxim-ity to the Mediterranean Sea and its complex orography playsan important role in rainfall and flood production.
Its precipitation regime is characterised by a bi-modalyearly distribution, with one main maximum in autumn anda secondary peak in spring. However, high rainfall precipi-tation produced by convective events shows only one peakcentered between the end of summer and autumn (Llasat,2001). Consequently, floods in Catalonia could be associ-ated with different kinds of precipitation systems. In the lightof their duration, rainfall intensity, accumulated precipitationand damage, floods arising in Catalonia can be classified asfollows (Barrera et al., 2006):
Type 1. Very convective rainfall events: episodes of veryshort duration (less than 6 h) but very high rainfall intensity.The local amount of rainfall is nevertheless not usually veryhigh. They produce flash floods and local damage. Theirassociated floods are usually ordinary or extraordinary, fol-lowing the classification shown in Llasat et al. (2005).
Published by Copernicus GmbH on behalf of the European Geosciences Union.
272 M. Barnolas and M. C. Llasat: Flood geodatabase and its climatological applications
Fig. 1. Main orographic systems in Catalonia (NE Spain) men-tioned within the text. Black lines show the Internal Basins of Cat-alonia.
Type 2. Very convective and moderate rainfall events:episodes of short duration (between 6 and 72 h) with heavyrain sustained for several hours with large amounts of totalprecipitation (200–500 mm). In the light of their durationand size of catchments, they can produce catastrophic flashfloods.
Type 3. Episodes of long duration (approximately 1 week)with weak pluviometric intensity values, with possible peaksof high intensity. Accumulated rainfall can be over 200 mmand usually ordinary or extraordinary floods arise.
Assuming that natural events will occur in the future insimilar circumstances as those that led to past events, a valu-able aid to the study of this natural hazard lies in knowl-edge of historical events and the development of accuratedatabases. Data compilation related to past flood events hasbeen the subject of several studies in various points of Spain.Some of these studies focus on documentary information(Comision Nacional de Proteccion Civil, 1983, 1985; Bar-riendos and Martin-Vide, 1998; Barrera et al., 2006). Recon-struction of flood events from documentary sources has alsobeen carried out in other regions throughout Europe (Brazdilet al., 1999; Naulet et al., 2001; Glaser et al., 2003). The AVIarchive stores historical information on landslides and floodsall over Italy, for the 20th century (Guzzetti et al., 1994). Aregional development of the AVI project has been performedthrough construction of the ASICal database (Petrucci andVersace, 2000). This database contains information on land-slides and floods spanning from the year 1100 to the year2000, for the Italian region of Calabria. This informationhas been obtained from the AVI archive and other documen-
tary sources. Other works, such as the palaeoflood databasefor the Tagus basin (Benito et al., 2003), are also focused onpalaeoflood records (Diez-Herrero et al., 1998; Benito et al.,2004).
The use of Geographical Information Systems (GIS) tostore and manage geographical data is widespread in envi-ronmental sciences. In Spain palaeoflood and documentaryflood data generated within the EU funded SPHERE projectwas organised into a relational database and implementedon a GIS (Casas et al., 2003). The large amount of datastored in the AVI archive has been implemented in the SICIinformation system. This information system on hydrologi-cal and geomorphological catastrophes is the largest reposi-tory of historical information on landslides and floods in Italy(Guzzetti and Tonelli, 2004). Historical records from the AVIarchive and GIS techniques are also used in flood risk analy-sis in the Salento region (Forte et al., 2005).
The spatial distribution of the different kind of floods isneither homogeneous in the region, nor stationary over time.In order to investigate these geographical and time distribu-tions and taking into account the previous considerations,a complete database that covers all the information avail-able for the 20th century all over Catalonia has been gen-erated. The database includes information on affected ar-eas and damage, generally provided by documentary sources,and instrumental information (meteorological and hydrolog-ical records). Meteorological information is included, as itcan be useful to study the meteorological situations that haveled to floods. It is very important to find an efficient wayto manage this information. To achieve this purpose, datawere organised into a relational database so that it could beimplemented on a GIS. From the implementation of the geo-database on a GIS, the new information system Inungama hasbeen obtained. This information system provides an effectiveway of displaying all the information within a geographicalscenario, and is a useful tool to carry out analysis thereof.
The work presented in this paper is structured as follows:first of all, in Sect. 2 (Methodology), the information sourcesare described and compared with each other. Then, the typeof information available for each flood event is described,followed by a description of the structure of the geodatabase.Next comes a section titled “Climatological analyses usingGIS” (Sect. 3), where different climatological analyses areprovided. These have been obtained as a result of applica-tion of the information system and thanks to extension ofthe period of study. Finally, Sect. 4 (Summary) contains asummary of the results obtained and gives some concludingremarks.
Nat. Hazards Earth Syst. Sci., 7, 271–281, 2007 www.nat-hazards-earth-syst-sci.net/7/271/2007/

M. Barnolas and M. C. Llasat: Flood geodatabase and its climatological applications 273
65
108
217
33
0
50
100
150
200
250
SPHERE Previous compilations Newspapers Published and
unpublished scientific
papers and reports
Sources of information
Nu
mb
er o
f even
ts
Fig. 2. Distribution of the number of events recorded in the 20thcentury for each source of information.
2 Methodology
2.1 Type of information and sources consulted
A total of 217 flood events have been identified and recon-structed for the period 1901–2000, by means of a system-atic analysis of a wide variety of published and unpublishedsources. The main sources consulted to collect the informa-tion were: preceding data compilations relating to specificlocalities or regions, as well as scientific papers and reports,available technical notes, newspapers and instrumental in-formation. Results from previous projects such as SPHERE(European Union), among others, have been also taken intoaccount. All this information has been contrasted with thevarious sources in order to ensure its veracity.
The various sources consulted provided information ofvarying quality and amounts. Regarding the number ofevents, preceding data compilations and newspapers are thesources that make most information available (Fig. 2). Onthe other hand, scientific papers only supply information fora limited number of events. Regarding the kind of informa-tion, scientific papers provide a lot of information on the me-teorological characteristics of the event and high quality data.On the other hand they do not usually show information onthe damage produced by floods. This kind of informationis available in newspapers and reports from insurance com-panies. Another factor of note is that newspapers emphasiseevents that have occurred in urban areas, and their impact de-pends on other headline news of the day. The existence of alarge variety of sources of information for some of the eventsimplies having conflicting information in some cases. Oneof the reasons why contradictory information is found is thelack of metadata. For example, in some cases, accumulatedrainfall values for a specific day and station differ from onesource to another because they had been recorded over differ-ent time spells without this being specified. Significant workwas involved in checking and validating all the informationin order to have an accurate database.
Fig. 3. Type of information diagram.
To update the inventory, some of the documentary sourcesparticularly useful were as follows: scientific papers on spe-cific events (e.g. Llasat and Rodriguez, 1992; Ramis et al.,1994, 1995; Rigo and Llasat, 2000, 2005; Rigo et al., 2001;Llasat et al., 2003), historical catalogues of floods compiledfor specific geographical areas (e.g. Comision Nacional deProteccion Civil, 1983, 1985; Barriendos and Pomes, 1993),available technical notes (e.g. Novoa, 1981; Aran et al.,1999), doctoral theses (e.g. Llasat, 1987; Barriendos 1994;Rigo, 2004), and the results obtained in the SPHERE project.
The type of information collected can be organised intofour groups: general information, which comprises affectedarea, data related to damage (agriculture, housing, industrialand infrastructures) and casualties; meteorological informa-tion (accumulated rainfall and rain intensity), hydrologicalinformation (stream flow and water level high) and the refer-ences consulted (Fig. 3).
2.2 Structure of the database
This large amount of available data is very useful if it is prop-erly organised. In order to find an effective way to managethis information it was organised into a relational database inACCESS normalized until the third normal form (Barnolas,2004; Barnolas and Llasat, 2005). The database was struc-tured bearing in mind the kind of available data and the ap-plications required. Taking into account the possibility of ac-quiring additional information and finding new research re-sults, the structure was designed so that it could be updatedeasily.
This geodatabase contains a main table called “Events”which includes the initial and final date of the meteorolog-ical event and a key field (Fig. 4). In addition, there areseven complementary tables containing the main information
www.nat-hazards-earth-syst-sci.net/7/271/2007/ Nat. Hazards Earth Syst. Sci., 7, 271–281, 2007

274 M. Barnolas and M. C. Llasat: Flood geodatabase and its climatological applications
Fig. 4. Structure of the database.
for each flood event. These tables were organised into fourgroups: general information (AffectedMunicipalities, Af-fectedCounties and AffectedBasins), meteorological data(MPluvio and APluvio, where MPluvio contains meteoro-logical data recorded in manual stations, and “APluvio” inautomatic stations), hydrological data (Hydro), and biblio-graphical references consulted (BibliographicRef).
General information includes everything relating todamage and casualties for each event and geographi-cal unit. The geographical units taken into accountare municipalities, counties and basins. Each row ofthe AffectedMunicipalities, Affected Counties and Af-fectedBasins tables implies that one of these geographi-cal units has been flooded in an event. Damage to agri-culture, houses, industry and infrastructures are knownfor municipalities, so these fields are included in the Af-fectedMunicipalities table. Casualties are known for eachflood event and geographical unit, so this field is includedin the three tables. Each one of these tables is annexed toanother one by an index that links each geographical unit toits name. For example, in the table AffectedMunicipalities,the occurrence of a flood in a municipality is indicated bythe identification index of that municipality. In this way thename of the geographical unit appears only once in the tablethat defines each index. Numerical characters are useful inorder to avoid possible errors typical from text characters, asin the different use of capital letters or otherwise.
Meteorological data available for each day of the event,mainly accumulated rainfall in 24 h, and rainfall intensity,are included in two tables depending on the kind of rain-gauge (automatic or manual): MPluvio and APluvio. Avail-able rainfall data are at daily resolution until 1996 (recordedin manual stations of the Instituto Nacional de Meteorologıa,
INM, Spanish National Weather Service), while since 1996they are 5-minutal (recorded in automatic stations of theAutomatic System of Hydrological Information-SAIH). Thefields included in these tables are the Events key field (in or-der to relate the table with the Events table), the accumulatedrainfall value (P24 h), the date on which it was recorded,and the identification index of the station where this valuewas recorded (saihCICID and INDINM). Each one of thesetables is annexed to another table that identifies each sta-tion (Automaticstations and Manualstations). Some of thefields included to identify each station are: its name, the mu-nicipality or basin where it is located, its geographic coor-dinates, and some observations that can be useful if there ismore than one station in the same municipality.
Hydrological data is included in the Hydro table. It con-tains information about the stream flow and water level val-ues for each event and measurement station. The fields in-cluded in this table are: mean discharge of the day, maximumdischarge value, the hour this value was recorded, water leveland the hour this value was measured, and the identificationindex of the measurement station where these values wererecorded. As the other tables explained above, this table isannexed to another one that identifies each measurement sta-tion (Streamflowstations). The fields included to identifyeach station are: the location of the station, its geographi-cal coordinates, and the river where it is located. As somestations are located on the same river, an identification in-dex (RiverID) is used once again in order to avoid problemswith text characters. This index serves to link the Hydro ta-ble with the RiversCatalonia table, which shows the nameof the river related to its index.
Finally, the information concerning the bibliograph-ical references consulted is found in three tables
Nat. Hazards Earth Syst. Sci., 7, 271–281, 2007 www.nat-hazards-earth-syst-sci.net/7/271/2007/

M. Barnolas and M. C. Llasat: Flood geodatabase and its climatological applications 275
(BibliographicRef, TypeDoc, and Source). Biblio-graphicRef contains the main information of the referencesconsulted: the author, other authors, the title of the docu-ment, the year it was published, the volume and pages, theplace of publication, the name of the editors, etc. Some ofthese fields are used in a different way depending on thetype of document specified. TypeDoc is used to distinguishthe type of document (book, book chapter, article, reportor newspaper). Source is a support table used to avoidmany-to-many relationships.
This relational geodatabase has been integrated into a GISwhere spatial data is represented by a raster cover of a digi-tal elevation model and vectorial covers for municipalities,counties, catchments, meteorological stations, and streamflow measure stations. These covers are linked with their re-lated tables by a unique code. For example the table Apluviois related with the cover of Automatic stations by the codesaihCICID.
3 Climatological analyses using GIS
The historical information stored in this geodatabase is usedfor a large variety of applications. The tool developed, In-ungama, allows the carrying out of spatial and temporal anal-ysis of quantitative parameters of flood events by using sim-ple queries, overlays and calculus. In this paper some ex-amples for each case are shown. For the spatial analysis, ageographical distribution of floods in Catalonia has been un-dertaken. Regarding the temporal analysis, the seasonal dis-tribution of floods is shown, and the existence of a possibleincrease in the number of floods in recent years, is studied.Furthermore, it is possible to obtain and visualise all the in-formation related with an event, such as the area affected byfloods or the availability of data. Since it is possible to inter-polate accumulated rainfall data and to overlay other meteo-rological fields (radar data and MM5 meteorological modeloutputs), this GIS has been used as a complementary tool inthe study of meteorological episodes.
3.1 Monthly distribution of floods
The catalogue of 217 events reports the exact date or period,in the case of events that lasted more than one day, for allthe events listed. This information has made it possible toplot a monthly distribution histogram of floods in the 20thcentury. This distribution (Fig. 5) shows that most of theevents take place in autumn. Although floods are a complexhydrometeorological hazard they are usually a direct effectof precipitation. The maximum in the occurrence of floods inautumn coincides with the months with largest precipitationamounts (Llasat and Puigcerver, 1997; Lana and Burgueno,2000) in the region. The largest number of floods occurs inOctober (52); followed by September (44) and August (33).
Fig. 5. Monthly distribution of floods.
It is important to note that there is no month without floodingoccurrence.
Fall season floods are mainly identified with convectiveepisodes of heavy rain sustained for several hours (type 2).These kind of convective events are frequent in fall becausethe Mediterranean Sea, after the high solar radiation receivedduring the summer season, is warm enough to ensure con-siderable moisture and instability at low atmospheric levels.Other main factors necessary to produce these convective sit-uations are convective instability, and a lifting mechanism (asorography or convergence lines) which permits the low-levelparcels to attain the free convection level. Convective insta-bility is triggered when the meteorological synoptic situationis favourable to produce an inflow of warm and moist airmass over Catalonia at low levels that can sometimes com-bine with an entry of cold upper-level Atlantic disturbances.Continuous supply of moisture at low levels towards the con-vective areas is required to sustain the convection and to pro-duce large rainfall amounts. Some examples of these eventsare the floods of 20–23 September 1971 (Llasat et al., 2007)or the event of 6–8 November 1982 (Llasat, 1991), in whichmore than 400 mm and 500 mm, respectively, accumulated atsome stations.
More local convective situations lasting less than 6 h(episodes of type 1) mainly arise during summer and at thebeginning of autumn. This kind of events requires consid-erable local atmospheric instability, and is usually producedby “isolated cells” or “multicells” of limited horizontal ex-tension (Rigo and Llasat, 2004). The flash flood of 28 Au-gust 1998 is an example of this type of episode (Llasat et al.,2005).
Events producing floods in winter are usually episodes oflong duration associated with frontal disturbances (type 3).They are slightly convective events usually associated withconvection embedded in stratiform rainfall. Although theseevents are not very frequent, there have been some cases inthe 20th century, one of them being the event of 21–30 Jan-uary 1996, where more than 200 mm were recorded (Llasatet al., 2000).
www.nat-hazards-earth-syst-sci.net/7/271/2007/ Nat. Hazards Earth Syst. Sci., 7, 271–281, 2007

276 M. Barnolas and M. C. Llasat: Flood geodatabase and its climatological applications
0
10
20
30
40
50
60
J F M A M J J A S O N D
0
1
2
3
4
5
6
7
8
9
J F M A M J J A S O N D
0
1
2
3
4
5
6
7
8
J F M A M J J A S O N D
Nu
mb
er o
f fl
oo
ds
Months
a
b
c
Fig. 6. Monthly distribution of floods in the Pyrenees(a), the littoral(b), and the inland region of Catalonia(c).
Use of the geographical information system makes it pos-sible to combine information on the monthly occurrence ofthe events with their geographical location, so that the re-gional variation of the monthly distribution of floods in Cat-alonia can be investigated. In this way monthly number offloods in the Pyrenees region, the littoral region and the in-land region of Catalonia are studied separately, as can be seenin Fig. 6.
The Pyrenees represent 46% of the extension of Catalo-nia, but only 5% of the population lives there (Fig. 6a). Ofthe total amount of 217 events that arose in Catalonia in theperiod of study, a county of the Pyrenees was affected onlyin 28 occasions. Despite the number of events not being veryhigh, it is important to remark that floods are distributed overall the months of the year, except February. These countiesare then affected by episodes of all three types, with fall sea-son having the most important episodes. In spring, meltingof snow around the river springs in the mountains can helpto overflow banks of rivers when it is accompanied by heavyrainfall. This fact can be noticed in the monthly distributionof floods in the Pyrenees and the interior region (where therivers have tributaries from the Pyrenees region), both hav-ing a relative maximum in April. The November 1982 floodmainly affected this region.
In 94% of the events arising in Catalonia in the last cen-tury at least one county of the littoral region was affected(Fig. 6b). On the other hand, only in 10% of the cases wasa county of the interior region affected (Fig. 6c). The lit-toral region presents no month without flooding occurrence,being vulnerable to episodes of all the three types, althoughevents of type 1 are the most frequent. This area has plentyof small basins with a quick response to precipitation; there-fore it can be affected by flash floods when rainfall inten-sity is high, in spite of not having very high total amountrecords. These kind of events arise in summer and at the be-ginning of autumn, where the maximum of the distributionis found, as can be observed in Fig. 6b. The fact that thesebasins are also densely populated makes them more vulnera-ble to floods. Two examples of floods that affected this regionwere the event recorded between 2–5 October 1987 (Ramiset al., 1994), that was of type 2, and another recorded on 21September 1995 (Barrera et al., 2006), that was of type 1.The September 1971 flood also affected this region. On theother hand, inland counties of Catalonia are located in biggerbasins in which higher amounts of precipitation are needed toproduce overflowing. Besides this, they are located in a plainregion, where orographic factors do not have a direct influ-ence. In this case there are several months without floodingoccurrence in winter, spring and summer. These countiesare mostly affected by episodes of type 3 and sometimes, byones of type 2. As examples, the events of January 1996 andNovember 1982 affected this region.
3.2 Geographical distribution of floods in Catalonia
Inungama has permitted mapping of how many times eachmunicipality, county, or basin has been affected by floodsin the 20th century. The catalogue of 217 events containsepisodes that have lasted a few hours and others that havecontinued for more than two days. Some of these events mayhave produced floods in different localities of the study re-gion. In this paper the municipality distribution of floods isoutlined (Fig. 7). Of the total number of 946 municipalitieswithin Catalonia, more than 200 have been affected at leastonce by flood. Most of these municipalities have been inun-dated only once, but in the littoral region 22 municipalitieshave been flooded more than 10 times. In this respect Mataro,in the Maresme basin (Fig. 8a), might be highlighted, since61 events have occurred there in the last 100 years. TheMaresme is the most affected basin (131 events in the lastcentury), with 11 municipalities affected more than 10 times.This basin is usually affected by local flash floods as a resultof type 1 episodes. This kind of events (intense precipitationover small catchments) give rise to road traffic cuts, loss ofcars parked in the water courses and in some cases fatalities,as a consequence of the floods’ suddenness. The inland re-gion, which is within big catchments (Ebro basin), affectedalmost exclusively by events that usually cover a large ter-ritorial extension, as occurred on 6–8 November 1982, with
Nat. Hazards Earth Syst. Sci., 7, 271–281, 2007 www.nat-hazards-earth-syst-sci.net/7/271/2007/

M. Barnolas and M. C. Llasat: Flood geodatabase and its climatological applications 277
Fig. 7. Number of events by municipality.
Fig. 8. (a)Municipalities with at least one casualty due to floods inthe 20th century.(b) Population density map.
floods not only in the Ebro basin but also in the Pyrenees.Exceptionally, flood events of type 3 enhanced by snowmeltaffect the inland region.
Figure 8a shows municipalities where there has been atleast one casualty due to floods on the 20th century. It can benoticed that most of municipalities selected form part of re-gions with highest population density (Fig. 8b), or are locatedin basins with short response times (the Maresme). Usually,these localities are also affected by convective episodes, asit has been shown before, being more vulnerable to flashfloods. The greatest concentration of localities affected byfloods is located over the Llobregat basin, partly due to the25 September 1962 event (Llasat et al., 2003). That eventwas the most catastrophic recorded in the period of study,with more than 815 deaths. It was an episode of type 2, thatproduced a flash flood in the Llobregat and the Besos rivers(Fig. 8a), with a total rainfall of 212 mm recorded in less than3 h, and a maximum intensity of 6 mm/ min.
3.3 Temporal evolution of flood events
Within the framework of climate change, one of the cur-rent worries is the existence of an increase in the number of
0
1
2
3
4
5
6
7
8
19
01
19
04
19
07
19
10
19
13
19
16
19
19
19
22
19
25
19
28
19
31
19
34
19
37
19
40
19
43
19
46
19
49
19
52
19
55
19
58
19
61
19
64
19
67
19
70
19
73
19
76
19
79
19
82
19
85
19
88
19
91
19
94
19
97
20
00
Years
Nu
mb
er
of
flo
od
s
-0.1
-0.08
-0.06
-0.04
-0.02
0
0.02
0.04
0.06
0.08
1901
1905
1909
1913
1917
1921
1925
1929
1933
1937
1941
1945
1949
1953
1957
1961
1965
1969
1973
1977
1981
1985
1989
1993
1997
Year
Num
ber o
f fl
oods/Y
ear
a
b
Fig. 9. (a) Temporal distribution of floods in Catalonia (1901–2000). (b) Accumulated slopes for flood frequency in Catalonia(1901–2000). Data points 2 to 5 lie below up to−0.7 before theslope computation converges to a stable range.
floods. Figure 9a shows the temporal evolution of floods inthe 20th century. An increase in the number of floods can beobserved in recent years. Also notable is the existence of pe-riods with a large number of floods every year (for examplefrom 1986 to 1994) and other periods without a significantflooding occurrence (1944–1951). In order to find evidenceof increased flood occurrence in Catalonia, a temporal analy-sis has been carried out. The initial analysis has been a yearlynormalisation of the flood events series, smoothed afterwardsby Gaussian low-pass filters (10 and 30 years). The method-ology followed to test trends in flood frequency was accumu-lated slopes. It is based on calculating the slope of a straightline, firstly fitted to the first two pairs of values of the dataseries (time and frequency), secondly to the first three pairsof values, and so on until the end of the data series. Everystep of this method is plotted (Fig. 9b). To test the statisti-cal significance of possible linear trend in the flood frequencyevolution a Monte Carlo technique has been applied (Livezeyand Chen, 1983; Kunkel et al., 1999; Liebmann et al., 2004).This technique consists in the following steps:
www.nat-hazards-earth-syst-sci.net/7/271/2007/ Nat. Hazards Earth Syst. Sci., 7, 271–281, 2007

278 M. Barnolas and M. C. Llasat: Flood geodatabase and its climatological applications
0
0.5
1
1.5
2
2.5
1901
1906
1911
1916
1921
1926
1931
1936
1941
1946
1951
1956
1961
1966
1971
1976
1981
1986
1991
1996
0
1
2
3
4
5
6
7
8
1901
1906
1911
1916
1921
1926
1931
1936
1941
1946
1951
1956
1961
1966
1971
1976
1981
1986
1991
1996
0
0.5
1
1.5
2
2.5
1901
1906
1911
1916
1921
1926
1931
1936
1941
1946
1951
1956
1961
1966
1971
1976
1981
1986
1991
1996
Years
Nu
mb
er
of
Flo
od
s
a
b
c
Fig. 10.Temporal evolution of floods in the Pyrenees(a), the littoral(b), and the interior regions of Catalonia(c) (1901–2000).
i) Calculation of the linear trend of the original series bythe linear fitting of data (minimum squares or linear re-gression).
ii) Generation of 10 000 random permutations of the origi-nal series.
iii) Calculation of the linear trends for each 10 000 gener-ated series.
iv) Calculation of the 97.5 and 2.5 percentiles for the10 000 calculated linear trends.
v) If the first linear trend calculated was higher than 97.5percentile for positive trend or lower than 2.5 percentilefor negative trend, then the obtained trend would be sig-nificant at 95%.
Figure 9b shows a smooth increase in the number of floodsover the last 30 years. This curve has a positive slope of2 floods per century at the end of the series. The observed
-0.1
-0.05
0
0.05
0.1
0.15
1901
1906
1911
1916
1921
1926
1931
1936
1941
1946
1951
1956
1961
1966
1971
1976
1981
1986
1991
1996
-0.1
-0.08
-0.06
-0.04
-0.02
0
0.02
0.04
0.06
1901
1906
1911
1916
1921
1926
1931
1936
1941
1946
1951
1956
1961
1966
1971
1976
1981
1986
1991
1996
Years
Nu
mb
er
of
Flo
od
s/Y
ear
a
b
c
-0.1
-0.05
0
0.05
0.1
0.15
1901
1906
1911
1916
1921
1926
1931
1936
1941
1946
1951
1956
1961
1966
1971
1976
1981
1986
1991
1996
Fig. 11. Accumulated slopes for flood frequency in the Pyrenees(a), the littoral(b), and the interior regions of Catalonia(c) (1901–2000).
Table 1. Trend analysis results of applying the Monte Carlo tech-nique for the flood frequency in Catalonia.
Linear regression 0.018 flood/yearpercentile 97.5% 0.012 flood/yearpercentile 2.5% –0.012 flood/year
trend is statistically significant at 95% confidence level fol-lowing the Monte Carlo procedure (Table 1). Anyway, pre-vious studies had demonstrated that there is no evidence ofan increase of precipitation in the Northeast region of Spain(Barrera and Llasat, 2004) in recent years. So, in this wayit is remarkable that the positive slope detected for the floodoccurrence is not due to an increase of precipitation. Thisgrowth in the number of floods must be due to other factors.
Nat. Hazards Earth Syst. Sci., 7, 271–281, 2007 www.nat-hazards-earth-syst-sci.net/7/271/2007/

M. Barnolas and M. C. Llasat: Flood geodatabase and its climatological applications 279
Here, factors such as increased urbanisation in recent years,changes in geomorphological or hydrological river condi-tions or major information coverage could be responsible.
The temporal evolution of floods has been analysed for thePyrenees region, the littoral region and the inland region ofCatalonia (Fig. 10) (see Fig. 6 for locations). Once again,it can be noticed that the littoral counties are the most af-fected by floods. It has been applied the same methodologyexplained to test trends. Figure 11 shows the evolution of theaccumulated slopes for the floods in the three regions con-sidered. Figure 11b illustrates a clear increase in the num-ber of floods in the littoral in recent years. This curve hasa positive slope of nearly 2 floods per century at the end ofthe series. The observed trend is statistically significant at95% confidence level following the Monte Carlo procedure(Table 2). However the evolution for the other two regionsdoes not show any appreciable increase. As mentioned inparagraphs above, there is a clear difference in behaviour be-tween the littoral basins, smaller and close to the sea, and theinterior or mountainous ones.
4 Summary
A complete flood database has been developed for the en-tire Catalan territory for the 20th century. This geodatabasehas been created, as there had not been a previous system-atic reconstruction of flood events that covered the entire re-gion of Catalonia before. A total of 217 flood events havebeen identified, and examined, by analysis of a wide vari-ety of sources. Significant efforts have also been made tocheck and validate all the information. 147 flood events inthe IBC have been identified and reconstructed for the period1900–1983; this represents three times the number of eventsidentified for the same period in previous works focusing onthe IBC (Comision Nacional de Proteccion Civil, 1983). Be-sides its wide geographic coverage, this geodatabase also of-fers the advantage of containing updated information up to2000. As one of the main objectives in this work is to findevidence of a possible increase in the number of floods in theregion of study, it is very important to have the informationupdated at least until year 2000. Previous historical flood re-constructions in Catalonia, such as the compilation done bythe National Civil Protection organisation for floods in theEbro River valley (Comision Nacional de Proteccion Civil,1985), or the reconstruction for the IBC contain informationfinishing before 1990.
In order to store, manage and analyse all the informationavailable, a relational structure has been chosen. This geo-database has been implemented on a GIS, giving rise to theinformation system called Inungama. The fact that this geo-database has been implemented on a GIS is also an advantagein relation to preceding studies, as it is a more efficient wayto store information and to analyse it. In this way it can be ahelpful tool aimed to improving flood risk assessment in ad-
Table 2. Trend analysis results of applying the Monte Carlo tech-nique for the flood frequency in littoral counties of Catalonia.
Linear regression 0.017 flood/yearpercentile 97.5% 0.011 flood/yearpercentile 2.5% –0.011 flood/year
dition to vulnerability information and others. Inungama hasa great number of climatic and meteorological applications.In this paper some of these climatic applications, concerningspatial and temporal analysis, are shown. Regarding spatialdistribution, results show that the most affected areas are lo-cated in the Northeast of Catalonia and in regions with a highpopulation density. Mataro, in the Maresme basin, where 61floods have occurred in the last 100 years, is the most affectedmunicipality. These localities on the littoral have a higherconcentration of population and in some cases are affectedby local convective situations (episodes of type 1) producingflash floods. Concerning the temporal analysis, monthly dis-tribution histograms have been plotted. It has been observedthat autumn is the season that concentrates the highest flood-event occurrence in all the Catalonian regions. Fall seasonfloods are mainly identified with convective episodes withheavy rain sustained for several hours. The inland region ismainly affected by episodes of types 2 and 3. The littoraland the Pyrenees regions are affected by all three types ofepisodes that produce floods. Littoral counties are the mostaffected by floods.
As one of the major concerns nowadays is the existenceof an increase in the number of floods, a trend test has beencarried out. This test has shown a smooth increase in thefrequency of floods, with a positive slope of 2 floods percentury at the end of the series. Due to the fact that inprevious studies it had been demonstrated that there was noevidence of rain increase in recent years in the region ofstudy (Barrera et al., 2006), this rise in the number of floodsmust be due to other factors. One of these factors is greaterinformation coverage. In recent years we have more sourcesof information, including newspapers, showing some ordi-nary floods that in the past could have gone unnoticed. Asecond factor is the increase in urbanisation and populationdensity, which makes people more vulnerable to floods. Thisfact causes damage and sometimes fatalities in places wherea similar flood before would not have caused damage. Otherfactors involved in flooding increase are changes on geomor-phological or hydrological river conditions. The possitivetrend observed in the Littoral region is mainly associatedwith the increase of vulnerability as well as changes in theuse of soil as a consequence of the urbanisation and newroads and highways. This increase is not observed in thePyrenees and Inland regions where no similar changes havetaken place. These results are coherent with those obtained
www.nat-hazards-earth-syst-sci.net/7/271/2007/ Nat. Hazards Earth Syst. Sci., 7, 271–281, 2007

280 M. Barnolas and M. C. Llasat: Flood geodatabase and its climatological applications
in the framework of the SPHERE project, when a periodof more than 400 years was analysed for some specificcatchments (Barriendos et al., 2003; Llasat et al., 2005).
Edited by: U. UlbrichReviewed by: two referees
References
Aran, M., Arus, J., Garcıa, C., Lopez, J. M., Satue, S., Vazquez,L., and Werner, E.: Las inundaciones del dıa 10 de octubre de1994, IV Simposio Nacional de Prediccion, Publicacion internadel INM, 1999.
Barnolas, M.: Desarrollo de un sistema ACCESS/SIG en elambitode las ciencias de la atmosfera: Estudio de las inundaciones enCatalunya, 1901–2000, Bachelor of Meteorology Ph.D. Astron-omy & Meteorology programme (biennium 2002–2004) of theUniversity of Barcelona, Internal publication, 2004.
Barnolas, M. and Llasat, M. C.: Aplicacion de una herramienta SIGen el estudio de las inundaciones en Catalunya, 1901–2000, Re-vista del aficionado a la Meteorologıa, 28, 2005.
Barrera, A. and Llasat M. C.: Evolucion regional de la precipitacionen Espana en losultimos 100 anos, Ingenierıa Civil, 135, 105–113, 2004.
Barrera, A., Llasat, M. C., and Barriendos, M.: Estimation of ex-treme flash flood evolution in Barcelona County from 1351 to2005, Nat. Hazards Earth Syst. Sci., 6, 505–518, 2006,http://www.nat-hazards-earth-syst-sci.net/6/505/2006/.
Barriendos, M.: El clima historico de Catalunya. Aproximacion asus caracterısticas generales (ss. XV-XIX), Department of Phys-ical Geography, University of Barcelona, Spain, Doctoral thesis,500, 1994.
Barriendos, M., Coeur, D., Lang, M., Llasat, M. C., Naulet, R.,Lemaitre, F., and Barrera A.: Stationarity analysis of historicalflood series in France and Spain (14th–20th centuries), Nat. Haz-ards Earth Syst. Sci., 3, 583–592, 2003,http://www.nat-hazards-earth-syst-sci.net/3/583/2003/.
Barriendos, M. and Martın-Vide, J.: Secular Climatic Oscillationsas Indicated by Catastrophic Floods in the Spanish Mediter-ranean Coastal Area (14th–19th Centuries), Climatic Change,38, 4, 473–491, 1998.
Barriendos, M. and Pomes, J.: L’aigua a Mataro. Inundacions irecursos hıdrics (segles XVIII–XX), Caixa d’Estalvis Laietana,Mataro, 278, 1993.
Benito, G., Dıez-Herrero, A., and Fernandez de Villalta, M.: Mag-nitude and frequency of flooding in the Tagus Basin (centralSpain) over the last millennium, Climatic Change, 58, 171–192,2003.
Benito, G., Lang, M., Barriendos, M., Llasat, M. C., Frances, F.,Ouarda, T., Thorndycraft, V., Enzel, Y., Bardossy, A., Coeur,D. and Bodee, B.: Use of systematic, palaeoflood and historicaldata for the improvement of flood risk estimation, Nat. Hazards,31(3), 623–643, 2004.
Berga, L.: La problematica de las inundaciones en Catalunya, in: Elagua en Catalunya, edited by: Berga, L., 237–256, 1995.
Brazdil, R., Glaser, R., Pfister, C., Dobrovolny, P., Antoine, J. M.,Barriendos, M., Camuffo, D., Deutsch, M., Enzi, S., Guidoboni,E., Kotyza, O., and Rodrigo, F. S.: Flood events of selected Euro-
pean rivers in the Sixteenth Century Climatic Change, 43, 239–285, 1999.
Casas Planes, A., Benito, G., Dıez Herrero, A., and Barriendos, M.:SPHERE-GIS: Implementation of an historical and palaeofloodgeographical information system, in: Palaeofloods, HistoricalFloods and Climatic Variability: Applications in Flood Risk As-sessment (Proceedings of the PHEFRA Workshop, Barcelona,16th–19th October, 2002), edited by: Thorndycraft, V. R., Ben-ito, G., Barriendos, M., and Llasat, M. C., 363–368, 2003.
Comision Nacional de Proteccion Civil: Estudio de InundacionesHistoricas. Mapa de Riesgos Potenciales. Cuenca del PirineoOriental, 2 volumes, 1983.
Comision Nacional de Proteccion Civil: Estudio de InundacionesHistoricas. Mapa de Riesgos Potenciales. Cuenca del Ebro, 3 vol-umes, 1985.
Dıez-Herrero, A., Benito, G., and Lain Huerta, L.: Regional palae-oflood databases applied to flood hazards and palaeoclimate anal-ysis, edited by: Benir, G., Baker, V. R., and Gregory, K. J.,Palaeohydrology and Environmental Change, Wiley, Chichester,335–347, 1998.
Dolz, J.: The problem of floods in Spain. Report of the US-Spanishjoint workshop on Natural Hazards, NSF-UPC, Barcelona, 1993.
Forte, F., Pennetta, L., and Strobl, R. O.: Historic records and GISapplications for flood risk analysis in the Salento area (southernItaly), Nat. Hazards Earth Syst. Sci., 5, 833–844, 2005,http://www.nat-hazards-earth-syst-sci.net/5/833/2005/.
Glaser, R. and Stangl, H.: Historical floods in the Dutch RhineDelta, Nat. Hazards Earth Syst. Sci., 3, 605–613, 2003,http://www.nat-hazards-earth-syst-sci.net/3/605/2003/.
Guzzetti, F., Cardinali, M., and Reichenbach, P.: The AVI Project:A bibliographical and archive inventory of landslides and floodsin Italy, Environmental Management, 18, 623–633, 1994.
Guzzetti, F. and Tonelli, G.: SICI: an information system on histor-ical landslides and floods in Italy, Nat. Hazards Earth Syst. Sci.,4, 213–232, 2004,http://www.nat-hazards-earth-syst-sci.net/4/213/2004/.
Kunkel, K. E., Andsager, K., and Easterling, D. R.: Long-TermTrends in Extreme Precipitation Events over the ConterminousUnited States and Canada, J. Climate, 12, 2515–2527, 1999.
Lana, X. and Burgueno, A.: Some statistical characteristics ofmonthly and annual pluviometric irregularity for the SpanishMediterranean coast, Theoretical and applied Climatology, 65(1–2), 79–98. 2000.
Liebmann, B., Vera, C. S., Carvalho, L. M. V., Camilloni, I. A., Ho-erling, M. P., Allured, D., Barros, V. R., B’aez, J., and Bidegain,M.: An observed trend in central South American precipitation,J. Climate, 17, 4357–4367, 2004.
Livezey, R. E. and Chen, W. Y.: Statistical field significance and itsdetermination by Monte Carlo techniques, Mon. Wea. Rev., 111,46–59, 1983.
Llasat, M. C.: Episodios de lluvias copiosas en Cataluna: genesis,evolucion y factores coadyuvantes, Doctoral Thesis, Universityof Barcelona, no. 40, Barcelona, Spain, 543, 1987.
Llasat, M. C: Gota frıa, Ed. Marcombo, (colec.Boixareu Universi-taria), no. 6, Barcelona, Espana, 165, 1991.
Llasat, M. C.: An objective classification of rainfall events on thebasis of their convective features. Application to rainfall inten-sity in the North-East of Spain, Int. J. Climatol., 21, 1385–1400,2001.
Nat. Hazards Earth Syst. Sci., 7, 271–281, 2007 www.nat-hazards-earth-syst-sci.net/7/271/2007/

M. Barnolas and M. C. Llasat: Flood geodatabase and its climatological applications 281
Llasat, M. C.: La vulnerabilite en Catalogne. Colloque SHF. CruesMediterraneennes. Nimes, Juin 2004 (Publications S. H .F.), 29–34, 2004.
Llasat, M. C., Barriendos, M., Barrera, T., and Rigo, T.: Floods inCatalonia (NE Spain) since the 14th century. Climatological andmeteorological aspects from historical documentary sources andold instrumental records, J. Hydrol., 313, 32–47, 2005.
Llasat, M. C. , Martın, F., and Barrera, A.: From the concept of“kaltluftropfen” (cold air pool) to the cut-off low. The case ofSeptember 1971 in Spain as an example of their role in heavyrainfalls, Meteorol. Atmos. Phys., 96, 43–60, 2007.
Llasat, M. C. and Puigcerver, M.: Total Rainfall and ConvectiveRainfall in Catalonia, Spain, Int. J. Climatol., 17, 1683–1695,1997.
Llasat, M. C. Rigo, T., and Montes, J. M.: Orographic role in thetemporal and spatial distribution of precipitation. The case of theInternal Basins of Catalonia (Spain), Proceedings of the EGSPlinius Conference on Mediterranean Storms held at Maratea,Italy, 14–16 October 1999, GNDCI Publ. n. 2012, 41–55, 2000.
Llasat, M. C., Rigo, T., and Barriendos, M.: The ‘Montserrat-2000’flash-flood event in comparison with spring floods in the North-east of the Iberian Peninsula since the 14th century, Int. J. Clima-tol., 23, 453–469, 2003.
Llasat, M. C. and Rodriguez, R.: Extreme rainfall events in Cat-alonia: the case of 12 November 1988, Nat. Hazards Earth Syst.Sci., 5, 133–151, 1992,http://www.nat-hazards-earth-syst-sci.net/5/133/1992/.
Naulet, R., Lang, M., Coeur, D., and Gigon, C.: Collaboration be-tween historians and hydrologists on the Ardeche river (France).First step: Inventory of Historical Flood Information. Advancesin Natural and Technological Hazards Research, Vol. 17 “TheUse of Historical Data in Natural Hazard Assessments”, editedby: Glade, T., Albini, P., and Frances, F., Kluwer Academic Pub-lishers, Dordrecht, 113–129, 2001.
Novoa, M.: Episodio del 12 de octubre de 1907 en la cuenca del rıoCardener. Direccion General de Obras Hidraulicas. Comisarıa deAguas del Pirineo Oriental. Servicio de Aforos, Ministerio deObras Publicas y Urbanismo, Espana, 110, 1981.
Petrucci, O. and Versace, P.: Conoscere il passato per prevedere ilfuturo,Dipartimento Protezione Civile Informa, 29, 25–26, 2000.
Ramis, C., Alonso, S., and Llasat, M. C.: A comparative study be-tween two cases of extreme rainfall events in Catalonia, Surveysin Geophysics, 16, 141–161, 1995.
Ramis, C., Llasat, M. C., Genoves, A., and Jansa, A.: The October-1987 floods in Catalonia: synoptic and mesoscale mechanisms,Meteorological Applications, 1, 337–350, 1994.
Rigo, T.: Study of Occidental Mediterranean Convective MesoscaleSystems using meteorological radar (in Spanish), Doctoral The-sis, University of Barcelona, Internal publication, 2004.
Rigo, T., Batlle, J., and Llasat, M. C.: Una comparacion de episo-dios de inundaciones en Cataluna no otonales (junio 2000, sep-tiembre 1996 y enero 1996), Publicaciones de la AsociacionEspanola de Climatologıa (AEC), Serie A, 2, 401–412, 2001.
Rigo, T. and Llasat, M. C.: A winter flood event in Spain: TheJanuary 1996 case, Geophys. Res. Abstr., European GeophysicalSociety, 2, 2000.
Rigo, T. and Llasat, M. C.: A methodology for the classification ofconvective structures using meteorological radar, Nat. HazardsEarth Syst. Sci., 4, 59–68, 2004,http://www.nat-hazards-earth-syst-sci.net/4/59/2004/.
Rigo, T. and Llasat, M. C.: Radar analysis of the life cycle ofMesoscale Convective Systems during the 10 June 2000 event,Nat. Hazards Earth Syst. Sci., 5, 959–970, 2005,http://www.nat-hazards-earth-syst-sci.net/5/959/2005/.
www.nat-hazards-earth-syst-sci.net/7/271/2007/ Nat. Hazards Earth Syst. Sci., 7, 271–281, 2007