
A NOVEL NON-ACOUSTIC VOICED SPEECH SENSOR: …
115
A NOVEL NON-ACOUSTIC VOICED SPEECH SENSOR: EXPERIMENTAL RESULTS AND CHARACTERIZATION by Kevin Michael Keenaghan A Thesis Submitted to the Faculty of the WORCESTER POLYTECHNIC INSTITUTE in partial fulfillment of the requirements for the Degree of Master of Science in Electrical and Computer Engineering February 2004 Professor Donald Richard Brown III, Advisor Professor Edward Clancy, Committee Professor Reinhold Ludwig, Committee
Transcript of A NOVEL NON-ACOUSTIC VOICED SPEECH SENSOR: …

A NOVEL NON-ACOUSTIC VOICED SPEECH SENSOR:
EXPERIMENTAL RESULTS AND CHARACTERIZATION
by
Kevin Michael Keenaghan
A Thesis
Submitted to the Faculty
of the
WORCESTER POLYTECHNIC INSTITUTE
in partial fulfillment of the requirements for the
Degree of Master of Science
in
Electrical and Computer Engineering
February 2004
Professor Donald Richard Brown III, Advisor
Professor Edward Clancy, Committee
Professor Reinhold Ludwig, Committee

c© 2004 Kevin Michael Keenaghan
ALL RIGHTS RESERVED

To Mom, Dad, and Kris.

ABSTRACT
Recovering clean speech from an audio signal with additive noise is a problem that
has plagued the signal processing community for decades. One promising technique
currently being utilized in speech-coding applications is a multi-sensor approach,
in which a microphone is used in conjunction with optical, mechanical, and elec-
trical non-acoustic speech sensors to provide greater versatility in signal processing
algorithms. One such non-acoustic glottal waveform sensor is the Tuned Electro-
magnetic Resonator Collar (TERC) sensor, first developed in [BLP+02]. The sensor
is based on Magnetic Resonance Imaging (MRI) concepts, and is designed to de-
tect small changes in capacitance caused by changes to the state of the vocal cords
— the glottal waveform. Although preliminary simulations in [BLP+02] have vali-
dated the basic theory governing the TERC sensor’s operation, results from human
subject testing are necessary to accurately characterize the sensor’s performance in
practice.
To this end, a system was designed and developed to provide real-time audio
recordings from the sensor while attached to a human test subject. From these
recordings, executed in a variety of acoustic noise environments, the practical func-
tionality of the TERC sensor was demonstrated. The sensor in its current evolution
is able to detect a periodic waveform during voiced speech, with two clear harmon-
ics and a fundamental frequency equal to that of the speech it is detecting. This
waveform is representative of the glottal waveform, with little or no articulation as
initially hypothesized. Though statistically significant conclusions about the sen-
sor’s immunity to environmental noise are difficult to draw, the results suggest that
the TERC sensor is considerably more resistant to the effects of noise than typical

acoustic sensors, making it a valuable addition to the multi-sensor speech processing
approach.
iv

BIOGRAPHICAL SKETCH
Bright and early on the morning of September 3, 1980, Kevin Michael Keenaghan
decided it was high time he blessed the world with his presence. He was born to
Kathy and Ted Keenaghan, two amazing people by all accounts, in scenic Pawtucket,
Rhode Island. Early on, Kevin began to display his affinity for unusual sleep habits,
a tendency that would follow him throughout life and eventually be the bane of his
Masters advisor’s existance. While most parents fretted over trying to get their
babies to sleep, Kevin’s father would come home from work at 5pm and have to
wake him up just so he could play with him for a while!
Kevin made it through high school in a relatively uneventful manner, impressing
teachers not only with his abilities but also with a strong case of senioritis that began
soon after the start of his Freshman year. Luckily he was able to finally outgrow the
illness and become motivated towards the end of high school (much to the relief of
his parents, who had no doubt come close to several nervous breakdowns over the
course of the four years). It was during this senior year of newfound motivation that
Kevin and his family made that fateful visit to Worcester Polytechnic Institute. He
decided right there and then that WPI was the perfect college for him. Luckily for
him, he was accepted. Luckily for his parents, he got scholarships and financial aid.
Not long after entering WPI, Kevin made the very intelligent decision to go into
Electrical Engineering, and was quickly introduced to not only a great academic
program, but also amazing teachers like Professor Rick Vaz, his undergraduate
advisor. On a non-academic level, he also made the decision to join the Lambda
Chi Alpha Fraternity, a highly unlikely decision by one who entered college as a self-
proclaimed GDI, but which turned out to be one of the best decisions of his life.
v

When not immersed in books (academic or otherwise), Kevin spent his college time
gallivanting around the world doing school projects in Costa Rica and Ireland. As
he neared graduation, he was introduced to the inimitable Professor Rick Brown,
and made the decision to continue on for a Masters degree - a decision inspired
partly by his desire to eventually become a college professor, and partly by the
absolutely miserable job market at the time.
Other than the inevitable clashes that occur when a student with a penchant
for sleeping late teams up with an advisor who wakes the rooster up on his way
to work, Kevin managed to make it through his Masters program with very few
hitches and get involved with some great research. He was invited to work on this
project, which offered him a chance to not only work on some cutting-edge research,
but also to work under the tutelage of Professor Brown once again.
At the time he wrote this thesis, Kevin was weighing his options for employment
offers, and gearing up to finally get out into the “real world” he kept hearing so
much about.
vi

ACKNOWLEDGEMENTS
I cannot begin to say how grateful I am to my family for their constant love, support,
and encouragement during not only my academic career but throughout my life.
Without them, I could never have made it this far or accomplished what I have.
Thanks for always being my role models and the people I aspire to be like when I
finally decide to “grow up,” and for always listening to me ramble on incessantly
about things that I don’t even totally understand myself!
I am forever indebted to my thesis advisor, Professor Rick Brown, for his support
and assistance throughout this project and the rest of my Masters degree, and for
getting me back on track during those occasional times when the light at the end
of the tunnel seemed to be too far away to reach. Thanks for your advice and
friendship, and for passing “Raulisms” on to a whole new generation of engineers.
Thanks also to the members of my thesis committee, Professors Ted Clancy and
Reinhold Ludwig, for their advice, input, and support during this project.
Finally, I owe a great debt of gratitude to the Defense Advanced Research
Projects Agency (DARPA) for supporting the project and making this thesis re-
search possible, and to the members of the Advanced Speech Encoding (ASE) pro-
gram, especially Paul Gatewood at Arcon Corp, for their input and help.
vii

TABLE OF CONTENTS
Biographical Sketch . . . . . . . . . . . . . . . . . . . . . . . . . . . . . . vAcknowledgements . . . . . . . . . . . . . . . . . . . . . . . . . . . . . . viiTable of Contents . . . . . . . . . . . . . . . . . . . . . . . . . . . . . . . viiiList of Tables . . . . . . . . . . . . . . . . . . . . . . . . . . . . . . . . . xList of Figures . . . . . . . . . . . . . . . . . . . . . . . . . . . . . . . . . xi
1 Introduction 11.1 Motivation . . . . . . . . . . . . . . . . . . . . . . . . . . . . . . . . 31.2 Thesis Contributions . . . . . . . . . . . . . . . . . . . . . . . . . . 41.3 Thesis Content . . . . . . . . . . . . . . . . . . . . . . . . . . . . . 5
2 Background 82.1 Speech Production . . . . . . . . . . . . . . . . . . . . . . . . . . . 8
2.1.1 The Anatomy of Speech Production . . . . . . . . . . . . . . 82.1.2 Voiced Speech Production . . . . . . . . . . . . . . . . . . . 102.1.3 The Physics of Speech . . . . . . . . . . . . . . . . . . . . . 13
2.2 Glottal Waveform Sensors . . . . . . . . . . . . . . . . . . . . . . . 142.2.1 The Physiological Microphone . . . . . . . . . . . . . . . . . 16
2.3 Intelligibility Tests . . . . . . . . . . . . . . . . . . . . . . . . . . . 182.3.1 Word List Tests . . . . . . . . . . . . . . . . . . . . . . . . . 182.3.2 Sentence List Tests . . . . . . . . . . . . . . . . . . . . . . . 242.3.3 Conversational Tests . . . . . . . . . . . . . . . . . . . . . . 26
2.4 Signal Processing Background . . . . . . . . . . . . . . . . . . . . . 262.4.1 Signal-to-Noise Ratio . . . . . . . . . . . . . . . . . . . . . . 272.4.2 Pitch Detection and Tracking . . . . . . . . . . . . . . . . . 29
3 TERC Sensor System Design 313.1 Principles of Operation . . . . . . . . . . . . . . . . . . . . . . . . . 313.2 TERC System Setup . . . . . . . . . . . . . . . . . . . . . . . . . . 34
3.2.1 Network Analyzer Tests . . . . . . . . . . . . . . . . . . . . 353.2.2 Demodulation System Design . . . . . . . . . . . . . . . . . 38
4 Data Acquisition System Design and Test Procedures 424.1 Context and Experimental Apparatus . . . . . . . . . . . . . . . . . 424.2 Sound Field Generation . . . . . . . . . . . . . . . . . . . . . . . . 45
4.2.1 Sound Generation System . . . . . . . . . . . . . . . . . . . 474.3 Recording System Setup . . . . . . . . . . . . . . . . . . . . . . . . 474.4 Testing Procedures . . . . . . . . . . . . . . . . . . . . . . . . . . . 50
4.4.1 Human Subject Considerations . . . . . . . . . . . . . . . . 504.4.2 Types of Tests Performed . . . . . . . . . . . . . . . . . . . 524.4.3 Recording Time . . . . . . . . . . . . . . . . . . . . . . . . . 56
viii

4.4.4 Limitations of Testing . . . . . . . . . . . . . . . . . . . . . 59
5 Results and Conclusions 635.1 Results . . . . . . . . . . . . . . . . . . . . . . . . . . . . . . . . . . 63
5.1.1 General Performance Results . . . . . . . . . . . . . . . . . 635.1.2 SNR Results . . . . . . . . . . . . . . . . . . . . . . . . . . . 715.1.3 Pitch Detection . . . . . . . . . . . . . . . . . . . . . . . . . 75
5.2 Conclusions . . . . . . . . . . . . . . . . . . . . . . . . . . . . . . . 795.2.1 Contributions of Research . . . . . . . . . . . . . . . . . . . 795.2.2 Performance and Recommendations . . . . . . . . . . . . . . 81
A Speech Intelligibility Tests 84A.1 Harvard Psychoacoustic Sentence Lists . . . . . . . . . . . . . . . . 84A.2 Diagnostic Rhyme Test Stimulus Words . . . . . . . . . . . . . . . . 92A.3 Phonetically Balanced (PB-50) Word Lists . . . . . . . . . . . . . . 93A.4 Sustained Vowel Word Lists . . . . . . . . . . . . . . . . . . . . . . 98
B WPI Pilot Corpus 99
Bibliography 100
ix

LIST OF TABLES
4.1 Noise Environments and SPL Readings . . . . . . . . . . . . . . . . 474.2 Recording Time for the Sustained Vowel Lists . . . . . . . . . . . . 564.3 Recording Time for the Harvard Sentence Lists . . . . . . . . . . . 574.4 Recording Time for the Diagnostic Rhyme Tests . . . . . . . . . . . 584.5 Recording Time for the PB-50 Word Lists . . . . . . . . . . . . . . 594.6 Total Recording Time for One Noise Environment . . . . . . . . . . 59
A.1 DRT Stimulus Words . . . . . . . . . . . . . . . . . . . . . . . . . . 92A.2 PB-50 Word Lists . . . . . . . . . . . . . . . . . . . . . . . . . . . . 93A.3 Vowel Word Lists . . . . . . . . . . . . . . . . . . . . . . . . . . . . 98
x

LIST OF FIGURES
1.1 Signal processing techniques using only one microphone. . . . . . . 11.2 Signal processing techniques using multiple microphones. . . . . . . 21.3 Signal processing techniques using multiple sensors. . . . . . . . . . 2
2.1 Lateral view of the human vocal organs. . . . . . . . . . . . . . . . 92.2 Approximation of the glottal waveform. . . . . . . . . . . . . . . . . 112.3 Frequency response of the glottal waveform. . . . . . . . . . . . . . 122.4 Shape of the lips for various vowel sounds. . . . . . . . . . . . . . . 132.5 The Physiological Microphone (PMIC). . . . . . . . . . . . . . . . . 17
3.1 Simplified model of the human neck. . . . . . . . . . . . . . . . . . 323.2 Theoretical resonance shift due to glottal state changes. . . . . . . . 333.3 Concept behind the TERC sensor’s operation. . . . . . . . . . . . . 343.4 Baseband glottal signal as seen on Network Analyzer. . . . . . . . . 363.5 Network Analyzer tests with circulator. . . . . . . . . . . . . . . . . 383.6 Diode/capacitor envelope detector circuit. . . . . . . . . . . . . . . 393.7 Signal Acquisition Setup for the TERC Sensor. . . . . . . . . . . . 40
4.1 Interior layout of the sound booth during testing. . . . . . . . . . . 434.2 Physical location of the TERC sensor on a human subject’s neck. . 444.3 Environmental Noise Production System Setup. . . . . . . . . . . . 484.4 Recording System Setup. . . . . . . . . . . . . . . . . . . . . . . . . 494.5 Effect of resonance shifts on the TERC output. . . . . . . . . . . . 60
5.1 Time domain comparison between microphone and TERC signals. . 645.2 Low frequency signal content prior to voiced speech. . . . . . . . . . 655.3 Delay between the TERC and microphone signals. . . . . . . . . . . 665.4 Example of delay through the WinRadio package. . . . . . . . . . . 675.5 Nulls in background noise in spectrograms of TERC sensor. . . . . 675.6 Spectrogram of frequency sweep with “spatial” setting. . . . . . . . 685.7 Spectrogram of frequency sweep without “spatial” setting. . . . . . 695.8 PSD of frequency sweep with “spatial” setting. . . . . . . . . . . . . 705.9 PSD of frequency sweep without “spatial” setting. . . . . . . . . . . 705.10 SNR versus SPL measurements for three sensors. . . . . . . . . . . 735.11 Comparison of PSD for microphone and TERC sensors. . . . . . . . 755.12 Spectrogram of vowel word list in quiet environment. . . . . . . . . 765.13 Spectrogram of vowel word list in BHH environment. . . . . . . . . 775.14 Spectrogram of vowel word list in M2H environment. . . . . . . . . 77
xi

CHAPTER 1
INTRODUCTION
One of the oldest and most common problems in the signal processing field is the
issue of how to derive a clean speech signal from one plagued with background noise.
There have been any number of methods developed to derive the best possible
approximation of the clean speech signal under adverse conditions. Traditional
signal processing techniques involved only a single noisy speech signal as their input,
as illustrated in Figure 1.1:
Mic 1Clean SpeechSignal Processing
Technique
1
Estimate
Figure 1.1: Traditional signal processing techniques using only one microphone.
Although many of these single-microphone techniques are still employed suc-
cessfully (e.g. spectral subtraction or adaptive filtering techniques as described in
[Fan02]), the performance of these techniques degrades significantly in the pres-
ence of a high acoustic noise environment. However, by modifying the model in
Figure 1.1 to include multiple microphone inputs, as shown in Figure 1.2, more
complex and effective signal processing techniques can be employed along with the
traditional techniques to improve the performance of the system.
Even with the improved performance of multiple-microphone signal processing
techniques (e.g. beamforming, as described in [Fan02]), such a system’s suscep-
1

Mic 1
Mic 2
Mic n
. . .
.
Clean SpeechSignal Processing
Technique
2
Estimate
Figure 1.2: Signal processing techniques using multiple microphones in an array.
tibility to environmental noise is still high when using only traditional acoustic
microphones. Rather than assuming that the input to the system has to be an
array of acoustic microphones, the model in Figure 1.2 can be amended to include
more generic “sensor” inputs:
Mic 1
. . .
.
Sensor 1
Sensor n
Signal Processing
Technique
3
Clean SpeechEstimate
Figure 1.3: Signal processing techniques using a multiple sensor array.
An acoustic microphone is limited in its efficacy for signal processing techniques
in high noise environments. As the background noise increases, so too does the
difficulty of deriving a clean speech signal from the noisy signal using traditional
microphones. Replacing some of the microphone inputs in Figure 1.2 with newer
non-traditional speech sensors could significantly improve the performance of the
techniques.
2

One family of sensors that could be incorporated into the system in Figure 1.3
is the family of non-acoustic speech sensors, which measure particular elements of
speech without detecting invasive environmental background noise. Initial forays
into this field, such as a laryngoscope with which one could view the movements
of the vocal cords [Gar55] directly, proved clinically interesting but functionally
problematic. The initial sensors were either too cumbersome or uncomfortable to
use during normal vocalization. While they provided a great deal of insight into
the speech production process, they were simply inadequate for the intricacies of
speech processing as it is known today.
Newer non-acoustic sensors like the electroglottogram (EGG), the Glottal Elec-
tromagnetic Micropower Sensor (GEMS) [Bur99], and the Physiological Microphone
(PMIC) [Sca98] can each be used as a transducer to measure the glottal waveform
— a signal representative of perturbations of the vocal cords occurring during voiced
speech. This waveform can be used as a proxy for the actual acoustic speech sig-
nal. Many of these sensors, while considered large steps forward in the field, are
susceptible to placement issues due to their small size and sensitivity..
1.1 Motivation
In 2003, researchers at the Worcester Polytechnic Institute developed a new non-
acoustic glottal waveform sensor named the Tuned Electromagnetic Resonator Col-
lar (TERC) sensor, which uses changes to the integrated dielectric properties of the
neck occurring due to the opening and closing of the vocal folds to measure the
glottal state (refer to [BLP+02] and [Pel04]). Fundamentally based on magnetic
resonance imaging (MRI) concepts, the TERC sensor introduces a new approach to
3

the issue of glottal waveform measurement. Since the TERC sensor was designed
to measure changes in the dielectric properties of a cross-section of the neck rather
than skin vibrations or any kind of acoustic waveform derivative, the initial hypoth-
esis by the researchers was that it would be relatively impervious to the effects of
environmental noise.
Though preliminary simulations validated the basic concepts defining the TERC
sensor’s operation [Pel04], no efforts had been made to accurately characterize the
sensor’s performance or, in fact, prove that the theory could actually be applied in
practice.
1.2 Thesis Contributions
One of the major goals of this research, then, was to test the TERC sensor in a
laboratory setting with human test subjects in order to characterize its performance.
The accomplishment of this goal, however, was reliant on the realization of several
other interrelated goals:
1. The design and construction of a demodulation system based on the operation
of the TERC sensor to provide the analog acoustic waveform representing the
glottal waveform.
2. The design and construction of sound generation and data acquisition systems
to record the analog acoustic signal from the TERC sensor for subsequent
signal processing applications.
3. The development and execution of human subject experiments with the TERC
sensor in controlled acoustic environments to create a data set of speech
4

recordings
4. The organization, formatting, and distribution of the corpus of data collected
during the experimental phase of the research
5. The evaluation and characterization of the TERC sensor’s performance based
on the recordings in the data set
There are several important deliverables that resulted from the actualization of
these goals. The first is the data acquisition and demodulation systems that allowed
for the recordings from the TERC sensor to ultimately be made. The second was the
actual corpus of data, consisting of roughly two and a half hours of audio recordings
for three different sensors, which were used to characterize the sensor’s performance.
Finally, the results and conclusions presented in this document define the level
of performance of the TERC sensor in its current form, and also provide recommen-
dations for future research possibilities to improve this performance.
1.3 Thesis Content
The major content of this document is divided into five chapters, including one of
the appendices, in a logical, rather than chronological, presentation of the research.
There is a great deal of information relating to the speech process and signal pro-
cessing techniques which will aid the reader in fully understanding the methods
and concepts in this research. Chapter 2 presents this information as a background
chapter, which can be read in as little or as much depth as necessary to augment
the research in subsequent chapters.
5

Because the entire focus of this research is related to the TERC sensor, a full
understanding of the theory of operation behind the sensor and its practical imple-
mentation is necessary to fully appreciate the contributions of this research. Chap-
ter 3 explains the operation of the TERC sensor, and describes the development of
the demodulation circuitry necessary to obtain an audio signal from the sensor.
Chapter 4 describes the development and execution of the experimental testing
procedure used to record the TERC sensor signals during speech, which is divided
into several areas of focus. Following an overall description of the purpose of the
tests, the development of the sound generation and acquisition systems that allow
the sensor signals to be digitally recorded are described. In addition, the specific
tests performed and any considerations with dealing with human test subjects are
presented.
The results of this testing, along with any conclusions drawn from these results,
are presented in Chapter 5. Along with the general objective and subjective results
about the sensor’s performance, additional results relating to the specific signal
processing applications of signal-to-noise ratios and pitch detection are presented
as well. The conclusions about the sensor’s performance are augmented with recom-
mendations for future research opportunities based on the results of this research.
Finally, since various word and sentence lists were utilized in the development of
the data recordings, the corpus data cannot be interpreted or analyzed fully without
knowing which specific lists were used. As such, Appendix A presents these lists in
their entirety as supplemental information.
Before delving into the design of the experimental procedure and the ultimate
6

characterization of the TERC sensor’s performance, however, it is necessary to
provide a solid foundation of the signal processing and speech production concepts
that will be applied throughout this research.
7

CHAPTER 2
BACKGROUND
Before one can delve into the specific procedures and results of this research, it is
important to first be familiar with some directly related background information.
None of the concepts in this chapter were developed during this research, but are
intended to provide readers with a solid understanding of the theories and practices
employed in subsequent chapters.
2.1 Speech Production
The principal function of the organs which make up the vocal tract is to aid in the
respiratory and digestive functions of the body. However, through a modification of
the respiratory process, these organs can be used to produce the sounds of human
speech.
2.1.1 The Anatomy of Speech Production
At the top of the vocal tract (see Figure 2.1) are the nasal cavity and the mouth,
containing the lips, teeth, tongue, and hard palate. The nasal cavity and mouth
meet posteriorly at the end of the soft palate, which can move and block the flow
of air from the lungs to the nasal cavity for some non-nasal sounds during speech.
Collectively, these organs produce the majority of the changes in the shape of the
vocal tract, known as articulatory movements, which produce the sounds of human
speech. Connecting the mouth and the nasal cavity is the pharynx, which extends
down to the top of the larynx, near the epiglottis. Though the pharynx can change
8

shape during speech, not a great deal is known about how the modifications in
shape affect the sounds produced [DP93].
Nasal Cavity
TongueLips
Teeth
Vocal Folds
Esophagus
Trachea
Epiglottis
Larynx
Pharynx
Thyroid Cartilage
Soft Palate
ArytenoidCartilages
Figure 2.1: Lateral view of the human vocal organs.
The larynx is essentially a stack of cartilage rings located above the trachea and
below the pharynx, the most prominent of which is the thyroid cartilage, commonly
known as the “Adam’s apple.” At the top of the larynx is the epiglottis, used to
help deflect food from the trachea during swallowing. Below the epiglottis are the
vestibular folds [RGR97], or “false vocal cords,” which are connected anteriorly
to the thyroid cartilage and posteriorly to the arytenoid cartilages. These folds
can open and close, but are not thought to aid in the speech process. Below the
vestibular folds are the vocal folds, or “vocal cords,” which are connected in the
same manner. The vocal folds and the gap between them are known collectively as
the “glottis.” Through the movement of the arytenoid cartilages, these folds can
9

open fully (as during respiration), close fully (as during swallowing), or open and
close rapidly (as during voiced speech production).
2.1.2 Voiced Speech Production
There are three primary methods of speech production. The first involves partially
blocking the path of air from the lungs, causing it to “hiss” through the constricted
path. This technique is used to create fricatives (e.g. teeth to lips for the /f/†
in “effort” or tongue to hard palate for the /s/ in “hiss”). The second involves
completely blocking the path of air from the lungs momentarily and then releasing
the flow in one forceful sound. This technique is used to create plosives (e.g. lips
together for the /p/ in “push” or tongue to hard palate for the /t/ in “time”).
The final method of speech production is used for voiced speech, which can also
be combined with the previously named methods to create additional sounds (e.g.
voiced fricatives such as the /v/ in very or voiced plosives such as the /d/ in dog).
During voiced speech the vocal folds are held closed, forcing a buildup of air
pressure from the lungs. The folds are eventually forced open, expelling a burst of
air and releasing the pressure. They can then return to the closed position, initiating
the buildup of pressure again. This effectively segments the flow of air from the
lungs into brief puffs, which can be heard as an audible buzz whose fundamental
frequency depends on the frequency at which the vocal folds open and close. By
altering the length and tension of the vocal folds and the air pressure from the
lungs, one can alter the fundamental frequency at which this cycle occurs, and thus
the frequency of the resulting sound.
†The symbol /·/ refers to one of the phonemes of General American English defined in Table2.1 of [DP93].
10

During normal speech this fundamental frequency is in the range of around
60 Hz to 500 Hz, averaging approximately 265 Hz, 225 Hz, and 120 Hz for children,
women, and men, respectively [Fry79] (which equate to roughly a “middle C,” “A
below middle C,” and “two B’s below middle C,” in musical notation). Normally
people use about an octave of range during speech, generally in the lower portion
of their total voice range.
The airflow during one glottal cycle is described in [Fry79] as follows:
“[T]he rise from zero to about 700cm3 takes just over 2 ms. As the cords
begin to close together again, the airflow diminishes but at a somewhat
slower rate, taking over 3 ms to return to zero, and it remains at zero
for just over 3 ms before beginning the cycle again.”
−4 −2 0 2 4
0
100
200
300
400
500
600
700
Time (msec)
Vol
ume
Vel
ocity
(cm
3 / se
c)
Figure 2.2: Generalized approximation of the air flow during one period of the
glottal waveform.
It is interesting to study the transfer function of a continuous waveform of these
11

puffs of air, the “glottal waveform,” in order to better understand the speech process.
For simplicity’s sake, one can approximate the glottal waveform with that seen in
Figure 2.2, centered at time t = 0 with a period of T = 8ms and an amplitude of
700cm3/sec, as shown in Figure 2.2. The magnitude and phase response for this
waveform can be seen in Figure 2.3, where f0 = 1/T .
0 fo 2fo 4fo 6fo 8fo 10fo0
0.1
0.2
0.3
0.4
0.5
0.6
0.7
0.8
0.9
1
Frequency (Hz)
Nor
mal
ized
Mag
nitu
de (
|X(f
)|)
0 fo 2fo 4fo 6fo 8fo 10fo−16
−14
−12
−10
−8
−6
−4
−2
0
Frequency (Hz)
Pha
se (
∠X
(f))
Figure 2.3: Approximate frequency response of the glottal waveform.
Since the approximate glottal waveform in Figure 2.2 is closely related to a
triangle wave, it should not be surprising that its magnitude spectrum is closely
related to a sinc2(f) waveform (for those unfamiliar with Fourier transform pairs,
there exists a common pair: ∆(t/τ)F⇐⇒ τsinc2(τ ·f)). The waveform used to
generate these frequency response plots is only an approximation of the actual
glottal waveform; as such, the accuracy of the spectra in Figure 2.3 is dictated
by the accuracy of this approximation. With that caveat, however, these plots still
provide valuable insight into the time and frequency domain responses of the glottal
waveform.
12

2.1.3 The Physics of Speech
The glottal waveform described in the previous section produces the pitch of voiced
speech segments and the distinction between voiced and unvoiced segments of
speech, but does not contain any linguistic information. This information is pro-
duced by the changes in shape of one or more part of the vocal tract.
The vocal tract can, most simply, be modeled as a tube with one open end
and one closed end. Such a tube possesses several inherent resonant frequencies
(frequencies at which acoustic sound will be amplified). A single tube of uniform
cross-sectional diameter with a length equal to that of an average vocal tract -
about seven inches - will have resonances at 500Hz, 1500Hz, 2500Hz, 3500Hz and
4500Hz [DP93]. When dealing with linguistics, these resonances are referred to as
formants, and dictate how the speech signal will sound. As the vocal tract changes
shape during speech, the resonant frequencies (and thus the formant frequencies)
will change, altering the sound produced. An example of this would be to change
the shape of the opening of the vocal tract, the lips, as shown in Figure 2.4.
(a.) (b.) (c.)
Figure 2.4: Shape of the lips for the phonemes /i/ (a), /æ/ (b), and /u/ (c).
In simple terms, the vocal tract, with its formant frequencies, can be thought
of as a filter. The glottal waveform acts as the input to the filter, and the acoustic
waveform produced at the lips is the output. The spectra of the glottal pulse, as
13

approximated in Figure 2.3, provide the pitch and certain other characteristics to
the speech waveform, and the vocal tract shapes this waveform according to which
sound is being produced. As such, one can change the sound produced from an
/i/ sound to an /u/ sound without significantly affecting the glottal waveform, and
vice-versa.
2.2 Glottal Waveform Sensors
Though it is possible to develop an approximation of the glottal waveform using the
speech waveform and inverse filtering with a vocal tract transfer function estimate,
for instance, it is desirable to measure the glottal function directly. There are a
number of approaches to this problem, which can be grouped into three major
classifications: visual, mechanical, and electrical.
One of the first examples of visual examination of the glottal function was
Manuel Garcia’s 1855 invention of the laryngoscope [Gar55]. Garcia held a small
dental mirror at the back of his throat, and used a hand-mirror to reflect the sun-
light so he could observe his own vocal folds during speech. Over time, Garcia’s
laryngoscope, intended primarily for his own research in the area of singing, was
further developed and improved for medical research. In 1940, a Bell Labs cam-
era was used for laryngeal cinematography, photographing the larynx at a rate of
4000 frames/s [Far40]. One disadvantage of these methods is that the devices are
often uncomfortable for the subjects, and can only be used during sustained vowel
production.
Two exceptions to this are the photoelectric glottogram first developed in 1960
by Sonesson [Son60] and later commercialized by Frøkær-Jensen [FJ67], and the
14

endofibroscope first presented in 1968 by Sawashima and Hirose [SH68]. Although
both of these devices allowed for the study of the vocal organs during natural speech
with less discomfort to the subject, they still possess a number of functional issues
as described in [Hes83] and [Hoo97].
There are a variety of mechanical devices used to determine the glottal wave-
form. Some, like the vocal-tract extension tube described in [Son75], attempt to
eliminate the effects of the vocal tract or lip radiation from the speech signal, leav-
ing only the glottal waveform. Though similar to the inverse filtering technique
mentioned previously, this method does not require knowledge of the vocal tract
transfer function. Other mechanical devices work more like microphones. There
are a number of microphones that use accelerometers to transduce vibrations in the
body into an electrical signal. A throat microphone utilizes vibrations in the skin
wall near the glottis as a measure of the glottal signal. One specific microphone
that is of particular importance to this research is the Physiological Microphone
(PMIC) described in Section 2.2.1.
The most common electrical devices for glottal waveform measurement act as
transducers that relate impedance changes in the larynx to an electrical signal.
Known as electroglottographs, these devices use the measured impedance changes
to determine the state of the glottis (open or closed). The General Electromagnetic
Movement Sensor (GEMS) produced by Aliph‡ [Bur99], uses a focused antenna to
register movement in human body tissue, most specifically in the head and neck
areas where such vibrations are caused in general by speech production. One ad-
vantage of the GEMS sensor is that depending where the sensor is placed, one can
control for the amount of phonetic information present in the signal — sub-glottal
15

placement will result in mostly just the glottal waveform, while cheek placement will
include more speech information. However, the quality of the GEMS sensor signal is
highly dependent on precise placement, regardless of the area of the head or neck on
which it is used. One additional sensor designed at Worcester Polytechnic Institute,
described in greater detail in Chapter 3, uses magnetic resonance imaging (MRI)
concepts to measure changes to the relative dielectric constant of a cross-section of
the larynx due to the opening and closing of the vocal folds. Because it measures
an integrated effect over a cross-section of the neck rather than a specific location
in the vocal tract, this sensor, known as the Tuned Electromagnetic Resonator Col-
lar (TERC), attempts to eliminate some of the placement and subject stationality
issues of some of the other sensors.
2.2.1 The Physiological Microphone
The Physiological Microphone (PMIC), shown in Figure 2.5, was developed by Mike
Scanlon at the Army Research Laboratory [Sca98]. The device is about one inch
square in size, with a piezoelectric gel pad that is placed in contact with the skin
during operation, typically either on the forehead or neck for speech applications.
The device can be attached with a velcro strap, which makes it very easy to use.
The concept behind the PMIC is that its piezoelectric pad couples better with the
skin than with air, so that when tightly attached to the skin the device will pick up
sounds from the body well but attenuate any surrounding environmental sounds.
Though not truly a non-acoustic sensor, since the device still picks up some
air-coupled vibrations like a stereotypical microphone, the PMIC has significantly
‡Aliph, 8000 Marina Boulevard, Suite 120, Brisbane, CA 94005
16
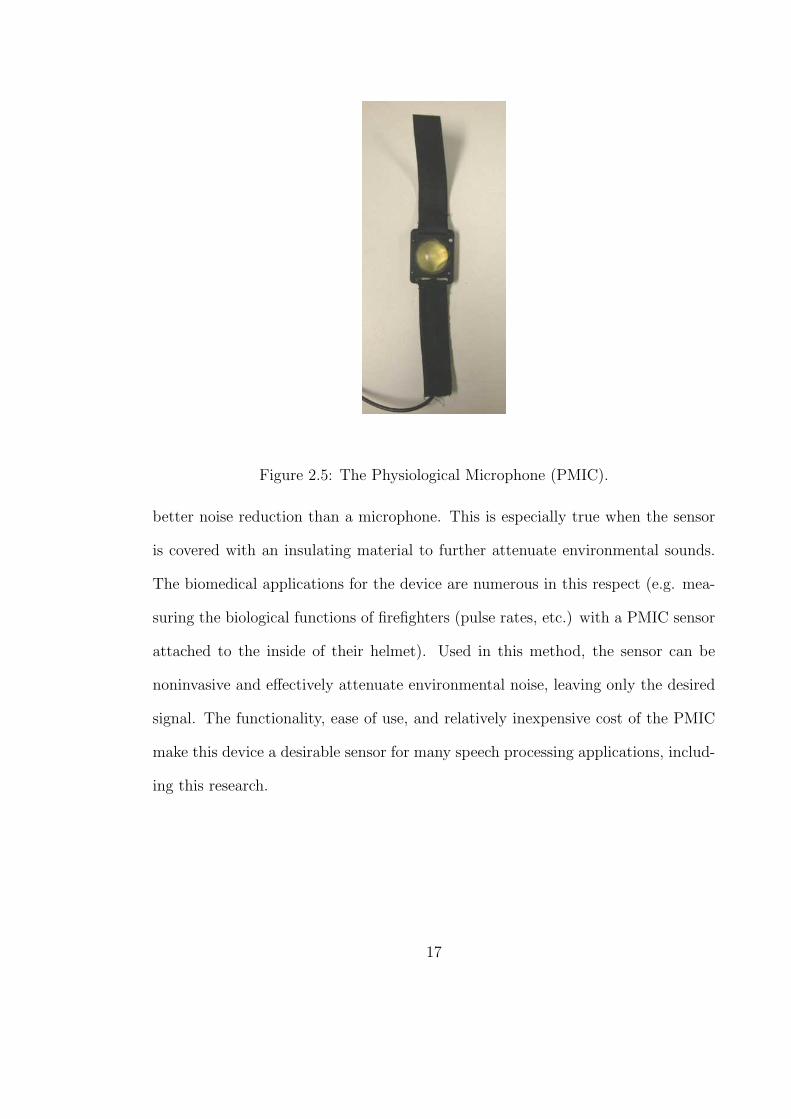
Figure 2.5: The Physiological Microphone (PMIC).
better noise reduction than a microphone. This is especially true when the sensor
is covered with an insulating material to further attenuate environmental sounds.
The biomedical applications for the device are numerous in this respect (e.g. mea-
suring the biological functions of firefighters (pulse rates, etc.) with a PMIC sensor
attached to the inside of their helmet). Used in this method, the sensor can be
noninvasive and effectively attenuate environmental noise, leaving only the desired
signal. The functionality, ease of use, and relatively inexpensive cost of the PMIC
make this device a desirable sensor for many speech processing applications, includ-
ing this research.
17

2.3 Intelligibility Tests
When designing any kind of tests for a speech sensor, one of the difficulties is how
to develop a consistant data set using human test subjects. One way to achieve this
is by utilizing intelligibility tests. Intelligibility is a measure of how well speech can
be understood by a human listener. Typically this measurement is used with regard
to speech encoders or speech synthesizers (see, for instance, [PNG85]), but it can
also provide valuable insight into a new sensor’s performance. There are a variety
of established intelligibility tests, the majority of which can be classified into one of
three categories: Word lists, sentence lists, or conversation.
A typical intelligibility test involves both a recording of the audio data (the
“talker” stage) and a subsequent scoring of the data by a separate subject (the
“listener” stage). For this research, however, only the talker stage will be executed,
as the listener stage is beyond the scope of the research. The recordings from the
talker stage will provide a structured data set from which to characterize the sensor,
and at any point in the future the listener stage could be done using this data set,
as a separate exercise from this research.
2.3.1 Word List Tests
In a typical Word List test, a talker will read from a list of individual words, and
a listener will try to determine what word was spoken from the resulting recording
(in the case of speech encoding, the recording will be processed before the listener
hears it). There are two main classes of Word List tests: Open-set response tests
and closed-set response tests. In an closed-set response test, the listener is provided
18

with a predefined number of possible words and must determine which one was
spoken. In an open-set response test, the listener must determine the spoken word
without the aid of such a predetermined list.
Open-Set Response Tests
When discussing linguistics and word lists, any English word can be broken up into
parts so that it can be classified. For instance, the word “cat” consists of three
phonemes: /k/, /æ/, and /t/. The initial and final phonemes are consonants, and
the medial phoneme is a vowel, which means that “cat” would be classified as a
Consonant-Vowel-Consonant (or CVC) word. Similarly, “do” would be classified as
a CV word (/d/, /u/), “native” would be classified as a CVCVC word (/n/, /e/,
/t/, /I/, /v/), and so on. Many of the Word List tests are comprised of CVC words
for simplicity’s sake. In fact, one of the most basic tests is known simply as a “CVC
Test.”
In this test, a talker reads a list of CVC words, typically within a carrier phrase
such as “type the word . . . now.” The carrier phrase is used so that a listener
will know when the relevant word is going to be spoken, and to provide a sense
of consistency. There are a number of issues with one particular set of these lists,
used by Arcon Corporation§ in their original corpus, namely that they are relatively
short (20 words each) and that half of the words in each list are “nonsense words”
with limited use in some intelligibility applications.
One particular set of CVC word lists that does not have these issues is the
set of phonetically balanced word lists provided in [Ega48]. Each list consists of
§Arcon Corporation, 260 Bear Hill Road, Waltham, Massachusetts 02451
19

50 phonetically balanced (meaning the frequency of every phoneme in each list is
roughly equivalent to that phoneme’s frequency in the English language) words, for
which the lists are known as PB-50 lists. All of the words in the list are actual
words in the English language, though a few might be considered arcane by modern
standards. The words that comprise the lists were extensively tested, and any
of the proposed words that were either almost always or almost never correctly
identified were eliminated from the final lists (since they would provide little to no
intelligibility information either way) [Ega48]. The remaining words were divided
so that each of the 20 lists was of equal difficulty. This means that the results of
two tests using two different lists can be compared without worrying about which
particular list was used.
One final open-set response test is a “sustained vowel list.” One specific set of
these lists can be found in Table A.4. Each of the three lists consists of fourteen
CVC words, such that each of the fourteen vowel phonemes of General American
English is represented in the medial vowel of one of the words in each list. No carrier
phrase is used for this test; rather, each word in the list is spoken individually, with
the medial vowel sound sustained as consistently as possible for one to two seconds.
These tests are useful for isolating the vowel sounds as opposed to the consonant
sounds as a measure of intelligibility.
Closed-Set Response Tests
As mentioned previously, a listener in a closed-set response test has a limited number
of possible choices when deciding what word was spoken. Typically, a closed-set
test is used to judge the intelligibility of consonant phonemes. There are a variety of
20

styles of these tests. In an initial-consonant test, the talker will read one word from
a set in which each word is identically pronounced with the exception of the initial
consonant (e.g. [cat bat rat]). A final-consonant test would include sets of words
where it is the final consonant phoneme that changes (e.g. [cat cap cad]). Similarly,
in a medial-consonant test, it is the medial consonant phoneme that changes (e.g.
[supper sucker suffer]).
The first closed-response test was designed by Grant Fairbanks in 1958 [Fai58].
His “Rhyme Test” is of the initial-consonant type, comprised of fifty sets of five
words each. The talker chooses one of the five words from all fifty sets, and a listener
later attempts to decide which word was spoken. The test was designed such that a
listener would receive a list of word stems without their initial consonants (e.g. -ail),
and must only fill in the correct consonant (e.g. mail or sail). The rate of occurrence
of each English phoneme in the test was designed to be close to its frequency in the
English language, and an attempt was made to ensure that all five words in a set
were equally common. Fairbanks indicated a number of possible modifications to
the test that could include a balanced number of voiced/voiceless initial consonants,
etc.
In 1965, House et al [HWHK65] designed a Modified Rhyme Test (MRT) based
on Fairbanks’ original Rhyme Test. The MRT is also an initial-consonant test,
consisting of fifty sets of six words each. The major difference between the Rhyme
Test and the MRT is that the MRT ignores how common each word is in the
English language and is not phonetically balanced. The other major difference is
on the listener side of the test. Rather than being provided with the word stem and
filling in the missing consonant, which requires that the listener be trained to be
21

familiar with all possible responses, the listener is instead provided with each entire
word set and simply circles or otherwise indicates which of the six words he or she
hears. This means that the MRT is easier to administer, but does not provide any
details about intelligibility for specific aspects of speech (voicing, frication, etc.).
The Diagnostic Rhyme Test (DRT), first developed in 1965 [VCM65], overcomes
some of the shortcomings of a multiple-choice closed-set response test like the MRT.
Having six possible responses as opposed to only two significantly decreases the
possibility that the listener will identify the correct response purely by chance.
However, it is very difficult to isolate specific types of intelligibility with a larger
response set. It would be nearly impossible to design a set of six words such that the
vowel and final consonant for all words were the same and the initial consonants
differed by only one attribute (e.g. voiced vs. unvoiced). The DRT utilizes six
intelligibility attributes:
Voicing - Phonemes with this attribute are produced by vibrating the vocal cords,
such as /d/ or /b/. Phonemes without it are produced without vibration, such
as /p/ or /t/. (Dint vs. Tint)
Nasality - Phonemes with this attribute are produced by “lowering the soft palate
so that air resonates in the nasal cavities and passes out the nose,” [Edi00]
such as /m/ or /n/. Phonemes without it are produced when air resonates in
the oral cavity, such as /b/ or /d/. (Nip vs. Dip)
Sustention - Phonemes with this attribute are produced by only a partial closure
of the vocal tract, allowing some air to pass through, such as /v/ or /∫
/.
Phonemes without it are produced by fully closing the vocal tract, such as
22

/p/ or /c/. (Shaw vs. Chaw)
Sibilance - Phonemes with this attribute will be fricatives or affricatives, such as
/s/ or //. Phonemes without it will not be affricated, such as /g/ or /k/.
(Jaws vs. Gauze)
Graveness - Phonemes with this attribute are produced at the periphery of the
vocal tract (labial consonants) [Edi00], such as /p/ or /f/. Phonemes without
it are produced in the middle of the vocal tract (alveolar and dental conso-
nants), such as /θ/ or /t/. (Pool vs. Tool)
Compactness - Phonemes with this attribute are produced at the beginning of
the vocal tract (velar and palatal consonants), such as /k/ or /∫
/. Phonemes
without it are produced in the remainder of the vocal tract, such as /f/ or
/θ/. (Caught vs. Thought)
One of the major advantages of the DRT is that its word list is balanced on a
number of levels. For example, half of the words in the sustension list are voiced
and half are unvoiced, and within each list are two word pairs from eight medial
vowel phonemes. Thus, the researcher scoring the test can know the state of every
word in the test for each of the six intelligibility attributes. Readers interested in a
more detailed description of the DRT should read [Voi77]. As in the MRT, listeners
are shown both words in each word pair, and simply indicate which of the two words
they heard.
23

2.3.2 Sentence List Tests
The second main subsection of intelligibility tests is Sentence List tests. In the
Word List tests the talker reads individual words, whether within a carrier phrase
or alone, and a listener attempts to apprehend what word was spoken. In the
Sentence List tests, the talker reads full sentences, and the listener tries to apprehend
pre-selected portions of the sentences. Rather than individual word or consonant
apprehension, Sentence List tests provide a different sort of intelligibility measure,
and bring in the notion of contextual intelligibility. Researchers must be careful
when interpreting the results of Sentence List tests, since talker rhythm, context,
etc. can have a large impact on the scores [Ega48]. However, Word List tests
provide very little information on intonation, stress patterns, and changing pitch,
while Sentence List tests are quite useful in this respect. Three specific sentence
lists are the Harvard Psychoacoustic Sentences, the Haskins Sentences, and the
Semantically Unpredictable Sentences.
Harvard Psychoacoustic Sentences
The Harvard Psychoacoustic Sentences consist of a set of lists containing ten pho-
netically balanced sentences each, meaning they were chosen such that the rate of
occurrence of phonemes in the English language is represented in their rate of oc-
currence in the lists. Talkers simply read through an entire set of sentences, and
the listeners attempt to identify what was spoken, which means that little or no
training is necessary. The full 72 sets of ten sentences each, provided by Arcon Cor-
poration, can be found in Section A.1. One of the major advantages to the Harvard
Sentences is the simplicity of their use and the fact that they are well known in the
24

linguistic community. However, there are also two large disadvantages to the test.
Familiarity with the sentences can cause problems with listeners, as they may be
able to fill in missing words to sentences they recognize even if they don’t actually
hear the specific words. Similarly, since the sentences themselves are all logical in
form and content, listeners may be able to determine missing words from context
[Lem99].
Haskins Sentences
The Haskins sentences are very similar to the Harvard Psychoacoustic Sentences,
with one major distinction. The sentences that make up this test are logical in form
(e.g. they follow typical English sentence structure like subject-verb-object), but not
in content. An example of a Haskins sentence, taken from [Lem99], is “The short
arm sent the cow.” The Haskins sentences have the same problem as the Harvard
sentences with listener familiarity, but the illogical content of the sentences makes
it very difficult to identify words solely from context.
Semantically Unpredictable Sentences
Finally, the Semantically Unpredictable Sentences, described in [Jek93], eliminate
the problems of listener familiarity with the Harvard and Haskins Sentences. Rather
than a fixed set of sentences, the sentences are generated from a list of words fitting
a particular grammatical type (e.g. subject, verb, adverb, etc.). There are a variety
of different sentence structures that are randomly used throughout the test (e.g.
subject-verb-adverb, adverb-verb-object, etc.), so theoretically the test could be run
a large number of times without ever repeating a sentence. Thus, listener familiarity
25

is much less problematic than with the previous two sentence tests, but the test
itself is more difficult to administer. Readers interested in further information on
Semantically Unpredictable Sentence tests are referred to [Jek93] and [Lem99].
2.3.3 Conversational Tests
The final subsection of intelligibility tests is the conversational test. Where Word
List tests rate the apprehension of individual words, and Sentence List tests attempt
to rate the apprehension of words in brief context, a conversational test tries to judge
purely contextual apprehension. There are two ways to execute such a test. The
first is to have a talker read a predefined paragraph about a particular topic and
have the listeners try to determine the main idea of the paragraph. The second
method is similar, but instead of the predefined paragraph, an actual conversation
between the talker and a trained researcher is recorded. As such, a conversational
test would not give much information about individual word apprehension or, for
that matter, individual sentence apprehension. Rather, it attempts to rate how
well the gist of the information can be understood without being concerned with
the specifics.
2.4 Signal Processing Background
The intelligibility tests presented in the previous section provide a structured setup
for audio recordings using human test subjects, but do not directly provide any
type of characterization for an acoustic or non-acoustic sensor. In order to qualify
and quantify the results from the recording sessions, a number of signal processing
26

techniques can be employed. Since the TERC sensor was originally designed as a
non-acoustic glottal waveform sensor, meaning that it should theoretically not pick
up any environmental noise, a good initial technique to employ is to find the signal-
to-noise ratio (SNR) for the sensor in various noise environments. The hypothesis
is that the SNR of the sensor should not change as the intensity of the background
acoustic noise is varied.
2.4.1 Signal-to-Noise Ratio
The signal-to-noise ratio (SNR) is a power ratio of the desired signal versus the
noise signal. In speech systems in particular, the SNR is a ration of the clean
speech signal power versus the noise signal power. SNR is defined [Cou01] as
(SNR)dB = 10·log10
(Psignal
Pnoise
)(2.1)
or
(SNR)dB = 10·log10
(s2(t)
n2(t)
)(2.2)
where s2(t) is the variance of the clean speech signal (with no noise present) and
n2(t) is the variance of the noise signal (with no speech present). A typical applica-
tion of the SNR measurement would be to digitally mix a clean speech signal with
a noise signal to create a synthetic signal with a particular SNR. When running
experiments with noise estimation in noisy speech signals, for instance, it is the
general practice to create a synthetic noisy speech signal with a predefined noise
signal in order to be able to determine how well a particular algorithm works at
various SNR levels [YS02].
The difficulty, though, is that in these artificial experiments, the noisy speech
27

signal x(t) is defined as
x(t) = s(t) + n(t),
such that the clean speech signal s(t) and the noise signal n(t) are explicitly known.
In the case of recordings made in a real noise environment, a researcher has the
noisy speech signal x(t) and information about the noise signal n(t) during sections
of the recordings where no speech occurred. However, the clean speech signal s(t)
is not explicitly known. Computing the SNR of these noisy signals from (2.1) or
(2.2) directly is therefore impossible. There are two possible alternatives in this
case. The variance of x(t) can be defined as
(s(t) + n(t))2 = s2(t) + 2s(t)n(t) + n2(t)
= s2(t) + 2s(t)n(t) + n2(t),
which, if s(t) and n(t) are zero mean and independent, can be rewritten as
s2(t) = (s(t) + n(t))2 − n2(t), (2.3)
Therefore, since the two terms on the right-hand side of (2.3) can be explicitly
calculated, (2.3) provides an expression for the variance of the clean speech signal.
It is important to note, though, that (2.3) is dependent on the fact that s(t) and
n(t) are independent, and so this technique will not always be valid.
A second technique involves developing an estimate of the clean speech signal
through spectral subtraction (see, for instance, [Fan02] or [BK03]). If a sample
of the noise signal from sections of the recording where no speech is present can
be obtained, one can use spectral subtraction to develop an estimate of the clean
speech signal from which to calculate the SNR using (2.2). The drawback to this
method is that the speech signal used to calculate the SNR is only an estimate,
28

and as such the accuracy of the SNR measurement is limited by the accuracy of
the speech estimate. This method does not rely on the assumptions of the previous
technique, though, and so it can be used in any case where a sample of a stationary
noise signal with no speech present can be obtained.
2.4.2 Pitch Detection and Tracking
Another measure of the efficacy of the TERC sensor in the recordings is how well it
is able to detect the pitch of voiced segments of speech. The ability to track pitch
during speech is a very important facet of many speech processing techniques. One
particular instance that illustrates this nicely is one of the most difficult noise en-
vironments in speech processing, known as “cocktail party” noise [LM87]. One can
imagine being in a party where several conversations are occurring simultaneously
and attempting to focus in on only the desired conversation. The human ear is
naturally very good at this type of filtering, but designing a computer algorithm
to try to filter out “noise” and salvage the “speech” signal when the noise itself is
speech is quite a difficult problem. If an algorithm were able to follow the pitch of a
particular speaker, however, it would be easier to determine which speech segments
are noise and which ones make up the desired signal.
There have been a number of methods defined to try to extrapolate the pitch
of speech from a speech sample. Interested readers are referred to [Sch68] and
[SR79] for a sample of these techniques. Two particular techniques are compared in
[Mar82]. The first is known as the “cepstrum method,” in which a Fourier transform
of the logarithmic power spectrum identifies periodicity in the speech signal. The
second is known as “spectral comb correlation.” In this method, a signal is defined
29

such that its frequency-domain representation is a pulse train with harmonics at
f = kωc, for k = 1, 2, . . .. This “comb” signal is then correlated with the speech
spectrum for various values of ωc. The value of ωc for which the correlation is a
maximum (i.e. where the “teeth” of the comb waveform line up most closely with
the peaks of the speech waveform) is then the estimate of the fundamental frequency
of the speech.
One benefit to this method is that the range of frequencies at which humans
are able to produce speech, referring specifically to the range of the fundamental
frequency as opposed to the bandwidth of audible speech, is quite limited (refer to
Section 2.1.2). Therefore, the range of frequencies through which ωc must be swept,
depending on the desired precision, is manageably small.
30

CHAPTER 3
TERC SENSOR SYSTEM DESIGN
As described in Chapter 1, there are several interconnected areas of focus for this
research. The initial goal is to develop the necessary test apparatus and procedures
to be able to collect real-time audio data from the Tuned Electromagnetic Resonator
Collar (TERC) sensor under experimental conditions. Once the data is collected,
the goal then shifts to analyzing the data in order to develop a characterization
of the sensor’s performance. The ability to realize any of these goals, though, is
contingent upon the development of a system capable of acquiring a useful audio
signal from the TERC sensor. Before such a system can be understood, however,
one must first understand the underlying principles of the sensor’s operation.
3.1 Principles of Operation
As discussed in Section 2.1.3, a hollow tube of a particular shape will have several
natural resonant frequencies — frequencies at which acoustic waves passing through
the tube will be amplified. Changing the shape of the tube will alter the tube’s
resonances, and thus the sound produced at its end. The vocal tract is one complex
example of such a tube, where altering the shape of the tube (e.g. changing the
shape of the lips as shown in Figure 2.4) will affect the acoustic sound emanating
from the mouth. As a much simpler example, one can design a hollow cone with
a small hole at one end and a large hole at the other such that when people speak
or yell into the small end, an amplified version of their voice will emanate from the
large end due to the tube’s resonances.
31

In much the same way, one can design an electronic circuit with capacitive and
inductive elements such that the circuit will resonate at a particular frequency. As
with an acoustic resonance, any frequency content of signals near this resonant
frequency will be amplified. Changing the capacitance of one of the elements in the
circuit will shift the location and depth of this resonance. The TERC sensor was
designed such that its load acts as a capacitive element in such a circuit. Changing
the dielectric properties of its load will affect this capacitance and thus affect the
natural resonance of the sensor.
If one considers the human neck in a highly simplified manner, it can be modeled
as a cylinder of muscle when the vocal cords are fully closed. When the vocal cords
are opened, this model changes to include a smaller cylinder of air representing the
open glottis, as illustrated in Figure 3.1.
MuscleAir
(a.) (b.)
Figure 3.1: Simplified model of the neck with closed (a.) and open (b.) glottis.
This is a highly inaccurate model of the human neck, but is useful to demonstrate
the theory governing the TERC’s design. The change in the state of the glottis (i.e.
the opening of a tube of air) will alter the averaged dielectric properties of the
neck. With the neck as the sensor’s load, therefore, these changes to the dielectric
properties of the neck will cause shifts in the sensor’s resonance. As such, these
32

resonance shifts, illustrated in Figure 3.2, can be utilized as a proxy to measure the
state of the glottis.
-30
-29
-28
-27
-26
-25
40 41 42 43R
etur
n Lo
ss (
dB)
Frequency (MHz)
Resonance(open glottis)
Resonance(closed glottis)
Figure 3.2: Theoretical resonance shift due to glottal state changes.
From preliminary laboratory experiments with the sensor, a typical resonant
frequency is within the range of 35MHz to 60MHz, depending on the test subject.
The problem, then, is how to transduce these high-frequency resonance shifts into
a baseband electrical signal representing the glottal waveform. If the TERC sen-
sor is driven with a sinusoidal signal at a frequency close to the sensor’s resonant
frequency, shifts to the location and depth of the resonance will alter the level of
amplification of the drive signal. The resulting signal, then, will be a sinusoid at a
fixed frequency whose amplitude changes according to the state of the glottis. This
is, in effect, an Amplitude Modulated (AM) signal with a carrier frequency, fc, be-
tween 35MHz and 60MHz and an envelope, m(t), whose frequency is the frequency
at which the glottis is opening and closing. This resulting AM signal, s(t), can be
33

defined as:
s(t) = Ac [k + m(t)] cos (2πfct + φ) , (3.1)
where Ac is the amplitude of the carrier signal, k is a constant offset for the envelope,
and φ is a phase offset. Figure 3.3 illustrates the concept behind the production of
this AM signal.
Am
plitu
de C
hang
e
-30
-29
-28
-27
-26
-25
40 41 42 43
Ret
urn
Loss
(dB
)
Frequency (MHz)
Resonance(open glottis)
Resonance(closed glottis)
Drive frequency(constant)
(a.) (b.)
0 5010 20 30 40Time (ms)
0
Mag
nitu
de (
V)
m(t)
s(t)
Figure 3.3: The changes to the resonance caused by the glottal cycle (a) result in
an amplitude modulated voltage waveform (b).
3.2 TERC System Setup
Following an understanding of the theory behind the TERC sensor’s operation,
the next step was to develop a signal acquisition system that would be capable of
outputting the audio signal m(t) from (3.1) for subsequent recording. All of the
testing and sensor characterization described in the remainder of this research was
34

dependent on this first step of acquiring a meaningful audio signal from the TERC
sensor.
3.2.1 Network Analyzer Tests
The final TERC signal production system can be divided into two major compo-
nents: the drive circuitry to provide the AM signal s(t) defined in (3.1) and the
demodulation circuitry to obtain the envelope m(t) from this AM signal. The first
piece of the drive circuitry is an RF carrier signal with a constant amplitude of
-10dBm, produced with a Hewlett Packard 8647A signal generator. This value of
-10dBm was chosen to allow for a strong enough signal from the TERC sensor while
remaining well within the FCC safety regulations for radiation effects. A circulator
[Wen91] makes it possible to measure the reflected signal from the TERC sensor
(port 2) caused by the drive signal (port 1) with negligible interference between the
input and output (port 3).
Before attempting to design the demodulation circuitry for the TERC sensor,
it was important to test the existing components of the drive circuitry including
the sensor itself. Such a series of tests not only verified the operation of each
component, but also facilitated the development of more precise specifications for
the demodulation system. These tests were conducted on a Network Analyzer
capable of replicating the desired functionality of various portions of the drive and
demodulation systems. The first test was of the TERC sensor itself, with the
sensor attached directly to the Network Analyzer input port using an SMA cable.
The Network Analyzer provided the -10dBm drive signal, manually tuned to the
resonant frequency of the sensor with a human neck as its load. The Network
35

Analyzer measured the reflected signal from the TERC sensor, and displayed the
resulting baseband signal when operated in Continuous Wave mode (producing a
single drive frequency rather than a discrete sweep of frequencies). Figure 3.4 shows
the resulting baseband signal during a period of voiced speech production.
Figure 3.4: Baseband glottal signal from TERC sensor during voiced speech as seen
on Network Analyzer [Pel04].
The periodic signal seen in Figure 3.4 is the baseband signal m(t) defined in
(3.1). This plot serves two purposes. The first is to verify that the TERC sensor
itself functions as originally intended. A more in-depth description of this sensor
validation can be found in [Pel04]. Because the Network Analyzer can demodulate
the baseband glottal signal as shown in Figure 3.4, it is reasonable to expect that
a separate demodulation circuit can be feasibly designed. The Network Analyzer
signal also shows the amplitude of the AM signal s(t) and its envelope m(t), which
36

are important considerations when developing a demodulation system.
The modulation factor, or percentage of modulation for such an AM signal, is
defined as
MF =Amax − Amin
2Ac
×100, (3.2)
where
Amax = max Ac[k + m(t)]
Amin = min Ac[k + m(t)]
From the waveform in Figure 3.4, a reasonable value for Ac is -20dB, with
a variation of ± 0.3dB during voiced speech. Using (3.2), these values yield a
modulation factor of approximately MF = 1.75%, which is very small even under
controlled circumstances. This only serves to increase the difficulty of producing a
clear baseband signal from the AM signal, as described in the following section.
After verifying the operation of the TERC sensor on the Network Analyzer,
the next set of tests was to determine whether the circulator, described previously,
functioned as expected. There were two tests used to this end. When functioning
properly, the circulator should allow a signal from port 1 to pass, without attenu-
ation, to port 3 when port 2 is left as an open circuit. When port 2 is terminated
with a 50Ω terminator, on the other hand, the circulator should block the signal
from passing from port 1 to port 3, attenuating the signal to a significant degree.
Figure 3.5 shows the forward transmission of a signal through the circulator
over a frequency range of 1MHz to 60MHz when port 2 is open and terminated,
respectively. Within the range of the TERC sensor’s resonant frequency (35MHz
to 60MHz), the circulator operates as expected, allowing nearly all of the signal to
37

(a.) (b.)
Figure 3.5: Forward transmission on Network Analyzer with circulator port 2 open
(a.) and terminated (b.).
pass through with port 2 open and attenuating the signal by between 48dB and
60dB with port 2 terminated. Following the validation of the operation of the two
major components of the drive circuitry, the next task was to develop the actual
demodulation circuitry to be used during testing.
3.2.2 Demodulation System Design
As mentioned in the previous section, the AM signal from the TERC sensor that re-
quires demodulation has a modulation factor of less than 2%. This adds a high level
of difficulty to the process of designing a demodulation system. The simplest AM
demodulation circuit is a diode/capacitor envelope detector, as shown in Figure 3.6.
There are two major issues that prohibit the use of such a circuit in this system.
The first is the frequencies at which the TERC sensor operates. While an envelope
detector can be designed in theory to operate up to high frequencies, the practical
38

Vin(t) Vout(t)
Figure 3.6: Diode/capacitor envelope detector circuit.
limitations of very small capacitor values (in the range of 5pF) dictate that any stray
capacitance in the circuit would be very damaging to the circuit’s functionality. The
second issue is the small demodulation factor. Since the envelope detector works
by following the envelope of the AM signal, the circuit will not work properly when
the changes in the amplitude of the envelope are very small.
Another common demodulation circuit is a frequency mixer, which multiplies
two sinusoidal signals to down-mix an AM signal to baseband. A mixer circuit
is more appropriate than an envelope detector for the higher-frequency signals in
the system, and in fact several such circuits were developed that could successfully
demodulate an AM signal within the frequency range of the TERC sensor. However,
the low modulation factor is still an issue with a mixer circuit, and none of the
circuits designed were able to work properly for signals with such a small envelope.
After several semi-successful demodulation circuit designs, the decision was
made to incorporate a commercial demodulation hardware/software package known
as WinRadio into the system. Although the WinRadio package requires a computer
for its operation, it is able to demodulate AM signals with very low amplitudes (less
than -50dBm) and modulation factors down to 1%. The only major drawback to
the WinRadio PCI card is that it can only demodulate signals with a carrier fre-
quency of less than 30MHz. With this limitation in mind, the remainder of the
39

demodulation system could then be built around the WinRadio package and the
drive circuitry described in the previous section.
RFSignal
Generator
TERCSensor
BatteryPackCirculator1
2
3
3dBSplitter
50ΩTerm.
Mixer
Attenuators WinRadio R
PCI Card
OscilloscopeDigital
IFSignal
Generator
BN
C "
T"
RF In
IF Out
LO In
S
1
2
BasebandOutput
(Input)
Figure 3.7: Signal Acquisition Setup for the TERC Sensor.
Since the proper operation of the TERC sensor is reliant on keeping the drive
signal as close as possible to the sensor’s resonant frequency, it is necessary to be
able to monitor the signal at the output of the circulator to ensure that it is, in fact,
operating in the resonance. This is accomplished by splitting the signal and passing
one branch to a digital oscilloscope, matched to 50Ω with a terminator. Though
certainly a crude method of monitoring the signal, one can alter the frequency of
the carrier drive signal and watch the resulting changes to the amplitude of the
signal as it moves in and out of resonance.
The second branch is passed on to the demodulation portion of the TERC sys-
40

tem, the major component of which is the WinRadio package described previously.
The package is capable of demodulating various radio signals (AM, FM, DSB, etc.)
and passing the resulting baseband signals out to the computer’s sound card. How-
ever, since the device is only capable of demodulating RF signals up to 30MHz, an
intermediate down-mixing stage was required in the system to bring the 35MHz -
60MHz carrier down into WinRadio’s range.
An HP 8648D signal generator provides the constant amplitude (3dBm, as rec-
ommended for the Mini-Circuits ZX-05 mixer used for the IF down-mixing†) IF
carrier signal. Since the WinRadio package will be providing a second down-mixing
stage and its own filtering, no low-pass filtering is required at the IF down-mixing
stage. The final piece of the system is an attenuation stage prior to the WinRadio
PCI card input, intended to adjust the amplitude of the input signal to a more
appropriate level for the software. The full TERC sensor signal acquisition setup
can be seen in Figure 3.7.
†http://www.mini-circuits.com/ZX05-SERIES.pdf, last accessed 13 January 2004
41

CHAPTER 4
DATA ACQUISITION SYSTEM DESIGN AND TEST PROCEDURES
Once a system was developed to produce baseband signals from the TERC sen-
sor, the next challenge was to design an experimental setup and testing procedure
to record meaningful audio signals from the TERC sensor, from which subsequent
conclusions about its performance could be drawn. Before such a data acquisition
system could be designed, however, it was first necessary to develop an understand-
ing of how and why it would be used.
4.1 Context and Experimental Apparatus
One of the major goals of this research was to collect a large set of audio record-
ings from human test subjects wearing the TERC sensor, in order to be able to
characterize its performance in a laboratory environment. The usefulness of results
obtained using non-biological test fixtures or a Network Analyzer have strict limi-
tations. Ultimately, the sensor’s intended use is in a real-world environment with
human users, and the true test of its peformance is how it functions in such a setup.
The difficulty with using human test subjects, though, is their unpredictability. In
order to obtain a useful set of recordings leading to a structured corpus of data,
the experiments must be well-designed to control for as many variables as possible
under the circumstances.
The basic concept of the experiments was to test the TERC sensor in various
acoustic environments, with the hypothesis being that its performance would remain
consistent in all of the environments. In each environment, a human test subject
42

would read lists of words or sentences while wearing the TERC sensor to obtain
recordings of the sensor’s signal during speech. To control for the level of noise
during each recording session, the human subject was seated in a sound booth
along with several sensors and sound-production devices. The background noise
environments were produced through a pair of Alesis M1 ActiveTM biamplified
reference studio monitors, positioned behind the subject at between neck- and head-
height so as to put him or her in the center of the noise field. The dimensions of the
sound booth and the location of the subject during the tests are shown in Figure 4.1.
76.5"
71.75"
Doo
rW
indo
w
Subject
Speakers
Table
20" 20"
65.75"
20"
42"
30"
Figure 4.1: Interior layout of the sound booth during testing.
The analog signals from three sensors were digitized and recorded to develop the
corpus. The first, and most important to this research, was WPI’s TERC sensor,
described in Chapter 3. The TERC sensor was worn around the subject’s neck as
close to the glottal region as possible (roughly behind the Adam’s apple on a male
neck, as shown in Figure 4.2).
The second sensor was the Physiological Microphone (PMIC) described in Sec-
43

Figure 4.2: Physical location of the TERC sensor on a human subject’s neck.
tion 2.2.1. Though this sensor was not developed at WPI, it is one of several speech
sensors currently being studied in the DARPA/NAVSEA Advanced Speech Encod-
ing (ASE) program through which this thesis was sponsored. In order to avoid
interference with the TERC sensor, the PMIC was worn on the subject’s forehead
using a velcro strap during the recording sessions. In addition, although the PMIC
was provided with a built-in preamplification circuit, the final recordings were con-
ducted with this preamp circuit removed, as it tended to degrade or clip the signal
to an unacceptable level during preliminary tests.
The final sensor was a Optimus 33-3021 Unidirectional Microphone placed near
the subject’s mouth as a resident microphone, also visible in the lower right corner of
Figure 4.2. This microphone did not use any noise cancellation technology, and was
used to pick up the sounds in the booth as the subject would hear them, with the
exception that the subject’s head provides an inherant acoustic shadow in front of
the microphone. The purpose of the resident microphone was to provide a reference
signal to which the other two sensors could be compared and which could be used
as the noisy signal in subsequent signal processing applications.
44

Using the signals from all three sensors, a performance characterization of the
TERC sensor could then be developed following the completion of the testing. The
audio recordings could be analyzed to determine the TERC sensor’s signal-to-noise
ratio (SNR), its capabilities for pitch detection, and its overall performance in com-
parison to the existing PMIC and resident microphone signals.
One additional experimental apparatus was used during the tests for safety rea-
sons. The subjects wore a Sennheiser HME 100 passive noise noise cancellation
aviation headset during each test, which provides 24dB of passive noise attenuation
for hearing protection. The headset also has a boom microphone with noise can-
cellation technology, used in this setup to create a sidetone signal. In high-noise
environments, there is a phenomenon known as the Lombard effect (see, for in-
stance, [Jun93] or [CO96]) whereby a subject varies their speech volume to try to
compensate for higher background noise. This effect can be detrimental to speech
processing efforts, and so the purpose of using a sidetone signal is to allow the sub-
jects to hear their own voice at the level at which they are speaking to mitigate the
Lombard effect. This sidetone signal could also be patched outside the booth to the
researcher’s headphones to allow him to follow along with the subject’s speech.
4.2 Sound Field Generation
An appropriate characterization of the TERC’s operation as a non-acoustic sensor
required that it be tested in a number of acoustic environments. This entailed
the development of a sound field generation system, as well as the policies and
procedures that were involved with its use. All of the recordings were conducted
in five different noise environments, which were selected based on the nature of
45

the research. Since the sensor was being developed through a DARPA grant for
military applications, the noise environments were chosen to accurately reflect its
intended use. The first environment was a quiet environment, used as a baseline for
all other recordings. The speakers in the sound booth were completely turned off to
avoid modifying the sound floor through any speaker static that might be present.
The second environment (M2 High) was a recording made by Arcon Corporation
in an M2 Bradley Fighting Vehicle. The third environment (M2 Low) was created
digitally by attenuating the M2 High recording by 40dB (in reference to the dBc
weighting). The fourth environment (Black Hawk High) was a recording made in a
Sikorski UH-60 Black Hawk helicopter during flight, also recorded by Arcon Corp.
The final environment (Black Hawk Low) was a separate recording made in a Black
Hawk while it was not in flight, or “idling.” The second Black Hawk environment
was used because it was attenuated close to 40dB from the Black Hawk High signal.
For each of the environments, Table 4.1 shows the original sound pressure level
(SPL) readings made by Arcon Corp during the noise recordings in both dBa and
dBc weightings where applicable. Also included are the actual SPL readings made
in the sound booth prior to testing. There is a significant discrepancy between the
original and actual measurements for the M2 Low environment. The speakers used
during the testing were unable to accurately reproduce the 112dBa SPL originally
intended for the M2 High environment without clipping. As such, the SPL for the
M2 Low environment was lowered to maintain the original 40dB difference between
the two environments.
46

Table 4.1: Noise Environments and Sound Pressure Level ReadingsArcon WPI
EnvironmentSPL (dBa) SPL (dBc) SPL (dBa) SPL (dBc)
Quiet n/a n/a 22 n/aM2 Low 72 n/a 58 n/aM2 High 112 n/a 98.5 n/a
Black Hawk Low 67 72 67 74Black Hawk High 98 112 97 94
4.2.1 Sound Generation System
The background noise environments were produced on a desktop computer system,
and the output signal from the computer was passed via a USB connection to a
device known as the M-Audio Duo USB Audio Interface, which in this application
functioned as a digital to analog converter. In order to amplify the signals to the
correct levels before sending them to the speakers in the sound booth, the signals
were first passed through a Behringer Eurorack UB502 mixing board. Though the
mixing capabilities of the board were not utilized, it has sufficient preamplification
capabilities to be useful in this system. The final amplified signal was then passed
to the speakers in the sound booth during the testing. A block diagram for the full
noise production system can be seen in Figure 4.3.
4.3 Recording System Setup
Once the sensors were selected and the sound generation system developed, the final
system to be designed was the recording system. The data acquisition system de-
scribed in Chapter 3, along with the resident microphone and PMIC, provide analog
audio signals at their respective outputs. The goal, though, was to simultaneously
47

M-Audio Duo
USB In
Line OutLine Out1 2
USB Out
Main Out
Line In1
Line In2
Computer
Sound-
L R
UB502
Inside Booth
Outside Booth
Generating
LeftAlesis
M1 ActiveStudio
Monitor
AlesisM1 Active
StudioMonitor
Right
Figure 4.3: Environmental Noise Production System Setup.
record all three signals digitally for storage and subsequent signal processing ap-
plications. Preamplified versions of the analog signals from all three sensors were
digitized using the M-Audio Quattro USB Audio Interface, which can record up to
four separate 20-bit channels at a 48kHz sampling rate and patch them through a
USB cable into a PC. The actual recordings were made using the Adobe Audition
(formerly Cool Edit Pro) software due to its multi-track functionality. Although the
program typically only allows stereo (two channel) recordings for audio devices, the
M-Audio Quattro installs two drivers for its four input channels (one device driver
for inputs 1 and 2, and another for inputs 3 and 4). Within Adobe Audition, the
left and right channels of each of the two devices could be used to record a sepa-
rate signal, thus providing the functionality of a four-channel recording device with
software typically only capable of stereo recordings. Although using the full 20-bit
capabilities of the Quattro would have provided better resolution and gain control
in the input signals, compatibility issues between the Quattro hardware and Adobe
48

Audition software on a Windows platform necessitated the use of 16-bit recordings.
Difficulties with 32-bit PCM (.wav) recordings in some versions of MATLAB, which
would be used for much of the subsequent signal processing to the recorded signals,
only served to further validate the decision to use the Quattro with this limitation.
M-Audio Quattro
USB Out
Line In Line InLine InLine In1 2 3 4
US
B In
Main Out
Mic In1
Mic In2
Main Out
Mic In1
Mic In2
Main Out
Mic In1
Mic In2
WinRadio R
PCI CardSoundBlaster
ComputerRecording
Mic In1
Mic In2
Mic In Mic In3 4
L RLL RR
Main OutL R L R
Phones Out
PMIC
ResidentMicrophone
UB802 UB802
UB1202
MX602L L L
L L
Insi
de B
ooth
Out
side
Boo
th
Inside Booth
Outside B
ooth
SennheiserHeadphones
HeadphonesResearcher
Figure 4.4: Recording System Setup.
The actual preamplification of the signals was accomplished using Behringer
Eurorack UB802 and MX602 mixers, due to their mic inputs with 60dB input gain.
Only one device was used for each sensor, though each device has multiple inputs
with separate gain controls. In initial tests, approximately a -30dB L-R channel
crosstalk was measured on the devices. Though this would be negligible in most
normal audio applications, any significant crosstalk between two sensors’ channels
is unacceptable. If, for instance, there was any crosstalk at all between the resident
microphone and the TERC sensor, any results for the TERC sensor could be at
49

best skewed or at worst unusable.
4.4 Testing Procedures
Once all of the systems were designed and operational, the final task was to deter-
mine exactly which tests would be executed during the recording sessions and to
make any necessary final considerations regarding the use of human test subjects.
Involved in this task was the selection of the subjects and approval for their use in
the testing, the selection of the actual tests used during the recording sessions, and
the time allottment for each test. Finally, since it is important to be aware of both
the strengths and limitations of a test procedure before interpreting the results, a
few of these limitations are briefly presented in Section 4.4.4.
4.4.1 Human Subject Considerations
Due to the scope of the project, including deadline constraints, only a small number
of subjects could be included in the testing. Because there are significant differences
between male and female speech, the most noticable of which is the average pitch,
it was important to include at least one male and one female test subject. Such a
small data set makes it difficult to draw any strong conclusions about the results
for either gender, but since the TERC sensor is still in the prototyping phase it is
acceptable to create a data set where only generalized conclusions can be drawn.
Including subjects of both genders will provide a larger range of results than only
using male subjects.
Before any tests could be conducted with human test subjects, approval was first
50

obtained from the New England Institutional Review Board (NEIRB), an Associ-
ation for the Accreditation of Human Research Protection Programs (AAHRPP)
accredited independent organization in charge of approval for any human or animal
testing done at institutions in Massachussetts. The approval was contingent upon
strict guidelines to address any health hazards resulting from the testing. With the
TERC sensor, there are only two relevant health concerns. The first is the radiation
effects into the subjects’ necks from the sensor, which are well below the FCC lim-
its for the range of frequencies used during testing. The second is the noise levels
during testing, since the subjects would be exposed to high-noise environments for
extended periods of time. To obtain approval, the Sound Pressure Levels (SPL) of
these noise environments and the duration of the exposure had to comply with the
standards set forth by the Occupational Safety & Health Administration (OSHA).
The recordings were designed to be run in two sessions for each human sub-
ject. During the first two-hour session the subject was acquainted with the test
procedure and the laboratory setup, given a chance to read and sign an informed
consent document, and given an initial hearing test. The purpose of the hearing
test, in conjunction with a second test given at the conclusion of all of the testing
for each subject, was to identify any significant hearing loss due to the tests, in
conjunction with OSHA standards. The actual recordings were conducted during
the second session, broken up into five one-hour sections corresponding to the five
noise environments defined in Section 4.2. Each of the one-hour sections allowed
for a maximum of twenty-minutes of exposure time to each noise environment, with
the remaining time allotted for system recalibrations and a break for the subject.
The maximum exposure time of one hour and twenty minutes (twenty minutes for
51

each noise environment, excluding the quiet environment) accounted for less than
2% of OSHA’s daily recommended noise exposure. As such, no significant hearing
loss was realistically expected due to the noise exposure in the tests.
4.4.2 Types of Tests Performed
As described in Section 2.3, there are a number of intelligibility tests to select from
when designing the experimental procedures. The intention of these recordings was
to provide as much relevant data as possible within the given testing constraints. In
this instance, the strictest constraint was the time allotted for each recording session,
which put limitations the number of intelligibility tests that could be performed.
It is important at this juncture to recall that although typical intelligibility tests
involve two sessions (the “talker” and “listener” portions of the test), this research
was only concerned with the talker portion of the tests to develop a well-structured
corpus of data for the subsequent signal processing applications.
Word Lists
The hypothesis that the TERC sensor would inherently measure very little supra-
glottal information suggested the validity of including sustained vowel lists. The
primary sound produced during each word of the vowel list is relatively constant,
insomuch as the talker is able to produce a vowel sound without variation, and it
is continuously voiced speech. While the varying phonation and pitch of word lists
and sentence lists may provide valuable insight into the functionality of the sensor,
the vowel lists should allow simpler characterization of the sensor under a more
controlled environment.
52

As described in Section 2.3.1, the Modified Rhyme Test and the Diagnostic
Rhyme Test are similar in many aspects, and it would be redundant to include
both tests in the recording sessions. The time constraints mentioned previously
necessitate the selection of one of the two tests over the other. The major advantage
of the MRT is that its word sets are significantly larger than those of the DRT (six
words per set as opposed to two). The small set size of the DRT dictates that
a researcher be aware of the effect of chance in the results of the DRT, since a
listener could correctly identify which word was spoken 50% of the time without
even listening to the recordings. The major advantage of the DRT is that it is able
to provide a great deal of intelligibility information easily. Since the list is broken
up into six sections (voicing, nasality, etc. as described in Section 2.3.1), each of
which includes the same number of occurances of each vowel sound, any number
of intelligibility scores (overall, nasality vs. voicing, one vowel sound vs. another,
etc.) can be derived with ease. Since the intent of the recordings is to obtain the
most amount of information possible about the TERC sensor, the reduced “chance
factor” of the MRT is outweighed by the increased interpretability of the DRT.
The fact that both the MRT and DRT are closed-response set tests means that
regardless of which test was used, a researcher would still need to be aware of the
“chance factor” in the results. This is acceptable so long as the researcher is aware
of it, but it also warrants the inclusion of an open-response set test along with the
DRT. The PB-50 phonetically balanced word lists described in Section 2.3.1 are
acceptable for this purpose. Two of the concerns with tests of this nature are that
they be long enough to produce useful results (a longer data set results in improved
statistical significance) and that the same lists are not repeated between different
53

talkers and environments. With fifty words per list and twenty lists, the PB-50
lists are adequately long to provide useful results and numerous enough to avoid
repetition. Since the twenty lists were designed to be phonetically balanced and
equally difficult, any of the full lists can be chosen at random for each talker and
environment without affecting the results of the test. Although an open-response
CVC test would provide very limited insight for intelligibility if the sensor cannot
pick up supra-glottal information, it would be foolhardy to exclude the test solely
based on this a priori assumption.
Sentence Lists
Finally, it is important to include a Sentence List test for two major reasons. First,
all of the other tests only allow testing for the intelligibility of individual words
or segments of words. A sentence test would allow for testing the intelligibility of
full phrases rather than individual words or phonemes, which the TERC sensor will
likely be unable to detect. The second reason for inclusion of a sentence test is
that even if the TERC sensor is unable to provide intelligibility information for full
sentences or words, people naturally tend to include different intonation, pitch, and
emphasis while speaking full sentences. Regardless of the issue of intelligibility, a
sentence test would therefore be able to provide a great deal of information about
the TERC sensor’s ability to detect pitch changes or other characteristics of speech.
This fact is especially true in quiet environments, where the results for the TERC
sensor can be directly compared to the results for the resident microphone signal.
The question, then, is which particular sentence test to use.
The major drawback to the Harvard Psychoacoustic Sentences is that both the
54

content and structure of the sentences are predictable. A listener who can under-
stand the majority of a particular sentence might be able to fill in the missing words
due to context. In the specific case of the TERC sensor, the hypothesis is that it
is unlikely that a listener would be able to correctly identify individual words, so it
could be interesting to determine whether the sensor provides adequate information
to identify words in context. In this respect, the major advantage of the Haskins
Sentence tests could, in fact, be disadvantageous for the specific case of the TERC
sensor. One additional advantage of selecting the Harvard Sentence Lists over the
Haskins Sentence Lists is that the resulting data would more closely match the pi-
lot corpus previously developed by Arcon Corporation. Although this factor is less
important than those previously mentioned, continuity between the original corpus
and that developed by this research certainly warrants consideration.
The fact that the Harvard Psychoacoustic Sentences are relatively well-known
in the speech processing community can prove problematic. If listeners are familiar
enough with the sentences that they can infer which sentence is being read without
really understanding the words being spoken, it is possible that the results can
become inaccurate. This is typically only the case, however, when the listener
encounters the same sentences multiple times during a listening session. In the case
of the TERC recording sessions, the inclusion of a limited number of talkers ensures
that none of the sentences are repeated across talkers or environments, effectively
invalidating this concern.
55

4.4.3 Recording Time
Once the final decisions were made on the intelligibility tests and the noise environ-
ments, it was necessary to determine how much time to allot to each specific test.
Each test included a five second pause at the beginning and end of each recording,
to both allow for editing of the raw recordings and to provide a sense of consistancy.
After the initial five second pause, the speaker identified himself or herself by read-
ing an introductory statement including his or her subject number and the specific
intelligibility test (e.g. “This is Subject M01 reading Vowel Word List #1,” etc.),
followed by an additional five second pause. Each vowel word list included fourteen
words, sustained for approximately one to two seconds each. Allowing for a total
of four seconds for each word, the recording time for the sustained vowel word lists
is reflected in Table 4.2.
Table 4.2: Recording Time for the Sustained Vowel ListsRecording Time
Test Segment(MM:SS)
Initial Pause 00:05Introductory Phrase 00:05
Pause 00:05Word List 00:56
Final Pause 00:05
Total Recording Time 01:16
Each Harvard Sentence List contained ten sentences, and two lists were read for
each noise environment for a total of twenty sentences. Both lists were recorded
individually, with the initial and final pauses and introductory statements included
for both. Allowing approximately four seconds for each sentence, the recording time
for the Harvard Sentence Lists is reflected in Table 4.3.
56
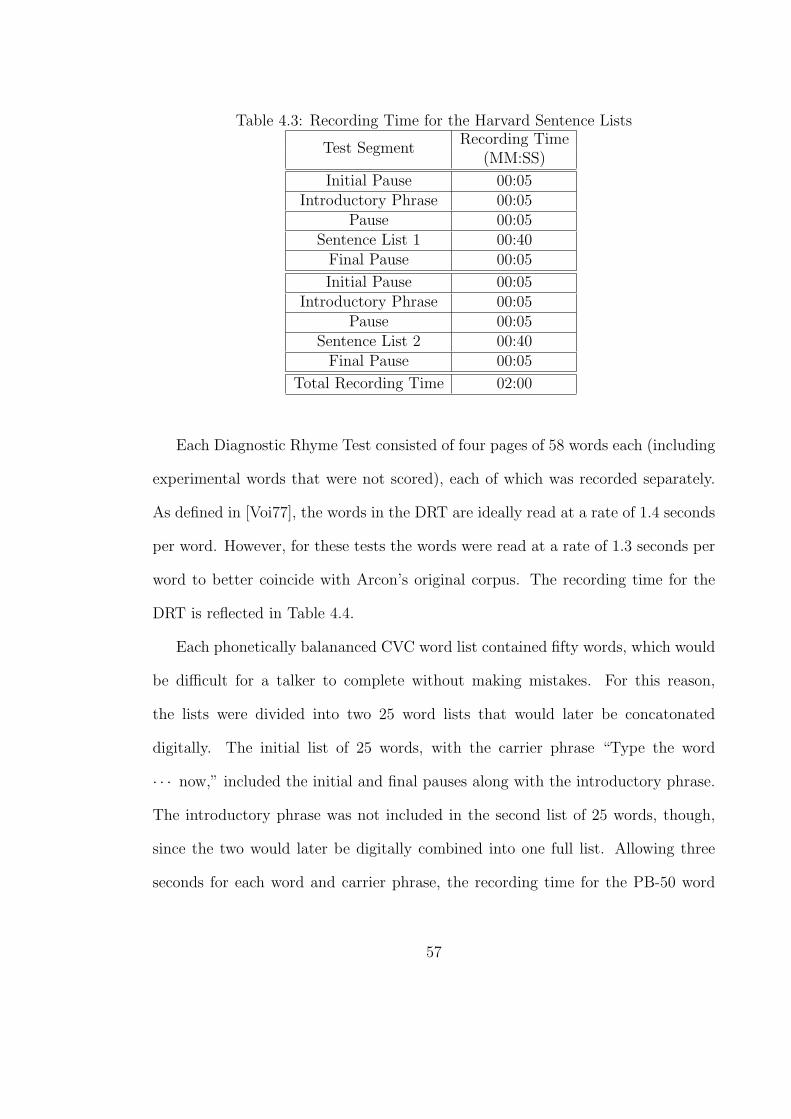
Table 4.3: Recording Time for the Harvard Sentence ListsRecording Time
Test Segment(MM:SS)
Initial Pause 00:05Introductory Phrase 00:05
Pause 00:05Sentence List 1 00:40
Final Pause 00:05
Initial Pause 00:05Introductory Phrase 00:05
Pause 00:05Sentence List 2 00:40
Final Pause 00:05
Total Recording Time 02:00
Each Diagnostic Rhyme Test consisted of four pages of 58 words each (including
experimental words that were not scored), each of which was recorded separately.
As defined in [Voi77], the words in the DRT are ideally read at a rate of 1.4 seconds
per word. However, for these tests the words were read at a rate of 1.3 seconds per
word to better coincide with Arcon’s original corpus. The recording time for the
DRT is reflected in Table 4.4.
Each phonetically balananced CVC word list contained fifty words, which would
be difficult for a talker to complete without making mistakes. For this reason,
the lists were divided into two 25 word lists that would later be concatonated
digitally. The initial list of 25 words, with the carrier phrase “Type the word
· · · now,” included the initial and final pauses along with the introductory phrase.
The introductory phrase was not included in the second list of 25 words, though,
since the two would later be digitally combined into one full list. Allowing three
seconds for each word and carrier phrase, the recording time for the PB-50 word
57

Table 4.4: Recording Time for the Diagnostic Rhyme TestsRecording Time
Test Segment(MM:SS)
Initial Pause 00:05Introductory Phrase 00:05
Pause 00:05DRT Page 1 01:15.4Final Pause 00:05
Initial Pause 00:05Introductory Phrase 00:05
Pause 00:05DRT Page 2 01:15.4Final Pause 00:05
Initial Pause 00:05Introductory Phrase 00:05
Pause 00:05DRT Page 3 01:15.4Final Pause 00:05
Initial Pause 00:05Introductory Phrase 00:05
Pause 00:05DRT Page 4 01:15.4Final Pause 00:05
Total Recording Time 06:21.6
lists is reflected in Table 4.5.
The cumulative recording time for each noise environment, therefore, is reflected
in Table 4.6. This leaves almost seven and a half minutes of time for any necessary
equipment or sound-level tests while the noise environment is active and, more
importantly, for any retakes necessary due to the inevitable subject and researcher
mistakes that will occur during the recording sessions. This buffer time is a necessity
since the tests are constrained by the absolute maximum of twenty minutes per day
for each noise environment in accordance with the OSHA standards set forth in the
58

Table 4.5: Recording Time for the PB-50 Word ListsRecording Time
Test Segment(MM:SS)
Initial Pause 00:05Introductory Phrase 00:05
Pause 00:05PB-50 1st Half 01:15
Final Pause 00:05
Initial Pause 00:05PB-50 2nd Half 01:15
Final Pause 00:05
Total Recording Time 03:00
human testing approval.
Table 4.6: Total Recording Time for One Noise EnvironmentIntelligibility Recording Time
Test (MM:SS)
Vowel Word List 01:16Harvard Sentence List 02:00Diagnostic Rhyme Test 06:21.6
PB-50 Word List 03:00
Cumulative Recording Time 12:37.6
4.4.4 Limitations of Testing
The TERC sensor used for the testing is still in the prototyping phase of develop-
ment, and as such there are still a number of inherant limitations, some of which
directly impact the results of the testing. The most relevant of these is that the
sensor in its current form does not account for shifts in the resonant frequency, re-
quires tuning from subject to subject to be properly matched, and cannot be worn
in its ideal location on the neck due to comfort issues. Although it is important
59

for the reader to be aware of these limitations when interpreting the results of the
testing, they should not be viewed as “problems” with the sensor or its system, but
rather as future research opportunities to continuously improve its design.
Resonance Tracking
In order for the sensor to function properly, it is necessary that it be driven with
a signal at or very close to its resonant frequency. During a recording session, if
the subject’s resonance moves significantly away from the frequency at which the
system is driving the sensor, the glottal waveform signal at the output of the system
will be, at best, degraded.
Am
plitu
de C
hang
e
-30
-29
-28
-27
-26
-25
40 41 42 43
Am
plitu
de C
hang
e
-30
-29
-28
-27
-26
-25
40 41 42 43
Mag
nitu
de (
dB)
Mag
nitu
de (
dB)
Frequency (MHz) Frequency (MHz)
Resonance(open glottis)
Resonance(closed glottis)
Drive frequency(constant)
(a.) (b.)
Figure 4.5: Concept behind using an AM system (a) and the effect of resonance
shifts on the system (b).
This signal degradation is illustrated in Figure 4.5. During a testing session,
consistancy dictates that the system cannot be tuned or modified while the recording
60

is in progress. If the subject’s resonance moves to any significant degree during the
recording, the researcher must either accept the resulting signal with its inferior
quality, or repeat the recording until it becomes acceptable. Since the majority
of the tests utilized are relatively short (around a minute and a half or less), this
limitation can be dealt with. However, a preferable and more permanent solution
to this issue would be a resonance-tracking circuit. Such a circuit would eliminate
the changes to the output signal quality resulting from large resonance shifts during
testing.
Matching
The TERC sensor was designed with a matching network with variable components,
so that it could be matched well to a 50Ω transmission line regardless of the subject
wearing it. Matching the resonator’s impedance to the rest of the circuitry in the
system yields a much deeper resonance, and in return, a much more well-defined
output signal. Once the sensor is correctly matched for a particular subject, it
tended to remain relatively well-matched throughout a recording session. However,
the sensor must be tuned prior to every session to ensure that it is properly matched
to the particular subject, and if it shifted significantly during a recording session it
was likely that it would become unmatched.
If the sensor were to be used in a real-life environment, it would be necessary to
include some sort of automatic matching circuit similar to the automatic resonance-
tracking circuitry described in Section 4.4.4. Like any piece of electronic equipment,
it is acceptable for the sensor to require tuning or calibration on occasion. However,
for any commercial or extended-use applications, it would be useful for the sensor
61

to be universal across any of its potential users.
Sensor Placement
Finally, there is a physical issue with the placement of the TERC sensor during
testing. As described in Section 2.1.1, the vocal folds are located behind the thyroid
cartilage, better known as the “Adam’s apple.” The ideal placement of the sensor,
therefore, would be directly over the thyroid cartilage in order to pick up as much
glottal information as possible. This is not a significant issue with a female test
subject, as the thyroid cartilage is not well pronounced on the exterior of the neck
in most females. For a male subject, however, the circuitry on the TERC sensor,
when worn directly over the Adam’s apple, puts a significant amount of pressure on
this sensitive location and can be uncomfortable to wear. Redesigning the sensor
on flex circuitry could provide an easy solution to this limitation.
62

CHAPTER 5
RESULTS AND CONCLUSIONS
Following the development of the test equipment and the execution of the experi-
ments, it was then possible to draw final conclusions about the performance of the
TERC sensor from the results of the recordings. Before discussing these conclusions,
however, it is important to first present the results of the experimentation.
5.1 Results
The recordings from the experimental procedure described in Chapter 4 provided
numerous results about the performance of the TERC sensor. Though the results for
specific signal processing applications are both relevant and important, preliminary
conclusions should first be drawn about the objective and subject performance of
the sensor in general.
5.1.1 General Performance Results
Before delving into the objective results from the experiments, it is important to
first discuss some of the more subjective results first, as an overview of the TERC
sensor’s performance. One of the objectives of these tests was to prove or disprove
that the TERC sensor could accomplish its intended function with human test
subjects — namely, that it could pick up some portion of the speech signal. The
overwhelming answer to this question is that the sensor did function properly in
the test environments. One demonstration of this is a comparison between the
time-domain plots for the resident microphone and the TERC sensor in the quiet
63

environment. The segments of speech for both sensors were taken during the same
period of sustained vowel production, although the signals were manually aligned
in MATLAB to demonstrate the similarity in their periods. Figure 5.1 effectively
illustrates that the TERC sensor picks up a signal related to the speech signal during
periods of voiced speech, as was originally intended.
0 0.005 0.01 0.015 0.02 0.025 0.03−2
−1.5
−1
−0.5
0
0.5
1
1.5
2
Time (s)
Nor
mal
ized
Sig
nal
Microphone SignalTERC Signal
Figure 5.1: Time domain comparison between microphone and TERC signals.
It is also interesting to note that while the amplitudes of both signals were
normalized to augment the visual comparison of Figure 5.1, the general shape of
the TERC signal is not extremely different from the volume velocity waveform in
Figure 2.2. This would seem to indicate that the actual signal from the TERC
sensor is related to the expected glottal waveform signal.
The TERC sensor seems to only pick up voiced speech, with little or no artic-
ulation, in accordance with the initial hypotheses regarding its peformance. Any
higher frequency components of the TERC signal, if they exist, are well below the
noise floor of the system. In some of the recordings, however, there appears to be
64

a low frequency component to the TERC waveform prior to the speech segment,
as seen in Figure 5.2. This is likely due to low-frequency articulatory movements
caused by an intake of breath prior to speech, or an opening of the throat prior to
vocalization. However, since it does not occur in all of the recordings, it would be
difficult to exploit this feature of the waveform consistently for any signal processing
applications.
0 0.5 1 1.5 2
−0.25
−0.2
−0.15
−0.1
−0.05
0
0.05
0.1
0.15
0.2
0.25
Time (s)
TE
RC
Sig
nal
Start of Voiced Speech
Figure 5.2: Low frequency signal content prior to voiced speech.
There was an audible delay between the recorded resident microphone and PMIC
signals and the TERC signal. This delay is most easily seen in Figure 5.3, and is
about 240ms between the start of voiced speech for the TERC and microphone
signals.
Since the delay was most likely due to the longer signal path of the TERC signal
(refer to Chapter 3 for a discussion of the TERC demodulation system), a test was
run to determine the delay through the major component of this longer path, the
WinRadio package. A test signal was split to a computer sound card and to the
65

21.15 21.2 21.25 21.3 21.35 21.4 21.45 21.5 21.55 21.6
Time (s)
Nor
mal
ized
Sig
nals
(of
fset
)
Microphone SignalTERC Signal
Start of Voiced Speech (microphone) Start of Voiced Speech (TERC)
Figure 5.3: Delay between the TERC and microphone signals.
WinRadio PCI card, and the output of the WinRadio was passed to the computer
as well, simultaneously recording both signals. The output was then shut off, and
the delay between shut off times for both signals recorded. It is important to note
that this was just a quick test with poor signal quality, but nevertheless the delay
can easily be seen in Figure 5.4. From this plot, it can be seen that the majority of
the delay, approximately 170ms, occurs in the WinRadio package, as expected.
Subjectively, even in the quiet environments there was a distinct background
noise in the sensor signal that seemed to be fairly stationary. This was originally
thought to be due to the electronic components of the system. One surprising aspect
of the noise can be seen in the spectrogram in Figure 5.5, where there are apparent
nulls at periodic frequency bands. Upon analysis, these nulls were present in every
TERC sensor recording, at the same frequency bands in each recording.
After expensive experimentation, this was discovered to be an issue with a par-
66

0 0.025 0.05 0.075 0.1 0.125 0.15 0.175 0.2 0.225 0.25−1
−0.8
−0.6
−0.4
−0.2
0
0.2
0.4
0.6
0.8
1
Time (s)
Nor
mal
ized
Sig
nal M
agni
tude
WinRadio SignalReference Signal
Measured Delay: 171 ms
Figure 5.4: Delay through the WinRadio package after input signal turned off.
Time (sec)
Fre
quen
cy (
Hz)
0 10 20 30 400
200
400
600
800
1000
−100
−50
0
50
Figure 5.5: Nulls in background noise in spectrograms of TERC sensor.
67

ticular system component rather than with the TERC sensor. Although the issue
was not discovered until after the recordings were made, it was preferable that the
problem be one that is easily solved rather than one requiring a modification of
the sensor itself. The WinRadio package utilizes the computer’s sound card for a
portion of its downmixing stage. The SoundBlaster sound card in that particular
computer has an audio setting in one of its menus called “spatial,” which adds an
echoic sound to its output.
Figures 5.6 and 5.7 are spectrograms of a linear frequency sweep through the
WinRadio with the “spatial” setting turned on and off, respectively. The same nulls
from Figure 5.5 are present in Figure 5.6, but do not appear in Figure 5.7 where
the “spatial” setting was turned off.
−100
−50
0
50
Time (sec)
Fre
quen
cy (
Hz)
0 2 4 6 8 10 120
500
1000
1500
2000
2500
3000
Figure 5.6: Spectrogram of linear frequency sweep with “spatial” setting on.
The effect of this setting can also be seen in a Power Spectral Density (PSD) plot
of the two frequency-sweep signals from Figures 5.8 and 5.9. Figures 5.8 and 5.9
show these PSD plots with the “spatial” setting turned on and off, respectively. The
68

−100
−50
0
50
Time (sec)
Fre
quen
cy (
Hz)
0 2 4 6 8 10 120
500
1000
1500
2000
2500
3000
Figure 5.7: Spectrogram of linear frequency sweep with “spatial” setting off.
dips in the PSD in Figure 5.8 at the same locations as the nulls from the spectrogram
in Figure 5.5 do not appear in the PSD in Figure 5.9 where the “spatial” setting
was turned off.
In Figure 5.9, one can see a drop-off in the PSD of the TERC sensor at 7.5kHz.
This cutoff frequency is easily explained when considering the operation of the Win-
Radio device. One of the settings in the WinRadio software is the IF bandwidth,
since the WinRadio performs an initial IF downmix before the final baseband down-
mix. Changing the IF bandwidth has an audible effect on the final TERC signal, as
certain parts of the noise are eliminated by lowering the bandwidth. This filtering
could be just as easily accomplished in the post-processing stage, however, and the
unnecessary loss of information when developing the raw data set is unacceptable.
Though the initial hypothesis was that the TERC sensor would be unable to detect
fricatives and other unvoiced speech, which occur at much higher frequencies than
voiced speech, filtering out these high frequencies for the raw data set based on
69

0 2000 4000 6000 8000 10000−60
−50
−40
−30
−20
−10
0
10
Frequency
Pow
er S
pect
rum
Mag
nitu
de (
dB)
Figure 5.8: PSD of linear frequency sweep with “spatial” setting on.
0 2000 4000 6000 8000 10000−60
−50
−40
−30
−20
−10
0
10
Frequency
Pow
er S
pect
rum
Mag
nitu
de (
dB)
Figure 5.9: PSD of linear frequency sweep with “spatial” setting off.
70

these assumptions would be inappropriate. The IF bandwidth on the WinRadio,
therfore, was set to its maximum value of 15kHz, which explains the sharp cutoff
in the spectrogram at 7.5kHz.
5.1.2 SNR Results
The initial hypothesis about the TERC sensor was that it would be relatively im-
pervious to the effects of environmental noise. An objective way to measure its
performance in this regard is by taking a signal-to-noise ratio (SNR) measurement
in each of the five noise environments. If the hypothesis holds, there should be rela-
tively little change across the different noise environments. As described in Section
2.4, SNR calculations are difficult to make when one only has the noisy speech sig-
nal. Since we can clearly define segments of the recordings containing noise but no
speech from the spectrograms and microphone recordings, both of the techniques
defined in Section 2.4 could be employed.
The first technique involved the assumption that the noise and the speech were
independent, which seemed to make sense after an initial consideration. The first
set of SNR calculations seemed to produce reasonable results, with the SNR de-
creasing in the higher noise environments and the values being within a believable
range. However, several of the calculations provided a negative variance for the
speech signal, which is certainly not possible. The obvious conclusion was that this
technique for calculating SNR was not valid for this particular system. A some-
what more unexpected corollary to this is that the speech and noise signals from
the TERC sensor are correlated to some degree. If, in fact, the sensor is picking
up some background noise through the body somehow, it would make sense that
71

changing the properties of the neck during speech would have an effect on the noise
sensed in this manner.
In order to employ the second technique, the signals from each sensor for the
vowel word list test in each environment were first de-noised using spectral subtrac-
tion (“noise reduction” in Adobe Audition). The resulting signal, with no additional
signal processing or amplification, was used as the estimate of the clean speech sig-
nal. Using the inverse technique in Adobe Audition (“just noise” rather than “just
signal” in the noise reduction properties) yielded a signal reflecting the estimate of
the noise signal. This was done to ensure that the same segment of speech was used
for both estimates. The variances of these two signals during a period of voiced
speech during a sustained vowel list were used to calculate the SNR for each sensor
using (2.2).
Because of the small number of subjects and data points, it is difficult to draw
statistically significant results from the SNR measurements. In order to offset this
somewhat, the definition of SNR from (2.2) was modified slightly to include an
average SNR value over several samples:
(SNRAV G)dB = 10·log10
avg
(s21(t) + s2
2(t) + · · ·)
avg(n2
1(t) + n22(t) + · · ·
) (5.1)
Five segments from each environment during the sustained vowel lists were used
in (5.1) to calculate SNR values at each SPL level for all three sensors, as seen in
Figure 5.10.
Figure 5.10 shows the results from all three sensors for the male subject. There
are two important conclusions that can be drawn from these results. The first is that
the SNR values for the resident microphone signal seem to be very realistic values,
72

20 40 60 80 100−40
−30
−20
−10
0
10
20
30
SPL of Background Noise (dBa)
SN
R (
dB)
TERC SensorResident MicrophonePMIC Sensor
Figure 5.10: SNR versus SPL measurements for three sensors.
with a sharp descent as the SPL of the background noise increases. There is also
approximately a 30 - 40dB drop from the two low-noise environments (M2 Low and
Black Hawk Low) to the two high-noise environments (M2 High and Black Hawk
High), which coincides with the 30- 40dB attenuation between the two recorded
noise signals (refer to Section 4.2). The PMIC SNR values appear to decrease more
slowly than the resident microphone values. An odd occurrence, though, is that
the SNR values for the PMIC are consistent lower than those of the resident mi-
crophone. This is not completely unexpected, though, since the PMIC, when worn
on the forehead as opposed to the neck, eliminates certain portions of the speech
spectrum, which would significantly lower the SNR measurements. In addition, the
resident microphone was placed close enough to the subject’s head, which provided
an acoustic shadow for the background noise, that higher SNR measurements would
make sense.
The most interesting results are those for the TERC sensor. It is important
73

to first mention again the difficulty of drawing statistically significant conclusions
about the SNR measurements with such a small data set. So while observations
are still valid, they must be viewed with the understanding that they cannot be
considered absolutely conclusive. It is also difficult to draw any conclusions from
the SNR measurements due to the lack of consistancy in the results. As described
in Section 4.4.4, the necessity to retune and recalibrate the TERC sensor prior to
each recording session precludes any true consistancy in the results.
As a general observation from Figure 5.10, however, it appears that there may
be a decline in the SNR values for the TERC sensor as the sound pressure levels
increase, a direct contradiction to the original hypothesis that it would be impervi-
ous to acoustic noise. At the very least, though, the trend line for the TERC sensor
across the SPL values is much shallower than for the other two sensors, which seems
to indicate that it is much less sensitive to background noise than the microphone
and PMIC.
The SNR values for the TERC sensor were generally lower than that of the other
two sensors. While this is to be expected, given the inherent system noise described
previously, this result is also somewhat misleading. As an arbitrary choice, the
SNR measurements for the TERC sensor were done without cleaning the signals at
all. The 15kHz IF bandwidth on the WinRadio package could be lowered without
significantly affecting the TERC speech signal, or simple filtering techniques used to
eliminate some of the system noise. These techniques would all legitimately improve
the general SNR measurements of the TERC sensor, but the choice was made to use
the raw recordings as the baseline. In other words, the values shown in Figure 5.10
can be considered a worst-case-scenario for the TERC sensor.
74

5.1.3 Pitch Detection
Based on the assumption that the TERC sensor is only capable of detecting voiced
speech, one signal processing application for which it should be well-suited is pitch
detection. One way to make an initial conclusion about whether this is possible with
the actual results is to look at the output of the sensor in the frequency domain.
If the fundamental frequency and subsequent harmonics are visible in the Fourier
transform and the spectrogram, this would be an excellent indication that a pitch-
detection scheme would work on the TERC signal. A comparison of the PSD of
the microphone and TERC signals during voiced speech in the quiet environment
is shown in Figure 5.11.
0 100 200 300 400 500 600 700−60
−50
−40
−30
−20
−10
Frequency
Pow
er S
pect
rum
Mag
nitu
de (
dB)
Microphone PSDTERC PSD
Figure 5.11: Comparison of PSD for microphone and TERC sensors.
The first two harmonics of the signal, at approximately 200Hz and 400Hz, are
visible in the PSD plots for both sensors, and in fact the fundamental frequency
(first harmonic) of both signals appear identical. This is a good indication that the
pitch of the speech signal is present in the TERC signal. These signals were from
75

the female test subject during a sustained vowel list, and so a pitch of 200Hz is a
very reasonable value.
Another method of visualizing the pitch components of the TERC signal is by
using a spectrogram to see the frequency content over time. Figures 5.12, 5.13,
and 5.14 are spectrograms of the vowel word lists, for the male subject in this case,
in the Quiet, Black Hawk High, and M2 High noise environments.
Time (sec)
Fre
quen
cy (
Hz)
0 10 20 30 400
200
400
600
800
1000
−100
−50
0
50
Figure 5.12: Spectrogram of male vowel word list in quiet environment.
In each of the three noise environments, one can clearly see the fourteen vowels
spoken at regular intervals. For each vowel, the first two harmonics are visible in
all three noise environments. The harmonics are more difficult to distinguish in the
M2 High environment, since the background noise is more intense, but they are
still visually apparent. In the Black Hawk High environment in particular, several
harmonics in addition to the first two are apparent. In each case, any change
in the location of the first harmonic over time (i.e. pitch changes) is reflected
in each of the visible harmonics as well. The reason for the improved signal in
76

Time (sec)
Fre
quen
cy (
Hz)
0 10 20 30 400
100
200
300
400
500
600
700
800
900
1000
−100
−50
0
50
Figure 5.13: Spectrogram of male vowel word list in Black Hawk High environment.
Time (sec)
Fre
quen
cy (
Hz)
0 10 20 30 400
200
400
600
800
1000
−100
−50
0
50
Figure 5.14: Spectrogram of male vowel word list in M2 High environment.
77

the Black Hawk High environment is very likely one of two possibilities. Either the
sensor placement and tightness was exceptionally good for that particular recording,
the subject was speaking significantly more loudly during the recording, or there
was some combination of the two. Though more consistent results would certainly
be preferable to make any final conclusions, even the skewed results are useful in
showing what the sensor is ultimately capable of in terms of pitch detection when
under optimum conditions.
There are two additional visual indications that the TERC sensor signal can be
used successfully with pitch detection algorithms. This is the location of the funda-
mental frequency in the spectrograms. In each case, the fundamental frequency for
the male subject falls within the range of around 110Hz and 150Hz, which are right
in the average range for a male. The second indication is that for each fundamental
frequency, the second harmonic occurs at twice the frequency of the fundamental,
which is an excellent indication that these are indeed harmonics representing the
pitch of the signal.
One of the problems with the signal, as apparent in the spectrograms, is that
there is a fairly consistent 120Hz noise, with resulting harmonics. A simple filter in
post-processing could eliminate this periodic noise, but this would cause additional
problems. 120Hz is a perfectly reasonable value for male speech, and filtering out
this component of the signal would likely destroy all or part of certain male’s speech
in the sensor signal. However, with the 120Hz noise and its harmonics still present
in the signal, it is completely possible that a pitch detector would identify 120Hz
as the pitch of the speech when in fact it may be higher or lower. Since this 120Hz
noise is almost certainly due to the electronic components of the system, any future
78

evolutions of the sensor should be designed such that this noise is no longer present
in the final signal.
Due to time constraints, it was not possible to attempt the “Spectral Comb
Correlation” technique described in Section 2.4.2, but from the spectrograms shown
in this section, it appears that it could be a very effective technique. Since in the
majority of the TERC signals only the first two harmonics are apparent, the comb
technique could be simplified to only include two harmonics as well.
5.2 Conclusions
After reviewing and analyzing the results presented in the previous sections, there
are a number of important conclusions that can be drawn about the performance
of the TERC sensor and the contributions of this research. Included in this section
are these conclusions, as well as recommendations for future research based on the
findings from these results.
5.2.1 Contributions of Research
At the conclusion of this process, it is important to summarize the contributions and
deliverables of the research, both to define the ultimate framework of the research
and to lay the groundwork for future experiments.
Prior to this research, no experimentation had been performed to prove or char-
acterize the operation of the TERC sensor under experimental conditions. Though
it had been possible to run preliminary tests using a Network Analyzer, the require-
ment of using an extremely expensive and cumbersome piece of equipment for the
79

testing precluded this method as a complete test of its intended purpose.
Over the course of this research, a number of systems were designed and tested
that led to the final recordings of the TERC sensor. The first was the demod-
ulation system that provided analog audio signals from the TERC sensor during
speech. Though the system can certainly be improved for future experiments, its
development provided the ability to execute all of the other research presented in
this document.
The next deliverables were the sound generation and recording systems used
during the testing sessions. Although these systems are by no means complex,
subtle changes to the hardware and software can produce dramatic changes to the
recordings, as with the effects of the “spatial” SoundCard setting shown in Fig-
ure 5.6. When reproducing these systems for future experimentations, one should
be particularly aware of the cables used to connect the various pieces of equipment,
as even the simple switch from a mono to stereo cable will seriously affect the signal
quality.
The final deliverable was the data set collected during the testing, which is
known as the WPI Pilot Corpus and is contained in Appendix B. With roughly
two and a half hours of recordings for all three sensors, the WPI Pilot Corpus could
easily be used in extensions to this research with more signal processing-focused
applications.
Finally, the results and conclusions presented in this document provide both
a proof of concept for the TERC sensor’s operation and a characterization of its
performance, neither of which were previously available. These conclusions can be
used to modify the sensor and the testing procedures to improve the performance
80

of future evolutions of the TERC sensor.
5.2.2 Performance and Recommendations
An important conclusion, both in light of and in spite of the results presented in
Section 5.1, is that the initial prototype of the TERC sensor tested in these exper-
iments does actually function as intended. In each of the five noise environments,
with volunteer human subjects, the sensor produced an audible signal that is di-
rectly related to the signal produced by the resident microphone. It is necessary to
point out that regardless of any conclusions characterizing the level of performance
of the sensor, it does in fact perform its intended task.
The TERC sensor performs much as expected, recording a speech signal with
very little articulation but ample pitch information. In general, the sensor records
a strong signal component for the first two harmonics of speech. The strength of
these harmonics compared to the noise in the TERC signals would indicate that it
might be appropriate to use the sensor in voice activity detection applications. The
sensor functions correctly with subjects of both genders, though significant tuning
is required when switching between the two.
As opposed to initial assumptions, it is not clear that the TERC sensor is un-
affected by acoustic background noise. The SNR plots in Figure 5.10 indicate a
performance degradation as the SPL of the background noise increased. Though
the TERC sensor is certainly less acoustically-coupled than a microphone or the
PMIC, the expected conclusion that it is completely impervious to background
noise cannot be definitively made.
There is a significant amount of system noise in the TERC signal, which has a
81

tend to audibly mask the speech signal to a certain degree. Although the recordings
were intentionally made using the raw TERC signal with no signal processing, the
signals could easily be cleaned up significantly with simple filtering functions. In
addition, these filters could be added to the front-end circuitry of the system in
future designs to preclude the necessity of performing the function during post-
processing. It is important to note that while the sensor performs much as expected,
its performance could be greatly improved even without serious changes to the
system.
Limitations to the front-end circuitry of the sensor, including the lack of an
automatic resonance-tracking circuit and proper demodulation circuit, limit the
extent to which the TERC sensor itself can be characterized. In order to definitively
characterize the performance of the sensor without the interference of the limitations
defined in Section 4.4.4, significant modifications to the system would be necessary.
One simple modification to the sensor itself would be to redesign the sensor
on flex circuitry, which would eliminate most of the placement and comfort issues
defined in Section 4.4.4. The inclusion of a resonance-tracking circuit to the front-
end of the sensor would eliminate the need to tune the sensor for each subject and
between each recording session.
The sensor’s performance on a Network Analyzer indicates that the majority
of the focus for future research should be on the system circuitry rather than the
TERC sensor itself. Two excellent research opportunities would be to eliminate
the need for the WinRadio package in the demodulation system and to combine all
of the front-end and back-end circuitry into one portable battery-powered system.
This would facilitate in any future experimentation with the sensor, but would also
82

provide a large step towards the goal of commercializing the TERC sensor.
Although the TERC sensor in its current form could not realistically be used
outside of a laboratory setting, the results of the experimentation indicate that a
commercial application of the sensor is not outside the realm of possibility. The
results and conclusions of this research should be used as a starting point toward
that ultimate goal.
83

APPENDIX A
SPEECH INTELLIGIBILITY TESTS
A.1 Harvard Psychoacoustic Sentence Lists
Harvard Sentence List #1† Harvard Sentence List #2The birch canoe slid on the smooth planks The boy was there when the sun roseGlue the sheet to the dark blue background A rod is used to catch pink salmonIt’s easy to tell the depth of a well The source of the huge river is the clear springThese days a chicken leg is a rare disk Kick the ball straight and follow throughRice is often served in round bowls Help the woman get back to her feetThe juice of lemons makes fine punch A pot of tea helps to pass the eveningThe box was thrown beside the parked truck Smokey fires lack flame and heatThe hogs were fed chopped corn and garbage The soft cushion broke the man’s fallFour hours of steady work faced us The salt breeze came across from the seaA large size in stockings is hard to sell The girl at the booth sold fifty bonds
Harvard Sentence List #3 Harvard Sentence List #4The small pup gnawed a hole in the sock Hoist the load to your left shoulderThe fish twisted and turned on the bent hook Take the winding path to reach the lakePress the pants and sew a button on the vest Note closely the size of the gas tankThe swan dive was far short of perfect Wipe the grease off his dirty faceThe beauty of the view stunned the young boy Mend the coat before you go outTwo blue fish swam in the tank The wrist was badly strained and hung limpHer purse was full of useless trash The stray cat gave birth to kittensThe colt reared and threw the tall rider The young girl gave no clear responseIt snowed, rained, and hailed the same morning The meal was cooked before the bell rangRead verse out loud for pleasure What a joy there is in living
Harvard Sentence List #5 Harvard Sentence List #6A king ruled the state in the early days The frosty air passed through the coatThe ship was torn apart on the sharp reef The crooked maze failed to fool the mouseSickness kept him home the third week Adding fast leads to wrong sumsThe wide road shimmered in the hot sun The show was a flop from the very startThe lazy cow lay in the cool grass A saw is a tool used for making boardsLift the square stone over the fence The wagon moved on well oiled wheelsThe rope will bind the seven books at once March the soldiers past the next hillHop over the fence and plunge in A cup of sugar makes sweet fudgeThe friendly gang left the drug store Place a rosebush near the porch stepsMesh wire keeps chicks inside Both lost their lives in the raging storm
Harvard Sentence List #7 Harvard Sentence List #8We talked of the side show in the circus A yacht slid around the point into the bayUse a pencil to write the first draft The two met while playing on the sandHe ran half way to the hardware store The ink stain dried on the finished pageThe clock struck to mark the third period The walled town was seized without a fightA small creek cut across the field The lease ran out in sixteen weeksCars and busses stalled in snow drifts A tame squirrel makes a nice petThe set of china hit the floor with a crash The horn of the car woke the sleeping copThis is a grand season for hikes on the road The heart beat strongly and with firm strokesThe dune rose from the edge of the water The pearl was worn in a thin silver ringThose words were the cue for the ator to leave The fruit peel was cut in thick slices
†Harvard Sentence Lists provided courtesy of ARCON Corporation
84

Harvard Sentence List #9 Harvard Sentence List #10The navy attacked the big task force The slush lay deep along the streetSee the cat glaring at the scared mouse A wisp of cloud hung in the blue airThere are more than two factors here A pound of sugar costs more than eggsThe hat brim was wide and too droopy The fin was sharp and cut the clear waterThe lawyer tried to lose his case The play seems dull and quite stupidThe grass curled around the fence post Bail the boat to stop it from sinkingCut the pie into large parts The term ended in late june that yearMen strive but seldom get rich A tusk is used to make costly giftsAlways close the barn door tight Ten pins were set in orderHe lay prone and hardly moved a limb The bill was paid every third week
Harvard Sentence List #11 Harvard Sentence List #12Oak is strong and also gives shade The bark of the pine tree was shiny and darkCats and dogs each hate the other Leaves turn brown and yellow in the fallThe pipe began to rust while new The pennant waved when the wind blewOpen the crate but don’t break the glass Split the log with a quick, sharp blowAdd the sum to the product of these three Burn peat after the logs give outThieves who rob friends deserve jail He ordered peach pie with ice creamThe ripe taste of cheese improves with age Weave the carpet on the right hand sideAct on these orders with great speed Hemp is a week found in parts of the tropicsThe hog crawled under the high fence A lame back kept his score lowMove the vat over the hot fire We find joy in the simplest things
Harvard Sentence List #13 Harvard Sentence List #14Type out three lists of orders A cramp is no small danger on a swimThe harder he tried the less he got done He said the same phrase thirty timesThe boss ran the show with a watchful eye Pluck the bright rose without leavesThe cup cracked and spilled its contents Two plus seven is less than tenPaste can cleanse the most dirty brass The glow deepened in the eyes of the sweet girlThe slang word for raw whiskey is booze Bring your problems to the wise chiefIt caught ts hind paw in a rusty trap Write a fond note to the friend you cherishThe wharf could be seen at the farther shore Clothes and lodging are free to new menFeel the heat of the weak dying flame We frown when events take a bad turnThe tiny girl took off her hat Port is a strong wine with a smokey taste
Harvard Sentence List #15 Harvard Sentence List #16The young kid jumped the rusty gate The empty flask stood on the tin trayGuess the results from the first scores A speedy man can beat this track markA salt pickle tastes fine with ham He broke a new shoelace that dayThe just claim got the right verdict The coffee stand is too high for the couchThese thistles bend in a high wind The urge to write short stories is rarePure bred poodles have curls The pencils have all been usedThe tree top waved in a graceful way The pirates seized the crew of the lost shipThe spot on the blotter was made by green ink We tried to replace the coin but failedMud was spattered on the front of his white shirt She sewed the torn coat quite neatlyThe cigar burned a hole in the desk top The sofa cushion is red and of light weight
Harvard Sentence List #17 Harvard Sentence List #18The jacket hung on the back of the wide chair Steam hissed from the broken valveAt that high level the air is pure The child almost hurt the small dogDrop the two when you add the figures There was a sound of dry leaves outsideA filing case is now hard to buy The sky that morning was clear and bright blueAn abrupt start does not win the prize Torn scraps littered the stone floorWood is best for making toys and blocks Sunday is the best part of the weekThe office paint was a dull, sad tan The doctor cured him with these pillsHe knew the skill of the great young actress The new girl was fired today at noonA rag will soak up spilled water They felt gay when the ship arrived in portA shower of dirt fell from the hot pipes Add the store’s account to the last cent
85

Harvard Sentence List #19 Harvard Sentence List #20Acid burns holes in wool cloth The fruit of the fig tree is apple-shapedFairy tales should be fun to write Corn cobs can be used to kindle a fireEight miles of woodland burned to waste Where were they when the noise startedThe third act was dull and tired the players The paper box is full of thumb tacksA young child should not suffer fright Sell your gift to a buyer at a god gainAdd the column and put the sum here The tongs lay beside the ice pailWe admire and love a good cook The petals fall with the next puff of windThere the flood mark is ten inches Bring your best compass to the third classHe carved a head from the round block of marble They could laugh although they were sadShe has a smart way of wearing clothes Farmers came in to thresh the oat crop
Harvard Sentence List #21 Harvard Sentence List #22The brown house was on fire to the attic The cement had dried when he moved itThe lure is used to catch trout and flounder The loss of the second ship was hard to takeFloat the soap on top of the bath water The fly made its way along the wallA blue crane is a tall wading bird Do that with a wooden stickA fresh start will work such wonders Live wires should be kept coveredThe club rented the rink for the fifth night The large house had hot water tapsAfter the dance, they went straight home It is hard to erase blue or red inkThe hostess taught the new maid to serve Write at once or you may forget itHe wrote his last novel there at the inn The doorknob was made of bright clean brassEven the worst will beat his low score The wreck occurred by the bank on main street
Harvard Sentence List #23 Harvard Sentence List #24A pencil with black lead writes best Try to have the court decide the caseCoax a young calf to drink from a bucket They are pushed back each time they attackSchools for ladies teach charm and grace He broke his ties with groups of former friendsThe lamp shone with a steady green flame They floated on the raft to sun their white backsThey took the axe and the saw to the forest The map had an ’X’ that meant nothingThe ancient coin was quite dull and worn Whitings are small fish caught in netsThe shaky barn fell with a loud crash Some ads serve to cheat buyersJazz and swing fans like fast music Jerk the rope and the bell rings weeklyRake the rubbish up and then burn it A waxed floor makes us lose balanceSlash the gold cloth into fine ribbons Madam, this is the best brand of corn
Harvard Sentence List #25 Harvard Sentence List #26On the island the sea breeze is soft and mild Yell and clap as the curtain slides backThe play began as soon as we sat down They are men who walk the middle of the roadThis will lead the world to more sound and fury Both brothers wear the same sizeAdd salt before you fry the egg In some form or other we need funThe rush for funds reached its peak tuesday The prince ordered his head chopped offThe birch looked stark white and lonesome Theh ouses are built of red clay bricksThe box is held by a bright red snapper Ducks fly north but lack a compassTo make pure ice, you freeze water Fruit flavors are used in fizz drinksThe first worm gets snapped early These pills do less good than othersJump the fence and hurry up the bank Canned pears lack full flavor
Harvard Sentence List #27 Harvard Sentence List #28The dark pot hung in the front closet T he horse trotted around the field at a brisk paceCarry the pail to the wall and spill it there Find the twin who stole the pearl necklaceThe train brought our hero to the big town Cut the cord that binds the box tightlyWe are sure that one war is enough The red tape bound the smuggled foodGray paint stretched for miles around Look in the corner to find the tan shirtThe rude laugh filled the empty room The cold drizzle will halt the bond driveHigh seats are best for football fans Nine men were hired to dig the ruinsTea served from the brown jug is tasty The junk yard had a moldy smellA dash of pepper spoils beef stew The flint sputtered and lit a pine torchA zestful food is the hot-cross bun Soak the cloth and drown the sharp odor
86

Harvard Sentence List #29 Harvard Sentence List #30The shelves were bare of both jam or crackers The mute muffled the high tones of the hornA joy to every child is the swan boat The gold ring fits only a pierced earAll sat frozen and watched the screen The old pan was covered with hard fudgeA cloud of dust stung his tender eyes Watch the log float in the wide riverTo reach the end he needs much courage The node on the stalk of wheat grew dailyShape the clay gently into block form The heap of fallen leaves was set on fireA ridge on a smooth surface is a bump or flaw Write fast if you want to finish earlyHedge apples may stain your hands green His shirt was clean but one button was goneQuench your thirst, then eat the crackers The barrel of beer was a brew of malt and hopsTight curls get limp on rainy days Tin cans are absent from store shelves
Harvard Sentence List #31 Harvard Sentence List #32Slide the box into that empty space The store walls were lined with colored frocksThe plant grew large and green in the window The peace league met to discuss their plansThe beam dropped down on the workman’s head The rise to fame of a person takes luckPink clouds floated with the breeze Paper is scarce, so write with much careShe danced like a swan, tall and graceful The quick fox jumped on the sleeping catThe tube was blown and the tire flat and useless The nozzle of the fire hose was bright brassIt is late morning on the old wall clock Screw the round cap on as tight as neededLet’s all join as we sing the last chorus Time brings us many changesThe last switch cannot be turned off The purple tie was ten years oldThe fight will end in just six minutes Men think and plan and sometimes act
Harvard Sentence List #33 Harvard Sentence List #34Fill the ink jar with sticky glue Nine rows of soldiers stood in lineHe smokes a big pipe with strong contents The beach is dry and shallow at low tideWe need grain to keep our mules healthy The idea is to sew both edges straightPack the records in a neat thin case The kitten chased the dog down the streetThe crunch of feet in the snow was the only sound Pages bound in cloth make a bookThe copper bown shone in the sun’s rays Try to trace the fine lines of the paintingBoards will warp unless kept dry Women form less than half of the groupThe plush chair leaned against the wall The zones merge in the central part of townGlass will clink when struck by metal A gem in the rough needs work to polishBathe and relax in the cool green grass Code is used when secrets are sent
Harvard Sentence List #35 Harvard Sentence List #36Most of the news is easy for us to hear Pour the stew from the pot into the plateHe used the lathe to make brass objects Each penny shone like newThe vane on top of the pole revolved in the wind The man went to the woods to gather sticksMince pie is a dish served to children The dirt piles were lines along the roadThe clan gathered on each dull night The logs fell and tumbled into the clear streamLet it burn, it gives us warmth and comfort Just hoist it up and take it awayA castle build from sand fails to endure A ripe plum is fit for a king’s palateA child’s wit saved the day for us Our plans right now are hazyTack the strip of carpet to the worn floor Brass rings are sold by these nativesNext tuesday we must vote It takes a good trap to capture a bear
Harvard Sentence List #37 Harvard Sentence List #38Feed the white mouse some flower seeds It takes a lot of help to finish theseThe thaw came early and freed the stream Mark the spot with a sign painted redHe took the lead and kept it the whole distance Take two shares as a fair profitThe key you designed will fit the lock The fur of cats goes by many namesPlead to the council to free the poor thief North winds bring colds and feversBetter hash is made of rare beef He asks no person to vouch for himThis plank was made for walking on Go now and come here laterThe lake sparkled in the red hot sun A sash of gold silk will trim her dressHe crawled with care along the ledge Soap can wash most dirt awayTend the sheep while the dog wanders That move means the game is over
87

Harvard Sentence List #39 Harvard Sentence List #40He wrote down a long list of items Heave the line over the port sideA siege will crack the strong defense A lathe cuts and trims any woodGrape juice and water mix well It’s a dense crowd in two distinct waysRoads are paved with sticky tar His hip struck the knee of the next playerFake stones shine but cost little The stale smell of old beer lingersThe drip of the rain made a pleasant sound The desk was firm on the shaky floorSmoke poured out of every crack It takes heat to bring out the odorServe the hot rum to the tired heroes Beef is scarcer than some lambMuch of the story makes good sense Raise the sail and steer the ship northwardThe sun came up to light the eastern sky A cone costs five cents on mondays
Harvard Sentence List #41 Harvard Sentence List #42A pod is what peas always grow in Nudge gently but wake her nowJerk the dart from the cork target The news struck doubt in the restless mindsNo cement will hold hard wood Once we stood beside the shoreWe now have a new base for shipping A chink in the wall allowed a draft to blowA list of names is carved around the base Fasten two pins on each sideThe sheep were led home by a dog A cold dip restores health and zestThree for a dime, the young peddler cried He takes the oath of office each marchThe sense of smell is better than that of touch The sand drifts over the sill of the old houseNo hardship seemed to keep him sad The point of the steel pen was bent and twistedGrace makes up for lack of beauty There is a lag between thought and act
Harvard Sentence List #43 Harvard Sentence List #44Seed is needed to plant the spring corn This horse will nose his way to the finishDraw the chart with heavy black lines The dry wax protects the deep scratchThe boy owed his pal thirty cents He picked up the dice for a second rollThe chap slipped into the crowd and was lost These coins will be needed to pay his debtHats are worn to tea and not to dinner The nag pulled the frail cart alongThe ramp led up to the wide highway Twist the valve and release hot steamBeat the dust from the rug onto the lawn The vamp of the shoe had a gold buckleSay it slowly but make it ring clear The smell of burned rags itches my noseThe straw nest housed five robins New pants lack cuffs and pocketsScreen the porch with woven straw mats The marsh will freeze when cold enough
Harvard Sentence List #45 Harvard Sentence List #46They slice the sausage thin with a knife A clean neck means a neat collarThe bloom of the rose lasts a few days The couch cover and hall drapes were blueA gray mare walked before the colt The stems of the tall glasses cracked and brokeBreakfast buns are fine with a hot drink The wall phone rang loud and oftenBottles hold four kinds of rum The clothes dried on a thin wooden rackThe man wore a feather in his felt hat Turn on the lantern which gives us lightHe wheeled the bike past the winding road The cleat sank deeply into the soft turfDrop the ashes on the worn old rug The bills were mailed promptly on the tenth of the monthThe desk and both chairs were painted tan To have is better than to wait and hopeThrow out the used paper cup and plate The prices is fair for a good antique clock
Harvard Sentence List #47 Harvard Sentence List #48The music played on while they talked The kite flew wildly in the high windDispense with a vest on a day like this A fur muff is stylish once moreThe bunch of grapes was pressed into wine The tin box held priceless stonesHe sent the figs, but kept the ripe cherries We need an end of all such matterThe hinge on the door creaked with old age The case was puzzling to the old and wiseThe screen before the fire kept in the sparks The bright lanterns were gay on the dark lawnFly by night, and you waste little time We don’t get much money but we have funThick glasses helped him read the print The youth drove with zest, but little skillBirth and death mark the limits of life Five years he lived with a shaggy dogThe chair looked strong but had no bottom A fence cuts throug[h] the corner lot
88

Harvard Sentence List #49 Harvard Sentence List #50The way to save money is not to spend much A man in a blue sweater sat at the deskShut the hatch before the waves push it in Oats are a food eaten by horse and manThe odor of spring makes young hearts jump Their eyelids droop for want of sleepCrack the walnut with your sharp side teeth A sip of tea revives his tired friendHe offered proof in the form of a large chart There are many ways to do these thingsSend the stuff in a thick paper bag Tuck the sheet under the edge of the matA quart of milk is water for the most part A force equal to that would move the earthThey told wild tales to frighten him We like to see clear weatherThe three story house was built of stone The work of the tailor is seen on each sideIn the rear of the ground floor was a large passage Take a chance and win a china doll
Harvard Sentence List #51 Harvard Sentence List #52Shake the dust from your shoes, stranger The little tales they tell are falseShe was kind to sick old people The door was barred, locked, and bolted as wellThe square wooden crate was packed to be shipped Ripe pears are fit for a queen’s tableThe dusty bench stood by the stone wall A big wet stain was on the round carpetWe dress to suit the weather of most days The kite dipped and swayed, but stayed aloftSmile when you say nasty words The pleasant hours fly by much too soonA bowl of rice is free with chicken stew The room was crowded with a wild mobThe water in this well is a source of good health This strong arm shall shield your honorTake shelter in this tent, but keep still She blushed when he gave her a white orchidThat guy is the writer of a few banned books The beetle droned in the hot June sun
Harvard Sentence List #53 Harvard Sentence List #54Press the pedal with your left foot Hurdle the pit with the aid of a long poleNeat plans fail without luck A strong bid may scare your partner stiffThe black trunk fell from the landing Even a just cause needs power to winThe bank pressed for payment of the debt Peep under the tent and see the clownsThe theft of the pearl pin was kept secret The leaf drifts along with a slow spinShake hands with this friendly child Cheap clothes are flashy but don’t lastThe vast space stretched into the far distance A thing of small note can cause d[e]spairA rich farm is rare in this sandy waste Flood the mails with requests for this bookHis wide grin earned many friends A thick coat of black paint covered allFlax makes a fine brand of paper The pencil was cut to be sharp at both ends
Harvard Sentence List #55 Harvard Sentence List #56Those last words were a strong statement The small red neon lamp went outHe wrote his name boldly at the top of the sheet Clams are small, round, soft, and tastyDill pickles are sour but taste fine The fan whirled its round blades softlyDown that road is the way to the grain farmer The line where the edges join was cleanEither mud or dust are found at all times Breathe deep and smell the piny airThe best method is to fix it in place with clips It matters not if he reads these words or thoseIf you mumble your speech will be lost A brown leather bag hung from its strapAt night the alarm roused him from a deep sleep A toad and a frog are hard to tell apartRead just what the meter says A white silk jacket goes with any shoesFill your pack with bright trinkets for the poor A break in the dam almost caused a flood
Harvard Sentence List #57 Harvard Sentence List #58Paint the socket in the wall dull green It is a band of steel three inches wideThe child crawled into the dense grass The pipe ran almost the length of the ditchBribes fail where honest men work It was hidden from sight by a mass of leaves and shrubsTrample the spark, else the flames will spread The weight of the package was seen on the high scaleThe hilt of the sword was carved with fine designs Wake and rise, and step into the green outdoorsA round hole was drilled through the thin board The green light in the brown box flickeredFootprints showed the path he took up the beach The brass tube circled the high wallShe was waiting at my front lawn The lobes of her ears were pierced to hold ringsA vent near the edge brought in fresh air Hold the hammer near the end to drive the nailProd the old mule with a crooked stick Next Sunday is the twelfth of the month
89

Harvard Sentence List #59 Harvard Sentence List #60Every word and phrase he speaks is true Stop whistling and watch the boys marchHe put his last cartridge into the gun and fired Jerk the cord, and out tumbles the goldThey took their kids from the public school Slide the tray across the glass topDrive the screw straight into the wood The cloud moved in a stately way and was goneKeep the hatch tight and the watch constant Light maple makes for a swell roomSever the twine with a quick snip of the knife Set the piece here and say nothingPaper will dry out when wet Dull stories make her laughSlide the catch back and open the desk A stiff cord will do to fasten your shoeHelp the weak to preserve their strength Get the trust fund to the bank earlyA sullen smile gets few friends Choose between the high road and the low
Harvard Sentence List #61 Harvard Sentence List #62A plea for funds seems to come again The ram scared the school children offHe lent his coat to the tall gaunt stranger The team with the best timing looks goodThere is a strong chance it will happen once more The farmer swapped his horse for a brown oxThe duke left the park in a silver coach Sit on the perch and tell the others what to doGreet the new guests and leave quickly A steep trail is painful for our feetWhen the frost has come it is time for turkey The early phase of life moves fastSweet words work better than fierce Green moss grows on the northern sideA thin stripe runs down the middle Tea in thin china has a sweet tasteA six comes up more often than a ten Pitch the straw through the door of the stableLush fern grow on the lofty rocks The latch on the back gate needed a nail
Harvard Sentence List #63 Harvard Sentence List #64The goose was brought straight from the old market Tear a thin sheet from the yellow padThe sink is the thing in which we pile dishes A cruise in warm waters in a sleek yacht is funA whiff of it wil cure the most stubborn cold A streak of color ran down the left edgeThe facts don’t always show who is right It was done before the boy could see itShe flaps her cape as she parades down the street Crouch before you jump or miss the markThe loss of the cruiser was a blow to the fleet Pack the kits and don’t forget the saltLoop the braid to the left and then over The square peg will settle in the round holePlead with the lawyer to drop the lost cause Fine soap saves tender skinCalves thrive on tender spring grass Poached eggs and tea must sufficePost no bills on this office wall Bad nerves are jangled by a door slam
Harvard Sentence List #65 Harvard Sentence List #66Ship maps are different from those for planes The rarest spice comes from the far eastDimes showered down from all sides The roof should be tilted at a sharp slantThey sang the same tunes at each party A smatter of french is worse than noneThe sky in the West is tinged with orange red The mule trod the treadmill day and nightThe pods of peas ferment in bare fields The aim of the contest is to raise a great fundThe horse balked and threw the tall rider To send it now in large amounts is badThe hitch between the horse and cart broke There is a fine hard tang in salty airPile the coal high in the shed corner Cod is the main business of the North shoreA gold vase is both rare and costly The slab was hewn from heavy blocks of slateThe knife was hung inside its bright sheath Dunk the stale biscuit into strong drink
Harvard Sentence List #67 Harvard Sentence List #68Hang tinsel from both branches Dots of light betrayed the black catCap the jar with a tight brass cover Put the chart on the mantel and tack it downThe poor boy missed the boat again The night shift men rate extra payBe sure to set the lamp firmly in the hole The red paper brightened the dim stagePick a card and slip it under the pack See the player scoot to third baseA round mat will cover the dull spot Slide the bill between the two leavesThe first part of the plan needs changing Many hands help get the job doneA good book informs of what we ought to know We don’t like to admit our small faultsThe mail comes in three batches per day No doubt about the way the wind blowsYou cannot brew tea in a cold pot Dig deep in the earth for pirate’s gold
90

Harvard Sentence List #69 Harvard Sentence List #70The steady drip is worse than a drenching rain The store was jammed before the sale could startA flat pack takes less luggage space It was a bad error on the part of the new judgeGreen ice frosted the punch bowl One step more and the board will collapseA stuffed chair slipped from the moving van Take the match and strike it against your shoeThe stitch will serve but needs to be shortened The pot boiled, but the contents failed to jellA thin book fits in the side pocket The baby puts his right foot in his mouthThe gloss on top made it unfit to read The bombs left most of the town in ruinsThe hail pattered on the burnt brown grass Stop and stare at the hard working manSeven seals were stamped on great sheets The streets are narrow and full of sharp turnsOur troops are set to strike heavy blows The pup jerked the leash as he saw a feline shape
Harvard Sentence List #71 Harvard Sentence List #72Open your book to the first page A gold ring will please most any girlFish evade the net and swim off The long journey home took a yearDip the pail once and let it settle She saw a cat in the neighbor’s houseWill you please answer the phone A pink shell was found on the sandy beachThe big red apple fell to the ground Small children came to see himThe curtain rose and the show was on The grass and bushes were wet with dewThe young prince became heir to the throne The blind man counted his old coinsHe sent the boy on a short errand A severe storm tore down the barnLeave now and you will arrive on time She called his name many timesThe corner store was robbed last night When you hear the bell, come quickly
91

A.2 Diagnostic Rhyme Test Stimulus Words
Table A.1: DRT Stimulus Words
Voicing Nasality SustensionVeal Feel Meat Beat Vee BeeBean Peen Need Deed Sheet CheatGin Chin Mitt Bit Vill Bill
Dint Tint Nip Dip Thick TickZoo Sue Moot Boot Foo Pooh
Dune Tune News Dues Shoes ChooseVole Foal Moan Bone Those DozeGoat Coat Note Dote Though DoughZed Said Mend Bend Then Den
Dense Tense Neck Deck Fence PenceVast Fast Mad Bad Than DanGaff Calf Nab Dab Shad Chad
Vault Fault Moss Boss Thong TongDaunt Taunt Gnaw Daw Shaw Chaw
Jock Chock Mom Bomb Von BonBond Pond Knock Dock Vox Box
Sibilation Graveness CompactnessZee Thee Weed Reed Yield Wield
Cheep Keep Peak Teak Key TeaJilt Gilt Bid Did Hit Fit
Sing Thing Fin Thin Gill DillJuice Goose Moon Noon Coop PoopChew Coo Pool Tool You Rue
Joe Go Bowl Dole Ghost BoastSole Thole Fore Thor Show SoJest Guest Met Net Keg Peg
Chair Care Pent Tent Yen WrenJab Gab Bank Dank Gat Bat
Sank Thank Fad Thad Shag SagJaws Gauze Fought Thought Yawl WallSaw Thaw Bong Dong Caught ThoughtJot Got Wad Rod Hop Fop
Chop Cop Pot Tot Got Dot
92

A.3 Phonetically Balanced (PB-50) Word Lists
Table A.2: PB-50 Word Lists
PB-50 List #11. are 11. death 21. fuss 31. not 41. rub2. bad 12. deed 22. grove 32. pan 42. slip3. bar 13. dike 23. heap 33. pants 43. smile4. bask 14. dish 24. hid 34. pest 44. strife5. box 15. end 25. hive 35. pile 45. such6. cane 16. feast 26. hunt 36. plush 46. then7. cleanse 17. fern 27. is 37. rag 47. there8. clove 18. folk 28. mange 38. rat 48. toe9. crash 19. ford 29. no 39. ride 49. use
10. creed 20. fraud 30. nook 40. rise 50. wheatPB-50 List #21. awe 11. dab 21. hock 31. perk 41. start2. bait 12. earl 22. job 32. pick 42. suck3. bean 13. else 23. log 33. pit 43. tan4. blush 14. fate 24. moose 34. quart 44. tang5. bought 15. five 25. mute 35. rap 45. them6. bounce 16. frog 26. nab 36. rib 46. trash7. bud 17. gill 27. need 37. scythe 47. vamp8. charge 18. gloss 28. niece 38. shoe 48. vast9. cloud 19. hire 29. nut 39. sludge 49. ways
10. corpse 20. hit 30. our 40. snuff 50. wishPB-50 List #31. ache 11. crime 21. hurl 31. please 41. take2. air 12. deck 22. jam 32. pulse 42. thrash3. bald 13. dig 23. law 33. rate 43. toil4. barb 14. dill 24. leave 34. rouse 44. trip5. bead 15. drop 25. lush 35. shout 45. turf6. cape 16. fame 26. muck 36. sit 46. vow7. cast 17. far 27. neck 37. size 47. wedge8. check 18. fig 28. nest 38. sob 48. wharf9. class 19. flish 29. oak 39. sped 49. who
10. crave 20. gnaw 30. path 40. stag 60. whyPB-50 List #41. bath 11. dodge 21. hot 31. pert 41. shed2. beast 12. dupe 22. how 32. pinch 42. shin3. bee 13. earn 23. kite 33. pod 43. sketch
93

Table A.2: (continued)
cont.4. blonde 14. eel 24. merge 34. race 44. slap5. budge 15. fin 25. move 35. rack 45. sour6. bus 16. float 26. neat 36. rave 46. starve7. bush 17. frown 27. new 37. raw 47. strap8. cloak 18. hatch 28. oils 38. rut 48. test9. course 19. heed 29. or 39. sage 49. tick
10. court 20. hiss 30. peck 40. scab 50. touchPB-50 List #51. add 11. flap 21. love 31. rind 41. thud2. bathe 12. gape 22. mast 32. rode 42. trade3. beck 13. good 23. nose 33. roe 43. true4. black 14. greek 24. odds 34. scare 44. tug5. bronze 15. grudge 25. owls 35. shine 45. vase6. browse 16. high 26. pass 36. shove 46. watch7. cheat 17. hill 27. pipe 37. sick 47. wink8. choose 18. inch 28. puff 38. sly 48. wrath9. curse 19. kid 29. punt 39. solve 49. yawn
10. feed 20. lend 30. rear 40. thick 50. zonePB-50 List #61. as 11. deep 21. gap 31. prig 41. shank2. badge 12. eat 22. grope 32. prime 42. slouch3. best 13. eyes 23. hitch 33. pun 43. sup4. bog 14. fall 24. hull 34. pus 44. thigh5. chart 15. fee 25. jag 35. raise 45. thus6. cloth 16. flick 26. kept 36. ray 46. tongue7. clothes 17. clop 27. leg 37. reap 47. wait8. cob 18. forge 28. mash 38. rooms 48. wasp9. crib 19. fowl 29. nigh 39. rough 49. wife
10. dad 20. gage 30. ode 40. scan 50. writPB-50 List #71. act 11. dope 21. jug 31. pounce 41. siege2. aim 12. dose 22. knit 32. quiz 42. sin3. am 13. dwarf 23. mote 33. raid 43. sledge4. but 14. fake 24. mud 34. range 44. sniff5. by 15. fling 25. nine 35. rash 45. south6. chop 16. fort 26. off 36. rich 46. though7. coast 17. gasp 27. pent 37. roar 47. whiff8. comes 18. grade 28. phase 38. sag 48. wire9. cook 19. gun 29. pig 39. scout 49. woe
94
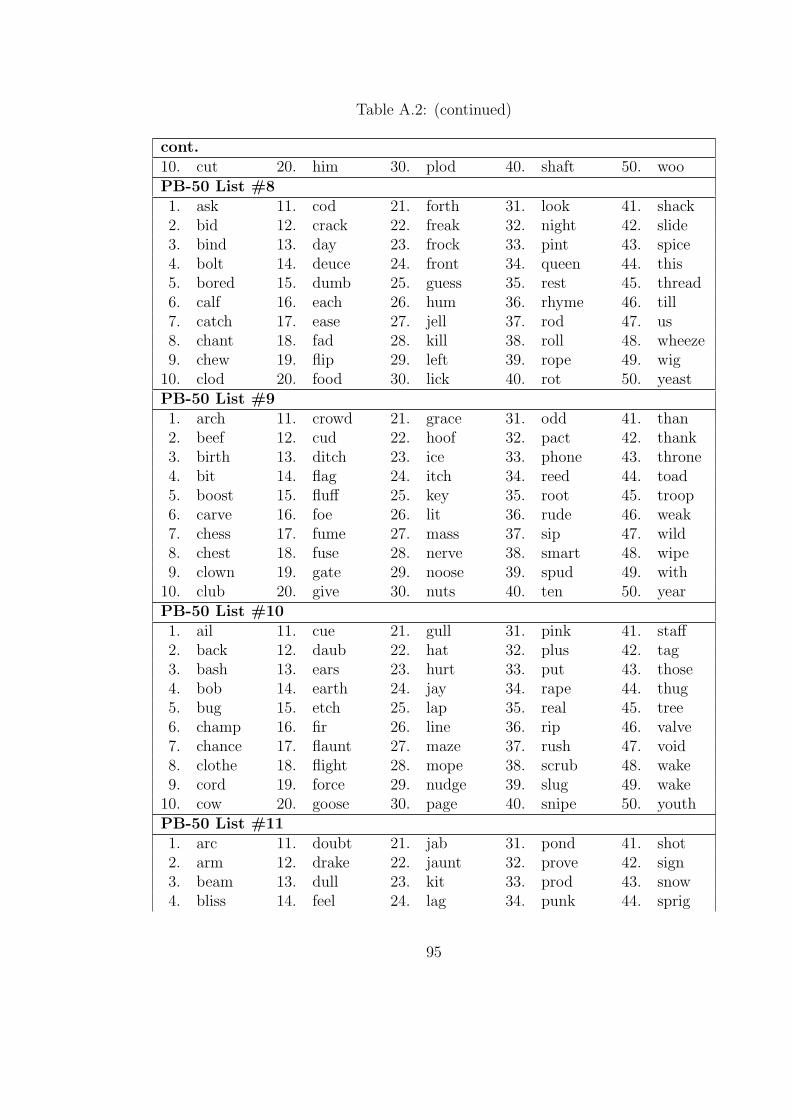
Table A.2: (continued)
cont.10. cut 20. him 30. plod 40. shaft 50. wooPB-50 List #81. ask 11. cod 21. forth 31. look 41. shack2. bid 12. crack 22. freak 32. night 42. slide3. bind 13. day 23. frock 33. pint 43. spice4. bolt 14. deuce 24. front 34. queen 44. this5. bored 15. dumb 25. guess 35. rest 45. thread6. calf 16. each 26. hum 36. rhyme 46. till7. catch 17. ease 27. jell 37. rod 47. us8. chant 18. fad 28. kill 38. roll 48. wheeze9. chew 19. flip 29. left 39. rope 49. wig
10. clod 20. food 30. lick 40. rot 50. yeastPB-50 List #91. arch 11. crowd 21. grace 31. odd 41. than2. beef 12. cud 22. hoof 32. pact 42. thank3. birth 13. ditch 23. ice 33. phone 43. throne4. bit 14. flag 24. itch 34. reed 44. toad5. boost 15. fluff 25. key 35. root 45. troop6. carve 16. foe 26. lit 36. rude 46. weak7. chess 17. fume 27. mass 37. sip 47. wild8. chest 18. fuse 28. nerve 38. smart 48. wipe9. clown 19. gate 29. noose 39. spud 49. with
10. club 20. give 30. nuts 40. ten 50. yearPB-50 List #101. ail 11. cue 21. gull 31. pink 41. staff2. back 12. daub 22. hat 32. plus 42. tag3. bash 13. ears 23. hurt 33. put 43. those4. bob 14. earth 24. jay 34. rape 44. thug5. bug 15. etch 25. lap 35. real 45. tree6. champ 16. fir 26. line 36. rip 46. valve7. chance 17. flaunt 27. maze 37. rush 47. void8. clothe 18. flight 28. mope 38. scrub 48. wake9. cord 19. force 29. nudge 39. slug 49. wake
10. cow 20. goose 30. page 40. snipe 50. youthPB-50 List #111. arc 11. doubt 21. jab 31. pond 41. shot2. arm 12. drake 22. jaunt 32. prove 42. sign3. beam 13. dull 23. kit 33. prod 43. snow4. bliss 14. feel 24. lag 34. punk 44. sprig
95

Table A.2: (continued)
cont.5. chunk 15. fine 25. latch 35. purse 45. spy6. clash 16. frisk 26. loss 36. reef 46. stiff7. code 17. fudge 27. low 37. rice 47. tab8. crutch 18. goat 28. most 38. risk 48. urge9. cry 19. have 29. mouth 39. sap 49. wave
10. dip 20. hog 30. net 40. shop 50. woodPB-50 List #121. and 11. cling 21. frill 31. lash 41. rove2. ass 12. clutch 22. gnash 32. laugh 42. set3. ball 13. depth 23. greet 33. ledge 43. shut4. bluff 14. dime 24. hear 34. loose 44. sky5. cad 15. done 25. hug 35. out 45. sod6. cave 16. fed 26. hunch 36. park 46. throb7. chafe 17. flog 27. jaw 37. priest 47. tile8. chair 18. flood 28. jazz 38. reek 48. vine9. chap 19. foot 29. jolt 39. ripe 49. wage
10. chink 20. fought 30. knife 40. romp 50. wovePB-50 List #131. bat 11. few 21. jig 31. nip 41. sled2. beau 12. fill 22. made 32. ought 42. smash3. change 13. fold 23. mood 33. owe 43. smooth4. climb 14. for 24. mop 34. patch 44. soap5. corn 15. gem 25. moth 35. pelt 45. stead6. curb 16. grape 26. muff 36. plead 46. taint7. deaf 17. grave 27. mush 37. price 47. tap8. dog 18. hack 28. my 38. pug 48. thin9. elk 19. hate 29. nag 39. scuff 49. tip
10. elm 20. hook 30. nice 40. side 50. weanPB-50 List #141. at 11. dead 21. isle 31. prude 41. stuff2. barn 12. douse 22. kick 32. purge 42. tell3. bust 13. dung 23. lathe 33. quack 43. tent4. car 14. fife 24. life 34. rid 44. thy5. clip 15. foam 25. me 35. shook 45. tray6. coax 16. grate 26. muss 36. shrug 46. vague7. curve 17. group 27. news 37. sing 47. vote8. cute 18. heat 28. nick 38. slab 48. wag9. darn 19. howl 29. nod 39. smite 49. waif
96

Table A.2: (continued)
cont.10. dash 20. hunk 30. oft 40. soil 50. wristPB-50 List #151. bell 11. fact 21. less 31. pup 41. teach2. blind 12. flame 22. may 32. quick 42. that3. boss 13. fleet 23. mesh 33. scow 43. time4. cheap 14. gash 24. mitt 34. sense 44. tinge5. cost 15. glove 25. mode 35. shade 45. tweed6. cuff 16. golf 26. morn 36. shrub 46. vile7. dive 17. hedge 27. naught 37. sir 47. weave8. dove 18. hole 28. ninth 38. slash 48. wed9. edge 19. jade 29. oath 39. so 49. wide
10. elf 20. kiss 30. own 40. tack 50. wreckPB-50 List #161. aid 11. droop 21. kind 31. pump 41. stress2. barge 12. dub 22. knee 32. rock 42. suit3. book 13. fifth 23. lay 33. rogue 43. thou4. cheese 14. fright 24. leash 34. rug 44. three5. cliff 15. gab 25. louse 35. rye 45. thresh6. closed 16. gas 26. map 36. sang 46. tire7. crews 17. had 27. nap 37. sheep 47. ton8. dame 18. hash 28. next 38. sheik 48. tuck9. din 19. hose 29. part 39. soar 49. turn
10. drape 20. ink 30. pitch 40. stab 50. wieldPB-50 List #171. all 11. crush 21. hence 31. past 41. sell2. apt 12. dart 22. hood 32. pearl 42. ship3. bet 13. dine 23. if 33. peg 43. shock4. big 14. falls 24. last 34. plow 44. stride5. booth 15. feet 25. ma 35. press 45. tube6. brace 16. fell 26. mist 36. rage 46. vice7. braid 17. fit 27. myth 37. reach 47. weep8. buck 18. form 28. ox 38. ridge 48. weird9. case 19. fresh 29. paid 39. roam 49. wine
10. clew 20. gum 30. pare 40. scratch 50. youPB-50 List #181. aims 11. chip 21. flare 31. hush 41. sack2. art 12. claw 22. fool 32. lime 42. sash3. axe 13. claws 23. freeze 33. lip 43. share4. bale 14. crab 24. got 34. loud 44. sieve
97

Table A.2: (continued)
cont.5. bless 15. cub 25. grab 35. lunge 45. thaw6. camp 16. debt 26. gray 36. lynch 46. thine7. cat 17. dice 27. grew 37. note 47. thorn8. chaff 18. dot 28. gush 38. ouch 48. trod9. chain 19. fade 29. hide 39. rob 49. waste
10. chill 20. fat 30. his 40. rose 50. weed
A.4 Sustained Vowel Word Lists
Table A.3: Vowel Word Lists
Vowel Word List #1 Vowel Word List #2 Vowel Word List #3
Hut Cup LuckHat Cat BlackHurt Turn LearnHit Fit Sit
Heat See FeetHot Pot RockHore Call FourHood Put CouldHive Five EyeHow Now OutHome Go TomeHair Where AirHere Near PearHoy Boy Join
98

APPENDIX B
WPI PILOT CORPUS
The complete WPI Pilot Corpus is included
on DVD in the hard copies of this document
Those in possession of an electronic copy
with questions about the Corpus may direct
them to [email protected]
99

BIBLIOGRAPHY
[BK03] J. Beh and H. Ko. A novel spectral subtraction scheme for robust speechrecognition: Spectral subtraction using spectral harmonics of speech.In Proceedings of the ICASSP, volume 1, pages I648–I651, Philadelphia,PA, April 2003.
[BLP+02] D.R. Brown III, R. Ludwig, A. Pelteku, G. Bogdanov, and K.Keenaghan. A novel non-acoustic voiced speech sensor. Submittedto the Journal of Measurement Science and Technology, June 2002.
[Bur99] G. Burnett. The Physiological Basis of Glottal Electromagnetic Mi-cropower Sensors (GEMS) and Their Use in Defining an ExcitationFunction for the Human Vocal Tract. PhD thesis, University of Cali-fornia, Davis, 1999.
[CO96] S.-M. Chi and Y.-H. Oh. Lombard effect compensation and noise sup-pression for noisy Lombard speech recognition. In Proceedings of theICSLP, volume 4, pages 2013–2016, Philadelphia, PA, October 1996.
[Cou01] L.W. Couch II. Digital and Analog Communication Systems. PrenticeHall, Inc., New Jersey, 6th edition, 2001.
[DP93] P.B. Denes and E.N. Pinson. The Speech Chain - The Physics andBiology of Spoken Language. W.H. Freedman and Co., New York, 2ndedition, November 1993.
[Edi00] Editors of The American Heritage Dictionaries, editor. The AmericanHeritage Dictionary of the English Language. Houghton Mifflin Com-pany, Boston, 4th edition, January 2000.
[Ega48] J.P. Egan. Articulation testing methods. Laryngoscope, 58:955–991,1948.
[Fai58] G. Fairbanks. Test of phonemic differentiation: The rhyme test. TheJournal of the Acoustical Society of America, 30(7):596–600, July 1958.
[Fan02] J. Faneuff. Spatial, spectral, and perceptual nonlinear noise reductionfor hands-free microphones in a car. Master’s thesis, Worcester Poly-technic Institute, July 2002.
[Far40] D.W. Farnsworth. High-speed motion pictures of the human vocalcords. Bell Lab Record, 18(7):203–208, 1940.
[FJ67] B. Frøkjær-Jensen. A photo-electric glottograph. Annual Report of theInstitute of Phonetics of the University of Copenhagen, 4:5–19, 1967.
100

[Fry79] D.B. Fry. The Physics of Speech. Cambridge University Press, Cam-bridge, April 1979.
[Gar55] M. Garcia. Observations on the human voice. Proceedings of the RoyalSociety, London, 7:399–410, 1854-1855.
[Hes83] W. Hess. Pitch Determination of Speech Signals - Algorithms and De-vices. Springer-Verlag, Berlin, Heidelberg, April 1983.
[Hoo97] P. Hoole. Techniques for investigating laryngeal articulation and thevoice-source. Forschungsberichte des Instituts fur Phonetik und Sprach-liche Kommunikation der Universitat Munchen, 35:101–106, 1997.
[HWHK65] A.S. House, C.E. Williams, M. Hecker, and K.D. Kryter. Articulation-testing methods: Consonantal differentiation with a closed-responseset. The Journal of the Acoustical Society of America, 37(1):158–166,January 1965.
[Jek93] U. Jekosch. Speech quality assessment and evaluation. In Proceedingsof the European Conference on Speech Communication and Technology,pages 1387–1394, 1993.
[Jun93] J.C. Junqua. The Lombard reflex and its role on human listeners andautomatic speech recognizers. The Journal of the Acoustical Society ofAmerica, 93(1):510–524, 1993.
[Lem99] S. Lemmetty. Review of speech synthesis technology. Master’s thesis,Helsinki University of Technology, March 1999.
[LM87] H. Liang and N. Malik. Reducing cocktail party noise by adaptivearray filtering. In Proceedings of the ICASSP, volume 12, pages 185–188, April 1987.
[Mar82] P. Martin. Comparison of pitch detection by cepstrum and spectralcomb analysis. In Proceedings of the ICASSP, volume 7, pages 180–183, May 1982.
[Pel04] A. Pelteku. Development of an electromagnetic glottal waveform sensorfor applications in high acoustic noise environments. Master’s thesis,Worcester Polytechnic Institute, February 2004.
[PNG85] D.B. Pisoni, H.C. Nusbaum, and B.G. Greene. Perception of syntheticspech generated by rule. Proceedings of the IEEE, 73(11):1665–1676,November 1985.
101

[RGR97] C. Rosse and P. Gaddum-Rosse. Hollinshead’s Textbook of Anatomy.Lippincott-Raven Publishers, Philadelphia, New York, 5th edition,March 1997.
[Sca98] M. Scanlon. Acoustic sensor for health status monitoring. In Proceed-ings of IRIS Acoustic and Seismic Sensing, volume 2, pages 205–22,1998.
[Sch68] M.R. Schroeder. Period histogram and product spectrum: New meth-ods for fundamental frequency measurement. Journal of the AcousticalSociety of America, 43:829–834, 1968.
[SH68] M. Sawashima and H. Hirose. New laryngoscopic technique by use offiber optics. Journal of the Acoustical Society of America, 43(1):168–169, 1968.
[Son60] B. Sonesson. On the anatomy and vibratory pattern of the human vocalfolds. Acta Oto-Laryngologica, Supplement, 156:1–80, 1960.
[Son75] M.M. Sondhi. Measurement of the glottal waveform. Journal of theAcoustical Society of America, 57:228–232, 1975.
[SR79] T.V. Sreenivas and P.V.S. Rao. Pitch extraction from corrupted har-monics of the power spectrum. Journal of the Acoustical Society ofAmerica, 65:223–228, 1979.
[VCM65] W.D. Voiers, M.F. Cohen, and J. Mickunas. Evaluation of speech pro-cessing devices, i. intelligibility, quality, speaker recognizability. FinalReport, Contract No. AF19(628)4195, OAS, 1965.
[Voi77] W.D. Voiers. Articulation testing methods. Benchmark Papers inAcoustics, 11:374–387, 1977.
[Wen91] C. Wenzel. Low frequency circulator/isolator uses no ferrite or magnet.1991 RF design awards contest, Wenzel Associates, Inc., 1991.
[YS02] J. Yamauchi and T. Shimamura. Noise estimation using high frequencyregions for speech enhancement in low snr environments. In IEEEWorkshop Proceedings, Speech Coding, pages 59–61, October 2002.
102

This document was typeset by the author with the LATEX2ε Documentation System.


